Embed Size (px)
Citation preview

TrueSkill 2: An improved Bayesian skill rating system
Tom MinkaMicrosoft Research
Ryan ClevenThe Coalition
Yordan ZaykovMicrosoft Research
March 22, 2018
Abstract
Online multiplayer games, such as Gears of War and Halo, use skill-based matchmakingto give players fair and enjoyable matches. They depend on a skill rating system to inferaccurate player skills from historical data. TrueSkill is a popular and effective skill ratingsystem, working from only the winner and loser of each game. This paper presents anextension to TrueSkill that incorporates additional information that is readily available inonline shooters, such as player experience, membership in a squad, the number of kills aplayer scored, tendency to quit, and skill in other game modes. This extension, which wecall TrueSkill2, is shown to significantly improve the accuracy of skill ratings computedfrom Halo 5 matches. TrueSkill2 predicts historical match outcomes with 68% accuracy,compared to 52% accuracy for TrueSkill.
1 Introduction
When a player wants to play an online multiplayer game, such as Halo or Gears of War, theyjoin a queue of waiting players, and a matchmaking service decides who they will play with. Thematchmaking service makes its decision based on several criteria, including geographic locationand skill rating. Our goal is to improve the fairness of matches by improving the accuracy ofthe skill ratings flowing into the matchmaking service.
The skill rating of a player is an estimate of their ability to win the next match, based onthe results of their previous matches. A typical match result lists the players involved, theirteam assignments, the length of the match, how long each player played, and the final score ofeach team. A skill rating system must make assumptions about how these match results relateto player skill. We follow previous work by representing these assumptions as a probabilisticgenerative model, that is, a process that generates random player skills and random match resultsfrom the skills. Bayesian inference in this generative model gives the optimal skill ratings underthe assumptions.
A skill rating system is only as good as its underlying assumptions. This paper focuses onmaking skill ratings more accurate by making better assumptions. We describe the process by
1
which we arrived at our generative model, how to evaluate the model, and how to estimate theparameters of the model.
A variety of different generative models can be found in previous work. For example, Dan-gauthier et al. [2008] extended TrueSkill for two-player games by giving each player an additionalnumber describing their ability to force draws, which could evolve over time. Glickman [2001]used a model for two-player games where each player has an additional number describing theirskill volatility, which could evolve over time. Chen et al. [2016] used a model where each playerhad a different (but unchanging) skill rating for each character that they could play in the game.Menke et al. [2006] used a model that accounted for map and server effects on the outcome ofmatches. Chen and Joachims [2016] used a model where ‘skill rating’ was a vector of numbers,to allow intransitive dominances between players.
Unfortunately, none of these models have the qualities needed by a modern game studio.After consulting with the makers of Gears of War and Halo, we have found that their toppriorities are:
1. Support for team games. The system should support matches with any number of teamsand any number of players on each team.
2. Changeable skill ratings. It must be possible for a player’s skill rating to change, nomatter how many matches they have played in the past. This ensures that players receivemeaningful feedback on their performance.
3. Compatibility with an existing matchmaker. Existing matchmakers assume skill is de-scribed by a single number. Players can easily understand a single ordered skill ranking.
4. Aligned incentives. The skill rating system should create incentives that align with thespirit of the game. For example, consider a team game where players cooperate to achievea goal. An improperly-designed skill rating system could encourage players to impede theirteammates. As another example, consider a system that increased skill rating accordingto the number of times a player healed themselves. This creates an incentive for a playerto repeatedly injure themselves so that they could be healed. In general, the more controlthat a player has over a quantity, the less useful it is for skill rating.
5. Minimal training data requirements. The most important time to have good matchmakingis immediately after the launch of a game. Unfortunately, this is also when there is theleast amount of data available to train a model. Even if the game has a large player base,there tends to be a small amount of training data per player.
6. Low computational cost. Skill updates are done on servers hosted by the game studio, andskill ratings are stored in a database hosted by the game studio. This means that skillrepresentations should be small and updates should be cheap.
7. Minimal tuning. Game studios generally do not have personnel with the knowledge andfree time available to tune the skill rating system after launch. But they do make plentyof other changes to the game, such as adding new game modes, new player abilities, and
2

re-balancing game mechanics. The skill rating system needs to automatically adapt tothese kinds of changes.
Our solution is to start with the TrueSkill model, which already enjoys properties 1–6, and makejudicious changes that preserve these properties. A skill rating in TrueSkill2 is a single numberwith the same meaning (in terms of win rate) as a TrueSkill rating. Thus any matchmakerthat accepts classic TrueSkill ratings also accepts TrueSkill2 ratings. TrueSkill2 only changesthe way that skills are inferred from historical data. Property 7 is achieved by performingautomatic parameter estimation over a batch of historical data. TrueSkill2 operates in twomodes: an online mode that only propagates skill ratings forward in time, and a batch modethat infers parameters and skills over all time (also known as TrueSkill Through Time). Bothmodes are based on the same probabilistic generative model—they only correspond to differentapproximations to the Bayesian posterior.
Briefly, the classic TrueSkill model makes the following assumptions:
1. Each player has a latent skill value that represents their expected contribution to a team.A player’s performance in a game is a noisy sample of their skill.
2. The performance of a team is the weighted sum of the performances of its players, wherethe weight is the fraction of time the player spent on the team.
3. If a team’s performance is greater than the other team by a certain margin, the team wins.Otherwise, the game is a draw. When learning skills from data, only the team win/lossinformation is used (not scores).
4. Player skills evolve over time according to a random walk. An increase or decrease in skillis assumed equally likely.
5. A player’s skill in a game mode is assumed independent of their skill in all other modes.
The TrueSkill2 model modifies the classic model in the following ways:
1. A player’s latent skill is inferred from their individual statistics such as kill and deathcounts, in addition to team win/loss.
2. When a player quits or drops out in the middle of a game, it is treated as a surrender andtheir skill is updated as if they lost a game (regardless of actual outcome).
3. A player’s skill in a game mode is assumed statistically correlated with their skill in othermodes, so that when a player starts a new mode, their skill rating from other modes isborrowed.
4. The random walk of player skill is assumed biased toward increasing skill, with larger biasduring the first matches a player plays in a game mode.
5. When a player is part of a squad, their performance is assumed to be better than normal.
3

2 Classic TrueSkill
This section describes the classic TrueSkill model in detail, and sets the notation used in therest of the paper. In the classic TrueSkill model, the data is assumed to consists of a sequenceof match results, each of which lists the players involved, their team assignments, the start timeand length of the match, how long each player played, and the final score of each team. Theteam scores are only used to determine an ordering of best to worst, including ties.
To interpret this data, TrueSkill assumes a probabilistic generative model of match results.This means that, instead of experimenting with different formulas for updating a player’s skillrating and hoping to stumble upon the right one, we construct an intuitive random process forgenerating skills and match results. This model can be checked against data and refined basedon any discrepancies we encounter. When we are happy with the fit to data, we apply Bayesianinference to obtain an optimal algorithm for updating skill ratings.
The generation process is illustrated below, where boxes denote variables that are observedin the data:
Past Skill
Skill
Performance
TeamPerformance
Other teamPerformance
Winner
Skill Skill
Performance Performance
The first step of the generation process is generating the player skills. Each player i isassumed to have a real-valued skill, denoted skillti, at time t. The initial skill of a player isdrawn from a Gaussian distribution with mean m0 and variance v0. This sampling process isdenoted
skillt0i ∼ N (m0, v0) (1)
where t0 is the time of the player’s first match and (m0, v0) are tunable parameters. After eachmatch, the player’s skill changes by a random amount, also drawn from a Gaussian:
skillt+Li ∼ N (skillti, γ
2) after a match of length L (2)
4

(Note that we are talking about the player’s actual skill level, not their skill rating assigned bythe system.) In the original paper [Herbrich et al., 2007], this was the only way that a player’sskill could change. A later paper [Dangauthier et al., 2008] made the alternative assumption(also made by Glickman [1999]) that a player’s skill changed with the passage of time, ratherthan from playing matches:
skillt′
i ∼ N (skillti, τ2(t′ − t)) where t′ > t (3)
Both of these assumptions make sense, since a player gains experience from each match theyplay, and their sharpness decreases over time without play. Therefore we include both types ofchange in the “classic” model.
The next step of the generation process is generating the match results from the playerskills. TrueSkill assumes that each player has a real-valued performance in each match, drawnaccording to:
perfti ∼ N (skillti, β2) (4)
where β is a tunable parameter that reflects the amount of randomness in the game. In thefollowing, we drop the dependence of perfi on t since we are always referring to a specific match.In a two-player game without draws, the winner is the player with the largest performance. Ifdraws are possible, then the model includes a parameter ε > 0, and declares a match to bedrawn if the difference between performances is less than or equal to ε:
perf1 − perf2 > ε player 1 wins|perf1 − perf2| ≤ ε drawperf1 − perf2 < −ε player 2 wins
In a game with teams, the performance of each team is defined to be the weighted sum ofthe player performances, where the weights are the fraction of the match time that they playedon the team:
perfteam =∑
i∈team
perfitimePlayedi
L(5)
The outcome between two teams is decided in the same way as above. If a game has more thantwo teams and no possibility of draws, then we sort the teams by their performances to get theirordering.
If a game has more than two teams and allows draws, then things get more complicated. Theoriginal paper [Herbrich et al., 2007] never gave a generative model for this situation, instead itonly provided a factor graph. Here we give a generative model that captures the spirit of thefactor graph. The idea is that if the performance difference between two teams is within ε, thenthe teams must have the same rank. Teams that are not forced to have the same rank accordingto this rule have different ranks. Given team performances perf1, perf2, ..., perfn in descendingorder, the following pseudo-code produces the rank of each team:
5

1. Initialize rank← 1. Team 1 has rank 1.
2. For team = 2, ..., n:
(a) If perfteam < perfteam−1 − ε, then rank← rank + 1.
(b) Assign rank to team.
In practice, this model for draws gives similar skill ratings as the approach in Herbrich et al.[2007]. Since the approach in Herbrich et al. [2007] is simpler to implement, we used theirapproach.
There is a scale ambiguity in this model, in the sense that if we scale all skill variables by2, along with β and ε, then the distribution over team orderings is the same. We resolve thisambiguity by fixing β = 1. This means that a skill gap of 1 always corresponds to the same winrate. The amount of luck in a game is reflected in the size of v0, where smaller v0 implies moreluck is involved.
In a two-player game, there is also a shift ambiguity in the model, in the sense that if weadd 2 to all skills, then the distribution over outcomes is the same. Thus m0 is irrelevant insuch games. However, in a team game where teams may have different sizes, for example dueto players dropping out, m0 is relevant since it represents the value of having a teammate.
Note that this model does not generate the entire match result. It generates the ordering ofteams given the players in the match, their team assignments, the length of the match, and thelength of time each player played. It does not generate the set of the players that will be in amatch, the team assignments, the time of the match, the length of the match, or the length oftime each player played. However, most of these things are correlated with skill. For example,a person who plays in the middle of the day is more likely to be a dedicated player with higherskill. Due to skill-based matchmaking, a player on the opposite team as a skilled player is morelikely to be skilled themselves. From a purely statistical perspective, including these correlationsin the model would give better skill estimates. But TrueSkill does not do this, because it wouldcreate undesirable incentives for players who want to increase their skill rating. The incentiveshould be to play the game well, not to queue up at particular times of day or with particularteammates.
The fact that TrueSkill does not model the length of time a player played is questionable. Ifa player tends to quit in the middle of a match, then this should arguably be reflected in theirskill rating. On the other hand, if a player joins a match in progress, this shorter play timeshould not be reflected in their skill rating. TrueSkill treats both cases the same way. If a playerquits early in the match, then timePlayedi will be small, so the player will have a negligiblechange to their skill rating, which may even be positive if their team happens to win.
One way to penalize quitters is to artificially set timePlayedi to the full length of the game.This penalizes the quitter, but also harshly penalizes players on the same team. This becomesworse when a new player joins to replace the quitter. Since the quitter is considered to haveplayed for the full time, this team is considered to have more players than normal, and thereforeexpected to win. If the team doesn’t win, all remaining players, including the late joiner, get
6

large reductions in skill rating. Therefore we don’t recommend this approach for team games.TrueSkill2 provides a better way to penalize quitters, as discussed in section 9.
3 Computing skill ratings
Given a probabilistic generative model for match results, skill ratings are computed by Bayesianinference. Formally, the model defines a joint distribution over player skills and match results,conditional on the unmodeled aspects of each match (which we will abbreviate as match condi-tions). The distribution over player skills comes from Bayes’ rule:
p(skills|results, conditions) =p(results|skills, conditions)p(skills)
p(results|conditions)(6)
In practice, we don’t compute the entire joint distribution over skills, but only the marginal dis-tribution of skillti, the skill of player i at time t, for all i and t. This distribution is approximatedby a Gaussian, and the mean of that Gaussian is taken as the player’s skill rating.
There are a variety of algorithms available for performing Bayesian inference, but this modelis particularly suited to Expectation Propagation [Minka, 2001]. Herbrich et al. [2007] andDangauthier et al. [2008] used the Expectation Propagation algorithm and gave a factor graphwith message equations. In this work, we used the Infer.NET framework [Minka et al., 2014b]to generate code for Expectation Propagation automatically, based on our model description.This generated code performs message-passing on a factor graph, as described in Herbrich et al.[2007], and produces the same results as in that paper. Infer.NET generated both the onlineand batch versions of the inference algorithm. In fact, TrueSkill Through Time is one of theexamples in the Infer.NET documentation [Minka et al., 2014a].
To generate the online TrueSkill updates, we defined a model in Infer.NET consisting of asingle match. The prior distributions on the player skills, the match conditions, model parame-ters, and the team ranks were marked as observed variables, and the player skills were marked asvariables to infer. Infer.NET then generated code where the observed variables were the input,and the inferred skill distributions were the output. This code is used to compute skill ratingsin the following way:
1. Initialize all player skill distributions to a Gaussian with mean m0 and variance v0.
2. For each match result in order of start time:
(a) Look up the current skill distribution for each player in the match.
(b) Increase the variance of each skill distribution according to the amount of time elapsedsince the player’s last match and equation (3), to represent a possible change in skilldue to their absence from the game.
(c) Invoke the inference code on the match result and skill distributions, to get a new setof skill distributions. These represent each player’s skill during the match.
7

(d) Increase the variance of each skill distribution according to (2), to represent a possiblechange in skill as a result of playing the match.
(e) Store the new skill distribution for each player in the match.
The online TrueSkill updates are useful as a fast, real-time approximation to the posteriordistribution over skills. But the most accurate skill ratings come from processing many matchestogether as a batch. To see why, consider 5 matches between 6 players, played in this order:
1. A beats B
2. C beats D
3. E beats F
4. B beats C
5. D beats E
All players start with the same skill distribution. After the first 3 matches, players (A,C,E)have all won 1 match against equivalent opponents, so the online updates will give them thesame skill distribution. Similarly, players (B,D,F) get the same skill distribution. In the lasttwo matches, B and D started with the same skill distribution, and beat opponents with thesame skill distribution, so they end up with the same final skill distribution. Similarly, C andE end up with the same skill distribution. But this is clearly wrong. If we consider all matchestogether, the players should be ordered A > B > C > D > E > F .
To generate the batch TrueSkill algorithm, we defined a model in Infer.NET that includedthe entire generation process described in section 2. Each player had a skill variable skillti forevery match they played. This is many more variables than Dangauthier et al. [2008], who usedone skill variable for each year of play. The generated code takes as input a list of match resultsand outputs a Gaussian distribution for each skillti variable. The handling of model parametersis discussed in section 4.
The difference between online and batch inference is illustrated on real data below.
Online Batch
0 20 40 60 80 100 120
Number of matches
2.5
3
3.5
4
4.5
Ski
ll ra
ting
0 20 40 60 80 100 120
Number of matches
2.5
3
3.5
4
4.5
Ski
ll ra
ting
The data was 700k Halo 5 Slayer matches, and skill ratings were computed for all players.Out of this large set of players, the figures show the skill ratings of the same six players, versus
8

the number of matches each one played. The skill ratings from batch immediately stand out asbeing smoother, but more importantly they give a different final ordering of players, with redbelow green and black far below blue.
4 Parameter estimation
The classic TrueSkill model has tunable parameters (m0, v0, γ, τ, β, ε) for each game mode. Tomake the skill rating system easy to use by a game studio, these should be learned from data.Previous work tuned these parameters by sweeping over a grid, which is only practical for asmall number of parameters on a small dataset. Since our goal is to extend the model with moreparameters, and run on large datasets, we needed a different solution. Our approach is to treatthe model parameters as random variables in the model, giving them prior distributions, andinferring them jointly with the skills. In practice, we gave the parameters broad priors, so theywere mainly determined by the data.
Our initial approach was to infer the parameters with Expectation Propagation. Unfortu-nately, most parameters are involved in generating every match result, which means that, in thefactor graph, a given parameter will be connected to millions of factors. This leads to a highmemory requirement as a large number of messages need to be stored. In addition, the posteriordistribution for some parameters is highly non-Gaussian, leading to poor approximations andsometimes non-convergence of the algorithm.
Our final approach exploits the fact that each parameter connects to a million factors. In sucha model, the parameter will tend to have a sharp posterior distribution. Therefore we choseto drop the uncertainty in the parameter posteriors, and approximate them as point massesduring each iteration. This not only saves memory on messages, but also saves computation.At the end of each iteration, we update each parameter using Rprop [Riedmiller and Braun,1993], where the gradient is computed by accumulating the Expectation Propagation messagesinto that parameter. The incoming messages are computed once and discarded. This procedurereaches reasonable parameter estimates in about 100 iterations, i.e. 100 forward and backwardsweeps through the data. Note that this approximation breaks down for game modes with lessthan 1000 matches. For such modes, we used the parameters estimated from the most similarpopular mode.
For the Halo 5 data, typical parameter values are:
• m0 = 3 (teammates are very important)
• v0 = 1.6 (skills of new players only vary by 1 from the mean)
• γ = 10−3 (skills change slowly)
• τ = 10−8 per minute, so that γ/τ = 105 minutes of non-play are equivalent to one match
• β = 1 (by design)
• ε = 10−3 (draws are rare)
9
5 Metric-driven modelling
This section describes the approach that was used to develop the TrueSkill2 model. The mo-tivation behind it is that a skill rating system should use the simplest model that meets theneeds of a game studio, and we shouldn’t have to spend large amounts of time searching forthat model. The basic principle is that any change to the model must be motivated by a metricthat demonstrates a gap between the model and reality. The metric must be meaningful to theapplication, and specific enough that it is clear where the model needs to be changed in order toimprove the metric. We call this approach “metric-driven modelling,” taking inspiration fromtest-driven development of computer software. The metrics encode a deep understanding of theapplication, while modelling is in principle a mechanical search for ways to improve the metrics.
A metric is a function averaged over a subset of test data. It can refer to the data, inferencesfrom the model, or the difference between an inference and the data. Data subsets are definedusing features. The metric designer’s job is to determine the relevant subsets and comparisons.In principle, this does not require knowledge of the model. Metrics should be in data space, ormore generally the external interface of the model, not in the parameter space.
For a generative model of match results, the key metric is how well it predicts the final order-ing of teams. We call this the predictive accuracy. For matches with two teams, there are only 3possible orderings. With more teams, the number of possible orderings grows exponentially. Toget a meaningful and easily computable metric, we only ask the model to predict the identityof the winning team, or predict “draw” when there is a tie for first place. Thus the number ofoptions is the number of teams plus 1.
Accuracy is useful for comparing models, but it doesn’t tell you why errors were made. Isthe model favoring certain kinds of teams or players? Does it penalize quitters too harshly, ornot enough? Does it overestimate the skill of new players, or underestimate them? To answerthese questions, we look at how often the model thinks a particular kind of team or player wouldwin, compared to how often they actually win.
The dataset used to develop TrueSkill2 was the set of all matches played in Halo 5 since itsrelease in 2015, provided to us by 343 Industries. Halo 5 has a variety of game modes, whichspan various numbers of teams and team sizes. This dataset contains millions of match resultsand millions of unique players. For the results shown in this paper, the training set consistedof 23 million games played just after release. The test set consisted of the next 3 million gamesplayed after the end of the training period. Because of the large size of this dataset, there is noneed to report error bars in our summary statistics since they are tiny.
All metrics, including predictive accuracy, were measured in the following way. For eachmodel, the parameters were tuned on the training set. Then the model was asked to predictthe outcomes in the test set. The player skills were reset between the train and test phase.Resetting the player skills is not essential but made the implementation simpler.
The matches in the test set were sorted by start time and processed once in order. As eachmatch was processed, we asked the model to predict the winning team and give a probabilityfor this event. When making this prediction, only the team composition and squad membershipare used—the length of the game, time each player played, completion status, and kill/death
10

counts are not used. Then we updated the skills using the online updater with all of theinformation available at the end of the match. The percentage of correct predictions is thepredictive accuracy, and the percentage of matches where a particular kind of team or playerwas predicted to win is its expected win rate.
Many of our metrics involve the expected win rate of a subpopulation of players. This iscomputed by recording the prediction for all matches, visiting each player in each match, andtesting if the player meets the criteria. If so, the prediction for that player’s team is added tothe tally. The final metric is an average of the predictions for all players that met the criteria.Thus the subpopulation that we define only changes the subset of predictions that go into theaverage. It does not change how we make predictions or update skills. Skills are always updatedusing all matches.
After tuning model parameters on the training data, classic TrueSkill achieved a predictiveaccuracy of 52% on the test set. TrueSkill2 achieved a predictive accuracy of 68% on the testset. The next sections explain how this was accomplished. The figure below illustrates thenew generative model in TrueSkill2, where boxes denote variables that are observed in the data(compare to section 2).
Past Skill
Skill
Performance
TeamPerformance
Other teamPerformance
Winner
Skill Skill
Experience
Performance Performance
Quit?Kill
CountDeath Count
Squad?
6 Squad offset
Many online multiplayer games give friends the option of queuing up together. We call such agrouping a squad. The matchmaker is expected to find a fair match where the entire squad is onone team. This is typically done by assuming that the skill rating of a squad is the sum of skillratings of its players. We can test this assumption by measuring an appropriate metric. Themetric we chose partitions players according to whether they queued up in a squad versus solo,and measures their actual win rate compared to their predicted win rate under the assumption.This was done regardless of game mode. The results on the test set are collected below:
11

Player Squad Size Win Rate (%) Expected by TrueSkill1 47 472 50 503 50 504 57 525 53 496 56 487 62 498 68 499 70 54
≥10 89 67
We see that the assumption about squads is false. The skill rating of a squad should belarger than the sum of its players, and the effect grows with the size of the squad. This is awell-known phenomenon in online gaming. In fact, some playlists in Halo 5 and Gears of War4 prohibit large squads in an attempt to provide fairer matches, even though this lowers theenjoyment of people who like to play with their friends. Other games address this by forcingsquads to match with other squads. This has the problem of shrinking the matchmaking pool.
Instead of prohibiting squads or constraining matchmaking, TrueSkill2 changes the assump-tion about the skill rating of squads. This new assumption should be used during matchmakingas well as after a match, when updating skill ratings. There are a variety of different models thatone could imagine, but, in keeping with metric-driven modelling, we chose the simplest modelthat fixes the metrics in the above table. This model simply adds an offset to the skill ratingof a player, depending on the size of their squad, when generating the player’s performance.Therefore equation (4) is replaced by:
perfti ∼ N (skillti + squadOffset(size of squad), β2) (7)
where squadOffset is an array of tunable parameters, one for each possible squad size, for eachgame mode. We fix squadOffset(1) = 0.
To incorporate this change, we updated the model description for Infer.NET, generated thenew inference code automatically, and ran batch inference on the training set to infer the modelparameters. On the same test set as before, we get the following metric values:
Player Squad Size Win Rate (%) Expected by TrueSkill21 47 462 50 513 50 504 57 575 53 536 55 547 62 598 68 619 70 66
≥10 89 87
12
We cannot change the matchmaking in historical data, so the actual win rates are unchanged.But the model now predicts close to the correct win rates, implying that its skill ratings forsquads are more accurate.
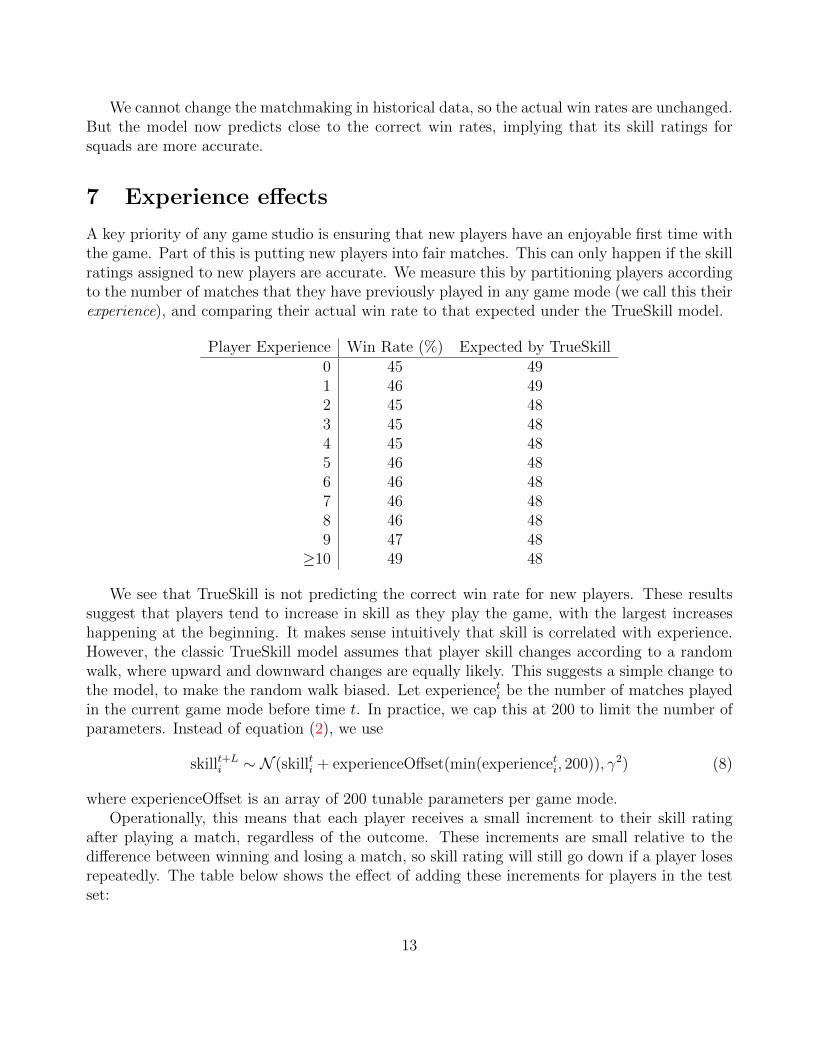
7 Experience effects
A key priority of any game studio is ensuring that new players have an enjoyable first time withthe game. Part of this is putting new players into fair matches. This can only happen if the skillratings assigned to new players are accurate. We measure this by partitioning players accordingto the number of matches that they have previously played in any game mode (we call this theirexperience), and comparing their actual win rate to that expected under the TrueSkill model.
Player Experience Win Rate (%) Expected by TrueSkill0 45 491 46 492 45 483 45 484 45 485 46 486 46 487 46 488 46 489 47 48
≥10 49 48
We see that TrueSkill is not predicting the correct win rate for new players. These resultssuggest that players tend to increase in skill as they play the game, with the largest increaseshappening at the beginning. It makes sense intuitively that skill is correlated with experience.However, the classic TrueSkill model assumes that player skill changes according to a randomwalk, where upward and downward changes are equally likely. This suggests a simple change tothe model, to make the random walk biased. Let experienceti be the number of matches playedin the current game mode before time t. In practice, we cap this at 200 to limit the number ofparameters. Instead of equation (2), we use
skillt+Li ∼ N (skillti + experienceOffset(min(experienceti, 200)), γ2) (8)
where experienceOffset is an array of 200 tunable parameters per game mode.Operationally, this means that each player receives a small increment to their skill rating
after playing a match, regardless of the outcome. These increments are small relative to thedifference between winning and losing a match, so skill rating will still go down if a player losesrepeatedly. The table below shows the effect of adding these increments for players in the testset:
13
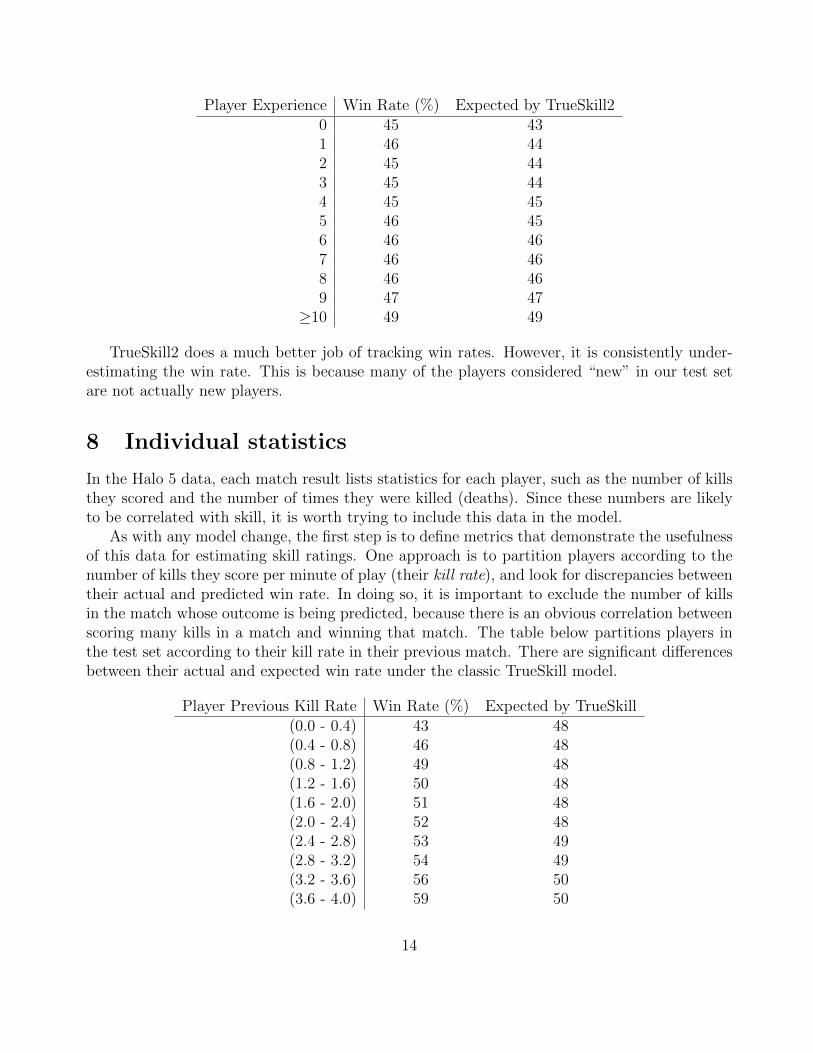
Player Experience Win Rate (%) Expected by TrueSkill20 45 431 46 442 45 443 45 444 45 455 46 456 46 467 46 468 46 469 47 47
≥10 49 49
TrueSkill2 does a much better job of tracking win rates. However, it is consistently under-estimating the win rate. This is because many of the players considered “new” in our test setare not actually new players.
8 Individual statistics
In the Halo 5 data, each match result lists statistics for each player, such as the number of killsthey scored and the number of times they were killed (deaths). Since these numbers are likelyto be correlated with skill, it is worth trying to include this data in the model.
As with any model change, the first step is to define metrics that demonstrate the usefulnessof this data for estimating skill ratings. One approach is to partition players according to thenumber of kills they score per minute of play (their kill rate), and look for discrepancies betweentheir actual and predicted win rate. In doing so, it is important to exclude the number of killsin the match whose outcome is being predicted, because there is an obvious correlation betweenscoring many kills in a match and winning that match. The table below partitions players inthe test set according to their kill rate in their previous match. There are significant differencesbetween their actual and expected win rate under the classic TrueSkill model.
Player Previous Kill Rate Win Rate (%) Expected by TrueSkill(0.0 - 0.4) 43 48(0.4 - 0.8) 46 48(0.8 - 1.2) 49 48(1.2 - 1.6) 50 48(1.6 - 2.0) 51 48(2.0 - 2.4) 52 48(2.4 - 2.8) 53 49(2.8 - 3.2) 54 49(3.2 - 3.6) 56 50(3.6 - 4.0) 59 50
14
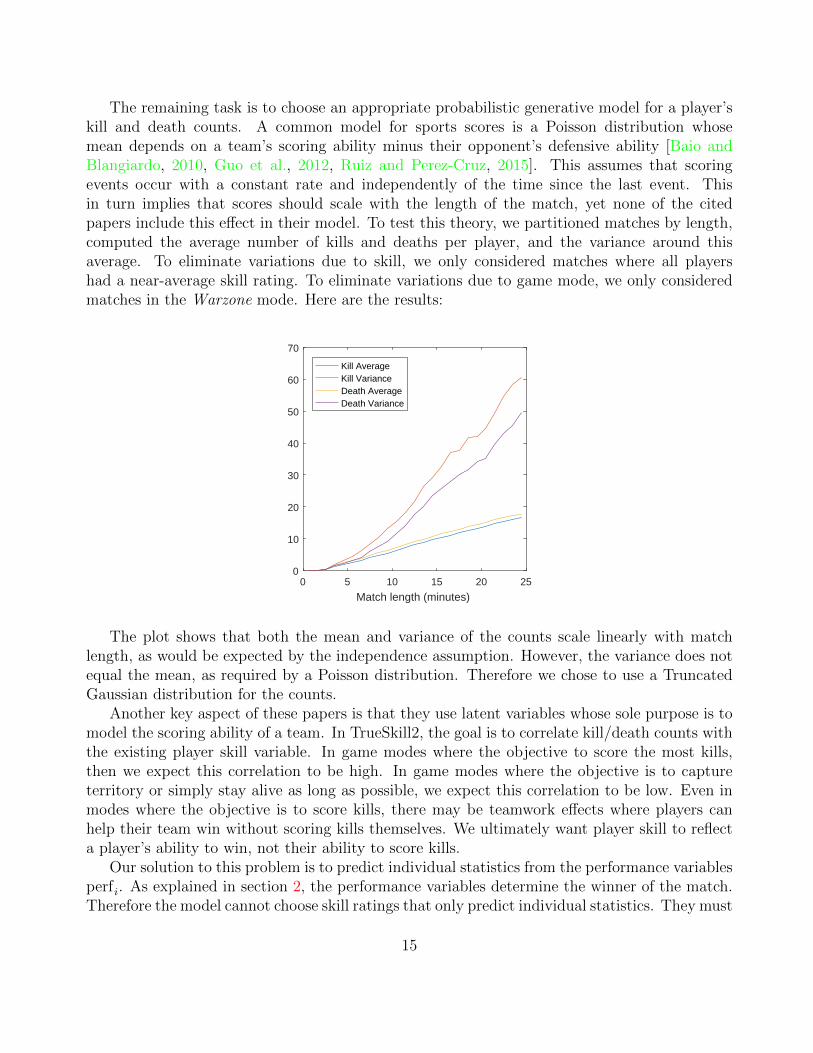
The remaining task is to choose an appropriate probabilistic generative model for a player’skill and death counts. A common model for sports scores is a Poisson distribution whosemean depends on a team’s scoring ability minus their opponent’s defensive ability [Baio andBlangiardo, 2010, Guo et al., 2012, Ruiz and Perez-Cruz, 2015]. This assumes that scoringevents occur with a constant rate and independently of the time since the last event. Thisin turn implies that scores should scale with the length of the match, yet none of the citedpapers include this effect in their model. To test this theory, we partitioned matches by length,computed the average number of kills and deaths per player, and the variance around thisaverage. To eliminate variations due to skill, we only considered matches where all playershad a near-average skill rating. To eliminate variations due to game mode, we only consideredmatches in the Warzone mode. Here are the results:
0 5 10 15 20 25
Match length (minutes)
0
10
20
30
40
50
60
70
Kill AverageKill VarianceDeath AverageDeath Variance
The plot shows that both the mean and variance of the counts scale linearly with matchlength, as would be expected by the independence assumption. However, the variance does notequal the mean, as required by a Poisson distribution. Therefore we chose to use a TruncatedGaussian distribution for the counts.
Another key aspect of these papers is that they use latent variables whose sole purpose is tomodel the scoring ability of a team. In TrueSkill2, the goal is to correlate kill/death counts withthe existing player skill variable. In game modes where the objective to score the most kills,then we expect this correlation to be high. In game modes where the objective is to captureterritory or simply stay alive as long as possible, we expect this correlation to be low. Even inmodes where the objective is to score kills, there may be teamwork effects where players canhelp their team win without scoring kills themselves. We ultimately want player skill to reflecta player’s ability to win, not their ability to score kills.
Our solution to this problem is to predict individual statistics from the performance variablesperfi. As explained in section 2, the performance variables determine the winner of the match.Therefore the model cannot choose skill ratings that only predict individual statistics. They must
15

predict the match winner first, and secondarily predict the individual statistics. We expect thatthe most benefit from including individual statistics will come in team games. In such games,the players on a team can have different performance values, as long as their total performanceis consistent with the match result. TrueSkill2 uses this flexibility to give more credit for a winto players with the best individual scores, something that classic TrueSkill cannot do.
To determine how the individual statistics depend on performance, we partitioned playersby skill, the average skill of their teammates, and the average skill of their opponents. We foundthat the statistics were linear in all three, with teammates having a very small effect. Thereforeto keep the model simple, we dropped the dependence on teammates. Putting all of the abovetogether gives the following model for a count of type c (c ∈ {kill, death}):
countci ∼ max(0,N ((wcpperfi + wc
operfoi )timePlayedi, vctimePlayedi)) (9)
where (wcp, w
co, v
c) are tunable parameters for each count type in each game mode. These pa-rameters determine the correlation between individual statistics and skill rating. For two teamsof equal size where everyone played for the full time, perfoi is the average performance of theopposing team. Typically, wp and wo have different signs. For kill count, wp > 0 and wo < 0.For death count, wp < 0 and wo > 0.
If the player’s team is larger than the opposing team, then we need a different formulafor perfoi , to account for the divided attention of each opposing player. For each player i, letopposingi be the total number of opposing players, weighted by their play time (L is the lengthof the match):
opposingi =∑
j | team(j)6=team(i)
timePlayedj
L(10)
We assume that each player’s attention is divided by this number. Therefore
perfoi =∑
j | team(j)6=team(i)
timePlayedj
L
perfjopposingj
(11)
This formula works for any number of teams of any sizes. Thus there are three key differencesbetween TrueSkill2’s model of individual statistics and previous work on sports scores:
1. TrueSkill2 incorporates the effect of match length.
2. TrueSkill2 models the correlation between individual statistics and a player’s ability towin.
3. TrueSkill2 incorporates the effect of having many teams of different sizes.
The linear model here could be replaced with a more flexible model, if the data warrantedit. However, it is important that the model is constrained to be monotonic. A monotonicrelationship incentivizes players to maximize their kill count and minimize their death count.A non-monotonic relationship would give players misaligned incentives, such as stopping whenthey reach a certain number of kills.
The table below shows the effect of these model changes on the test set:
16

Player Previous Kill Rate Win Rate (%) Expected by TrueSkill2(0.0 - 0.4) 43 41(0.4 - 0.8) 46 45(0.8 - 1.2) 49 48(1.2 - 1.6) 50 50(1.6 - 2.0) 51 51(2.0 - 2.4) 52 52(2.4 - 2.8) 53 53(2.8 - 3.2) 54 54(3.2 - 3.6) 56 56(3.6 - 4.0) 59 59
There is a much better agreement between actual and expected win rate, therefore the skillsestimated from individual statistics are more accurate.
9 Quit penalty
As discussed in section 2, classic TrueSkill does not penalize players who quit. TrueSkill2solves this problem by including a player’s completion status (“completed” versus “quit”) in thegenerative model.
The first step, as always, is to define metrics that measure the relationship between comple-tion status and skill. In section 8, we looked at a player’s behavior in the previous match. Thesame approach works here. Specifically, we can partition players according to their completionstatus in the previous match and look for discrepancies between their actual and predicted winrate.
Player Previous Outcome Win Rate (%) Expected by TrueSkillWin Completed 51 50
Win Quit 45 49Loss Completed 47 46
Loss Quit 44 47Draw Completed 49 48
Draw Quit 46 47
This table shows that quitters tend to have lower skill (for the same match outcome), buttheir TrueSkill rating does not reflect this.
Digging deeper into the data, we found that players who quit have worse individual statisticsthan players who complete, even for the same amount of time played. This suggests that playersquit more when their performance is low. But low relative to what? According to section 8,individual statistics are determined by the player’s performance minus the opposing team’sperformance. This suggests the following probabilistic model for whether a player is under-performing:
underi ∼ (N (perfi − perfoi −mq, vq) < 0) (12)
17

where perfo is defined the same way as in section 8, and (mq, vq) are tunable parameters (pergame mode) that allow for variation in the degree that a player underperforms. We force mq ≤ 0during parameter estimation. Of course, a player may not quit when they underperform, andplayers may quit for other reasons. We model these effects by random Boolean variables:
quiti = unrelatedi OR (relatedi AND underi) (13)
where unrelatedi is true with probability pu and relatedi is true with probability pr, both tunableparameters in each game mode.
The net effect of this model is that it will infer lower performance values for players whoquit compared to players who do not quit. A surprising side effect is that, in order to penalizeplayers that quit, the model must reward players that complete. It is counter-intuitive for aplayer’s skill rating to increase simply for completing a match, especially if they played for zeroseconds. But in order to penalize players that quit with zero seconds played, the model mustreward players that complete with zero seconds played. Note that this model also adds a smallamount of additional computation to process each match, even if no player ever quits.
A property that we would like is that, if no player quits, then the computational cost and finalresults should be identical to classic TrueSkill. This means we cannot use a model that generatescompletion status. Instead, we treat a quit as an additional observation that only appears whena player quits. We interpret a quit as the outcome of a mini-game between the player and(a rescaled version of) the enemy team. Unfortunately, since this model is unnormalized, wecannot easily learn its parameters. Our solution is to learn parameters using the normalizedmodel, then switch to the unnormalized model for online updating, with the same parameters.In experiments, this switch actually gives a slight improvement in predictive accuracy, comparedto using the normalized model throughout.
The table below shows the effect of these model changes, on the same test data as above:
Player Previous Outcome Win Rate (%) Expected by TrueSkill2Win Completed 51 52
Win Quit 45 43Loss Completed 47 46
Loss Quit 44 42Draw Completed 49 48
Draw Quit 46 43
We see that TrueSkill2 lowers a player’s skill rating after a quit, but a bit more than itshould.
10 Features that did not need to be added
The model changes so far have all had orthogonal metrics. That is, the metrics that motivatedeach change could not be fixed by the other changes. For example, the metrics that motivated
18

squad offsets are not fixed by modeling experience or individual statistics. But in other cases,metrics that seem to indicate a model change are automatically fixed by earlier changes.
For example, when we partition players according to the length of time since their last match(“lapse”), we get the following table:
Lapse in days Win Rate (%) Expected by TrueSkill(0 - 1) 49 48(1 - 2) 46 47(2 - 3) 46 48(3 - 4) 45 48(4 - 5) 45 48(5 - 6) 45 48(6 - 7) 44 48(7 - 8) 43 48(8 - 9) 43 48≥9 45 48
Win rate decreases with lapse, and classic TrueSkill does not capture this. This seems toindicate that player lapse should be added to the model. However, once the experience effectwas added in TrueSkill2, the correct trend with lapse emerged automatically:
Lapse in days Win Rate (%) Expected by TrueSkill2(0 - 1) 49 48(1 - 2) 46 46(2 - 3) 46 45(3 - 4) 45 44(4 - 5) 45 44(5 - 6) 45 43(6 - 7) 44 43(7 - 8) 43 42(8 - 9) 43 42≥9 45 42
A related occurrence was features that seemed like they should be useful to add to themodel, but turned out to be unnecessary. These were caught early by looking at the rightmetrics. For example, player score seems like it should be relevant since it incorporates mode-specific objectives. The raw score reported by the game includes kills, so we subtracted these offto get a number we call “Extra score”. As in section 8, we partitioned players by their “Extrascore” in the previous match, and compared their actual and expected win rate. With kills anddeaths already included in the model, these numbers matched. So player score did not need tobe added.
19

11 Mode correlation
Most online multiplayer games have multiple game modes, which change the rules and/or ob-jectives of the game. A player typically queues up to play a particular mode, and expects thematchmaker to construct a fair match for that mode. Thus the matchmaker needs to know aplayer’s skill rating in a particular mode. In some games, such as Halo 5, a mode is chosen aftermatchmaking. Even in these cases, it can be useful to have a skill rating per mode since it leadsto faster convergence and more accurate skill ratings overall. For example, suppose player Ahas high skill in mode 1 and low skill in mode 2. When playing against a mid level opponent,we expect A to win in mode 1 and lose in mode 2. So if A wins in mode 1, then the opponent’sskill rating should decrease slightly, if at all. But if A wins in mode 2, then the opponent’s skillrating should decrease significantly. To construct a single skill rating for matchmaking, takea weighted average of the player’s rating in each mode, where the weight is the probability ofplaying that mode.
The traditional approach to handling multiple gameplay modes in TrueSkill is to have aseparate skill distribution for each mode. This is equivalent to assuming that a person’s skill inone mode is independent of their skill in another mode. We can easily test this assumption bycomparing the skill ratings computed by TrueSkill for different gameplay modes. For two of themodes in the Halo 5 data, we plot the skill ratings of players with many games played in bothmodes:
2 3 4 5 6 7
Skill in Breakout
1
1.5
2
2.5
3
3.5
4
4.5
5
5.5
Ski
ll in
Wee
kend
Dou
bles
The skill ratings are correlated, with correlation coefficient = 0.6. Repeating this experimentfor all pairs of gameplay modes gives similar results. A player’s skill in any gameplay mode ispositively correlated with their skill in all other modes. This makes sense since many of thegame mechanics, such as the controls, are the same between modes.
This suggests that we can improve skill estimation by borrowing information from othergameplay modes. Since the prior distribution (1) on a player’s skill is Gaussian, a natural wayto correlate skills is to use a multivariate Gaussian distribution with a full covariance matrix
20
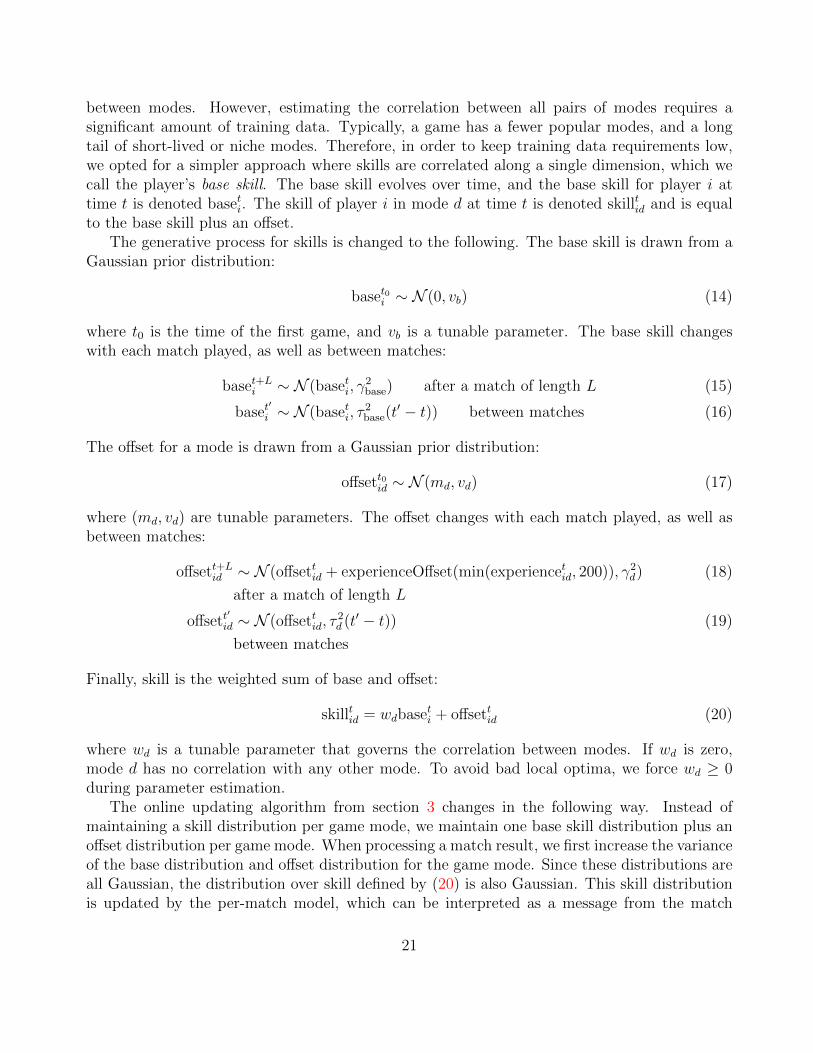
between modes. However, estimating the correlation between all pairs of modes requires asignificant amount of training data. Typically, a game has a fewer popular modes, and a longtail of short-lived or niche modes. Therefore, in order to keep training data requirements low,we opted for a simpler approach where skills are correlated along a single dimension, which wecall the player’s base skill. The base skill evolves over time, and the base skill for player i attime t is denoted baseti. The skill of player i in mode d at time t is denoted skilltid and is equalto the base skill plus an offset.
The generative process for skills is changed to the following. The base skill is drawn from aGaussian prior distribution:
baset0i ∼ N (0, vb) (14)
where t0 is the time of the first game, and vb is a tunable parameter. The base skill changeswith each match played, as well as between matches:
baset+Li ∼ N (baseti, γ
2base) after a match of length L (15)
baset′
i ∼ N (baseti, τ2base(t
′ − t)) between matches (16)
The offset for a mode is drawn from a Gaussian prior distribution:
offsett0id ∼ N (md, vd) (17)
where (md, vd) are tunable parameters. The offset changes with each match played, as well asbetween matches:
offsett+Lid ∼ N (offsettid + experienceOffset(min(experiencetid, 200)), γ2d) (18)
after a match of length L
offsett′
id ∼ N (offsettid, τ2d (t′ − t)) (19)
between matches
Finally, skill is the weighted sum of base and offset:
skilltid = wdbaseti + offsettid (20)
where wd is a tunable parameter that governs the correlation between modes. If wd is zero,mode d has no correlation with any other mode. To avoid bad local optima, we force wd ≥ 0during parameter estimation.
The online updating algorithm from section 3 changes in the following way. Instead ofmaintaining a skill distribution per game mode, we maintain one base skill distribution plus anoffset distribution per game mode. When processing a match result, we first increase the varianceof the base distribution and offset distribution for the game mode. Since these distributions areall Gaussian, the distribution over skill defined by (20) is also Gaussian. This skill distributionis updated by the per-match model, which can be interpreted as a message from the match
21

result to the skill variable. This message propagates to the base and offset variables in the usualmanner of Expectation Propagation, to determine their posterior distributions. In practice,all we have to do is add (20) to the model description for Infer.NET and re-generate the skillupdating code, which will output the posterior distribution for base and offset directly. Duringmatchmaking, when we want a player’s skill rating in a particular mode, we look up the baseskill distribution and offset skill distribution (if it exists), then apply (20).
The net effect is that, when a player’s skill is updated in one mode, it will also be updatedin other modes. However, the mathematics of the update ensures that these changes will benegligible once the player has played a sufficient number of matches in the other mode. A player’sskill rating in a mode where many matches have already been played will not be affected byplaying other modes.
In some games, such as League of Legends and Dota 2, players can play as different characterswith different abilities. Using the same mechanism as above, a player can be given a different skillrating with each character, and these can be correlated. Even if players choose their characterafter matchmaking, maintaining separate skill ratings increases the convergence rate and overallaccuracy of the skill rating system, for the same reason as given earlier for game modes. If youbeat someone who is playing a character for the first time, you should not get the same ratingchange as beating their best character. To construct a single skill rating for matchmaking, asimple approach is to take a weighted average of the player’s skill rating with each character,where the weight is their probability of choosing that character.
12 Gears of War 4
TrueSkill2 has been used successfully as the skill rating system in Gears of War 4 since its launchin 2016. Skills are updated in real-time using the online updates. Before each new “season” ofranked play, all skills and model parameters are recomputed using batch inference (TrueSkillThrough Time) on the data from all previous seasons.
Unlike Halo 5, Gears of War 4 has AI-controlled bots in social and co-op game modes. Eachbot has a difficulty level. We include bots into the skill rating system by treating each difficultylevel as a unique player. However, while human skills are assumed to change over time, a bot’sskill is assumed constant over time. This means that the updates (8) and (3) are not applied tobot skills. (A bot’s skill rating may change as we learn about the bot, but eventually this willconverge.) Thus bots provide a fixed baseline against which all human skills can be measured.The inferred skill ratings for the bots can also provide feedback to the game designers about thetrue difficulty level of each bot.
13 Summary
This paper has presented TrueSkill2, a collection of model changes to TrueSkill as well as anew system for estimating model parameters. TrueSkill2 gives significantly more accurate skillratings than TrueSkill, measured along a variety of axes important to a game studio.
22

Acknowledgements
Thanks to Alan Lawrence for help implementing the evaluation framework, and Vijay Sharma forhelp implementing the experimentation infrastructure. Thanks to The Coalition for providingdevelopment support and testing, and Clayton Vaught for his help with the Gears of Warmatchmaking designs. Thanks to 343 Industries for providing the data, and Joshua Menke andBrian Richards for helpful discussions.
References
Gianluca Baio and Marta A. Blangiardo. Bayesian hierarchical model for the prediction offootball results. Journal of Applied Statistics, 37(2):253–264, 2010. URL http://www.
statistica.it/gianluca/Research/BaioBlangiardo.pdf.
Shuo Chen and Thorsten Joachims. Modeling intransitivity in matchup and comparison data.In WSDM, 2016. URL http://www.cs.cornell.edu/~shuochen/pubs/wsdm16_chen.pdf.
Zhengxing Chen, Yizhou Sun, Magy Seif El-nasr, and Truong-Huy D. Nguyen. Player skilldecomposition in multiplayer online battle arenas. In Meaningful Play, 2016. URL https:
//arxiv.org/abs/1702.06253.
Pierre Dangauthier, Ralf Herbrich, Tom Minka, and Thore Graepel. TrueSkill Through Time:Revisiting the History of Chess. In Advances in Neural Information Processing Systems, pages931–938. MIT Press, January 2008. URL https://www.microsoft.com/en-us/research/
publication/trueskill-through-time-revisiting-the-history-of-chess/.
Mark E. Glickman. Parameter estimation in large dynamic paired comparison experiments.Applied Statistics, 48:377–394, 1999. URL http://www.glicko.net/research/glicko.pdf.
Mark E. Glickman. Dynamic paired comparison models with stochastic variances. Journal ofApplied Statistics, 28:673–689, 2001. URL http://www.glicko.net/research/dpcmsv.pdf.
Shengbo Guo, Scott Sanner, Thore Graepel, and Wray Buntine. Score-based bayesian skilllearning. In ECML, 2012. URL http://users.rsise.anu.edu.au/~ssanner/Papers/sbsl_
ecml2012.pdf.
Ralf Herbrich, Tom Minka, and Thore Graepel. TrueSkill(TM): A Bayesian Skill RatingSystem. In Advances in Neural Information Processing Systems, pages 569–576. MITPress, January 2007. URL https://www.microsoft.com/en-us/research/publication/
trueskilltm-a-bayesian-skill-rating-system/.
Joshua E. Menke, Shane Reese, and Tony R. Martinez. Hierarchical models for estimatingindividual ratings from group competitions. 2006. URL http://citeseerx.ist.psu.edu/
viewdoc/summary?doi=10.1.1.533.1843.
23

T. Minka, J.M. Winn, J.P. Guiver, S. Webster, Y. Zaykov, B. Yangel, A. Spengler, andJ. Bronskill. Chess Analysis example. Infer.NET documentation, 2014a. URL http:
//research.microsoft.com/infernet/docs/Chess%20Analysis.aspx.
T. Minka, J.M. Winn, J.P. Guiver, S. Webster, Y. Zaykov, B. Yangel, A. Spengler, and J. Bron-skill. Infer.NET 2.6, 2014b. URL http://research.microsoft.com/infernet. MicrosoftResearch Cambridge.
Thomas P. Minka. Expectation propagation for approximate bayesian inference. In Uncertaintyin AI, pages 362–369, 2001. URL https://tminka.github.io/papers/ep/.
Martin Riedmiller and Heinrich Braun. A Direct Adaptive Method for Faster BackpropagationLearning: The RPROP Algorithm. In IEEE International Conference on neural networks,1993.
Francisco J. R. Ruiz and Fernando Perez-Cruz. A generative model for predicting outcomes incollege basketball. Journal of Quantitative Analysis in Sports, 11(1), 2015.
24