Embed Size (px)
Citation preview
Tropospheric Emissions: Monitoring of Pollution (TEMPO)
Status and validation plans tempo.si.edu
Kelly Chance
Smithsonian Astrophysical Observatory
CNES June 29, 2017
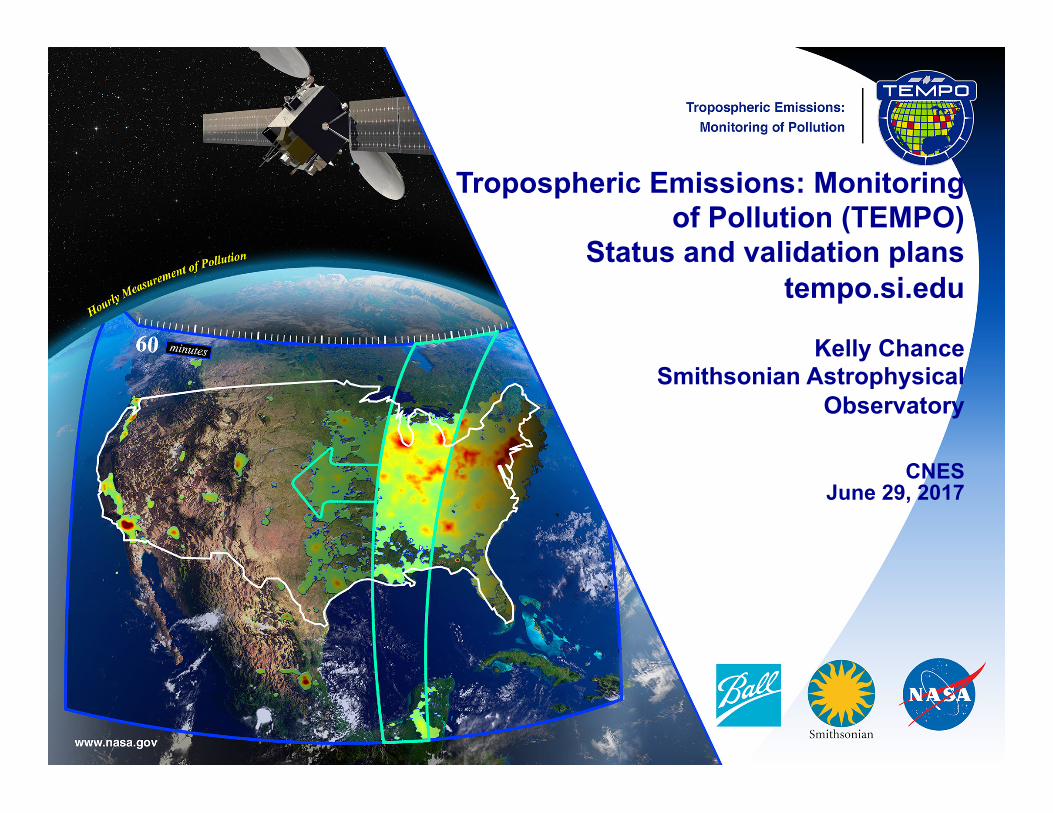
TEMPO summary
• Currently on-schedule and on-budget • Instrument CDR June 2015 • Ground Systems CDR May 2016 • Test Readiness Review August 2016, currently undergoing assembly,
integration, and test • Capabilities currently are as proposed
• Select commercial geostationary satellite host 2017+ • TEMPO operating longitude and launch date are not known until after host
selection
• Instrument delivery 2/2018 for launch 2/2019 or later, most likely in 2020 or 2021
June29,2017 2
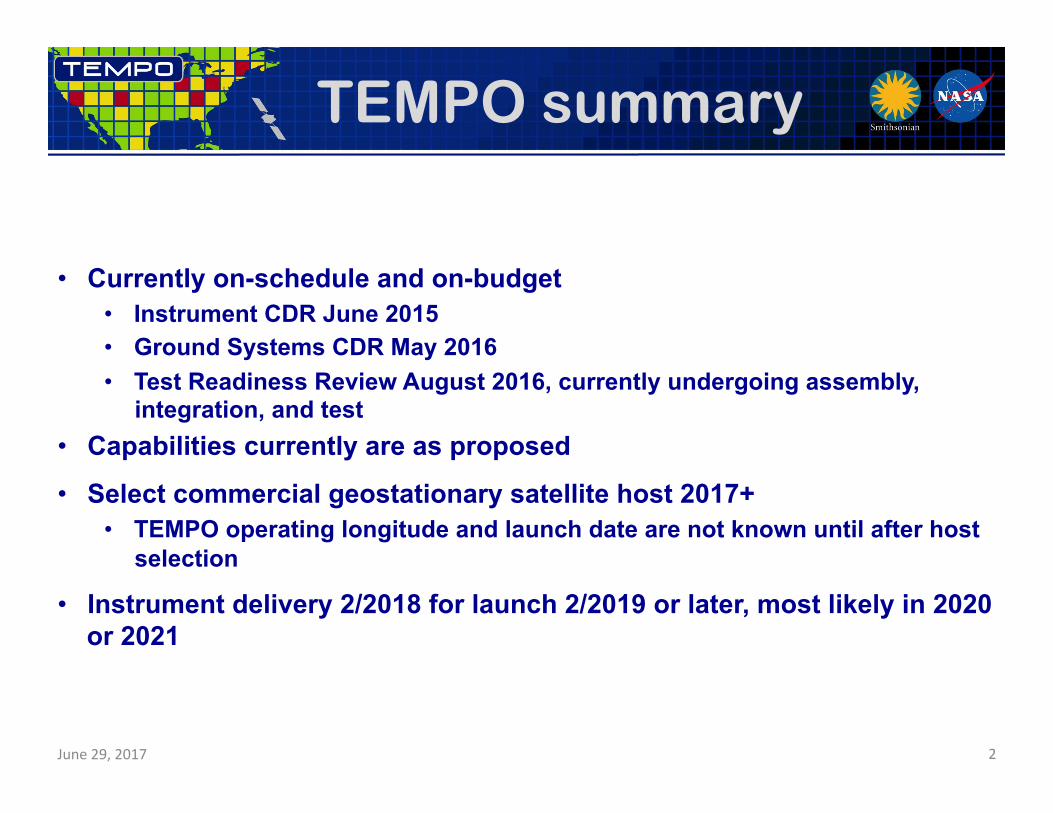
Instrument layout Calibra2onMechanismAssembly
TelescopeAssembly
SpectrometerAssembly
ScanMechanismAssembly
FocalPlaneAssembly
FocalPlaneElectronics
InstrumentSupportAssembly
RadiatorAssembly
InstrumentControlElectronics
June29,2017 3
TEMPO validation working group
June29,2017 4
Meeting hosted by Ron Cohen April 26 and 27, David Brower Center, Berkeley, CA Material from his TEMPO Science Team meeting presentation (mostly) Agenda 1) Review algorithm status, key assumptions, and prior validation success stories. Identify validation strategies that will quickly find programming and other simple retrieval mistakes in the early days of TEMPO. 2) Break out groups to address common themes in all UV/Visible Satellite Validation: Summarize strategies for validation that were effective at challenging and then guiding improvements to retrieval assumptions/algorithms for previous related space-based instruments for NO2, H2CO and O3 (other molecules and aerosol not our current focus). 3) Discuss as a committee of the whole aspects of TEMPO that require unique approaches to validation. Identify strategies for testing the SZA dependence of the retrieval. Which aspects of SZA variations have been tested with the current array of LEO instruments? What new aspects are to be evaluated? Identify strategies for testing the novel high spatial resolution aspects of the retrieval.
TEMPO validation workshop
June29,2017 5
Agreement about outlines of issues to plan for 1. Radiance and Spectroscopy plan in good shape - to
be written by SAO so the rest of us can review. 2. Validation of products at level of current LEO
instruments.
3. Solar zenith angle (SZA).
4. Spatial resolution.
Discussion of validation plans
June29,2017 6
• Level 1 (spectroscopy/slant column) algorithms defined. • Level 2 conversion to vertical columns not yet defined. As a result, the edge between
validation and science remains blurred. Will need to set a firm date for specifying an algorithm for this so validation has a specific target.
• SZA: Agreement that we need surface, column and PBL observations for NO2, O3, H2CO in variety of locations to test aspects of the diurnally varying retrieval that depend on: albedo, BRDF, concentration/column, aerosol, and a priori - lightning, fires, high isoprene emitters, fertilized agricultural lands, separation of strat and trop.
• High spatial resolution: Ideas proposed included (surface networks, e.g., TOLNet, GeoTASO, GCAS)
- A variety of experiments should be pursued • Optimal strategies for additional campaigns in addition were discussed.
- Small profiling aircraft (NO2, H2CO, O3, aerosol) with GeoTASO and surface reflectance - Mobile PANDORA - Lightning?
1. Draft radiance and spectroscopy plan
June29,2017 7
• Prepare Earth-shine RGB images for examinations • Compare Earth-shine images with corresponding GOES/EPIC images to see if the
mapping is correct and features are consistent • Look at radiance/irradiance spectra to see if they look reasonable, using spectra from
the GOME instruments as references • Check wavelength assignments to an accuracy of 0.001 nm or better using solar
Fraunhofer lines. • Compare intensities with expected intensities from LEO/EPIC radiance
measurements with similar viewing geometries under the GSICS (Global Space-spaced Inter-Calibration System) framework
• Compare irradiance/radiance spectra with calculated spectra accounting for instrument slit functions and/or using correlative atmospheric trace gas measurements
• Perform fits on selected spectra for O3, NO2, and H2CO and examine the fitted quantities and fitting residuals.
2. Role of Pandoras
June29,2017 8
A separate (from TEMPO) committee was charged by Barry Lefer to provide oversight of the PANDORA network. Priority to locations with ceilometers, sondes and surface observation. Given the EPA commitment to urban locations, priority for NASA sponsored installations to be given to background locations.
3. Next steps
June29,2017 9
Continue discussions. Complete algorithm definition. Put elements of validation plan in writing and vet with wider TEMPO community. Update official TEMPO Science Validation Plan (TEMPO-DRD-11)
Research products and science studies (the Green Paper)
TEMPO is required to spend much of its observing time scanning the full field of regard (FOR) each hour, for as much of the daylight portion of the diurnal cycle as we can arrange (but certainly to 70o solar zenith angle). However, some observing time, perhaps as much as 25%, is available for non-standard observations. Non-standard operations simply mean observing a portion of the FOR (an East/West slice, as North/South is fixed) at higher temporal resolution. A full discussion of research products and science studies is given in the TEMPO Green Paper at http://tempo.si.edu/presentations.html June29,2017 10
Air quality and health
TEMPO’s hourly measurements allow better understanding of the complex chemistry and dynamics that drive air quality on short timescales. The density of TEMPO data is ideally suited for data assimilation into chemical models for both air quality forecasting and for better constraints on emissions that lead to air quality exceedances. Planning is underway to combine TEMPO with regional air quality models to improve EPA air quality indices and to directly supply the public with near real time pollution reports and forecasts through website and mobile applications. As a case study, an OSSE for the Intermountain West was performed to explore the potential of geostationary ozone measurements from TEMPO to improve monitoring of ozone exceedances and the role of background ozone in causing these exceedances (Zoogman et al. 2014). June29,2017 11
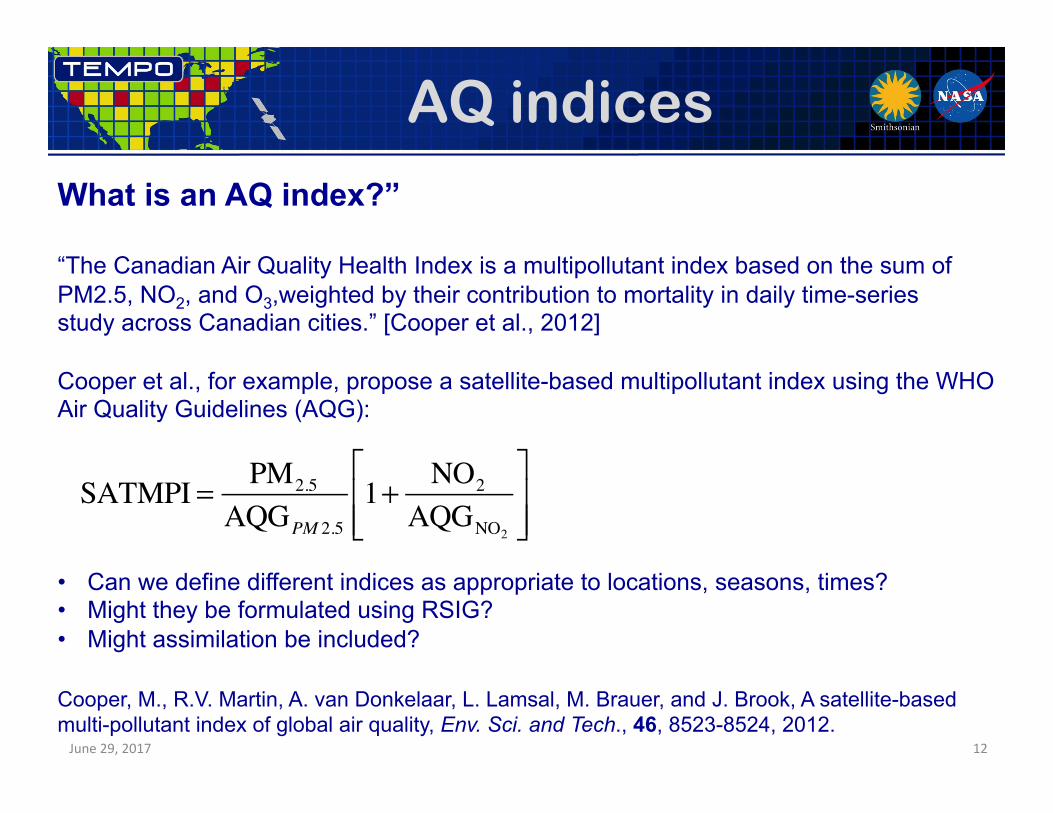
AQ indices What is an AQ index?” “The Canadian Air Quality Health Index is a multipollutant index based on the sum of PM2.5, NO2, and O3,weighted by their contribution to mortality in daily time-series study across Canadian cities.” [Cooper et al., 2012] Cooper et al., for example, propose a satellite-based multipollutant index using the WHO Air Quality Guidelines (AQG): • Can we define different indices as appropriate to locations, seasons, times? • Might they be formulated using RSIG? • Might assimilation be included?
June29,2017
Cooper, M., R.V. Martin, A. van Donkelaar, L. Lamsal, M. Brauer, and J. Brook, A satellite-based multi-pollutant index of global air quality, Env. Sci. and Tech., 46, 8523-8524, 2012.
SATMPI = PM2.5
AQGPM 2.5
1+ NO2
AQGNO2
⎡
⎣⎢⎢
⎤
⎦⎥⎥
12
NOx studies Lightning NOx Interpretation of satellite measurements of tropospheric NO2 and O3, and upper tropospheric HNO3 lead to an overall estimate of 6 ± 2 Tg N y-1 from lightning [Martin et al., 2007]. TEMPO measurements, including tropospheric NO2 and O3, can be made for time periods and longitudinal bands selected to coincide with large thunderstorm activity, including outflow regions, with fairly short notice. Soil NOx Jaeglé et al. [2005] estimate 2.5 - 4.5 TgN y-1 are emitted globally from nitrogen-fertilized soils, still highly uncertain. The US a posteriori estimate for 2000 is 0.86 ± 1.7 TgN y-1. For Central America it is 1.5 ± 1.6 TgN y-1. They note an underestimate of NO release by nitrogen-fertilized croplands as well as an underestimate of rain-induced emissions from semiarid soils. TEMPO is able to follow the temporal evolution of emissions from croplands after fertilizer application and from rain-induced emissions from semi-arid soils. Higher than hourly time resolution over selected regions may be accomplished by special observations. Improved constraints on soil NOx emissions may also improve estimated of lightning NOx emissions [Martin et al. 2000]. June29,2017 13
Traffic, biomass burning
Morning and evening higher-frequency scans The optimized data collection scan pattern during mornings and evenings provides multiple advantages for addressing TEMPO science questions. The increased frequency of scans coincides with peaks in vehicle miles traveled on each coast. Biomass burning The unexplained variability in ozone production from fires is of particular interest. The suite of NO2, H2CO, C2H2O2, O3, and aerosol measurements from TEMPO is well suited to investigating how the chemical processing of primary fire emissions effects the secondary formation of VOCs and ozone. For particularly important fires it is possible to command special TEMPO observations at even shorter than hourly revisit time, probably as short as 10 minutes. June29,2017 14
Halogens BrO will be produced at launch. IO was first measured from by SAO space using SCIAMACHY spectra [Saiz-Lopez et al., 2007]. It will be produced as a scientific product, particularly for coastal studies. The atmospheric chemistry of halogen oxides over the ocean, and in particular in coastal regions, can play important roles in ozone destruction, oxidizing capacity, and dimethylsulfide oxidation to form cloud-condensation nuclei [Saiz-Lopez and von Glasow, 2012]. Providing a measure of the budgets and diurnal evolution of coastal halogen oxides is necessary to understand their role in atmospheric photochemistry of coastal regions. Previous global satellite instruments lacked the sensitivity and spatial resolution to detect the presence of active halogen chemistry over mid-latitude coastal areas. TEMPO observations together with atmospheric models will allow examination of the processes linking ocean halogen emissions and their potential impact on the oxidizing capacity of coastal environments of North America. TEMPO also performs hourly measurements one of the world’s largest salt lakes: the Great Salt Lake in Utah. Measurements over Salt Lake City show the highest concentrations of BrO over the globe. Hourly measurement at a high spatial resolution can improve understanding of BrO production in salt lakes.
June29,2017 15
Spectral indicators Fluorescence and other spectral indicators Solar-induced fluorescence (SIF) from chlorophyll over both land and ocean will be measured. In terrestrial vegetation, chlorophyll fluorescence is emitted at red to far-red wavelengths (~650-800 nm) with two broad peaks near 685 and 740 nm, known as the red and far-red emission features. Oceanic SIF is emitted exclusively in the red feature. SIF measurements have been used for studies of tropical dynamics, primary productivity, the length of carbon uptake period, and drought responses, while ocean measurements have been used to detect red tides and to conduct studies on the physiology, phenology, and productivity of phytoplankton. TEMPO can retrieve both red and far-red SIF by utilizing the property that SIF fills in solar Fraunhofer and atmospheric absorption lines in backscattered spectra normalized by a reference (e.g., the solar spectrum) that does not contain SIF. TEMPO will also be capable of measuring spectral indices developed for estimating foliage pigment contents and concentrations. Spectral approaches for estimating pigment contents apply generally to leaves and not the full canopy. A single spectrally invariant parameter, the Directional Area Scattering Factor (DASF), relates canopy-measured spectral indices to pigment concentrations at the leaf scale. UVB TEMPO measurements of daily UV exposures build upon heritage from OMI and TROPOMI measurements. Hourly cloud measurements from TEMPO allow taking into account diurnal cloud variability, which has not been previously possible. The OMI UV algorithm is based on the TOMS UV algorithm. The specific product is the downward spectral irradiance at the ground (in W m-2 nm-1) and the erythemally weighted irradiance (in W m-2). June29,2017 16
City lights
Nighttime city lights products, which represent anthropogenic activities at the same spatial resolution as air quality products, may be produced twice per day (late evening and early morning) as a research product. Meeting TEMPO measurement requirements for NO2 (visible) implies the sensitivity for city lights products over the CONUS within a 2-hour period at 2×4.5 km2 to 1.1×10⁻⁸ W cm-2 sr-1 µm-1.
June29,2017 17
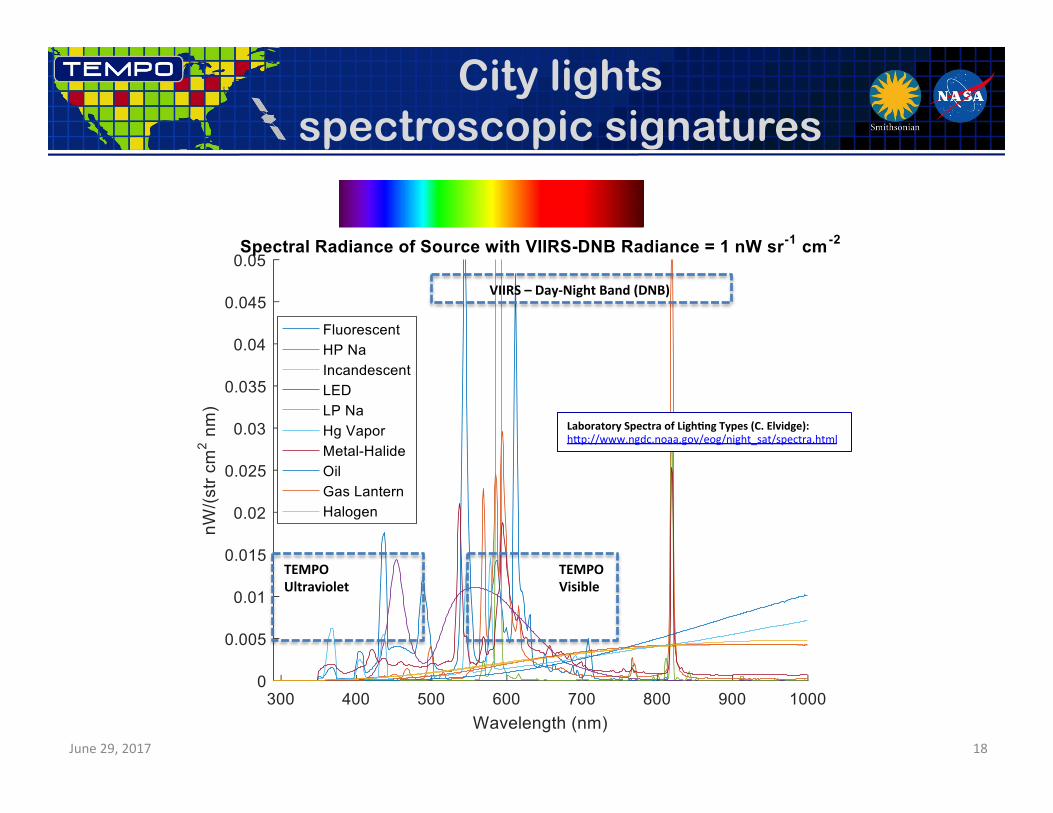
City lights spectroscopic signatures
TEMPOVisible
TEMPOUltraviolet
VIIRS–Day-NightBand(DNB)
LaboratorySpectraofLighFngTypes(C.Elvidge):hJp://www.ngdc.noaa.gov/eog/night_sat/spectra.html
June29,2017 18
June29,2017
The end! Thanks to NASA, ESA, Ball Aerospace &
Technologies Corp., The Boeing Company
19
June29,2017
Backups
20
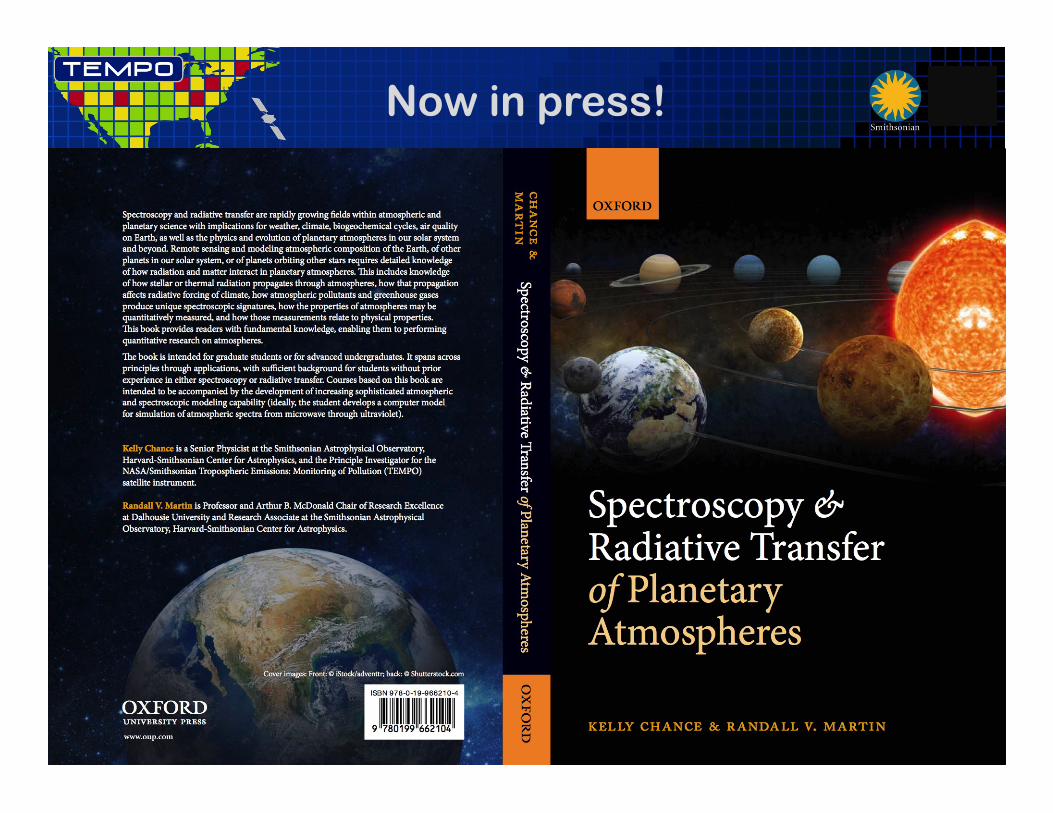
Now in press!
June29,2017 21
TEMPO template
June29,2017 22