Embed Size (px)
Citation preview

Tropical Products Institute·
L3o . Pulping characteristics of three trees of Pinus caribaea with different densities grown in J-amaica

Tropical Products Institute
L3o Pulping characteristics of three trees of Pinus caribaea with different densities grown in Jamaica
March 1973
E. R. Palmer and J. A. Gibbs
Tropical Products Institute 56/62 Gray's Inn Road London WC1X 8LU
Foreign and Commonwealth Office (Overseas Development Administration)
This report was produced by the Tropical Products Institute, a British Government organization which helps developing countries to derive greater benefit from their renewable resources.
lt specializes in post-harvest problems and will be pleased to answer requests for information and advice.
Reproduction of this report, in whole or in part, is gladly permitted provided that full acknowledgement is given to the Tropical Products Institute, Foreign and Commonwealth Office (Overseas Development Administration), and to the authors.
Requests for further information should be addressed to:
The Director Tropical Products Institute 56/62 Gray's Inn Road London WC1X 8LU
Tropical Products Institute ISBN : 0 85954 006 5
ii

Contents
SUMMARIES
Summary
Sommaire
Resumen
INTRODUCTION
SAMPLING
EXPERIMENTAL RESULTS AND DISCUSSION
Apparent density
Chemical analysis
Fibre dimensions
Digestion
Pulp evaluation
Bleaching trials
COMPARISON WITH COMMERCIAL PULPWOODS
CONCLUSIONS
TABLES
Page
2
3
5
5
6
6
6
6
7
7
7
8
8
1 Pinus caribaea from Jamaica-Apparent density 11
2 Pinus caribaea from Jamaica-Chemical analysis 11
3 Pinus caribaea from Jamaica-Digestion and bleaching conditions 12
4 Pinus caribaea from Jamaica-Unbleached sulphate pulp evaluation 13
5 Pinus caribaea from Jamaica-Pulp evaluations at 500 CSf and 300 CSf 14
6 Pinus caribaea from Jamaica-Bieached sulphate pulp evaluation 15
7 Comparative evaluation of unbleached sulphate pulps from other woods 16
iii

APPENDICES Page
Appendix 1 Description of site and growing conditions
General comments 17
Climatic conditions 17
Physical features and soil 18
Natural vegetation 19
Plantation history and growth 19
Appendix 2 Experimental methods
Apparent density of wood 21
Chemical analysis 21
Microscopic examination 21
Pulping methods 22
Unbleached pulp evaluation 22
Bleaching and bleached pulp evaluation 24
iv
Summaries
SUMMARY
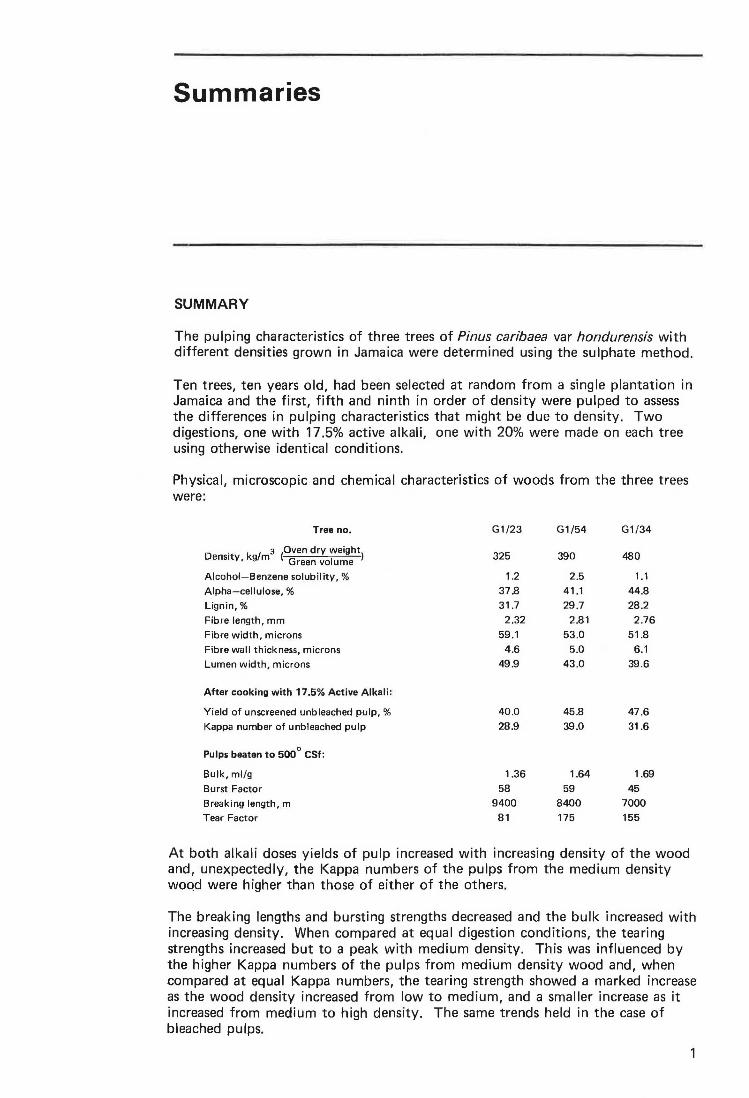
The pulping characteristics of three trees of Pinus caribaea var hondurensis with different densities grown in Jamaica were determined using the sulphate method.
Ten trees, ten years old, had been selected at random from a single plantation in Jamaica and the first, fifth and ninth in order of density were pulped to assess the differences in pulping characteristics that might be due to density. Two digestions, one with 17.5% active alkali, one with 20% were made on each tree using otherwise identical conditions.
Physical, microscopic and chemical characteristics of woods from the three trees were:
Tree no. G1/23 G1/54 G1/34
Density, kg/m3 (0~~~~r~o~~eht) 325 390 480
Alcohol-Benzene solubility,% 1.2 2 .5 1.1
Alpha-cellulose,% 37.8 41 .1 44.8
Lignin,% 31.7 29 .7 28.2
Fibre length, mm 2.32 2.81 2.76
Fibre width, microns 59.1 53 .0 51.8
Fibre wall thickness, microns 4.6 5.0 6.1
Lumen width, microns 49.9 43 .0 39.6
After cooking with 17.5% Active Alkali:
Yield of unscreened unbleached pulp,% 40.0 45 .8 47.6
Kappa number of unbleached pulp 28.9 39 .0 31.6
Pulps beaten to 500° CSf:
Bulk, ml/g 1.36 1.64 1.69
Burst Factor 58 59 45
Breaking length, m 9400 8400 7000
Tear Factor 81 175 155
At both alkali doses yields of pulp increased with increasing density of the wood and, unexpectedly, the Kappa numbers of the pulps from the medium density wood were higher than those of either of the others.
The breaking lengths and bursting strengths decreased and the bulk increased with increasing density. When compared at equal digestion conditions, the tearing strengths increased but to a peak with medium density. This was influenced by the higher Kappa numbers of the pulps from medium density wood and, when compared at equal Kappa numbers, the tearing strength showed a marked increase as the wood density increased from low to medium, and a smaller increase as it increased from medium to high density. The same trends held in the case of bleached pulps.
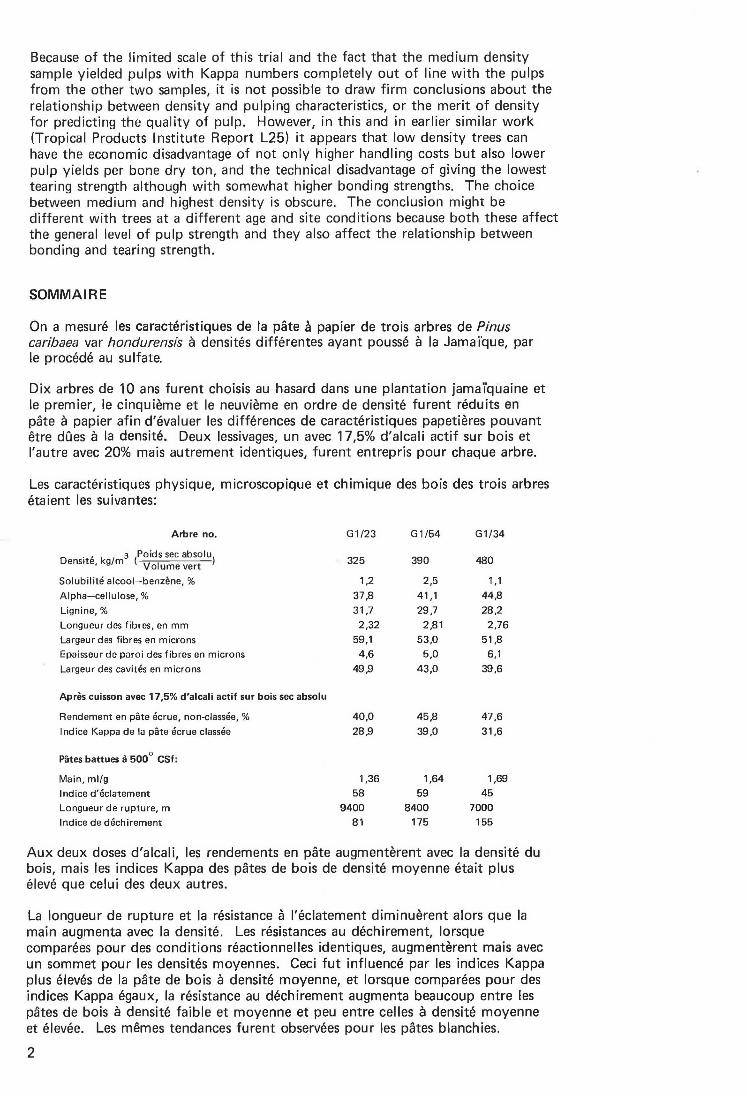
Because of the limited scale of this trial and the fact that the medium density sample yielded pulps with Kappa numbers completely out of line with the pulps from the other two samples, it is not possible to draw firm conclusions about the relationship between density and pulping characteristics, or the merit of density for predicting the quality of pulp. However, in this and in earlier similar work (Tropical Products Institute Report L25) it appears that low density trees can have the economic disadvantage of not only higher handling costs but also lower pulp yields per bone dry ton, and the technical disadvantage of giving the lowest tearing strength although with somewhat higher bonding strengths. The choice between medium and highest density is obscure. The conclusion might be different with trees at a different age and site conditions because both these affect the general level of pulp strength and they also affect the relationship between bonding and tearing strength.
SOMMAIRE
On a mesure les caracteristiques de la pate a papier de trois arbres de Pinus caribaea var hondurensis a densites differentes ayant pousse a la Jamai"que, par le procede au sulfate.
Dix arbres de 10 ans furent choisis au hasard dans une plantation jamai'qi.Jaine et le premier, le cinquieme et le neuvieme en ordre de densite furent reduits en pate a papier afin d'evaluer les differences de caracteristiques papetieres pouvant etre dues a la densite. Deux lessivages, un avec 17,5% d'alcali actif sur bois et l'autre avec 20% mais autrement identiques, furent entrepris pour chaque arbre.
Les caracteristiques physique, microscopique et chimique des bois des trois arbres etaient les suivantes:
Arbre no. G1/23 G1/54 G1/34
0 . , k I 3 toids sec absolu) enstte, 9 m Volume vert 325 390 480
Solubilite alcool-benzene, % 1,2 2,5 1 '1 Alpha-cellulose,% 37,8 41,1 44,8
Lignine,% 31,7 29,7 28,2
Longueur des fibres, en mm 2,32 2,81 2,76
Largeur des fibres en microns 59,1 53,0 51,8
Epaisseur de paroi des fibres en microns 4,6 5,0 6,1
Largeur des cavites en microns 49,9 43,0 39,6
Apres cuisson avec 17,5% d'alcali actif sur bois sec absolu
Rendement en pate ecrue, non-classee, % 40,0 45,8 47,6
I ndice Kappa de la pate ecrue classee 28,9 39,0 31,6
Pates battues a 500° CSf:
Main, ml/g 1,36 1,64 1,69
I nd ice d' eclatement 58 59 45
Longueur de rupture, m 9400 8400 7000
lndice de dechirement 81 175 155
Aux deux doses d'alcali, les rendements en pche augmenterent avec la densite du bois, mais les indices Kappa des pates de bois de densite moyenne etait plus eleve que celui des deux autres.
La longueur de rupture et la resistance a l'eclatement diminuerent alors que la main augmenta avec la densite. Les resistances au dechirement, lorsque comparees pour des conditions reactionnelles identiques, augmenterent mais avec un sommet pour les densites moyennes. Ceci fut influence par les indices Kappa plus eleves de la pate de bois a densite moyenne, et lorsque comparees pour des indices Kappa egaux, la resistance au dechirement augmenta beaucoup entre les pates de bois a densite faible et moyenne et peu entre celles a densite moyenne et elevee. Les memes tendances furent observees pour les pates blanchies.
2

A cause de l'echelle restreinte de ces essais, et du fait que l'echantillon de densite moyenne produisit des pates dont les indices Kappa etaient hors de ligne de ceux des autres echantillons, il n'est pas possible de tirer des conclusions definitives concernant la relation entre la densite et les caracteristiques papetieres ou de se servir de la densite pour predire la qualite de la pate. Cependant, il semblerait d'apres ces travaux et d'autres travaux similaires (Rapport TPI, L25) que les arbres a densite faible ant le desavantage economique d'etre plus couteux au manutention et au transport mais aussi d'avoir des rendements en pate plus faibles par tonne de bois sec absolu, et ant !'inconvenient technique de produire les resistances au dechirure les plus faibles tout en etant d'une liaison entre fibres plus forte. Le choix entre les densites moyennes et elevees n'est pas clair. 11 se peut que les conclusions pour des arbres d'age et de conditions d'emplacement differents ne soient pas les memes etant donne qu'ils ant taus deux un effet sur la resistance de la pate ainsi que sur il rapport entre les resistances au dechirure et la liaison entre fibres.'
RESUMEN
Se determinaron las caracterlsticas de la pulpa de tres arboles de Pinus caribaea var houndurensis con diferentes densidades cultivados en Jamaica, usando para esto el metodo de sulfato.
Se han seleccionado al azar diez arboles, de 10 anos de edad, procedentes de un solo plantfo en Jamaica y el primero, quinto y novena en orden de densidad fueron convertidos en pulpa para determinar las diferencias en las propriedades coma materia prima para pulpa que puedan deberse a la densidad. Se hicieron en cada arbol dos cocciones, una con 17,5% de alcali activo, la otra con 20% usando de otro modo condiciones identicas.
Las caracterfsticas ffsicas, microscopicas y qufmicas de Ios tres arboles fueron:
Arbol no. G1/23 G1/54 G1/34
Densidad k /m3 teso seco absoluto) g Volumen verde 325 390 480
Alcohoi-Benceno solubilidad,% 1 ,2 2,5 1 '1 Alpha-celulosa, % 37,8 41 ,1 44,8 Lignina,% 31,7 29,7 28,2 Longitud de las fibras, mm 2,32 2,81 2,76 Anchura de las fibras, J,tm 59,1 53,0 51,8 Espesor pared fibra, J.!m 4,6 5,0 6,1 Ancho lumen, J,tm 49,9 43,0 39,6
Despues del cocimiento con 17,5% de Alcali Activo:
Rendimiento de pulpa sin depurar ni blanquear,% 40,0 45,8 47,6 Numero Kappa de pulpa sin blanquear 28,9 39,0 31,6
Pulpas batidas a 500° CSf:
Cuerpo (1 /densidad aparente), ml/g 1,36 1,64 1,69 Densidad aparente, g/ml 0 ,74 0 ,61 0,59 Factor de estallido 58 59 45 Longitud de ruptura, m 9400 8400 7000 Factor de rasgado 81 175 155
En ambas dosis de alcali se incremento Ios rendimientos de pulpa con una aumentada densidad de la madera, y inesperadamente, Ios numeros Kappa de las pulpas de madera de mediana densidad fueron mas altos que cualesquiera de Ios otros.
Disminuyeron el longitud de ruptura y la resistencia al estallido, y el cuerpo se incremento con aumentada densidad. Cuando se campararon bajo condiciones iguales de digestion la resistencia de rasgado aumento pero a un maxima con una
3

densidad mediana. Esto influenciado por Ios numeros Kappa mas altos de la pulpa de madera de mediana densidad y cuando se comparo con numeros Kappa iguales, mostro al resistencia de rasgado un aumento acentuado a medida que la densidad se acrecento de baja a mediana y un menor aumento a medida que la densidad se acrecento de mediana a alta. Las mismas tendencias persistieron en el caso de pulpas blanqueadas.
Debido a la limitada escala de este ensayo y al hecho de que la prueba de mediana densidad produjo pulpas con numeros Kappa completamente fuera de I fnea con las pulpas de Ios otros dos ejemplos, no es posible esbozar conclusiones firmes acerca de la relacion entre la densidad de la madera y sus propriedades como materia prima para pulpa, o el merito de densidad para predecir la calidad de la pulpa. Sin embargo, en este como en trabajos anteriores similares ( Reporte TPI L25) parece que Ios arboles de baja densidad pueden tener las desventajas economicas no solamente de costos de manejo, transporte etc mas elevados sino que tambiE'm de un mas bajo rendimiento de pulpa por tonelada absolutamente seca la desventaja tecnica de dar la mas baja resistencia de rasgado aunque resistencia del entrelazamiento de las fibras un tanto mas elevada. La eleccion entre la densidad media y la mas alta no esta clara. La conclusion puede diferir con arboles de una edad y condiciones de sitio diferentes ya que estos dos factores afectan el nivel general de la resistencia de la pulpa asf como de la relacion entre la fuerza de entrelazamiento de las fibras y la resistencia de rasgado.
4
Pulping characteristics of three trees of Pinus caribaea with different densities grown in Jamaica
INTRODUCTION
The many published accounts of the pulping qualities of Pinus caribaea of different ages and from different locations have shown that the species yields pulps of widely varying qualities. Efforts to relate the variations in pulping qualities to variations in such characteristics as density and fibre dimensions have had very limited success. lt was thought that this was partly due to the very wide variation within samples.
In the present investigation pulping trials were made on three trees of widely different density, of exactly the same age from the same plantation in Jamaica.
G. Brown working on a research project at the Commonwealth Forestry Institute (CFI) had examined the physical and microscopical characteristics of ten trees. His findings are given in his unpublished thesis for the degree of D.Phil (Oxon) in 1969, a section of which describing the site conditions and growing stock is given as Appendix 1.
SAMPLING
In his work at Oxford, Brown considered a plantation of Pinus caribaea var hondurensis established in Jamaica in 1956 with seed from British Honduras and sampled in October 1966. He selected an area uniform in topography and in vegetational characteristics and where growth of trees appeared to be unimpeded by other vegetation. Within this area two adjacent plots, each approximately 0.25 acres, were demarcated. From each plot five trees were selected by use of a table of random numbers.
From each tree discs were taken at breast height and each 10% interval of height starting at 5%.
The samples sent to the Tropical Products Institute were from the first, fifth and. ninth trees in order of density. Eight discs from each tree were taken at 5, 15, 25, 35, 45, 55, 65 and 75% of the height.
A composite sample representative of each tree was prepared for pulping by taking a complete disc 0.75 inch thick from each sampling level, chipping the whole disc and thoroughly mixing the chips. This composite sample was used for pulping trials and fibre measurements. Density and chemical characteristics were determined using individual discs or mixtures of discs depending on the amount of material available.
5
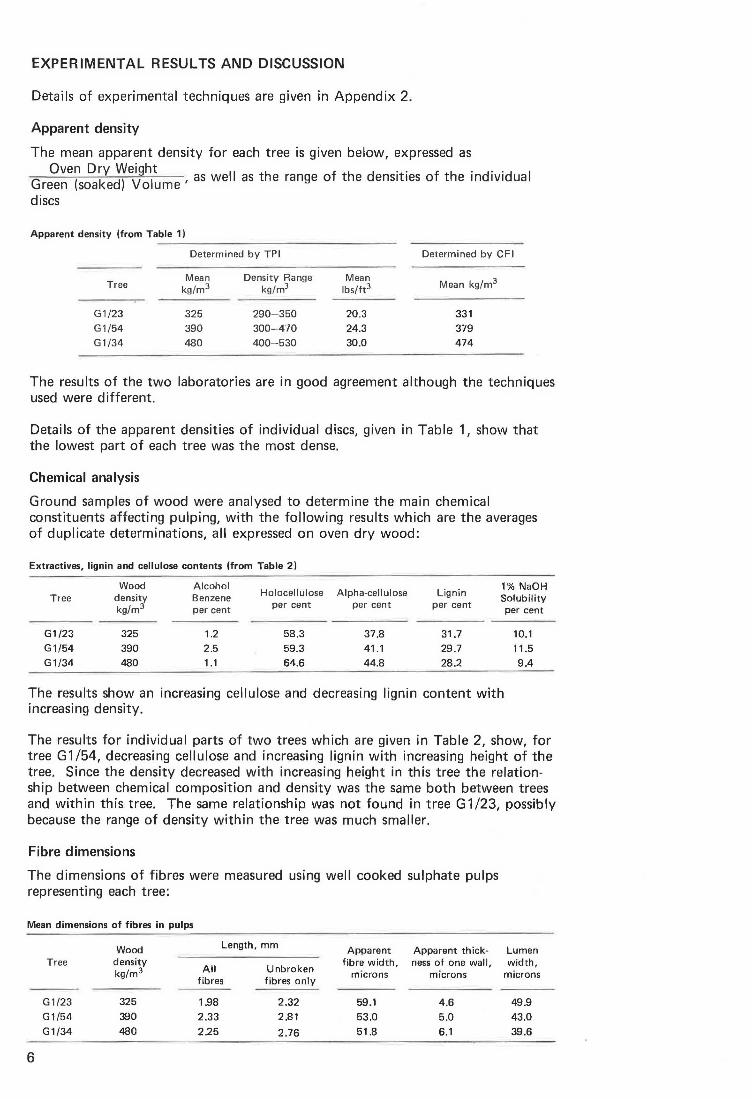
EXPERIMENTAL RESULTS AND DISCUSSION
Details of experimental techniques are given in Appendix 2.
Apparent density
The mean apparent density for each tree is given below, expressed as
Oven Dry Weight 11 h f h d · · f h · d' 'd 1 G ( k d) V I
, as we as t e range o t e ens1t1es o t e 1n lVI ua reen soa e o ume
discs
Apparent density (from Table 1)
Determined by TPI Determined by CFI
Tree Mean
kg/m3
G1/23 325 G1/54 390
G1/34 480
Density Range kg/m3
290- 350 300-470
400-530
Mean lbs/ft3
20.3 24.3 30.0
Mean kg/m3
331
379 474
The results of the two laboratories are in good agreement although the techniques used were different.
Details of the apparent densities of individual discs, given in Table 1, show that the lowest part of each tree was the most dense.
Chemical analysis
Ground samples of wood were analysed to determine the main chemical constituents affecting pulping, with the following results which are the averages of duplicate determinations, all expressed on oven dry wood:
Extractives, lignin and cellulose contents (from Table 2)
Wood Tree density
kg/m3
Alcohol Holocellulose Alpha-cellulose Lignin
1% NaOH Benzene Solubility per cent per cent per cent per cent per cent
G1/23 325 1.2 58.3 37.8 31.7 10.1 G1/54 390 2 .5 59.3 41.1 29.7 11.5 G1/34 480 1.1 64.6 44.8 28.2 9.4
The results show an increasing cellulose and decreasing lignin content with increasing density.
The results for individual parts of two trees which are given in Table 2, show, for tree G1 /54, decreasing cellulose and increasing lignin with increasing height of the tree. Since the density decreased with increasing height in this tree the relationship between chemical composition and density was the same both between trees and within this tree. The same relationship was not found in tree G 1/23, possibly because the range of density within the tree was much smaller.
Fibre dimensions
The dimensions of fibres were measured using well cooked sulphate pulps representing each tree:
Mean dimensions of fibres in pulps
Wood Length, mm Apparent Apparent thick-Tree density
All Unbroken fibre width, ness of one wall,
kg/m3 fibres fibres only
microns microns
G1/23 325 1.98 2.32 59_1 4.6 G1/54 390 2.33 2.81 53.0 5.0
G1/34 480 2.25 2.76 51.8 6.1
6
Lumen width,
microns
49.9 43.0
39.6

The fibre length was measured twice, once including all fibrous elements, the second time including only complete fibres. Although there was no significant difference in the fibre length of the two more dense samples, the tendency was for fibre length to increase with density. The fibre wall thickness increased with density and the apparent width decreased. The fibres in pulp tend to collapse into ribbons, thick walled fibres do not collapse as much as thin walled ones, and this affected the difference in apparent width.
Digestion
Because of the limited amount of wood available, it was decided to do two digestions on each sample; it was hoped that one of each pair would give a pulp with a Kappa number about 40, and the other a pulp which would be bleachable, with a Kappa number about 25. Full details of the digestion conditions, yields and Kappa numbers of the pulps are given in Table 3, but as the summary below shows, the Kappa numbers of both of the pulps from the medium density sample were inconsistent with the others. The screening rejects after the cook with 17.5% active alkali were also exceptionally high with this sample.
Digestion - Summary of Table 3
Density Active Alkali Yield, screened Kappa number Tree kg/m3 added % o.d. wood oven-dry pulp of screened pulp
% o.d. wood
G1/23 325 17.5 44.0 28.9 20 41.9 21.3
G1/54 390 17.5 45.8 39 .0
20 43.7 27.3
G1/34 480 17.5 47.6 31.6
20 45.3 21.5
This result was unexpected; it would be slightly more difficult for the digestion liquor to penetrate the more dense samples, but their lower lignin content was expected to counteract this, and result in small differences in Kappa numbers. However, with both sets of conditions the medium density wood had a significantly higher Kappa number. The yield of pulp from the dense sample was expected to be the highest, reflecting the highest alpha-cellulose content and this was found in practice.
Unfortunately, the amount of wood available made it impossible to repeat the digestions, but all analyses have been repeated and confirm the original results and since both cooks on the medium density sample were out of line we are confident that the analytical data were right in respect to these samples. We cannot explain it.
Pulp evaluation
Evaluations of the unbleached pulps by British Standard Methods are given in full in Table 4 and interpolated results at 500 and 300 Canadian Standard freeness in Table 5.
In general the bulk and tear factor of the pulp increases with the density of the original wood whilst the bonding strengths (breaking length and burst factor) fall. When compared at equal digestion conditions the tear factors of the pulps from medium density woods do not fit in with this statement, but when compared at approximately equal Kappa numbers they do.
Bleaching trials
The pulp from each sample with the lower Kappa number was bleached with a four stage sequence of chlorination, alkali extraction, sodium hypochlorite and chlorine dioxide. The details of bleaching conditions are given in Table 3.
7

The pulp from the medium density wood had the highest chlorine consumption and the lowest brightness. This was expected as this unbleached pulp had the highest Kappa number. Although the brightness achieved was not very high compared with the best bleached pulps that are available, the results were considered satisfactory because a fully bleached commercial pulp is produced using a sequence of six or more stages and the four stage sequence used in this trial is more like that used to produce a semi-bleached pulp.
Evaluations of the bleached pulps are given in full in Table 6 and interpolated results at 500 and 300 CSf in Table 5. As with the unbleached pulp the trend was for bulk and tear to increase with density of wood and for bonding strengths (breaking length and burst) to decrease. The tearing strength of the pulp from the medium density wood again departs from this, but this was most probably due to the higher Kappa number of the unbleached pulp.
When determining the optical properties of the pulp both the printing opacity of the sheets and the specific scattering co-efficient were determined. The printing opacity of the sheets was valid only for sheets of the substance measured (approximately 60 g/m 2
) but the specific scattering co-efficient, depending on the fibre and the pulping method used, can be used to calculate the opacity at any substance. There was a significant difference in the specific scattering co-efficient of the fibres of the three trees, when unbeaten, showing a reduction in scattering co-efficient with increasing density. However there was much less difference when the pulps beaten had been beaten to 500 and 300 CSf, so that the differences were not of practical importance. In all cases the scattering co-efficients were lower than that usually found in commercial bleached Kraft pine pulps (185 to 210 for pulps at 500 CSf, 150 to 185 for pulps at 250 CSf) but similar to those we have found in other samples of Pinus caribaea.
COMPARISON WITH COMMERCIAL PUlPS
lt is not possible to draw any firm conclusions about the potential value of Pinus caribaea grown in Jamaica for pulpwood, because there was significant differences between the three trees and it is not known what proportion of each type there is in the plantations or how they behave when pulped in mixture. However some tentative conclusions by comparison with the results of pulp evaluations for a number of pulpwoods used commercially given in Table 7. lt is likely that a pulp approaching the strength characteristics of Southern Pine pulp could be made.
CONCLUSIONS
With the exception of the Kappa number of unbleached pulp, the wood and pulp characteristics showed definite trends with increasing density of wood as follows:
1. Alpha-cellulose in wood increases 2. Lignin in wood decreases 3. Length and wall thickness of pulp fibres increase 4. Apparent width of pulp fibres decreases, partly because the greater wall thick-
ness reduces the collapse of the fibres into ribbons 5. Pulp yield (total and screened) increases 6. Bulk and Tearing strength increase 7. Breaking Length and Bursting strength decrease
The one characteristic measured which showed no trend was the Kappa number of the unbleached pulp. (The Kappa number is a measure of the residual lignin in the pulp). When all three trees were pulped by identical conditions, there was little difference in the Kappa number of the pulps from the least and most dense trees but that of pulp from the medium density tree was much higher. This
8
pattern was obtained at two levels of alkali dose. We can offer no explanation of this finding.
In some ways these conclusions are similar to our findings in an earlier study using Pinus caribaea from Sabah (TPI Report L25, 1971 ). In that investigation it was noted that the densities of the least dense tree (385 kg/m 3
) and the most dense tree (550 kg/m 3
) were far apart, so it was decided to make separate pulps from each and to compare them with pulp from a bulk sample from six trees with a mean density of 445 kg/m 3
• On that occasion, when the same digestion conditions were applied to the two extreme trees and the bulk sample, the pulp from the extreme trees had the same Kappa number (34.4 and 34.6) but the Kappa number of the pulp from the bulk sample was significantly higher (39.7). When the strengths of pulps from the extreme trees were compared the same relationships were found as in the present work.
The results for the medium density sample did not fit in this pattern. However, in the case of the Sabah sample, the anomaly was thought to be due to the medium density sample being a mixture from six trees of different densities rather than from one tree.
9


Tables
Table 1
Pinus caribaea from Ja.maica
Apparent density
Tree number G1 /23 G1/54 G1!34
Height of disc wi·thin Density Density Density tree
% total height kg/m3 lb/ft3 kg/m3 lb/ft3 kg/ m3 lb/ft3
5 347 21 .7 471 29.4 530 33.1 15 340 212 408 25.5 528 32.9 25 312 19.5 384 24.0 481 30.0 35 320 20.0 360 22 .5 467. 29.1 45 306 19 .1 341 21 .3 435 27.2 55 305 19.0 334 20 .8 423 26.4 65 316 19.7 328 20.5 416 26.0 75 290 18.1 302 18 .8 400 25.0
Mean for tree 325 20.2 390 24.2 480 30.0
Table 2
Pinus caribaea from Jamaica
Dlemil:al analysis
Tree Height of Alcohol
Holo Alpha % NaOH number
sample d isc benzene cellulose cellulose
Lignin solubility % total height extractives
% % % % %
G1/23 5, 15 1.4 552 36.0 33.0 11 .6 25 , 35 1.0 62 .8 40.2 31.3 9 .8
45 ,55 , 65,75 1.1 57.0 372 30.8 9 .0
G1/54 5 2.4 60.8 44 .9 29 .2 10.6 15,25 3.0 58 .9 41.4 29 .1 12 .6 35,45 2 .2 68.4 39 .8 30.0 12 .1
56, 65, 75 2.2 69.2 38.4 30.4 10.6
G1/34 All 1.1 64.6 44.8 28 .2 9.4
11

..... I'J
Table 3
Pinus caribaea from Jamaica
Digestion and bleaching conditions
Digestion conditions:
Tree number Density of wood, kg/m3
Cook number
Active Alkali as Na2 0 % oven dry wood Sulphidity % Liquor to oven dry wood ratio, litres/kg Maximum temperature, °C Time to reach max temperature, hours Time at max temperature, hours Active Alkali consumed as Na2 0 % oven dry wood
Yield of unbleached pulp: Oven dry digested pulp% oven dry wood Oven dry screenings on 0 .15 mm slots% oven dry digested pulp Oven dry Screened Pulp% oven dry wood Kappa Number of Unbleached Pulp (Screened)
Bleaching conditions: 1. CHLORINATION (Pulp consistency 3%,1 hour, 20°C)
Chlorine added as Cl2 % oven dry unbleached pulp 2. ALKALI EXTRACTION (Pulp consistency 6%, 1 hour, 60°C)
NaOH% oven dry unbleached pulp 3. HYPOCHLORITE (Pulp consistency 6%,2 hours, 35°C)
Available chlorine added as Cl2% oven dry unbleached pulp 4. CHLORINE DIOXIDE (Pulp consistency 6%,3 hours, 70°C)
Chlorine dioxide added as equivalent Cl2% oven dry unbleached pulp
TOTAL CHLORINE ADDED as Cl2% oven dry unbleached pulp TOTAL CHLORINE CONSUMED as Cl2 % 9ven dry unbleached pulp
Yield of bleached pulp Oven dry bleached pulp % oven dry wood Brightness, (Eirepho , 457 nm filter MgO = 100%)
G1/23 325
K378 K380
17.5 20 25 25
6:1 6 :1 170 170
1 1 4 4
14.4 14.4
44.0 41.9 less than 0.1 less than 0.1
44.0 41.9 28.9 21 .3
5 .6
3
1.0
2.6
9.2 8.3
40.0 81
G1 /54 G1/34 390 480
K371 K370 K382 K383
17.5 20 17.5 20 25 25 25 25
6:1 6 :1 6 : 1 6 :1 170 170 170 170
1 1 1 4 4 4 4
13.5 15.2 13.7 14.5
45.8 43.7 47.6 45.3 4.4 0.5 1.8 1.3
43.8 43.5 46.7 44.7 39.0 27.3 31.6 21 .5
7 .6 5 .7
3 3
1.0 1.0
2.6 2.6
11.2 9 .3 10.2 8.4
41.0 42 .6 76 80
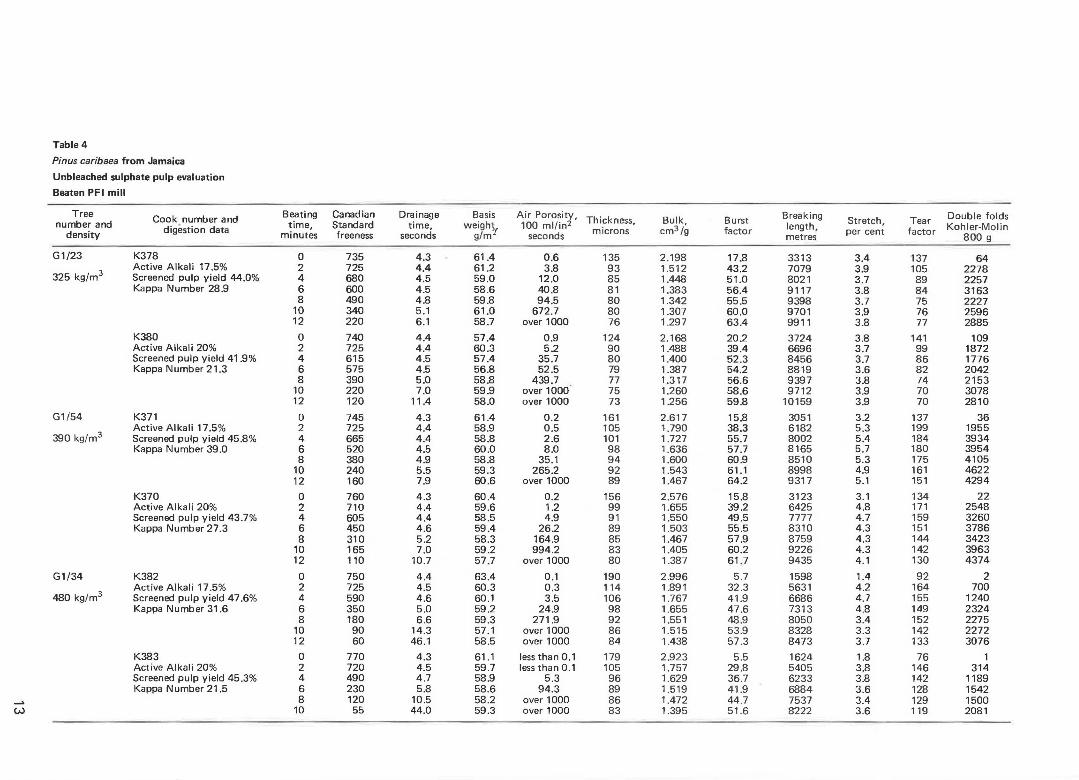
Table 4
Pinus caribaea from Jamaica
Unbleached sulphate pulp evaluation
Beaten PFI mill
Tree Cook number and Beating Canadian Drainage Basis Air Porosity, . Bulk, Burst Breaking Stretch, Tear Double folds number and digestion data time, Standard time, weigh\- 100 ml/in2 Th1_ckness,
cm3/g factor length, factor Kohler-Mol in density minutes freeness seconds g/m seconds microns metres per cent 800 g
G1/23 K378 0 735 4.3 61.4 0 .6 135 2.198 17.8 3313 3.4 137 64
325 kg/m3 Active Alkali 17.5% 2 725 4.4 61.2 3.8 93 1.512 43.2 7079 3.9 105 2278 Screened pulp yield 44.0% 4 680 4.5 59.0 12.0 85 1.448 51 .0 8021 3.7 89 2257 Kappa Number 28.9 6 600 4.5 58.6 40.8 81 1.383 56.4 9117 3.8 84 3163
8 490 4.8 59.8 94.5 80 1.342 55 .5 9398 3.7 75 2227 10 340 5.1 61.0 672.7 80 1.307 60.0 9701 3.9 76 2596 12 220 6.1 58.7 over 1000 76 1.297 63.4 9911 3.8 77 2885
K380 0 740 4.4 57.4 0.9 124 2.168 20.2 3724 3.8 141 109 Active Alkali 20% 2 725 4.4 60.3 5.2 90 1.488 39.4 6696 3.7 99 1872 Screened pulp yield 41 .9% 4 615 4 .5 57.4 35.7 80 1.400 52 .3 8456 3 .7 86 1776 Kappa Number 21 .3 6 575 4.5 56.8 52 .5 79 1.387 54.2 8819 3.6 82 2042
8 390 5.0 58.8 439.7 77 1.317 56.6 9397 3.8 74 2153 10 220 7 .0 59.9 over 1000 75 1.260 58.6 9712 3 .9 70 3078 12 120 11.4 58.0 over 1000 73 1.256 59.8 10159 3.9 70 2810
G1/54 K371 0 745 4.3 61.4 0.2 161 2.617 15.8 3051 3.2 137 36 Active Alkali 17.5% 2 725 4.4 58.9 0.5 105 1.790 38.3 6182 5.3 199 1955
390 kg/m3 Screened pulp yield 45.8% 4 665 4.4 58.8 2.6 101 1.727 55.7 8002 5.4 184 3934 Kappa Number 39 .0 6 520 4.5 60.0 8.0 98 1.636 57.7 8165 5.7 180 3954
8 380 4 .9 58.8 35.1 94 1.600 60.9 8510 5 .3 175 4105 10 240 5.5 59 .3 265.2 92 1.543 61.1 8998 4.9 161 4622 12 160 7.9 60.6 over 1000 89 1.467 64.2 9317 5.1 151 4294
K370 0 760 4 .3 60.4 0.2 156 2.576 15.8 3123 3.1 134 22 Active Alkali 20% 2 710 4.4 59 .6 1.2 99 1.655 39.2 6425 4.8 171 2548 Screened pulp yield 43.7% 4 605 4.4 58 .5 4.9 91 1.550 49.5 7777 4.7 159 3260 Kappa Number 27.3 6 450 4.6 59.4 26.2 89 1.503 55.5 8310 4 .3 151 3786
8 310 5.2 58.3 164.9 85 1.467 57.9 8759 4.3 144 3423 10 165 7.0 59.2 994.2 83 1.405 60 .2 9226 4.3 142 3963 12 110 10.7 57.7 over 1000 80 1.387 61.7 9435 4 .1 130 4374
G1/34 K382 0 750 4.4 63.4 0.1 190 2.996 5 .7 1598 1.4 92 2 Active Alkali 17 .5% 2 725 4 .5 60 .3 0 .3 114 1.891 32 .3 5631 4 .2 164 700
480 kg/m3 Screened pulp yield 47.6% 4 590 4.6 60.1 3.5 106 1.767 41.9 6686 4.7 155 1240 Kappa Number 31.6 6 350 5.0 59.2 24.9 98 1.655 47.6 7313 4.8 149 2324
8 180 6 .6 59.3 271 .9 92 1.551 48 .9 8050 3.4 152 2275 10 90 14.3 57.1 over 1000 86 1.515 53.9 8328 3.3 142 2272 12 60 46 .1 58.5 over 1000 84 1.438 57 .3 8473 3.7 133 3076
K383 0 770 4.3 61 .1 less than 0.1 179 2.923 5 .5 1624 1.8 76 1 Active Alkali 20% 2 720 4.5 59.7 less than 0.1 105 1.757 29.8 5405 3.8 146 314 Screened pulp yield 45.3% 4 490 4.7 58.9 5 .3 96 1.629 36.7 6233 3.8 142 1189 Kappa Number 21 .5 6 230 5 .8 58.6 94.3 89 1.519 41.9 6884 3.6 128 1542
8 120 10.5 58 .2 over 1000 86 1.472 44.7 7537 3.4 129 1500 w 10 55 44.0 59 .3 over 1000 83 1.395 51.6 8222 3.6 119 2081
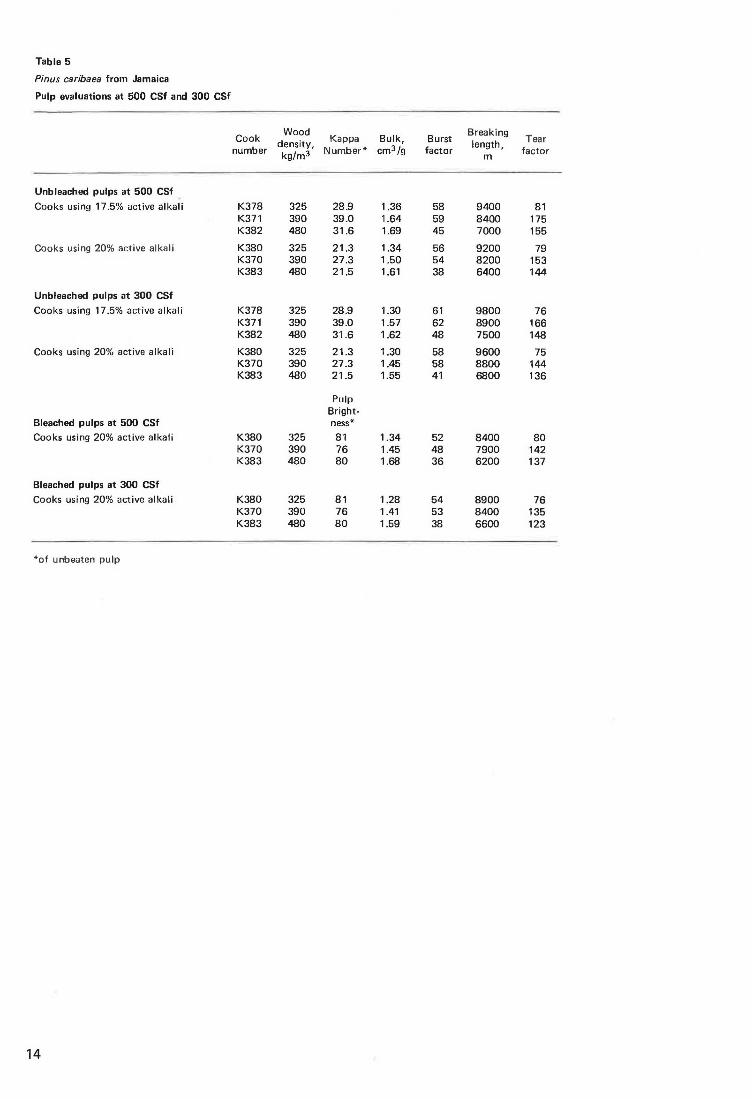
Table 5
Pinus caribaea from Jamaica
Pulp evaluations at 500 CSf and 300 CSf
Cook Wood
Kappa Bulk, Burst Breaking
Tear number
density, Number* cm3 /g factor
length, factor kg/m3 m
Unbleached pulps at 500 CSf
Cooks using 17.5% active alkali K378 325 28.9 1.36 58 9400 81 K371 390 39.0 1.64 59 8400 175 K382 480 31 .6 1.69 45 7000 155
Cooks using 20% active alkali K380 325 21.3 1.34 56 9200 79 K370 390 27.3 1.50 54 8200 153 K383 480 21.5 1.61 38 6400 144
Unbleached pulps at 300 CSf
Cooks using 17.5% active alkali K378 325 28.9 1.30 61 9800 76 K371 390 39.0 1.57 62 8900 166 K382 480 31 .6 1.62 48 7500 148
Cooks using 20% active alkali K380 325 21.3 1.30 58 9600 75 K370 390 27.3 1.45 58 8800 144 K383 480 21.5 1.55 41 6800 136
Pulp Bright-
Bleached pulps at 500 CSf ness*
Cooks using 20% active alkali K380 325 81 1.34 52 8400 80 K370 390 76 1.45 48 7900 142 K383 480 80 1.68 36 6200 137
Bleached pulps at 300 CSf
Cooks using 20% active alkali K380 325 81 1.28 54 8900 76 K370 390 76 1.41 53 8400 135 K383 480 80 1.59 38 6600 123
*of unbeaten pulp
14
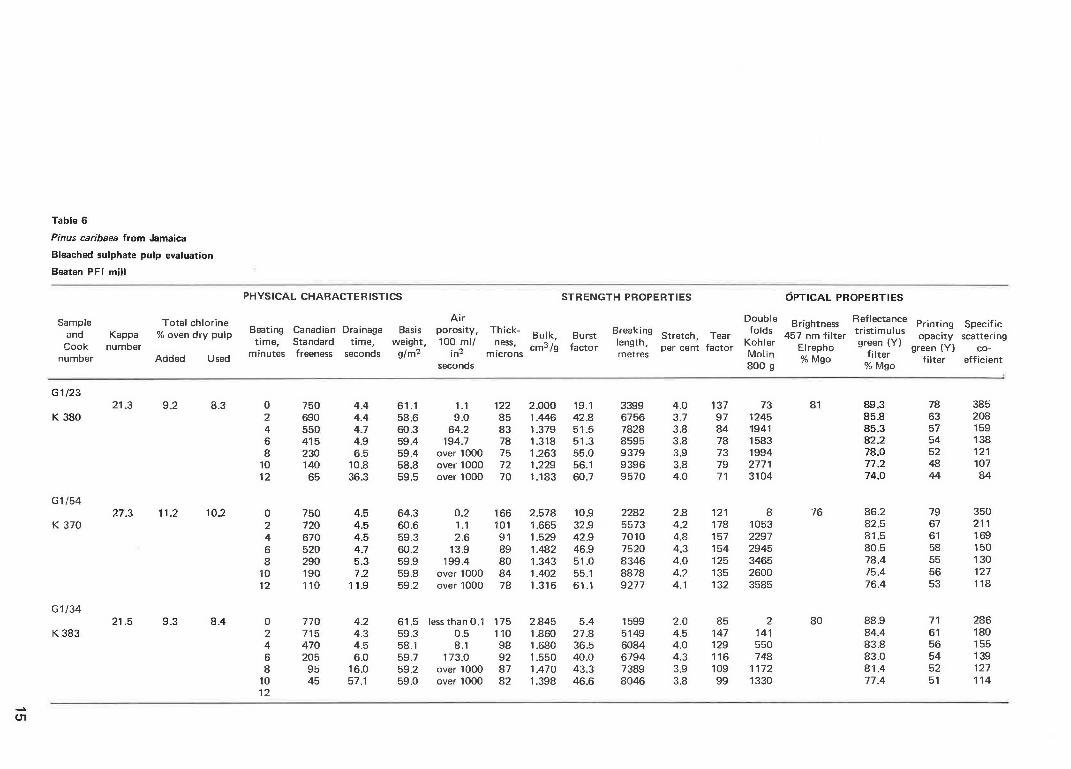
Table 6
Pinus caribaea from Jamaica
Bleached sulphate pulp evaluation
Beaten PFI mill
PHYSICAL CHARACTERISTICS STRENGTH PROPERTIES OPTICAL PROPERTIES
Sample Total chlorine Air Double B . h Reflectance p . . T
and Kappa %oven dry pulp Beating Canadian Drainage Basis porosity, Thick- Bulk, Burst Breaking folds ng tn~ss tristimulus nntl_ng Spec! _1c
1 h Stretch, Tear Kohler 457 nm f1lter reen (V) opac1ty scattenng
Cook number time, Standard time, weight, 100 ml/ ness, cm3/g factor engt • per cent factor M 1. Elrepho g f"l green (V) eo-
number Added Used minutes freeness seconds g/m2 in2 m1crons metres 0 In o/c M I ter n ff" . seconds 800 g o go % Mgo 1 ter e 1c1ent
G1/23 21.3 9.2 8.3 0 750 4.4 61.1 1.1 122 2.000 19.1 3399 4.0 137 73 81 89.3 78 385
K 380 2 690 4.4 58.6 9.0 85 1.446 42.8 6756 3.7 97 1245 85.8 63 208 4 550 4.7 60.3 64.2 83 1.379 51.5 7828 3.8 84 1941 85.3 57 159 6 415 4.9 59.4 194.7 78 1.318 51.3 8595 3.8 78 1583 82.2 54 138 8 230 6.5 59.4 over 1000 75 1.263 55.0 9379 3.9 73 1994 78.0 52 121
10 140 10.8 58.8 over 1000 72 1.229 56.1 9396 3.8 79 2771 77.2 48 107 12 65 36.3 59.5 over 1000 70 1.183 60.7 9570 4.0 71 3104 74.0 44 84
G1/54 27.3 11.2 10.2 0 750 4.5 64.3 0.2 166 2.578 10.9 2282 2.8 121 8 76 86.2 79 350
K 370 2 720 4.5 60.6 1.1 101 1.665 32.9 5573 4.2 178 1053 82.5 67 211 4 670 4.5 59.3 2.6 91 1.529 42.9 7010 4.8 157 2297 81.5 61 169
6 520 4.7 60.2 13.9 89 1.482 46.9 7520 4.3 154 2945 80.5 58 150
8 290 5.3 59.9 199.4 80 1.343 51.0 8346 4.0 125 3465 78.4 55 130 10 190 7.2 59.8 over 1000 84 1.402 55.1 8878 4.2 135 2600 75.4 56 127 12 110 11.9 59.2 over 1000 78 1.316 61.1 9277 4.1 132 3585 76.4 53 118
G1/34 21.5 9.3 8.4 0 770 4.2 61.5 less than 0.1 175 2.845 5.4 1599 2.0 85 2 80 88.9 71 286
K 383 2 715 4.3 59.3 0.5 110 1.860 27.8 5149 4.5 147 141 84.4 61 180 4 470 4.5 58.1 8.1 98 1.680 36.5 6084 4.0 129 550 83.8 56 155 6 205 6.0 59.7 173.0 92 1.550 40.0 6794 4.3 116 748 83.0 54 139 8 95 16.0 59.2 over 1000 87 1.470 43.3 7389 3.9 109 1172 81.4 52 127
10 45 57.1 59.0 over 1000 82 1.398 46.6 8046 3.8 99 1330 77.4 51 114 12
_. (11
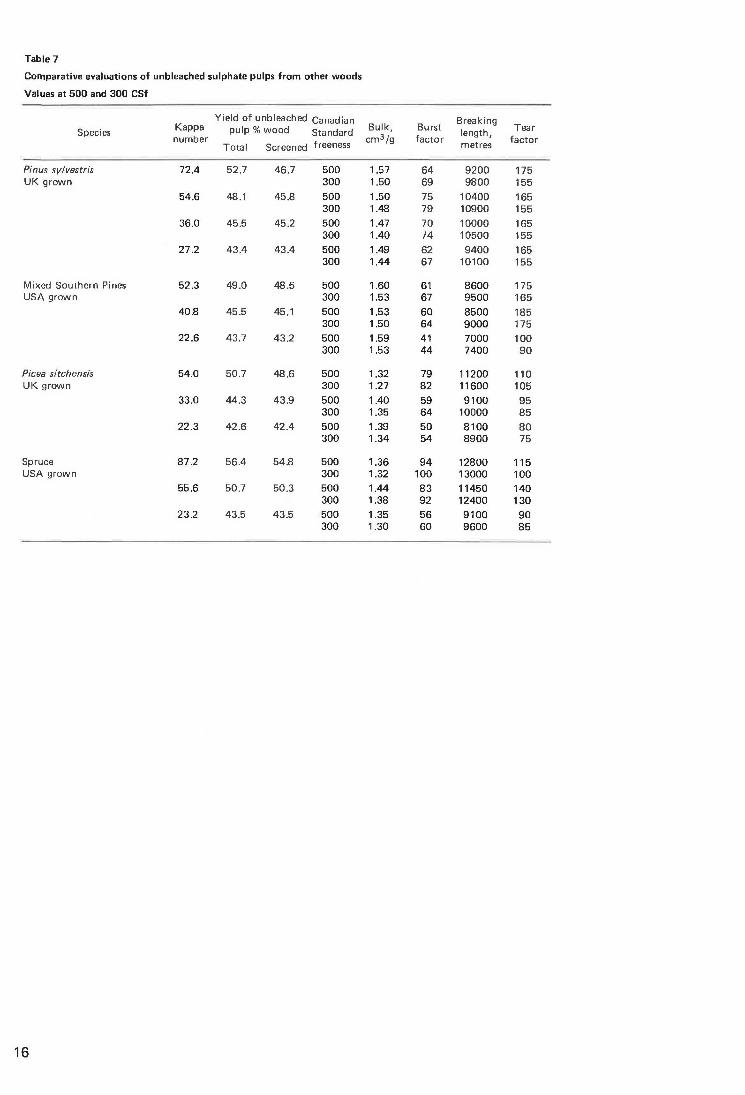
Table 7
Comparative evaluations of unbleached sulphate pulps from other woods
Values at 500 and 300 CSf
Kappa Yield of unbleached Canadian
Bulk, Burst Breaking
Species pulp% wood Standard length, Tear number cm 3 /g factor factor
Total Screened freeness metres
Pinus sylvestris 72.4 52.7 46.7 500 1.57 64 9200 175 UK grown 300 1.50 69 9800 155
54.6 48.1 45.8 500 1.50 75 10400 165 300 1.48 79 10900 155
36.0 45.5 45.2 500 1.47 70 10000 165 300 1.40 74 10500 155
27.2 43.4 43.4 500 1.49 62 9400 165 300 1.44 67 10100 155
Mixed Southern Pines 52.3 49.0 48.5 500 1.60 61 8600 175 USA grown 300 1.53 67 9500 165
40.8 45.5 45.1 500 1.53 60 8500 185 300 1.50 64 9000 175
22.6 43.7 43.2 500 1.59 41 7000 100 300 1.53 44 7400 90
Picea sitchensis 54.0 50.7 48.6 500 1.32 79 11200 110 UKgrown 300 1.27 82 11600 105
33.0 44.3 43.9 500 1.40 59 9100 95 300 1.35 64 10000 85
22.3 42.6 42.4 500 1.39 50 8100 80 300 1.34 54 8900 75
Spruce 87.2 56.4 54.8 500 1.36 94 12800 115 USA grown 300 1.32 100 13000 100
55.6 50.7 50.3 500 1.44 83 11450 140 300 1.38 92 12400 130
23.2 43.5 43.5 500 1.35 56 9100 90 300 1.30 60 9600 85
16

Appendix 1 Description of site and growing conditions*
1. General comments
The material used in this study was collected in Jamaica where largescale planting of Pinus caribaea has been done since 1960. The plantation from which the samples were taken was established in 1956. it is situated at Gourie, in the north central part of the Island where the geographic co-ordinates are 18° 10' latitude (North) and 7r 31' longitude (West). The plantation was established from seeds imported from British Honduras, and records indicate that these seeds were collected from mother trees of the same provenance. However, because seeds were selected indiscriminately over the range of the provenance, it is reasonable to assume that a substantial proportion of the total variation within the provenance is represented in the Jamaican plantations.
The results contained in this study are based on ten trees sampled in October 1966 when the plantation was ten years old.
2. Climatic conditions
Climatological data are available from two stations in the area, namely Christiana and Holmwood, which are situated two and three miles respectively from the site of the plantation. These records are presented in Tables 2.1 .and 2.2. The mean annual rainfall for the period 1954-60 was 69.04 inches with a wide variation between the driest year 1959 (52.03 inches) and the wettest year 1960 (83.40 inches). The ninety-one year average (1871-1962) for the area was 70.46 inches. Unfortunately, records for the year 1961 to 1966 were not available from the two stations mentioned. The wettest months over the reported period were May and October with an average rainfall of 7.98 and 9.98 inches respectively, whilst the driest months were February and December with averages of 2.68 and 3.53 inches respectively. In most years it seems that the distribution of rainfall would allow continuous growth of trees.
Here again the data up to 1966 was lacking at the two stations, but from experience with the area, large fluctuations are not usual. Mean annual maximum temperature was 79.3° F. The hottest months were July to November with mean temperatures in the low 80s. The coldest months were between December and February when the mean temperature ranged between 52.9 and 55.1° F.
*The whole of this appendix is reproduced from the thesis submitted by G. Brown in 1969 for the degree of D.Phil. (Oxon).
17

Table 2.1
Mean monthly rainfall at Christiana (inches)
1954-1960 plus 91 year average (1871-1962)
Year Jan Feb Mar Apr May June July Aug Sept Oct Nov Dec Mean for
year
1954 3.53 6.08 5 .89 5.59 4.97 5.28 2 .85 7.53 13.51 7 .63 3.40 0.86 67.12
1955 5.19 2 .38 3 .65 2 .68 6.24 5 .94 6 .08 7 .89 7 .62 5 .48 3.35 5.43 61.93
1956 3.14 0 .52 7.21 3 .34 12.51 6.95 4 .65 3 .82 6 .13 13.59 5 .48 7 .28 74.62
1957 8.86 5 .53 5.92 7.00 6.51 1.19 4.81 4.42 8.11 8 .27 2.17 4.66 67.45
1958 7.53 0.85 0 .61 1.71 10.74 15.81 4.64 7 .10 8.33 17.50 1.25 0.70 76.77
1959 0 .62 3.23 3 .79 5.10 6 .37 0.86 1.99 5 .00 3.54 8 .76 7.51 5.26 52.03
1960 13.41 0 .2 5 .53 9 .88 8 .57 12.37 4 .17 7 .74 4 .19 8 .64 8.14 0 .56 83.40
Mean 6.04 2.68 4 .65 5.04 7.98 6.91 4.17 6.21 7.34 9 .98 4.47 3.53 69.04
1871-1962 2.35 2 .75 3 .91 6.64 8 .38 6.06 4.30 7.15 8.57 11.38 6.23 2.74 60.46
Mean maximum and minimum temperature and relative humidity are shown in Table 2.2 for the years 1955 to 1959.
Table 2.2
Mean maximum and minimum temperatures and relative humidity at Holmwood 18°091N 77°31 'w-
3004 feet above M.S.L.
Period 1955-1959
Mean maximum Mean minimum Mean relative Mean relative temperature temperature humidity 7 am humidity 3 pm
Jan 76.3 54.6 95 82
Feb 76.7 54.6 94 85
Mar 78 .5 55 .1 93 83
Apr 79 .1 56.1 92 82
May 79.1 57.3 92 85
June 79.4 58.1 92 87
July 80 .3 58.4 92 88
Aug 83.2 58.5 88 84
Sept 81 .4 59.5 91 86
Oct 80 .0 56.6 94 90
Nov 80.1 55.5 95 87
Dec 78 .0 52.9 93 86
Mean/Year 79.3 56.5 92 85
Mean relative humidity at 7.00 am was 92 per cent whilst at 3.00 pm it was 85 per cent over the four-year period.
3. Physical features and soil
The plantation from which samples were taken is situated at an altitude of approximately 3,000 feet above mean sea level on slopes ranging from between 10° and 20° with a predominantly South westerly aspect. Sampled plots were selected to ensure uniformity in site. This site type is typical of much of the area in use for the establishment of pine plantatiuns in Jamaica.
18
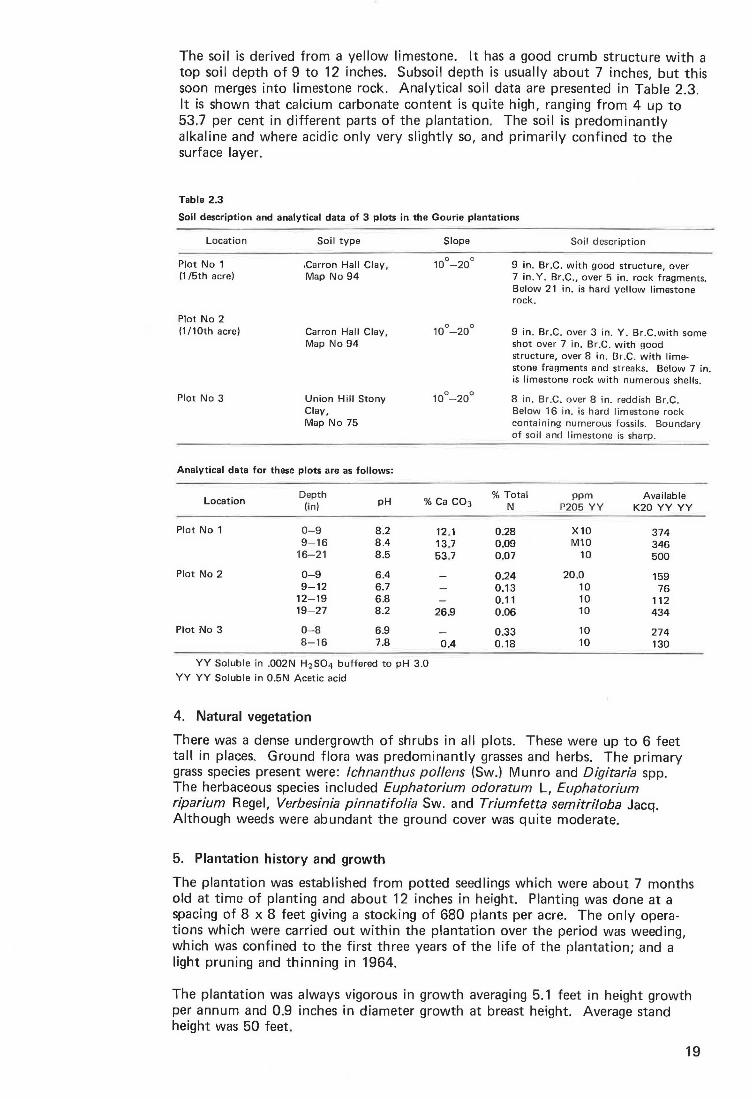
The soil is derived from a yellow limestone. lt has a good crumb structure with a top soil depth of 9 to 12 inches. Subsoil depth is usually about 7 inches, but this soon merges into limestone rock. Analytical soil data are presented in Table 2.3. lt is shown that calcium carbonate content is quite high, ranging from 4 up to 53.7 per cent in different parts of the plantation. The soil is predominantly alkaline and where acidic only very slightly so, and primarily confined to the surface layer.
Table 2.3
Soil description and analytical data of 3 plots in the Gourie plantations
Location
Plot No 1 (1 /5th acre)
Plot No 2 (1 /10th acre)
Plot No 3
Soil type
.Carron Hall Clay, Map No 94
Carron Hall Clay, Map No 94
Union Hill Stony Clay, Map No 75
Analytical data for these plots are as follows:
Location Depth
pH (In)
Plot No 1 0-9 8.2 9-16 8.4
16-21 8.5
Plot No 2 0-9 6.4 9-12 6.7
12-19 6.8 19-27 8.2
Plot No 3 0-8 6.9 8-16 7.8
YY Soluble in .002N H2S04 buffered to pH 3 .0
YY YY Soluble in 0.5N Acetic acid
4. Natural vegetation
Slope
0 0 10 -20
12 .1 13.7 53.7
26.9
0.4
Soil description
9 in. Br.C. with good structure, over 7 in .Y. Br.C., over 5 in. rock fragments. Below 21 in. is hard yellow limestone rock.
9 in . Br.C. over 3 in. Y. Br.C.with some shot over 7 in. Br.C . with good structure, over 8 in. Br.C. with limestone fragments and streaks. Below 7 in. is limestone rock with numerous shells.
8 in. Br.C. over 8 in. reddish Br.C. Below 16 in. is hard limestone rock containing numerous fossils. Boundary of soil and limestone is sharp.
%Total pp m Available N P205 YY K20 YY YY
0.28 X10 374 0.09 M10 346 0.07 10 500
0.24 20.0 159 0.13 10 76 0.11 10 112 0 .06 10 434
0.33 10 274 0.18 10 130
There was a dense undergrowth of shrubs in all plots. These were up to 6 feet tall in places. Groond flora was predominantly grasses and herbs. The primary grass species present were: lchnanthus pal/ens (Sw.) Munro and Digitaria spp. The herbaceous species included Euphatorium odoratum L, Euphatorium riparium Regel, Verbesinia pinnatifolia Sw. and Triumfetta semitri/oba Jacq. Although weeds were abundant the ground cover was quite moderate.
5. Plantation history and growth
The plantation was established from potted seedlings which were about 7 months old at time of planting and about 12 inches in height. Planting was done at a spacing of 8 x 8 feet giving a stocking of 680 plants per acre. The only operations which were carried out within the plantation over the period was weeding, which was confined to the first three years of the life of the plantation; and a light pruning and thinning in 1964.
The plantation was always vigorous in growth averaging 5.1 feet in height growth per annum and 0.9 inches in diameter growth at breast height. Average stand height was 50 feet.
19


Appendix 2 Experimental methods
1. Apparent density of wood
The method used was TAPPI Standard method T 18m-53 1 using one piece approximately one inch thick from each log received.
The green volume was determined by weighing the disc, which had been soaked in water until it was saturated, immersed in water. The oven-dry weight was determined by weighing the disc after it had been dried to constant weight at 105° ± 3°C.
. . oven-dry weight The apparent dens1ty IS expressed as: G ( k d 1 ) reen soa e vo ume
2. Chemical analysis
The chemical analyses were carried out on a composite sample. A portion of the chips prepared for pulping trials was ground in an Apex knife mill and the fraction of groundwood which passed through a British Standard 40 mesh (420 microns) sieve and was retained on a British Standard mesh (250 microns) sieve used for analysis.
The methods used were :
Alcohol benzene solubility Holocellulose Alpha-cellulose 1% Caustic Soda Solubility Lignin
TAPPI T 6m-59 1
Wise, Murphy, D'Addieco2
T APP I T203 os-61 1
T APP I T 4m-59 1
TAPPI T 13m-541
The fractions soluble in alcohol-benzene and 1% caustic soda are expressed as oven dry extractives per cent oven-dry wood.
The alpha-cellulose and lignin are expressed oven dry per cent oven dry wood.
The holocellulose was dried by washing in acetone and storing at room temperature in a desiccator until constant weight. Under these conditions the halocellulose was found to have a moisture content of 2 per cent. In calculating the result allowance was made for this moisture content and the result is reported as oven dry holocellulose per cent over dry wood.
3. Microscopic examination
The fibre measurements were made on re-dispersions of pieces of standard sheets made from unbeaten sulphate pulp and they are thus representative of a composite sample. The fibres were mounted in aqueous medium and the length, width and wall thickness of 100 fibres measured. The lengths of all fibre elements both whole and broken were determined by measuring a projected image with an
21

electro-mechanical probe and a recorder which counted the total number of fibres measured, the sum of the lengths of the fibres and the number of fibres falling in each of 18 length groups, each group representing a 0.5 mm range of fibre length. In this way the average length of fibres in pulp and a distribution curve of lengths were obtained. The widths of the parially collapsed fibres and the wall thickness were determined by direct measurement of the projected image. Because pulping and the pressing during sheet making causes the fibres to collapse the widths are typical of the pulp only. Fibre wall thickness as measured may also differ from that observed on a cross section of wood.
4. Pulping methods
The chips used for pulping were prepared by sawing the log into discs approximately % inch thick and then splitting along the grain with a mechanical guillotine to give a chip approximately % inch x % inch thick. This damages the fibres less than commercial chipping.
Laboratory pulping was carried out in an electrically-heated, stainless steel, rotating pressure vessel.
The method used was the sulphate (Kraft) process, .which was selected as being the most promising process for use on tropical woods in tropical conditions. The active chemicals are sodium hydroxide and soium sulphide.
The concentration of chemicals is calculated according to the following definitions:
(a) Active Alkali == NaOH + Na2 S expressed at Na2 0 per cent on oven-dry wood.
(b) S I h.d. - Na2 S x 100 11 h d d N 0 u p 1 1ty - NaOH + Na2
S, a t e compoun s expresse as a2 •
A sulphidity of 25 per cent was used in each of these experiments, chosen because published information shows there to be generally little variation in pulp quality with changes in sulphidity in the range of 20 to 30 per cent.
The cooked chips were washed free of superficial black liquor and broken up in a propeller type disintegrator to simulate the disintegration occuring during blowing a commercial digester; the pulp was screened using a plate with 0.15 mm wide slits, to remove shive, and collected on a 150 mesh ·(per linear inch) sieve.
The yield of pulp was determined by drying the whole of the screened pulp in a stream of air to about 10% moisture. The total weight of air dry screened pulp and the moisture content of an aliquot were determined for calculating the yield of oven-dry pulp.
The total alkali in the black liquor was determined by titrating an ashed aliquot of black liquor with hydrochloric acid. The Active Alkali remaining was determined by titrating an aliquot of black liquor after removing the sodium salts which are the reaction products of digestion by precipitation with barium chloride. The Active Alkali consumed was the difference of these results.
5. Unbleached pulp evaluation
The Kappa Number was determined by TAPPI standard method T 236m-60 1 • This method is identical with the International Committee for Chemical Analyses Method ICCA 1:59 which has been adopted throughout the world.
The amount of permanganate consumed by pulp under specified conditions is measured and, for pulp yields of less than 70 per cent, the percentage of Klason lignin approximately equals Kappa Number X0.15.
The pulp was evaluated by preparing and testing standard sheets, from pulp which had been air dried, according to the proposals of the 'Second Report of the Pulp
22

Evaluation Committee to the Technical Section of the (British) Papermarkers' Association' 3 • The sheets of approximately 60g/m2 were tested after conditioning at 20° ± 1°C and 65 per cent relative humidity. The methods given in this report are practically identical with those in TAPPI Standard T205m-58 1
• The effect of air drying is to lower the strength of the unbeaten pulp, but, except for specific scattering coefficient, the effect on beaten pulps is small.
The pulps were beaten in a PF I Mill using a pulp consistency of 10 per cent, a beating pressure of 3.4 kgF (33.3N) per cm of bar length and a difference between the peripheral speeds of the beating elements of 2 m/sec.
The methods used for physical examination of each set of sheets were:
(a) Thickness: Ten measurements made on ten sheets placed one on top of another using a dead weight micrometer.
(b) Breaking length and stretch: Twelve strips 15 mm wide tested using a Schopper-type tensile tester with the jaws initially 9 cm apart.
(c) Tear: Using a Marx-Eimendorf tear tester; normally a group of three were torn at one time through 44 mm in 2 places (i .e. total tearing distance is 3 x 2 x 44 = 264 mm), three readings being obtained in this way. Sheets with high tearing strength were torn either in pairs or singly and suitable adjustment was made to the calculation of the tear factor.
(d) Burst: Eighteen tests using a Frank Schopper-Dalen type pneumatic burst tester.
(e) Fold: 15 mm strips folded through 312° and the number of double folds recorded before the strip broke under a load of 7.85 N (800gF).
(f) Air porosity: Four sheets tested using a closed top Gurley Densometer with a 20 ounce inner cylinder. The time for 100 ml of air to pass through 1 sq inch was measured by the automatic timing attachment.
(g) Basic weight and moisture content: Determined by weighing six rectangles of 250 cm 2 after standard conditioning and after drying to constant weight at 105° + 3°C.
Results are reported as follows, where possible, independent of basis weight, but otherwise referring to an oven dry basis weight of approximately 60g/m2 •
Basic weight: Grams per square metre, oven dry (W)
Thickness: Thickness of a single sheet, in microns
Bulk* Thickness w
Burst Factor* Average burst in g/cm2
w Tear Factor* Tearing force for a single sheet in gx100
w Breaking Length* Average tensile strength in kg x 66,700
w The result is expressed in metres.
*results which are independent of basis weight.
The ease with which water parts from the pulp was determined by two methods. The first, the drainage time determined on the standard sheet machine, is the time in seconds for water at 20°C to flow from a pulp suspension through the wire from a height 350 mm above the wire until the formed sheet is no longer immersed. Ttie procedure used was that described in the 'Second Report of the Pulp Evaluation Committee' 3 and is similar to that given in TAPPI Standard T221os-63 1 .
23

The second, the Canadian Standard freeness is an empirical measure of the rate at which water will separate from a one litre suspension of 3 grams of pulp through a standard perforated plate, in apparatus calibrated by the Pulp and Paper Research Institute of Canada. The method is described in the 'Second Report of the Pulp Evaluation Committee 3
, TAP PI Standard T227m-58 1 ' and in Canadian Pulp and
Paper Association Standard C1.
6. Bleaching and bleached pulp evaluation
Bleaching trails were carried out by a four stage method of chlorination extraction, hypochlorite and chlorine dioxide (CEH D). This is the simplest sequence currently used to obtain a fully bleached sulphate pulp. The quantity of chlorine added, sufficient to give an excess that would not be consumed within the reaction time, was estimated from the Kappa number using data for the relationship between Kappa number and chlorine demand from earlier trials.
The brightness was determined using an Elrepho reflection photometer using a 'Tappi' filter (with an effective wavelength of 457 nm) and a Magnesium oxide standard as 100.
The printing opacity was determined using the same instrument with CIE tristimulus filters Y (green). The reflectance from a single 60 g/m2 sheet ( Ro) over a black background was compared with the reflectance from a pad sufficiently thick to ensure no I ight was transmitted ( R oo).
Th . . . R 0 X 1 00 Th. f . d d h b . . h en pnntmg opac1ty :::: Roo . 1s 1gure IS epen ent on t e as1c we1g t
of the sheet.
The scattering power (SX) was determined from the relationship between the
· · · Ro x 100 d h I fl Th ·f· · pnntmg opac1ty Roo an t e tota re ectance. e spec1 1c scattenng
coefficient(s), which is independent of the basis weight is given by:
S:::: SX X 10,000 w
where W :::: Basis Weight, oven dry in g/m2• 4
The strength characteristics of the bleached pulps were determined as described for unbleached pulps.
References
1 TAPPI Standard and Suggested Methods, Published by the Technical Association of the Pulp and Paper Industry, New York.
2 L. E. WISE, M. MURPHY and A. A. D'ADDIECO, Paper TradeJ. 1946, 122, No 2,35.
3 Second Report of the Pulp Evaluation Committee to the (British) Paper Makers' Association, London, 1936.
4 H. W. GIERTZ, Svensk Papperstidning, 1950, 53, 673.
(857) Dd817399 1,500 4/73 HP Ltd, So'ton G3313


![No. 12040/21 120 FTC/IR · No.12040/21 12016-FTC/IR Government ofIndia Ministry ofPersonnel, Public Grievances andPensions Department ofPersonnel and Training [TrainingDivision] Block-4,](https://img.pdfslide.us/doc/110x75/6060509c77a0d00b8c777e8a/no-1204021-120-ftcir-no1204021-12016-ftcir-government-ofindia-ministry-ofpersonnel.jpg)