Embed Size (px)
Citation preview
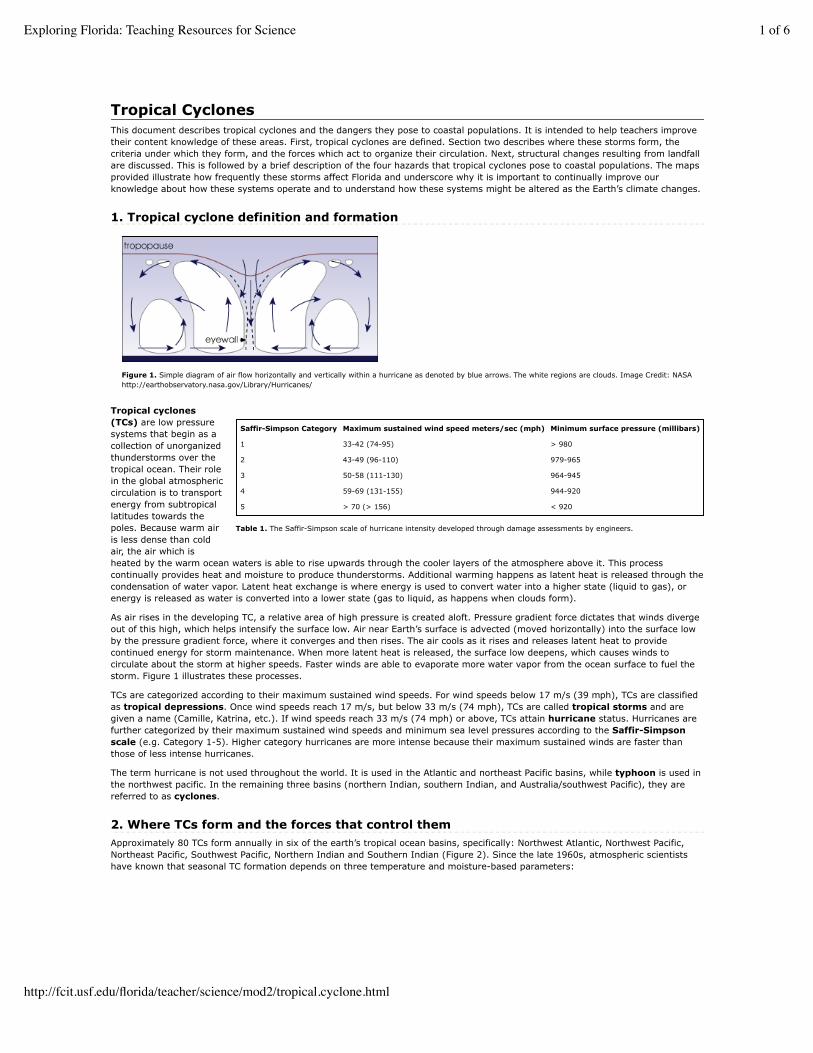
Figure 1. Simple diagram of air flow horizontally and vertically within a hurricane as denoted by blue arrows. The white regions are clouds. Image Credit: NASAhttp://earthobservatory.nasa.gov/Library/Hurricanes/
Saffir-Simpson Category Maximum sustained wind speed meters/sec (mph) Minimum surface pressure (millibars)
1 33-42 (74-95) > 980
2 43-49 (96-110) 979-965
3 50-58 (111-130) 964-945
4 59-69 (131-155) 944-920
5 > 70 (> 156) < 920
Table 1. The Saffir-Simpson scale of hurricane intensity developed through damage assessments by engineers.
Tropical CyclonesThis document describes tropical cyclones and the dangers they pose to coastal populations. It is intended to help teachers improvetheir content knowledge of these areas. First, tropical cyclones are defined. Section two describes where these storms form, thecriteria under which they form, and the forces which act to organize their circulation. Next, structural changes resulting from landfallare discussed. This is followed by a brief description of the four hazards that tropical cyclones pose to coastal populations. The mapsprovided illustrate how frequently these storms affect Florida and underscore why it is important to continually improve ourknowledge about how these systems operate and to understand how these systems might be altered as the Earth’s climate changes.
1. Tropical cyclone definition and formation
Tropical cyclones(TCs) are low pressuresystems that begin as acollection of unorganizedthunderstorms over thetropical ocean. Their rolein the global atmosphericcirculation is to transportenergy from subtropicallatitudes towards thepoles. Because warm airis less dense than coldair, the air which isheated by the warm ocean waters is able to rise upwards through the cooler layers of the atmosphere above it. This processcontinually provides heat and moisture to produce thunderstorms. Additional warming happens as latent heat is released through thecondensation of water vapor. Latent heat exchange is where energy is used to convert water into a higher state (liquid to gas), orenergy is released as water is converted into a lower state (gas to liquid, as happens when clouds form).
As air rises in the developing TC, a relative area of high pressure is created aloft. Pressure gradient force dictates that winds divergeout of this high, which helps intensify the surface low. Air near Earth’s surface is advected (moved horizontally) into the surface lowby the pressure gradient force, where it converges and then rises. The air cools as it rises and releases latent heat to providecontinued energy for storm maintenance. When more latent heat is released, the surface low deepens, which causes winds tocirculate about the storm at higher speeds. Faster winds are able to evaporate more water vapor from the ocean surface to fuel thestorm. Figure 1 illustrates these processes.
TCs are categorized according to their maximum sustained wind speeds. For wind speeds below 17 m/s (39 mph), TCs are classifiedas tropical depressions. Once wind speeds reach 17 m/s, but below 33 m/s (74 mph), TCs are called tropical storms and aregiven a name (Camille, Katrina, etc.). If wind speeds reach 33 m/s (74 mph) or above, TCs attain hurricane status. Hurricanes arefurther categorized by their maximum sustained wind speeds and minimum sea level pressures according to the Saffir-Simpsonscale (e.g. Category 1-5). Higher category hurricanes are more intense because their maximum sustained winds are faster thanthose of less intense hurricanes.
The term hurricane is not used throughout the world. It is used in the Atlantic and northeast Pacific basins, while typhoon is used inthe northwest pacific. In the remaining three basins (northern Indian, southern Indian, and Australia/southwest Pacific), they arereferred to as cyclones.
2. Where TCs form and the forces that control themApproximately 80 TCs form annually in six of the earth’s tropical ocean basins, specifically: Northwest Atlantic, Northwest Pacific,Northeast Pacific, Southwest Pacific, Northern Indian and Southern Indian (Figure 2). Since the late 1960s, atmospheric scientistshave known that seasonal TC formation depends on three temperature and moisture-based parameters:
Exploring Florida: Teaching Resources for Science 1 of 6
http://fcit.usf.edu/florida/teacher/science/mod2/tropical.cyclone.html
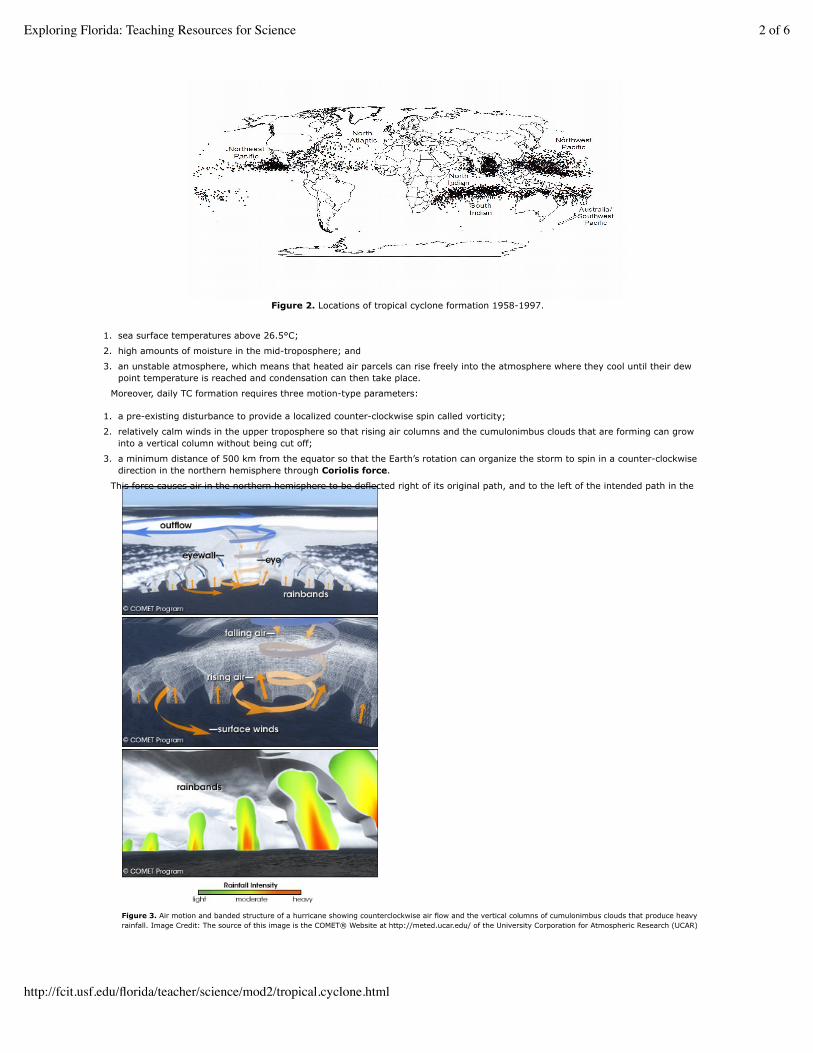
Figure 3. Air motion and banded structure of a hurricane showing counterclockwise air flow and the vertical columns of cumulonimbus clouds that produce heavyrainfall. Image Credit: The source of this image is the COMET® Website at http://meted.ucar.edu/ of the University Corporation for Atmospheric Research (UCAR)
Figure 2. Locations of tropical cyclone formation 1958-1997.
sea surface temperatures above 26.5°C;1.
high amounts of moisture in the mid-troposphere; and2.
an unstable atmosphere, which means that heated air parcels can rise freely into the atmosphere where they cool until their dewpoint temperature is reached and condensation can then take place.
3.
Moreover, daily TC formation requires three motion-type parameters:
a pre-existing disturbance to provide a localized counter-clockwise spin called vorticity;1.
relatively calm winds in the upper troposphere so that rising air columns and the cumulonimbus clouds that are forming can growinto a vertical column without being cut off;
2.
a minimum distance of 500 km from the equator so that the Earth’s rotation can organize the storm to spin in a counter-clockwisedirection in the northern hemisphere through Coriolis force.
3.
This force causes air in the northern hemisphere to be deflected right of its original path, and to the left of the intended path in the
Exploring Florida: Teaching Resources for Science 2 of 6
http://fcit.usf.edu/florida/teacher/science/mod2/tropical.cyclone.html
pursuant to a Cooperative Agreements with the National Oceanic and Atmospheric Administration, U.S. Department of Commerce. ©1997-2008 UniversityCorporation for Atmospheric Research. All Rights Reserved.
southern hemisphere, but the force does not act along the equator. In the northern hemisphere, air flowing into a tropical cyclone
moves in a counter-clockwise direction, while it moves in a clockwise direction in the southern hemisphere.
A TC’s vertical structure influences the amount of precipitation produced by a storm: increased latent heating warms theenvironment inside the clouds relative to the air outside of the clouds, creating an unstable situation as warm air tends to rise abovethe cold air. This allows clouds to grow taller and discharge more precipitation. As the air flows towards the storm’s center, itsrotational velocity increases because it is following a smaller radius, just as an ice skater can increase her rotational speed bydrawing her arms and legs inward towards the axis of rotation. So the strongest winds circulate counterclockwise about the storm’scenter in the Northern Hemisphere. The balance of Coriolis and centrifugal forces (outward-directed force experienced during curvedmotion) with the pressure gradient force keeps the storm’s center, or eye, from filling. Additionally, sinking air from the high pressurealoft also inhibits cloud formation in the eye. In a well-formed TC, the eye is completely surrounded by tall cumulonimbus clouds,some of which may breach the tropopause with heights of 18 km. These clouds produce heavy rainfall, and can also be found in theouter rainbands circulating around the storm’s center. Therefore, although the fastest winds in a hurricane are located in the wall ofclouds surrounding the eye (i.e., the “eyewall”), rain rates capable of causing flooding can occur both there and hundreds ofkilometers outwards from the eye within the rain bands. These details are illustrated in Figure 3.
TC structural variations result from the system’s interactions with the surrounding environment. TCs weaken when any of thecarefully balanced elements that sustain the system change. TCs may weaken and eventually dissipate over the open ocean, ordissipate as a result of encountering land. Over the ocean, fast upper-tropospheric winds (called wind shear, which means that windchange direction and or speed with height) can separate cloud tops from their bases, limiting the strength of the storm. Dry aircontaining dust from the Sahara can also be circulated into the storm so that latent heat release is reduced and the storm weakens.If the storm moves over cool ocean waters, less moisture is evaporated into the atmosphere to continually supply the energy forcloud formation, and the storm weakens.
3. LandfallDrastic changes occur and weaken a TC when it makes landfall. First, moving over land separates the storm from its energy source.The TC derives its energy from the evaporation of warm ocean water and the uplifting of this water vapor to higher altitudes. Second,moving over land slows wind speeds. In addition, continental air masses, which tend to be drier and cooler, mix with the tropical airmasses of the TC and further weaken it.
Observational studies from the 1950s and 1960s found that the loss of the sea surface’s latent heat source, rather than increasedfriction caused by the land surface, was the greatest contributor to the weakening of a landfalling TC. As a TC moves over land, therate of evaporation decreases because the land surface contains less liquid moisture than the ocean. As less moisture is carried intothe storm, its environment becomes drier. The edges of the clouds begin to evaporate and as evaporation is a cooling process, thiscauses the air to become more dense and sink. This sinking air cuts off the rising air that supplies the thunderstorms with energy,thus weakening the storm. As less and less moisture is added to the system, cloud coverage lessens and precipitation rates decreaseas the storm moves further inland.
The increased roughness of the land surface relative to the ocean surface also changes wind flow within a landfalling TC. Friction isgreatest near the Earth’s surface and decreases upwards to an altitude of approximately 1 km, above which it is not felt. This causeswinds near Earth’s surface to blow slower than those further aloft. Changes in surface friction upset the balance of forces that act tosustain a TC’s circulation. The pressure gradient force, at first, is unaffected. However, the outward-acting centrifugal force isweakened as the air speed slows. This allows the pressure gradient force to become dominant and air flows into the low at thestorm’s center, rather than circling around the center. Once the center begins to fill, pressure gradient force then weakens, whichcauses wind speeds to weaken. Less moist air is advected into the storm to build clouds, and the storm eventually weakens. Theincreased roughness of the land surface, which enhances friction experienced by a TC upon landfall, has been found to decrease windspeeds between 20% to 50% of those over the smoother ocean surface.
Although the transition from the ocean to the land surface decreases wind speeds, rainfall can be enhanced near the coastline. As aTC encounters the coast, the increased friction slows the air moving onshore (usually on the right side of the storm in the northernhemisphere), while air transitioning from the rougher land surface back out over the water gains forward velocity (usually the leftside of a TC in the northern hemisphere). The air slowing down on the right side of the storm causes convergence, meaning the aircomes together just like in a traffic jam. Because it can’t flow downwards into the Earth, it is forced upwards into the atmosphere.This mechanism can transport additional moisture-laden air from the ocean surface upwards to enhance rainfall as the storm ismoving over land. On the left side of the storm, air flowing from the land over the water gains speed as friction is lessened, just ashappens once a lane on the highway becomes open once again and traffic can speed up. This divergence, or spreading, of windscreates a gap that must be filled by air from aloft. Thus, sinking motion is enabled on the left side of the storm and is one of thereasons why rainfall rates tend to be lower in many cases on the left side of a landfalling TC.
4. Hazards during and after landfallFor many centuries, landfalling TCs have brought disaster to coastal populations through their associated high wind speeds,tornadoes, storm surges, and rainfall. Forecasting where the circulation center, or eye, will come ashore has important implicationsfor winds and the storm surge. As discussed previously, the fastest winds are located in the eye wall, which surrounds the center ofcirculation. Prior to its passage, wind speeds will increase out of a northeast and then east direction. Once the eye is overhead, atemporary break from strong winds will occur and can last for several minutes. During the 1926 Miami hurricane, residentsmistakenly thought the hurricane was over and ventured outside to inspect damage and travel to other locations. They were notprepared for the strong winds on the back side of the eyewall. The winds suddenly pick up speed and come from the oppositedirection. Structures and trees that were not completely demolished by the front of the storm can succumb during the passage of theback of the storm because their weakened frames cannot withstand winds from the opposite direction.
Prior to the 1970s, the greatest loss of life from hurricanes was caused by the storm surge. This rise in the normal ocean tides iscaused by a combination of the low pressure at a TC’s center and the energy transferred to the water by the strong winds (Figure 4).
Exploring Florida: Teaching Resources for Science 3 of 6
http://fcit.usf.edu/florida/teacher/science/mod2/tropical.cyclone.html
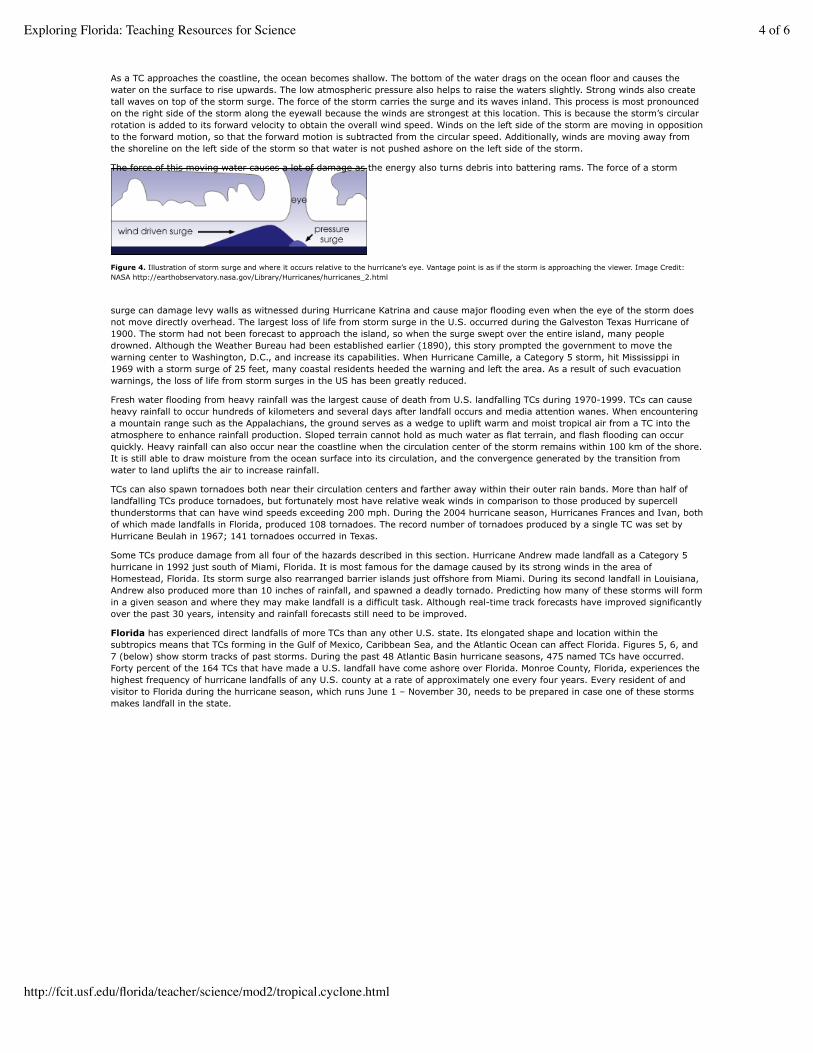
Figure 4. Illustration of storm surge and where it occurs relative to the hurricane’s eye. Vantage point is as if the storm is approaching the viewer. Image Credit:NASA http://earthobservatory.nasa.gov/Library/Hurricanes/hurricanes_2.html
As a TC approaches the coastline, the ocean becomes shallow. The bottom of the water drags on the ocean floor and causes thewater on the surface to rise upwards. The low atmospheric pressure also helps to raise the waters slightly. Strong winds also createtall waves on top of the storm surge. The force of the storm carries the surge and its waves inland. This process is most pronouncedon the right side of the storm along the eyewall because the winds are strongest at this location. This is because the storm’s circularrotation is added to its forward velocity to obtain the overall wind speed. Winds on the left side of the storm are moving in oppositionto the forward motion, so that the forward motion is subtracted from the circular speed. Additionally, winds are moving away fromthe shoreline on the left side of the storm so that water is not pushed ashore on the left side of the storm.
The force of this moving water causes a lot of damage as the energy also turns debris into battering rams. The force of a storm
surge can damage levy walls as witnessed during Hurricane Katrina and cause major flooding even when the eye of the storm doesnot move directly overhead. The largest loss of life from storm surge in the U.S. occurred during the Galveston Texas Hurricane of1900. The storm had not been forecast to approach the island, so when the surge swept over the entire island, many peopledrowned. Although the Weather Bureau had been established earlier (1890), this story prompted the government to move thewarning center to Washington, D.C., and increase its capabilities. When Hurricane Camille, a Category 5 storm, hit Mississippi in1969 with a storm surge of 25 feet, many coastal residents heeded the warning and left the area. As a result of such evacuationwarnings, the loss of life from storm surges in the US has been greatly reduced.
Fresh water flooding from heavy rainfall was the largest cause of death from U.S. landfalling TCs during 1970-1999. TCs can causeheavy rainfall to occur hundreds of kilometers and several days after landfall occurs and media attention wanes. When encounteringa mountain range such as the Appalachians, the ground serves as a wedge to uplift warm and moist tropical air from a TC into theatmosphere to enhance rainfall production. Sloped terrain cannot hold as much water as flat terrain, and flash flooding can occurquickly. Heavy rainfall can also occur near the coastline when the circulation center of the storm remains within 100 km of the shore.It is still able to draw moisture from the ocean surface into its circulation, and the convergence generated by the transition fromwater to land uplifts the air to increase rainfall.
TCs can also spawn tornadoes both near their circulation centers and farther away within their outer rain bands. More than half oflandfalling TCs produce tornadoes, but fortunately most have relative weak winds in comparison to those produced by supercellthunderstorms that can have wind speeds exceeding 200 mph. During the 2004 hurricane season, Hurricanes Frances and Ivan, bothof which made landfalls in Florida, produced 108 tornadoes. The record number of tornadoes produced by a single TC was set byHurricane Beulah in 1967; 141 tornadoes occurred in Texas.
Some TCs produce damage from all four of the hazards described in this section. Hurricane Andrew made landfall as a Category 5hurricane in 1992 just south of Miami, Florida. It is most famous for the damage caused by its strong winds in the area ofHomestead, Florida. Its storm surge also rearranged barrier islands just offshore from Miami. During its second landfall in Louisiana,Andrew also produced more than 10 inches of rainfall, and spawned a deadly tornado. Predicting how many of these storms will formin a given season and where they may make landfall is a difficult task. Although real-time track forecasts have improved significantlyover the past 30 years, intensity and rainfall forecasts still need to be improved.
Florida has experienced direct landfalls of more TCs than any other U.S. state. Its elongated shape and location within thesubtropics means that TCs forming in the Gulf of Mexico, Caribbean Sea, and the Atlantic Ocean can affect Florida. Figures 5, 6, and7 (below) show storm tracks of past storms. During the past 48 Atlantic Basin hurricane seasons, 475 named TCs have occurred.Forty percent of the 164 TCs that have made a U.S. landfall have come ashore over Florida. Monroe County, Florida, experiences thehighest frequency of hurricane landfalls of any U.S. county at a rate of approximately one every four years. Every resident of andvisitor to Florida during the hurricane season, which runs June 1 – November 30, needs to be prepared in case one of these stormsmakes landfall in the state.
Exploring Florida: Teaching Resources for Science 4 of 6
http://fcit.usf.edu/florida/teacher/science/mod2/tropical.cyclone.html
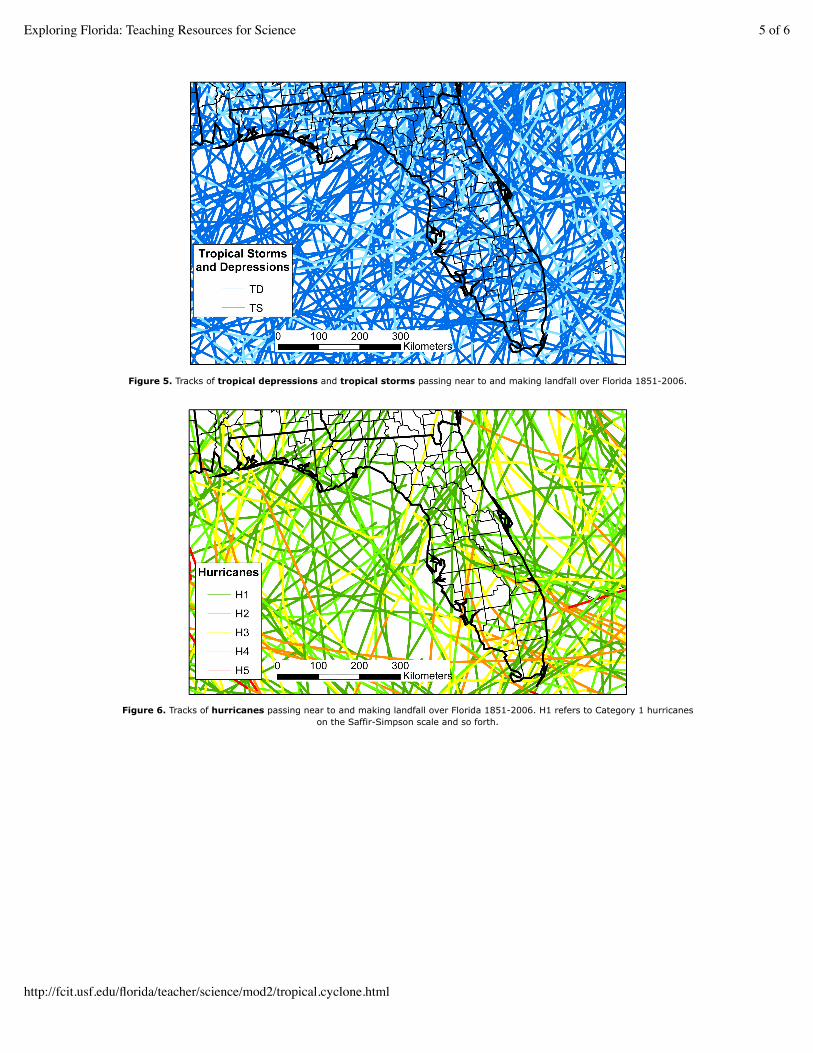
Figure 5. Tracks of tropical depressions and tropical storms passing near to and making landfall over Florida 1851-2006.
Figure 6. Tracks of hurricanes passing near to and making landfall over Florida 1851-2006. H1 refers to Category 1 hurricaneson the Saffir-Simpson scale and so forth.
Exploring Florida: Teaching Resources for Science 5 of 6
http://fcit.usf.edu/florida/teacher/science/mod2/tropical.cyclone.html

Figure 7. Tracks of tropical cyclones in the North Atlantic and Northeast Pacific ocean basins 1851-2006.
Exploring Florida: A Social Studies Resource for Students and TeachersProduced by the Florida Center for Instructional TechnologyCollege of Education, University of South Florida ©2005.
Exploring Florida: Teaching Resources for Science 6 of 6
http://fcit.usf.edu/florida/teacher/science/mod2/tropical.cyclone.html