Embed Size (px)
Citation preview
Tropical Cyclone ReportHurricane Ophelia
6-17 September 2005
Jack Beven and Hugh D. Cobb, IIINational Hurricane Center
24 January 2006Updated track near Nova Scotia 14 June 2006
Hurricane Ophelia was a category 1 hurricane on the Saffir-Simpson Hurricane Scale that brushed the North Carolina Outer Banks, its center staying just offshore from that coast. The storm’s erratic and slow movement in the vicinity of the North Carolina coastline was similar to Hurricanes Bonnie in August 1998 and Dennis in August 1999.
a. Synoptic History
Ophelia formed from a non-tropical weather system. A cold front moved off the eastern coast of the United States on 1 September. The front moved southeastward and became part of an elongated trough of low pressure that extended from Tropical Depression Lee east of Bermuda to near the Florida Peninsula. Two areas of low pressure formed in the trough on 4 September. The eastern low, south of Bermuda, eventually became Hurricane Nate. The western low, near the Bahamas, became Ophelia.
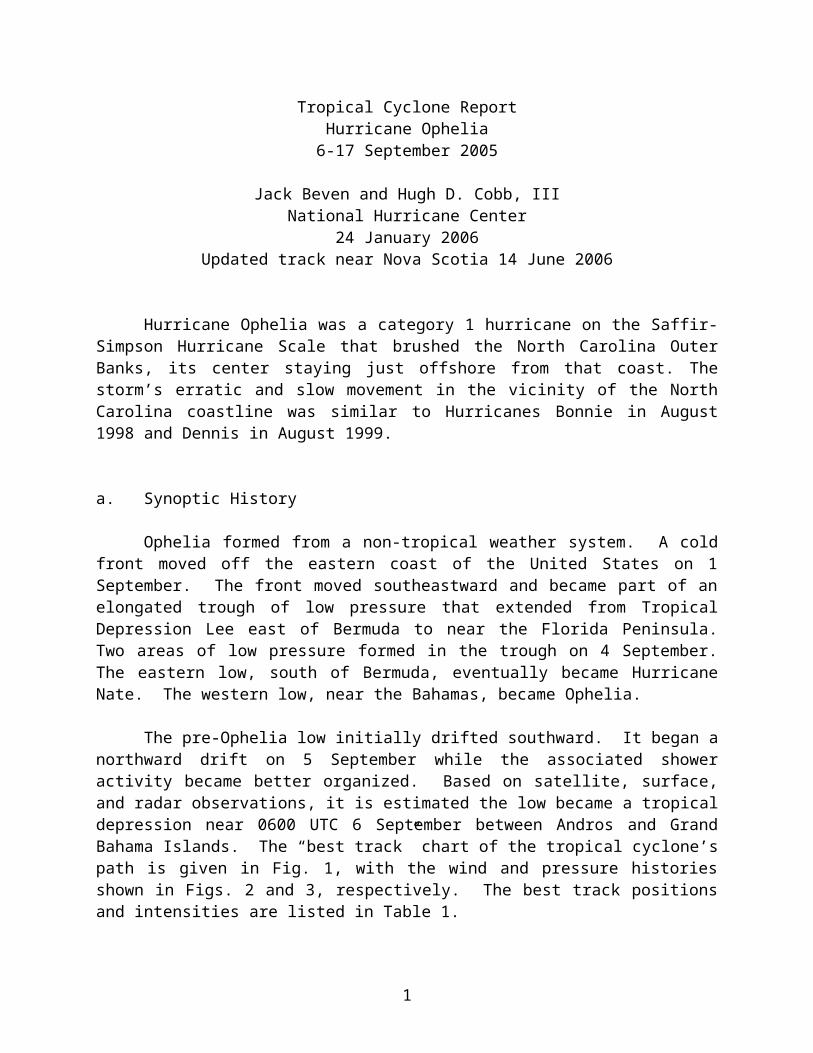
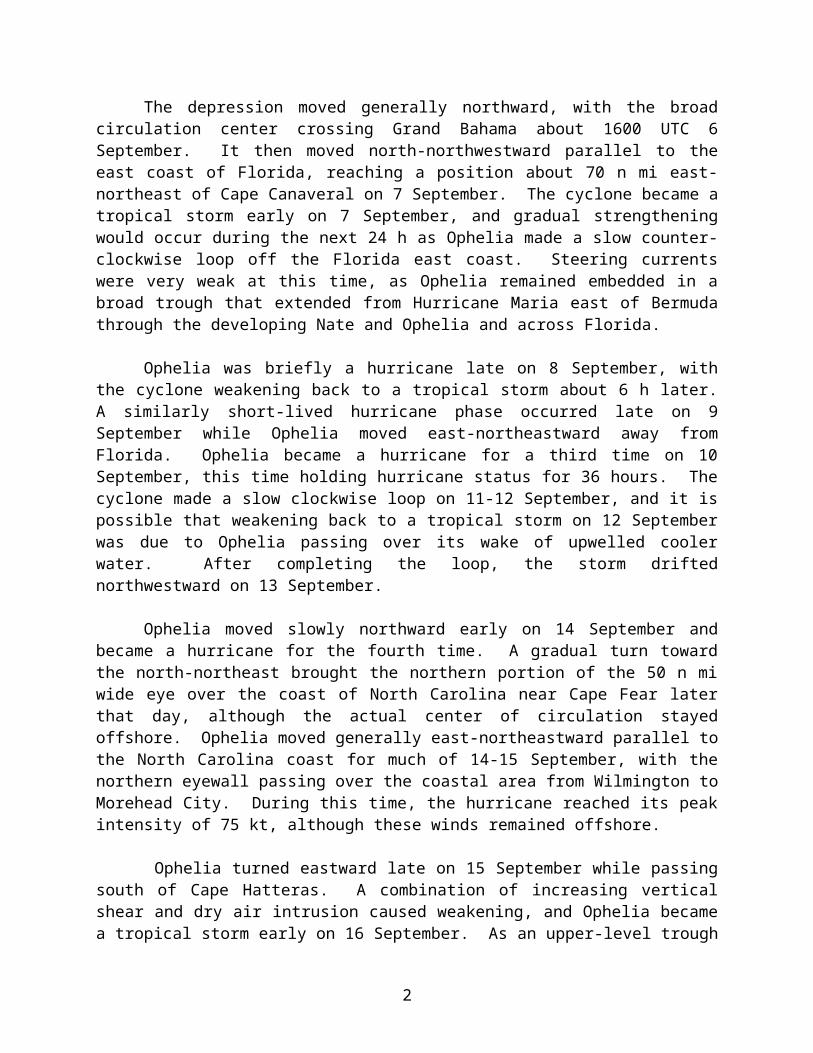
The pre-Ophelia low initially drifted southward. It began a northward drift on 5 September while the associated shower activity became better organized. Based on satellite, surface, and radar observations, it is estimated the low became a tropical depression near 0600 UTC 6 September between Andros and Grand Bahama Islands. The “best track” chart of the tropical cyclone’s path is given in Fig. 1, with the wind and pressure histories shown in Figs. 2 and 3, respectively. The best track positions and intensities are listed in Table 1.
The depression moved generally northward, with the broad circulation center crossing Grand Bahama about 1600 UTC 6 September. It then moved north-northwestward parallel to the east coast of Florida, reaching a position about 70 n mi east-northeast of Cape Canaveral on 7 September. The cyclone became a tropical storm early on 7 September, and gradual strengthening would occur during the next 24 h as Ophelia made a slow counter-clockwise loop off the Florida east coast. Steering currents were very weak at this time, as Ophelia remained embedded in a broad trough that extended from Hurricane Maria east of Bermuda through the developing Nate and Ophelia and across Florida.
Ophelia was briefly a hurricane late on 8 September, with the cyclone weakening back to a tropical storm about 6 h later. A similarly short-lived hurricane phase occurred late on 9 September while Ophelia moved east-northeastward away from Florida. Ophelia became a hurricane for a third time on 10 September, this time holding hurricane status for 36 hours. The cyclone made a slow clockwise loop on 11-12 September, and it is possible that weakening back
1
to a tropical storm on 12 September was due to Ophelia passing over its wake of upwelled cooler water. After completing the loop, the storm drifted northwestward on 13 September.
Ophelia moved slowly northward early on 14 September and became a hurricane for the fourth time. A gradual turn toward the north-northeast brought the northern portion of the 50 n mi wide eye over the coast of North Carolina near Cape Fear later that day, although the actual center of circulation stayed offshore. Ophelia moved generally east-northeastward parallel to the North Carolina coast for much of 14-15 September, with the northern eyewall passing over the coastal area from Wilmington to Morehead City. During this time, the hurricane reached its peak intensity of 75 kt, although these winds remained offshore.
Ophelia turned eastward late on 15 September while passing south of Cape Hatteras. A combination of increasing vertical shear and dry air intrusion caused weakening, and Ophelia became a tropical storm early on 16 September. As an upper-level trough and associated surface front approached from the west, the storm turned northeastward and accelerated late on 16 September. This motion brought the center about 60 n mi southeast of the Massachusetts coast on 17 September, then over eastern Nova Scotia and Newfoundland on 18 September. Ophelia gradually lost organization during this period, and it became extratropical early on 18 September. As an extratropical low, Ophelia moved east-northeastward across the Atlantic on 19-20 September, then northeastward on 21-22 September. The cyclone dissipated over the North Sea on 23 September.
b. Meteorological Statistics
Observations in Ophelia (Figs. 2 and 3) include satellite-based Dvorak technique intensity estimates from the Tropical Analysis and Forecast Branch (TAFB), the Satellite Analysis Branch (SAB) and the U. S. Air Force Weather Agency (AFWA), as well as flight-level and dropwindsonde observations from flights of the 53rd Weather Reconnaissance Squadron of the U. S. Air Force Reserve Command and the NOAA Aircraft Operations Center. Microwave satellite imagery from NOAA polar-orbiting satellites, the NASA Tropical Rainfall Measuring Mission (TRMM), the NASA Aqua, the NASA QuikSCAT, the Department of Defense WindSat, and Defense Meteorological Satellite Program (DMSP) satellites were also useful in tracking Ophelia.
The Air Force Reserve and NOAA Hurricane Hunter aircraft made 105 center fixes during Ophelia’s lifetime. The maximum flight-level winds observed during the storm were 91 kt from a NOAA aircraft at 700 mb at 2124 UTC 11 September. While these winds would support surface winds of 80 kt using the normal 90% adjustment from 700 mb, the maximum surface winds the Stepped Frequency Microwave Radiometer (SFMR) were during the flight were only 64 kt. Winds from other flight-levels and dropsondes near that time also suggest surface winds closer to 65 kt. The peak intensity of 75 kt on 11 September is based on 85 kt winds at 700 mb at 0615 UTC that day, supported by a dropsonde wind of 80-kt at 13 m at 0434 UTC. The second peak intensity of 75 kt on 14-15 September is based on multiple occurrences of 80-85 kt winds at 700 mb, along with SFMR observations of 75-80 kt winds. A notable aircraft observation was a 74 kt wind at 925 mb on 16 September measured by the first ever
2
successful Aerosonde robotic aircraft mission into the core of a tropical cyclone. The lowest aircraft-observed central pressure was 976 mb at 1218 UTC 10 September.
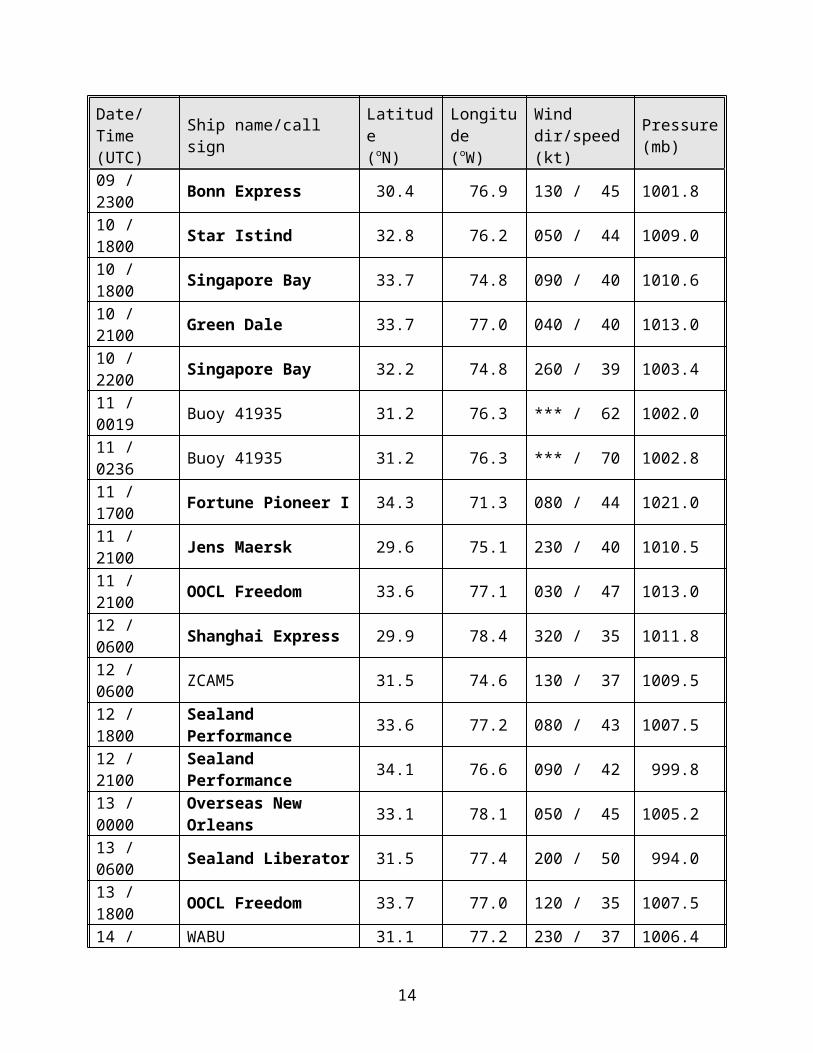
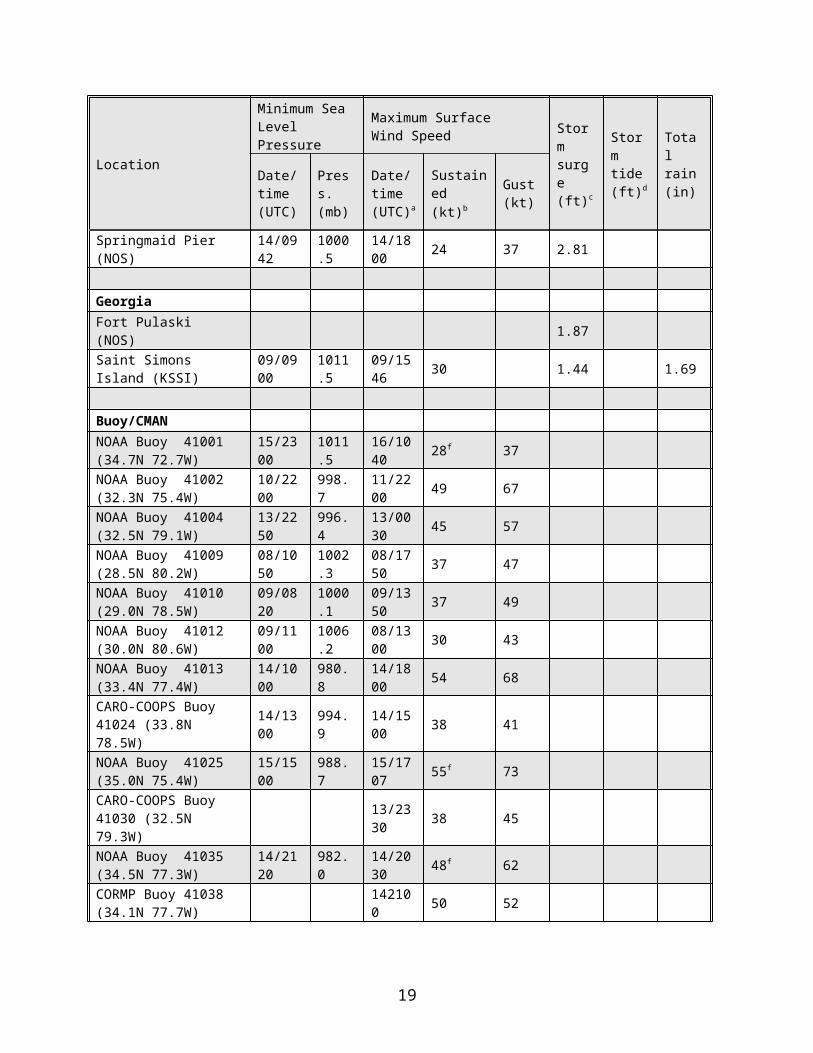
Ship reports of winds of tropical storm force associated with Ophelia are given in Table 2. The most noteworthy observations include a report of 64-kt winds from the Sanmar (call sign V2EX) at 0000 UTC 15 September, and a report of 62-kt winds from the Maersk New Orleans (call sign ELZY3) at 0600 UTC 14 September. Both ships were about 85 n mi east-northeast of the center at those times. A pair of drifting buoys reported winds of 70 kt and 62 kt, although the accuracy of these reports is uncertain.
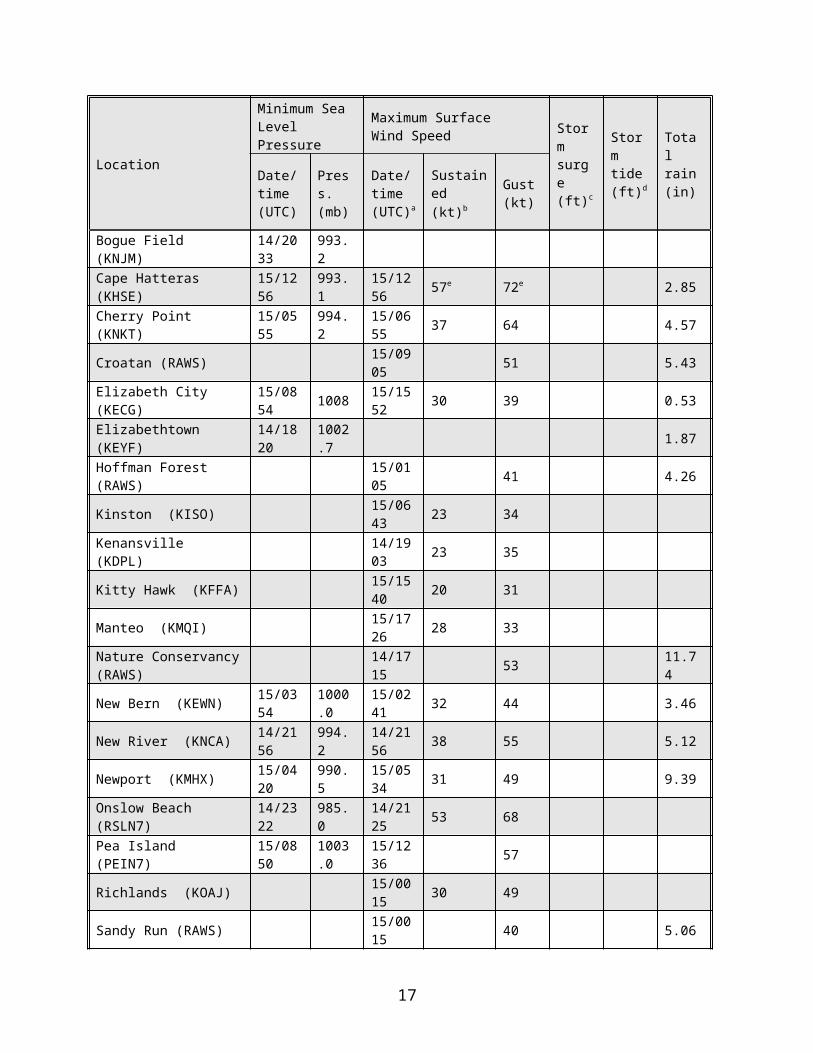
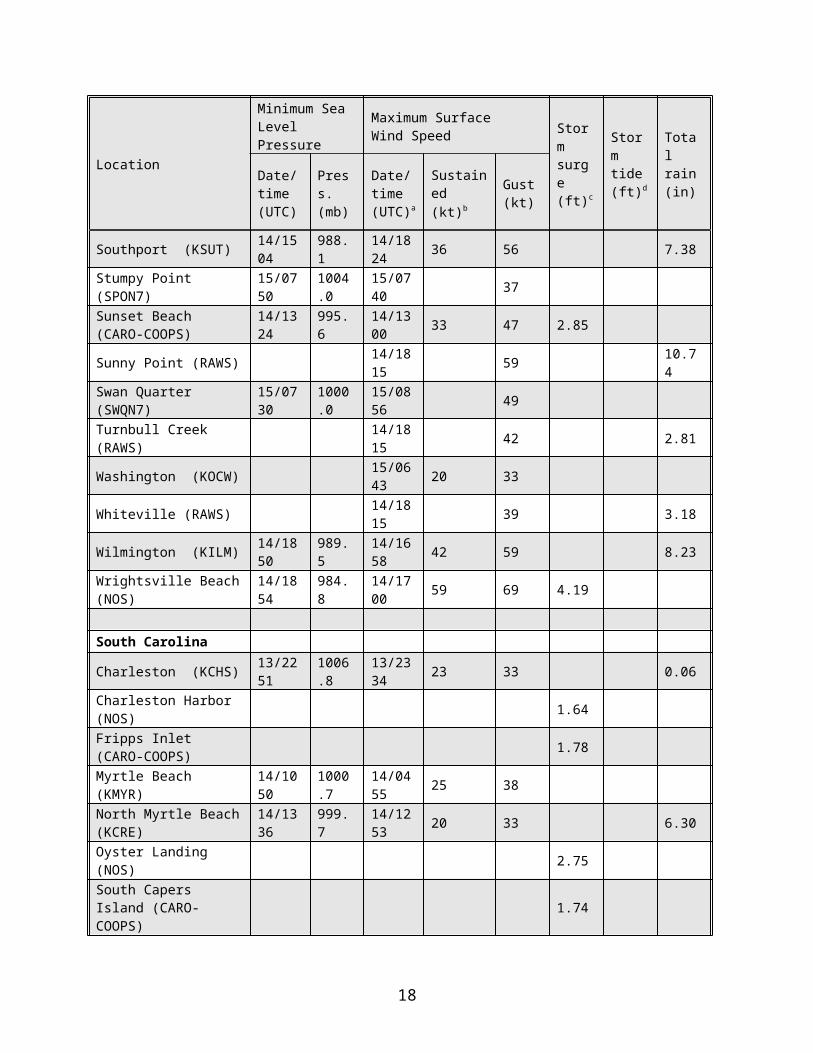
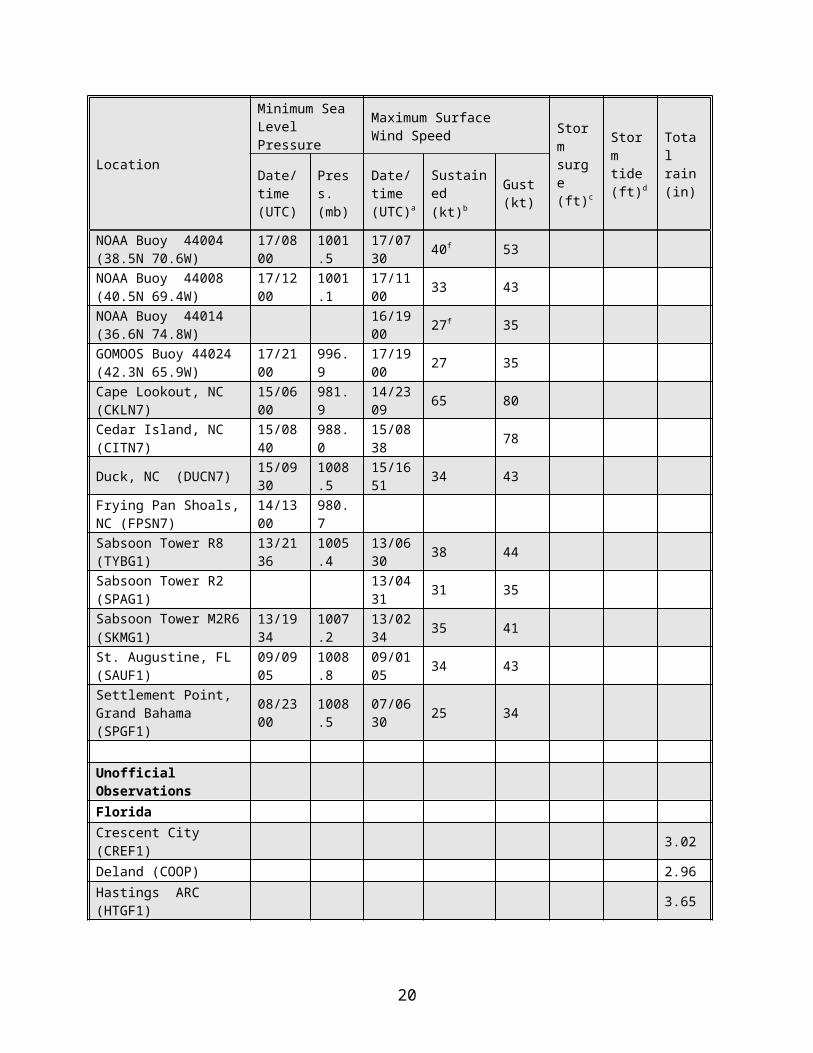
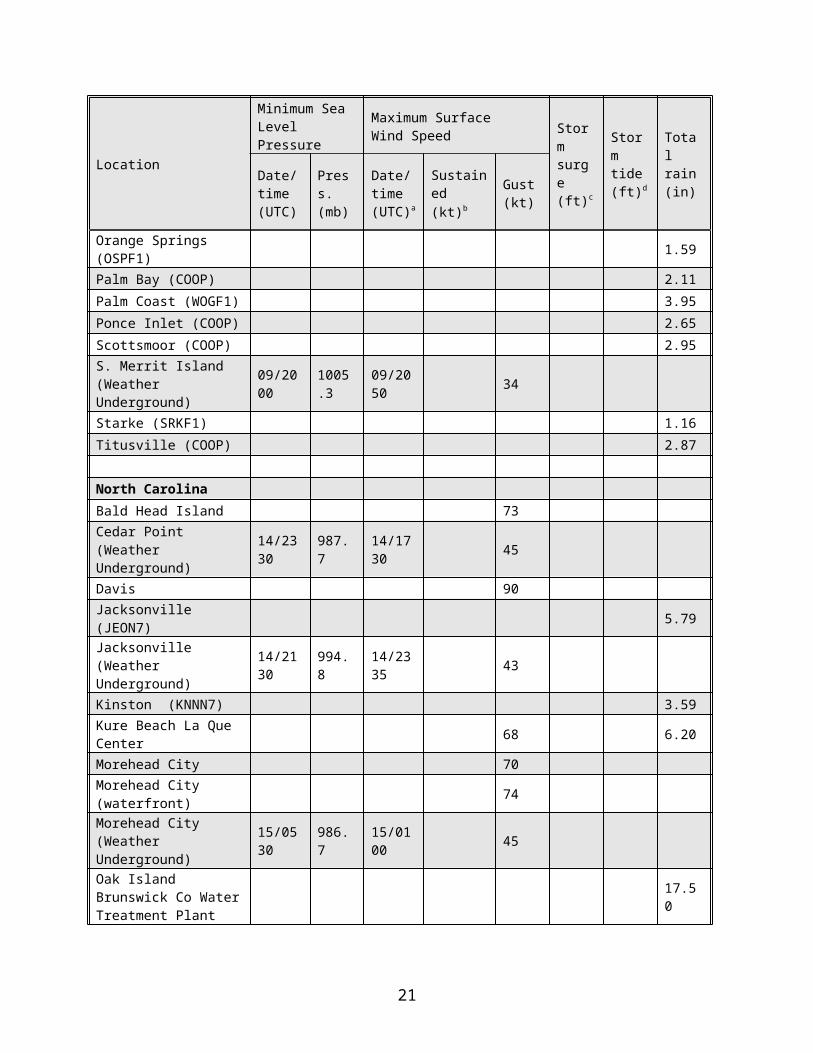
Ophelia brought hurricane conditions to portions of the North Carolina coast; selected surface observations from land stations and data buoys are given in Table 3. The strongest reported winds were from the Coastal Marine Automated Network (C-MAN) Station at Cape Lookout, which reported 2-min average winds of 65 kt (9.8-m elevation) at 2309 UTC 14 September with a gust to 80 kt. The National Ocean Service (NOS) station at Wrightsville Beach reported 6-min average winds of 59 kt at 1700 UTC 14 September with a gust of 69 kt. There was an unofficial report of a gust of 90 kt in Davis.
Ophelia also brought tropical-storm force winds to portions of the east-central coast of Florida and the northeastern coast of South Carolina. A NASA station at Cape Canaveral reported sustained winds of 34 kt at 1520 UTC 8 September with a gust of 52 kt. Myrtle Beach, South Carolina reported a gust of 38 kt.
The lowest pressure observed by a coastal station or buoy was 980.7 mb at the Frying Pan Shoals, North Carolina C-MAN station at 1300 UTC 14 September. The nearby NOAA buoy 41013 measured a 980.8 mb pressure three hours earlier as the large eye drifted across both stations. The NOS station at Wrightsville Beach measured a 984.9 mb pressure at 1854 UTC 14 September.
Ophelia caused storm surges of 4 to 6 ft above normal tide levels in the Pamlico Sound including the lower reaches of the Neuse, Pamlico, and Newport Rivers. Surges of 4 to 6 ft also occurred along the open coasts in Onslow and Cataret counties. Storm surges of 3 to 4 ft above normal tide levels were common elsewhere along the affected areas of the North Carolina coast. Ophelia also caused tides of 1 to 2 ft above normal along the Florida coast.
Ophelia’s slow movement near the North Carolina coast helped produce locally heavy rains. The water treatment plant at Oak Island reported a storm-total rainfall of 17.50 in, while the Remote Automated Weather Stations (RAWS) station at the Nature Conservancy reported 11.74 inches.
No tornadoes have been reported with Ophelia.
c. Casualty and Damage Statistics
3
One death was directly associated with Ophelia – a drowning in high surf in Palm Beach County, Florida. One death was indirectly associated with Opehlia after it became extratropical – a fall from a roof during rain in Nova Scotia.
The American Insurance Services Group estimates the property damage from Ophelia at $35 million. Applying a doubling of this to cover damage to uninsured property yields a total damage estimate of $70 million. It should be noted that the Insurance Information Institute originally provided an estimate of $800 million in damage, which was the basis for the $1.6 billion reported in the annual summary released by the Tropical Prediction Center in December. This figure was an estimate of damage by a model, not an actual report of damage claims.
d. Forecast and Warning Critique
Average official track errors (with the number of cases in parentheses) for Ophelia were 23 (44), 38 (42), 53 (40), 68 (38), 103 (34), 157 (30), and 200 (26) n mi for the 12, 24, 36, 48, 72, 96, and 120 h forecasts, respectively. These errors are considerably lower than the average official track errors for the 10-yr period 1995-20041 (42, 75, 107, 138, 202, 236, and 310 n mi, respectively), with the Ophelia errors being about 50% less than the average from 12-72 hr (Table 4). The official forecasts were quite good in depicting the overall slow motion of Ophelia and the turn toward the west on 12-13 September. However, there were some larger errors for forecasts on 11-12 September that resulted from forecasting too fast of a northeastward motion as Ophelia passed near North Carolina.
The consensus models CONU, GUNS, and GUNA had lower track forecast errors than the official forecast at all times. Amongst the dynamical models, the ensemble mean of the National Weather Service Global Forecasting System had errors lower than the official forecast from 12-48 hr, while the United Kingdom Meteorological Office global model had lower errors than the official forecast at 96 and 120 hr.
Average official intensity errors were 5, 6, 8, 8, 8, 14, and 21 kt for the 12, 24, 36, 48, 72, 96, and 120 h forecasts, respectively. For comparison, the average official intensity errors over the 10-yr period 1995-2004 are 6, 10, 12, 15, 18, 20, and 22 kt, respectively. The intensity forecasts were accurate in predicting that Ophelia’s strengthening would be limited. Some errors resulted from the timing of the storm’s intensity cycles, while others resulted from landfall forecasts that did not verify.
Table 5 shows the coastal watches and warnings issued for Ophelia.
The development of Ophelia was fairly well forecast in TPC products. The surface trough that spawned both Ophelia and Nate was noted in the Tropical Weather Outlook (TWO) on 2 September, and the potential for Ophelia to develop was noted in both the TWO and the TAFB danger graphic product on 4 September.
1 Errors given for the 96 and 120 h periods are averages over the four-year period 2001-4.
4
Acknowledgements
Much of the data for this report was supplied by the National Weather Service WFOs in Melbourne and Jacksonville, Florida, Wilmington and Morehead City, North Carolina, and Charleston, South Carolina. Chris Fogarty of the Canadian Hurricane Center provided data showing that Ophelia made landfall in Nova Scotia as an extratropical low. NOAA buoy and C-MAN data were provided by the National Data Buoy Center, and were augmented by data from the Skidaway Institute of Oceanography, the Carolinas Coastal Ocean Observing and Prediction System (CARO-COOPS), the Coastal Ocean Research and Monitoring Program (CORMP), and the Gulf of Maine Ocean Observing System (GOMOOS). NOS data were provided by the NOAA National Ocean Service. Remote Automated Weather Stations (RAWS) data were provided by the National Interagency Fire Center. Much of the track for the extratropical portion of Ophelia was provided by the Ocean Prediction Center. Several of the unofficial observations were obtained from the Weather Underground web site.
5
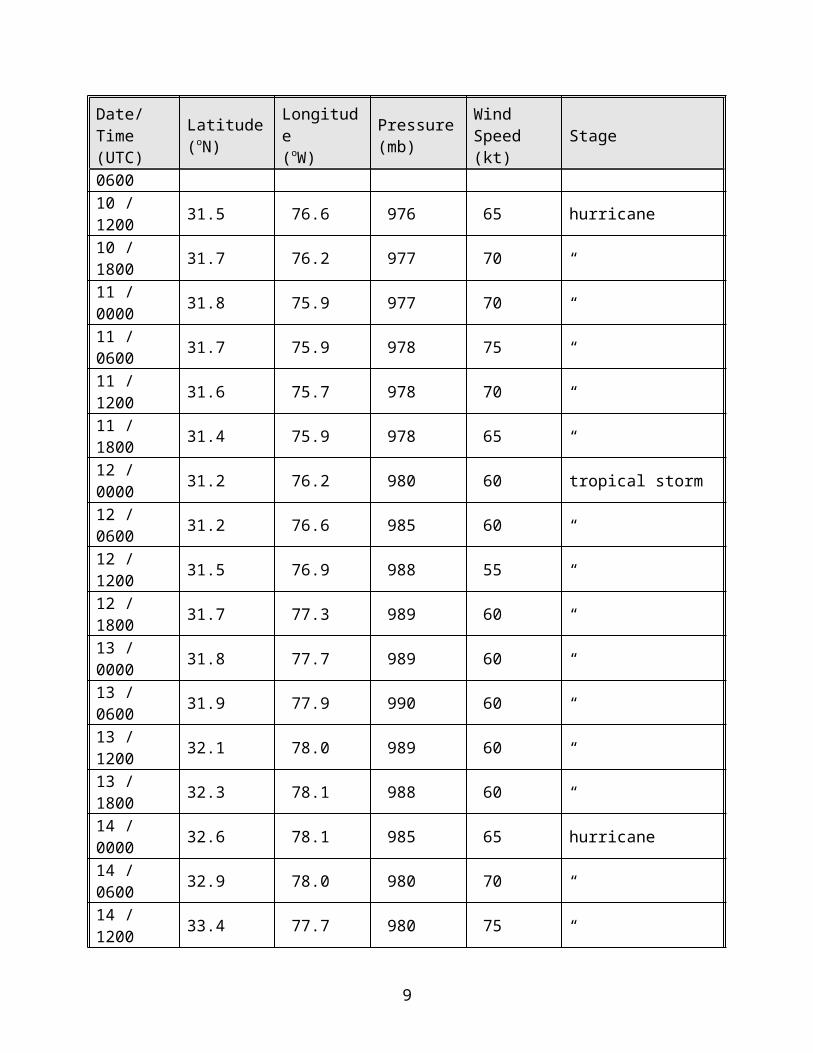
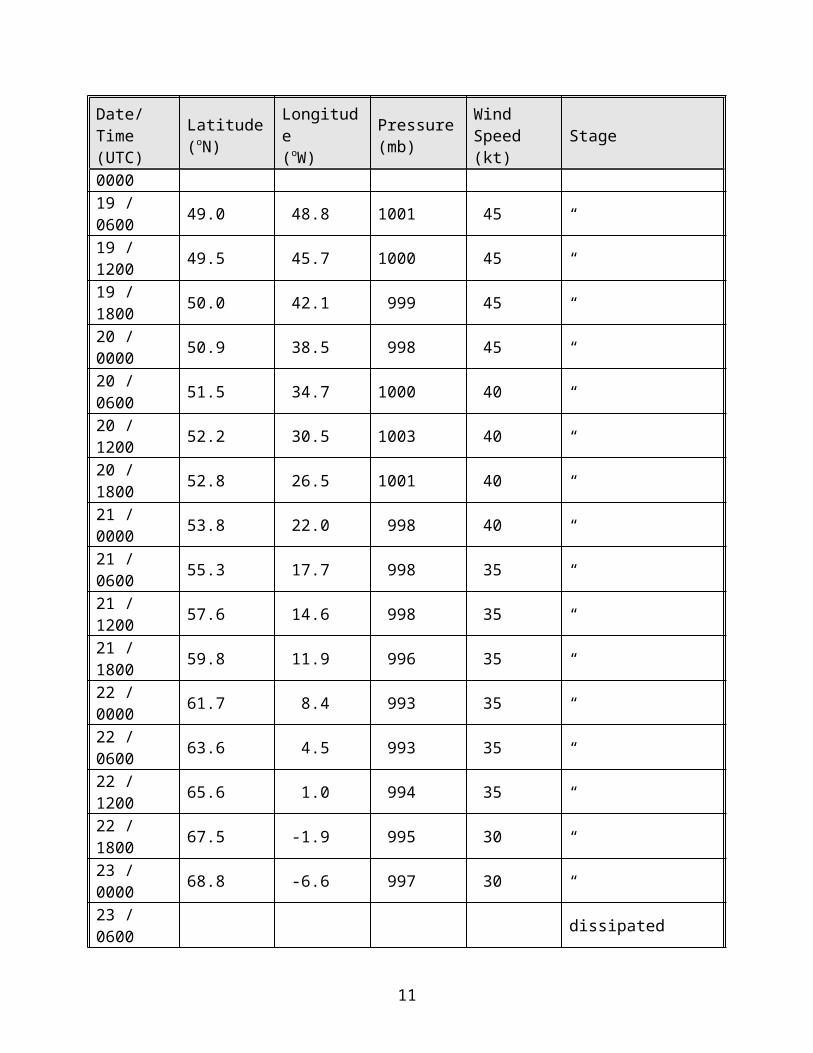
Table 1. Best track for Hurricane Ophelia, 6-17 September 2005. East longitudes are expressed as negative numbers.
Date/Time(UTC)
Latitude(oN)
Longitude(oW)
Pressure(mb)
Wind Speed(kt) Stage
06 / 0600 25.8 78.6 1009 25 tropical depression06 / 1200 26.3 78.3 1010 25 “06 / 1800 26.8 78.3 1010 25 “07 / 0000 27.4 78.5 1006 30 “07 / 0600 27.9 78.8 1003 35 tropical storm07 / 1200 28.7 79.2 1000 40 “07 / 1800 28.8 79.3 997 45 “08 / 0000 28.8 79.3 994 45 “08 / 0600 28.7 79.6 994 50 “08 / 1200 28.6 79.6 988 55 “08 / 1800 28.6 79.5 988 60 “09 / 0000 28.6 79.3 990 65 hurricane09 / 0600 28.9 79.3 990 55 tropical storm09 / 1200 29.3 79.1 983 55 “09 / 1800 29.8 78.5 983 65 hurricane10 / 0000 30.2 77.5 983 60 tropical storm10 / 0600 30.9 76.9 984 60 “10 / 1200 31.5 76.6 976 65 hurricane10 / 1800 31.7 76.2 977 70 “11 / 0000 31.8 75.9 977 70 “11 / 0600 31.7 75.9 978 75 “11 / 1200 31.6 75.7 978 70 “11 / 1800 31.4 75.9 978 65 “12 / 0000 31.2 76.2 980 60 tropical storm12 / 0600 31.2 76.6 985 60 “12 / 1200 31.5 76.9 988 55 “12 / 1800 31.7 77.3 989 60 “13 / 0000 31.8 77.7 989 60 “13 / 0600 31.9 77.9 990 60 “13 / 1200 32.1 78.0 989 60 “13 / 1800 32.3 78.1 988 60 “14 / 0000 32.6 78.1 985 65 hurricane14 / 0600 32.9 78.0 980 70 “14 / 1200 33.4 77.7 980 75 “14 / 1800 33.9 77.5 979 75 “15 / 0000 34.2 76.9 979 75 “15 / 0600 34.5 76.3 982 70 “15 / 1200 34.7 75.8 984 65 “15 / 1800 34.7 75.6 986 65 “16 / 0000 34.6 75.1 987 60 tropical storm
6
Date/Time(UTC)
Latitude(oN)
Longitude(oW)
Pressure(mb)
Wind Speed(kt) Stage
16 / 0600 34.7 74.8 993 55 “16 / 1200 35.4 74.4 995 50 “16 / 1800 36.4 73.6 993 55 “17 / 0000 37.3 72.7 995 55 “17 / 0600 38.7 71.4 1000 50 “17 / 1200 40.0 69.7 997 50 “17 / 1800 41.6 67.3 995 50 “18 / 0000 43.2 64.9 996 45 extratropical18 / 0600 44.8 62.6 1000 45 “18 / 1200 46.2 59.9 1000 45 “18 / 1800 47.4 56.2 999 45 “19 / 0000 48.4 52.3 1000 45 “19 / 0600 49.0 48.8 1001 45 “19 / 1200 49.5 45.7 1000 45 “19 / 1800 50.0 42.1 999 45 “20 / 0000 50.9 38.5 998 45 “20 / 0600 51.5 34.7 1000 40 “20 / 1200 52.2 30.5 1003 40 “20 / 1800 52.8 26.5 1001 40 “21 / 0000 53.8 22.0 998 40 “21 / 0600 55.3 17.7 998 35 “21 / 1200 57.6 14.6 998 35 “21 / 1800 59.8 11.9 996 35 “22 / 0000 61.7 8.4 993 35 “22 / 0600 63.6 4.5 993 35 “22 / 1200 65.6 1.0 994 35 “22 / 1800 67.5 -1.9 995 30 “23 / 0000 68.8 -6.6 997 30 “23 / 0600 dissipated
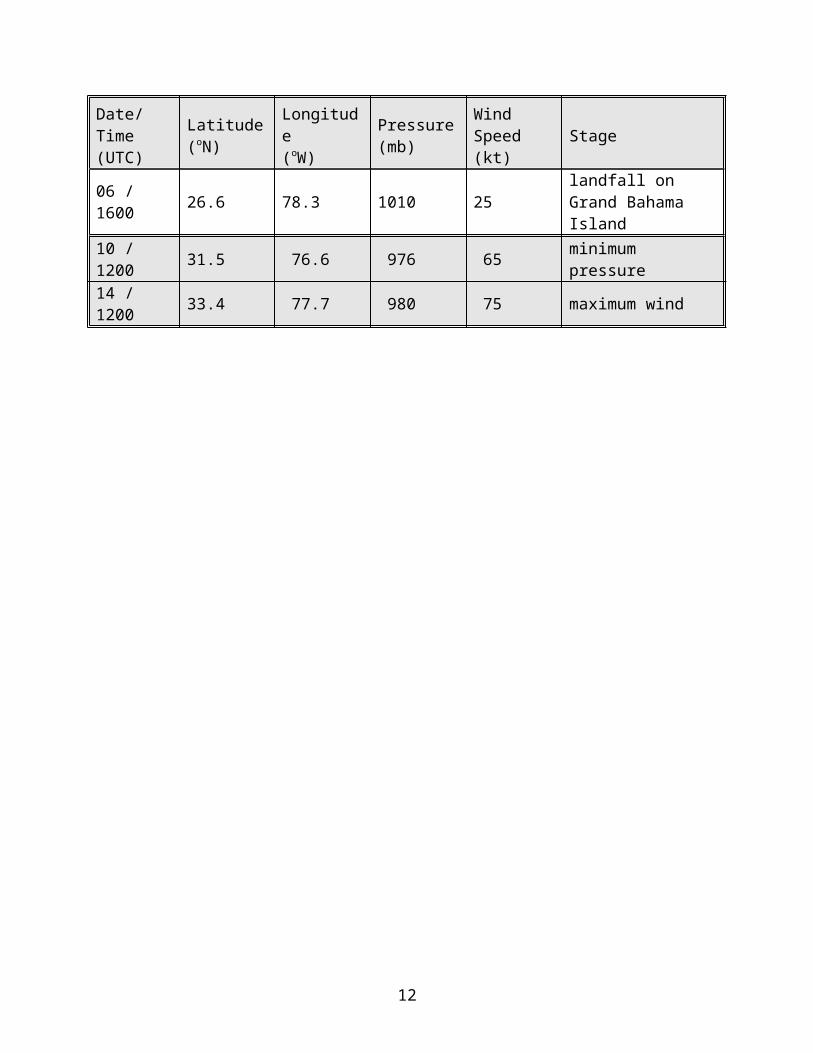
06 / 1600 26.6 78.3 1010 25 landfall on Grand Bahama Island
10 / 1200 31.5 76.6 976 65 minimum pressure14 / 1200 33.4 77.7 980 75 maximum wind
7
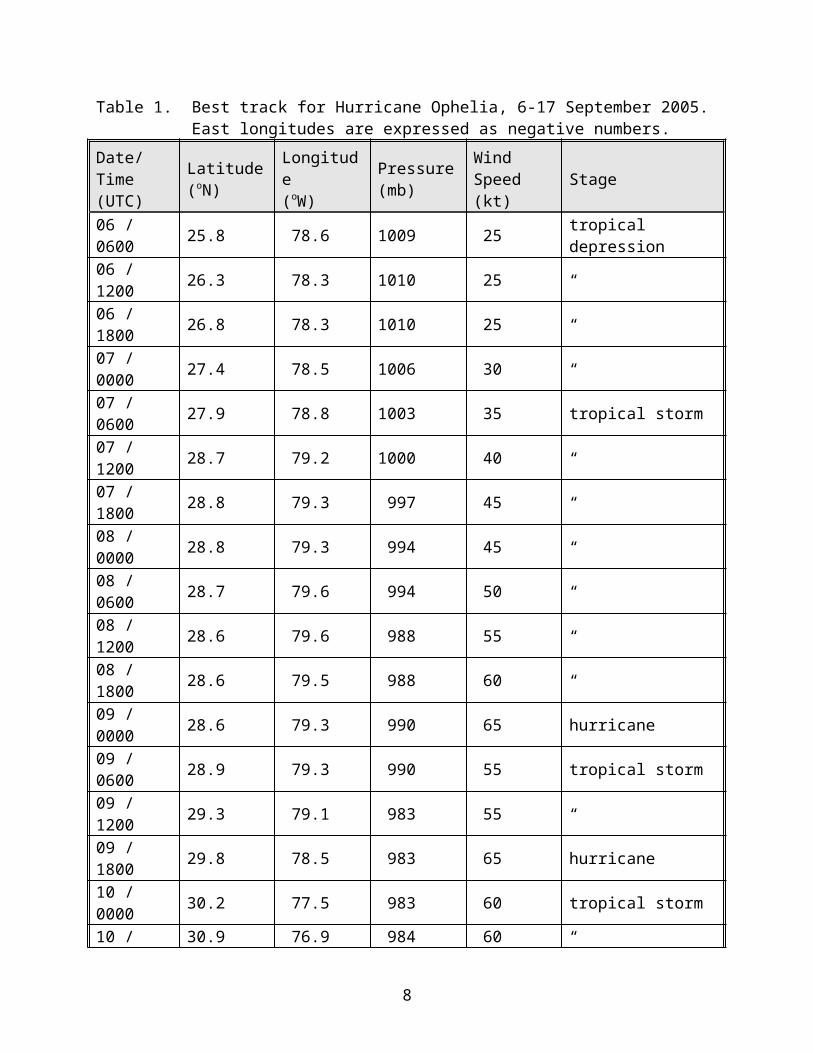
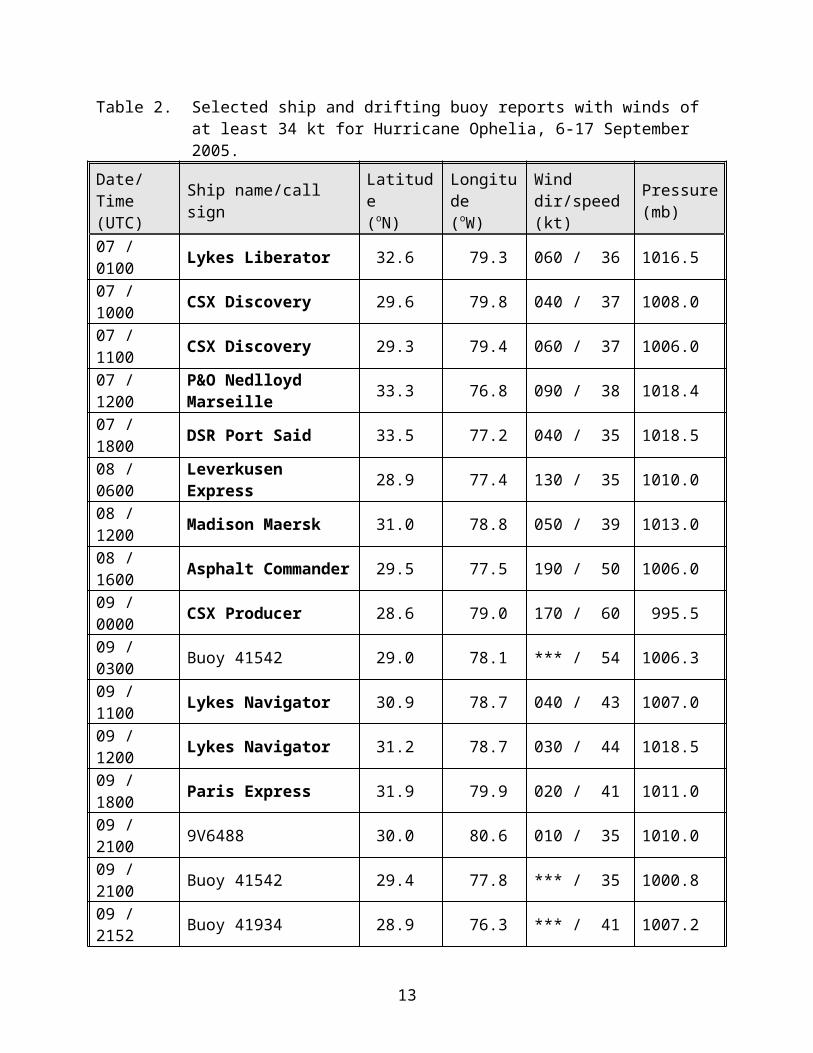
Table 2. Selected ship and drifting buoy reports with winds of at least 34 kt for Hurricane Ophelia, 6-17 September 2005.
Date/Time (UTC) Ship name/call sign Latitude
(oN)Longitude(oW)
Winddir/speed (kt)
Pressure(mb)
07 / 0100 Lykes Liberator 32.6 79.3 060 / 36 1016.507 / 1000 CSX Discovery 29.6 79.8 040 / 37 1008.007 / 1100 CSX Discovery 29.3 79.4 060 / 37 1006.0
07 / 1200 P&O Nedlloyd Marseille 33.3 76.8 090 / 38 1018.4
07 / 1800 DSR Port Said 33.5 77.2 040 / 35 1018.508 / 0600 Leverkusen Express 28.9 77.4 130 / 35 1010.008 / 1200 Madison Maersk 31.0 78.8 050 / 39 1013.008 / 1600 Asphalt Commander 29.5 77.5 190 / 50 1006.009 / 0000 CSX Producer 28.6 79.0 170 / 60 995.509 / 0300 Buoy 41542 29.0 78.1 *** / 54 1006.309 / 1100 Lykes Navigator 30.9 78.7 040 / 43 1007.009 / 1200 Lykes Navigator 31.2 78.7 030 / 44 1018.509 / 1800 Paris Express 31.9 79.9 020 / 41 1011.009 / 2100 9V6488 30.0 80.6 010 / 35 1010.009 / 2100 Buoy 41542 29.4 77.8 *** / 35 1000.809 / 2152 Buoy 41934 28.9 76.3 *** / 41 1007.209 / 2300 Bonn Express 30.4 76.9 130 / 45 1001.810 / 1800 Star Istind 32.8 76.2 050 / 44 1009.010 / 1800 Singapore Bay 33.7 74.8 090 / 40 1010.610 / 2100 Green Dale 33.7 77.0 040 / 40 1013.010 / 2200 Singapore Bay 32.2 74.8 260 / 39 1003.411 / 0019 Buoy 41935 31.2 76.3 *** / 62 1002.011 / 0236 Buoy 41935 31.2 76.3 *** / 70 1002.811 / 1700 Fortune Pioneer I 34.3 71.3 080 / 44 1021.011 / 2100 Jens Maersk 29.6 75.1 230 / 40 1010.511 / 2100 OOCL Freedom 33.6 77.1 030 / 47 1013.012 / 0600 Shanghai Express 29.9 78.4 320 / 35 1011.812 / 0600 ZCAM5 31.5 74.6 130 / 37 1009.512 / 1800 Sealand Performance 33.6 77.2 080 / 43 1007.512 / 2100 Sealand Performance 34.1 76.6 090 / 42 999.813 / 0000 Overseas New Orleans 33.1 78.1 050 / 45 1005.213 / 0600 Sealand Liberator 31.5 77.4 200 / 50 994.013 / 1800 OOCL Freedom 33.7 77.0 120 / 35 1007.514 / 0000 WABU 31.1 77.2 230 / 37 1006.414 / 0600 Montebello 31.4 77.7 240 / 51 1003.014 / 0600 Maersk New Orleans 32.4 76.5 160 / 62 1003.015 / 0000 Sanmar 34.5 75.3 150 / 64 1004.515 / 0300 Sanmar 34.3 75.2 210 / 51 1004.015 / 1200 Jens Maersk 32.8 74.5 180 / 35 1011.1
8
Date/Time (UTC) Ship name/call sign Latitude
(oN)Longitude(oW)
Winddir/speed (kt)
Pressure(mb)
15 / 1500 SHIP 33.5 75.5 210 / 51 1007.016 / 0000 HPII 33.4 73.3 190 / 4017 / 0000 ZDGR8 33.3 72.7 190 / 45 1015.617 / 0600 V7DI7 36.2 69.6 210 / 36 1016.217 / 1800 Afhankelijk 40.9 65.7 190 / 45 1003.617 / 1900 German Senator 41.8 62.1 260 / 37
9
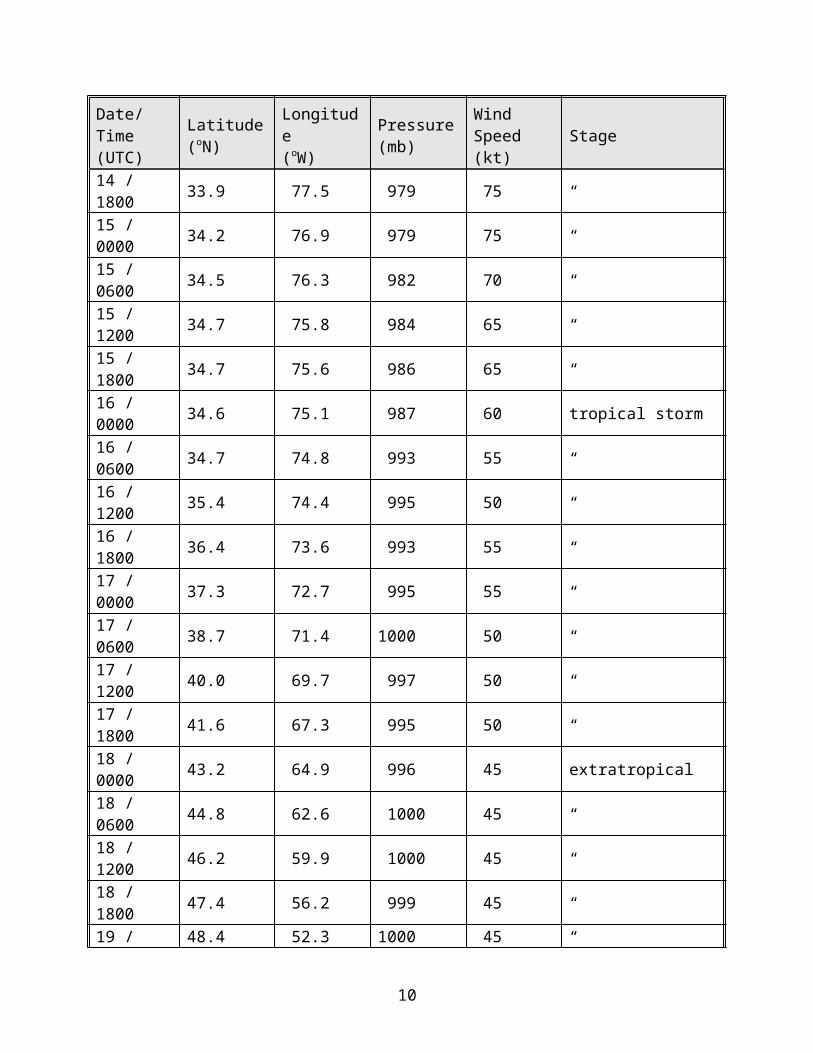
Table 3. Selected surface observations for Hurricane Ophelia, 6-17 September 2005.
Location
Minimum Sea Level Pressure
Maximum SurfaceWind Speed
Storm surge(ft)c
Stormtide(ft)d
Totalrain(in)Date/
time(UTC)
Press.(mb)
Date/time(UTC)a
Sustained(kt)b
Gust(kt)
Florida Bings Landing (NOS) 09/0900 1009.5 1.55Cape Canaveral (NASA Wind Tower 394) 08/1520 34 52
Fernandina Beach (NOS) 09/0900 1010.7 09/1000 16 28 1.65
Mayport (KNRB) 09/0826 1009.5 08/0412 28 34
Mayport (NOS) 09/0824 1010.1 08/1018 37 3.03
Melbourne (NWS) 1.96
NAS Jacksonville (KNIP) 09/0848 1010.2 08/1838 33NASA Shuttle Landing Facility (KTTS) 08/0855 1006.4 08/1855 19 38 2.79
New Smyrna Beach (KEVB) 09/1055 1008.8 08/2250 31 40
Patrick AFB (KCOF) 08/1955 1006.1 08/1955 25 36 2.03
St. Augustine (KSGJ) 09/0815 1008.8 07/1255 26 34
Vilano Beach (NOS) 1.93
North Carolina
Back Island (RAWS) 14/2315 55 7.04
Beaufort (KMRH) 14/2356 991.8 14/2328 37e 55e 4.78
Beaufort (RAWS) 15/0615 39 3.92
Bogue Field (KNJM) 14/2033 993.2
Cape Hatteras (KHSE) 15/1256 993.1 15/1256 57e 72e 2.85
Cherry Point (KNKT) 15/0555 994.2 15/0655 37 64 4.57
Croatan (RAWS) 15/0905 51 5.43
Elizabeth City (KECG) 15/0854 1008 15/1552 30 39 0.53
Elizabethtown (KEYF) 14/1820 1002.7 1.87
Hoffman Forest (RAWS) 15/0105 41 4.26
Kinston (KISO) 15/0643 23 34
Kenansville (KDPL) 14/1903 23 35
Kitty Hawk (KFFA) 15/1540 20 31
Manteo (KMQI) 15/1726 28 33Nature Conservancy (RAWS) 14/1715 53 11.74
10
Location
Minimum Sea Level Pressure
Maximum SurfaceWind Speed
Storm surge(ft)c
Stormtide(ft)d
Totalrain(in)Date/
time(UTC)
Press.(mb)
Date/time(UTC)a
Sustained(kt)b
Gust(kt)
New Bern (KEWN) 15/0354 1000.0 15/0241 32 44 3.46
New River (KNCA) 14/2156 994.2 14/2156 38 55 5.12
Newport (KMHX) 15/0420 990.5 15/0534 31 49 9.39
Onslow Beach (RSLN7) 14/2322 985.0 14/2125 53 68
Pea Island (PEIN7) 15/0850 1003.0 15/1236 57
Richlands (KOAJ) 15/0015 30 49
Sandy Run (RAWS) 15/0015 40 5.06
Southport (KSUT) 14/1504 988.1 14/1824 36 56 7.38
Stumpy Point (SPON7) 15/0750 1004.0 15/0740 37Sunset Beach (CARO-COOPS) 14/1324 995.6 14/1300 33 47 2.85
Sunny Point (RAWS) 14/1815 59 10.74
Swan Quarter (SWQN7) 15/0730 1000.0 15/0856 49
Turnbull Creek (RAWS) 14/1815 42 2.81
Washington (KOCW) 15/0643 20 33
Whiteville (RAWS) 14/1815 39 3.18
Wilmington (KILM) 14/1850 989.5 14/1658 42 59 8.23
Wrightsville Beach (NOS) 14/1854 984.8 14/1700 59 69 4.19
South Carolina
Charleston (KCHS) 13/2251 1006.8 13/2334 23 33 0.06
Charleston Harbor (NOS) 1.64Fripps Inlet (CARO-COOPS) 1.78
Myrtle Beach (KMYR) 14/1050 1000.7 14/0455 25 38North Myrtle Beach (KCRE) 14/1336 999.7 14/1253 20 33 6.30
Oyster Landing (NOS) 2.75South Capers Island (CARO-COOPS) 1.74
Springmaid Pier (NOS) 14/0942 1000.5 14/1800 24 37 2.81
Georgia
Fort Pulaski (NOS) 1.87Saint Simons Island (KSSI) 09/0900 1011.5 09/1546 30 1.44 1.69
11
Location
Minimum Sea Level Pressure
Maximum SurfaceWind Speed
Storm surge(ft)c
Stormtide(ft)d
Totalrain(in)Date/
time(UTC)
Press.(mb)
Date/time(UTC)a
Sustained(kt)b
Gust(kt)
Buoy/CMANNOAA Buoy 41001 (34.7N 72.7W) 15/2300 1011.5 16/1040 28f 37
NOAA Buoy 41002 (32.3N 75.4W) 10/2200 998.7 11/2200 49 67
NOAA Buoy 41004 (32.5N 79.1W) 13/2250 996.4 13/0030 45 57
NOAA Buoy 41009 (28.5N 80.2W) 08/1050 1002.3 08/1750 37 47
NOAA Buoy 41010 (29.0N 78.5W) 09/0820 1000.1 09/1350 37 49
NOAA Buoy 41012 (30.0N 80.6W) 09/1100 1006.2 08/1300 30 43
NOAA Buoy 41013 (33.4N 77.4W) 14/1000 980.8 14/1800 54 68
CARO-COOPS Buoy 41024 (33.8N 78.5W) 14/1300 994.9 14/1500 38 41
NOAA Buoy 41025 (35.0N 75.4W) 15/1500 988.7 15/1707 55f 73
CARO-COOPS Buoy 41030 (32.5N 79.3W) 13/2330 38 45
NOAA Buoy 41035 (34.5N 77.3W) 14/2120 982.0 14/2030 48f 62
CORMP Buoy 41038 (34.1N 77.7W) 142100 50 52
NOAA Buoy 44004 (38.5N 70.6W) 17/0800 1001.5 17/0730 40f 53
NOAA Buoy 44008 (40.5N 69.4W) 17/1200 1001.1 17/1100 33 43
NOAA Buoy 44014 (36.6N 74.8W) 16/1900 27f 35
GOMOOS Buoy 44024 (42.3N 65.9W) 17/2100 996.9 17/1900 27 35
Cape Lookout, NC (CKLN7) 15/0600 981.9 14/2309 65 80
Cedar Island, NC (CITN7) 15/0840 988.0 15/0838 78
Duck, NC (DUCN7) 15/0930 1008.5 15/1651 34 43Frying Pan Shoals, NC (FPSN7) 14/1300 980.7
Sabsoon Tower R8 (TYBG1) 13/2136 1005.4 13/0630 38 44
Sabsoon Tower R2 (SPAG1) 13/0431 31 35
12
Location
Minimum Sea Level Pressure
Maximum SurfaceWind Speed
Storm surge(ft)c
Stormtide(ft)d
Totalrain(in)Date/
time(UTC)
Press.(mb)
Date/time(UTC)a
Sustained(kt)b
Gust(kt)
Sabsoon Tower M2R6(SKMG1) 13/1934 1007.2 13/0234 35 41
St. Augustine, FL (SAUF1) 09/0905 1008.8 09/0105 34 43
Settlement Point, Grand Bahama (SPGF1) 08/2300 1008.5 07/0630 25 34
Unofficial Observations
Florida
Crescent City (CREF1) 3.02
Deland (COOP) 2.96
Hastings ARC (HTGF1) 3.65
Orange Springs (OSPF1) 1.59
Palm Bay (COOP) 2.11
Palm Coast (WOGF1) 3.95
Ponce Inlet (COOP) 2.65
Scottsmoor (COOP) 2.95S. Merrit Island (Weather Underground) 09/2000 1005.3 09/2050 34
Starke (SRKF1) 1.16
Titusville (COOP) 2.87
North Carolina
Bald Head Island 73Cedar Point (Weather Underground) 14/2330 987.7 14/1730 45
Davis 90
Jacksonville (JEON7) 5.79Jacksonville (Weather Underground) 14/2130 994.8 14/2335 43
Kinston (KNNN7) 3.59
Kure Beach La Que Center 68 6.20
Morehead City 70Morehead City (waterfront) 74
Morehead City (Weather Underground) 15/0530 986.7 15/0100 45
13
Location
Minimum Sea Level Pressure
Maximum SurfaceWind Speed
Storm surge(ft)c
Stormtide(ft)d
Totalrain(in)Date/
time(UTC)
Press.(mb)
Date/time(UTC)a
Sustained(kt)b
Gust(kt)
Oak Island Brunswick Co Water Treatment Plant 17.50
Oak Island (Weather Underground) 14/1530 990.7 14/1815 57
St. James (Weather Underground) 14/1530 985.7 14/1330 62
Southport (Weather Underground) 14/1600 987.0 14/1600 51
Surf City Pender Co NC 7.63
Tranters Creek (TRAN7) 3.98
Wallace (WCEN7) 3.28Watha (Weather Underground) 14/1818 997.2 15/0358 43
Wilmington (Weather Underground) 14/1821 989.4 14/1845 68
Wrightsville Beach 14/1649 70
Georgia
Woodbine 1.90
South Carolina
Charleston 13/1938 23 34 0.07
Isle of Palms 13/2330 1004.5 14/0230 22 37 0.18
Pineville 14/0102 19 32
a Date/time is for sustained wind when both sustained and gust are listed.b Except as noted, sustained wind averaging periods for C-MAN and land-based ASOS reports
are 2 min; buoy averaging periods are 8 min.c Storm surge is water height above normal astronomical tide level.d Storm tide is water height above National Geodetic Vertical Datum (1929 mean sea level).e Instrumentation failedf 10-minute average
14
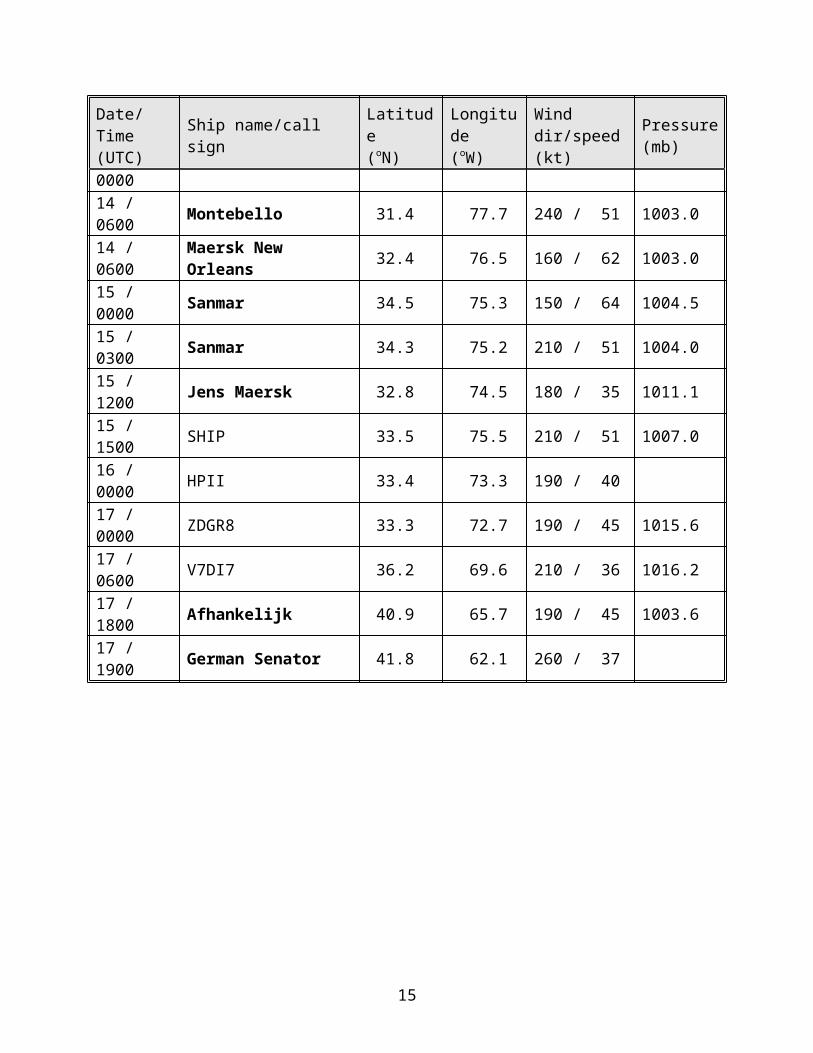
Table 4. Preliminary forecast evaluation (heterogeneous sample) for Hurricane Ophelia, 6-17 September 2005. Forecast errors (n mi) are followed by the number of forecasts in parentheses. Errors smaller than the NHC official forecast are shown in bold-face type. Verification includes the depression stage, but does not include the extratropical stage, if any.
Forecast Technique
Forecast Period (h)
12 24 36 48 72 96 120CLP5 39 (45) 85 (43) 133 (41) 163 (39) 223 (35) 332 (31) 462 (27)GFDI 25 (42) 42 (40) 54 (38) 75 (36) 157 (32) 278 (27) 383 (23)GFDL* 30 (42) 44 (40) 59 (38) 71 (36) 136 (32) 252 (27) 353 (23)GFNI 25 (42) 41 (39) 64 (37) 96 (35) 164 (31) 278 (26) 425 (22)GFDN* 29 (41) 46 (39) 60 (36) 89 (34) 153 (30) 263 (25) 396 (22)FV4 30 (41) 62 (40) 91 (39) 128 (37) 237 (33) 379 (29) 561 (25)AF1I 38 (16) 68 (16) 102 (16) 150 (16) 294 (16)AFW1* 53 (8) 80 (8) 105 (8) 140 (8) 256 (8)COAI 34 (43) 57 (39) 86 (37) 120 (35) 191 (31)COAL* 36 (21) 59 (20) 79 (19) 109 (18) 177 (16)COEI 32 (24) 60 (24) 93 (24) 130 (22)COCE* 36 (12) 60 (12) 89 (12) 122 (11)ETAI 55 (41) 112 (39) 168 (37) 207 (34) 318 (23)ETA* 50 (41) 106 (39) 158 (36) 207 (30) 292 (22)GFSI 20 (40) 36 (38) 55 (36) 75 (34) 156 (30) 278 (26) 357 (22)GFSO* 23 (40) 34 (38) 53 (36) 69 (34) 133 (30) 247 (26) 343 (22)AEMI 21 (41) 35 (39) 47 (37) 62 (35) 129 (31) 221 (27) 271 (23)AEMN* 22 (41) 34 (39) 44 (37) 53 (35) 104 (31) 202 (27) 255 (23)NGPI 24 (45) 43 (43) 57 (41) 74 (39) 112 (33) 168 (29) 275 (25)NGPS* 24 (44) 40 (42) 54 (40) 70 (38) 112 (33) 167 (29) 289 (25)UKMI 25 (43) 40 (41) 52 (39) 60 (37) 143 (33) 129 (29) 169 (25)UKM* 27 (22) 45 (21) 50 (20) 68 (19) 116 (17) 129 (15) 120 (13)CMC* 33 (18) 51 (17) 69 (16) 78 (16) 144 (14) 271 (6) 522 (5)CEMN* 33 (10) 44 (9) 62 (9) 76 (8) 122 (7) 159 (6) 127 (4)EMXI 27 (23) 49 (22) 74 (21) 110 (20) 198 (18) 283 (16) 362 (14)EMX* 24 (21) 44 (20) 62 (19) 89 (18) 167 (16) 267 (14) 354 (12)EEMN* 42 (10) 67 (10) 92 (9) 128 (9) 216 (8) 283 (7) 238 (4)A98E 35 (44) 55 (42) 91 (40) 124 (38) 227 (34) 404 (30) 515 (26)A9UK 34 (20) 52 (20) 87 (19) 134 (18) 246 (16)BAMD 30 (43) 51 (41) 78 (39) 111 (37) 223 (33) 433 (29) 653 (25)BAMM 34 (43) 58 (41) 85 (39) 105 (37) 151 (33) 257 (29) 382 (25)BAMS 49 (43) 87 (41) 117 (39) 142 (37) 177 (33) 270 (29) 385 (25)LBAR 29 (45) 58 (43) 105 (41) 181 (39) 450 (35) 576 (24) 592 (13)CONU 19 (44) 30 (42) 39 (40) 48 (38) 93 (33) 131 (29) 203 (25)GUNA 18 (40) 29 (38) 38 (36) 47 (34) 96 (30) 133 (26) 180 (22)GUNS 20 (41) 32 (39) 41 (37) 49 (35) 99 (30) 123 (26) 181 (22)FSSE 18 (41) 28 (39) 44 (37) 62 (35) 115 (31) 180 (27) 205 (23)OHPC 29 (41) 43 (39) 54 (37) 68 (35) 101 (31) 157 (27) 214 (23)OFCI 25 (43) 42 (41) 60 (39) 79 (37) 118 (33) 165 (29) 216 (25)OFCL 23 (44) 38 (42) 53 (40) 68 (38) 103 (34) 157 (30) 200 (26)
NHC Official(1995-2004 mean)
42 (3400) 75 (3116) 107 (2848) 138 (2575) 202 (2117) 236 (649) 310 (535)
* Output from these models was unavailable at forecast time.
15
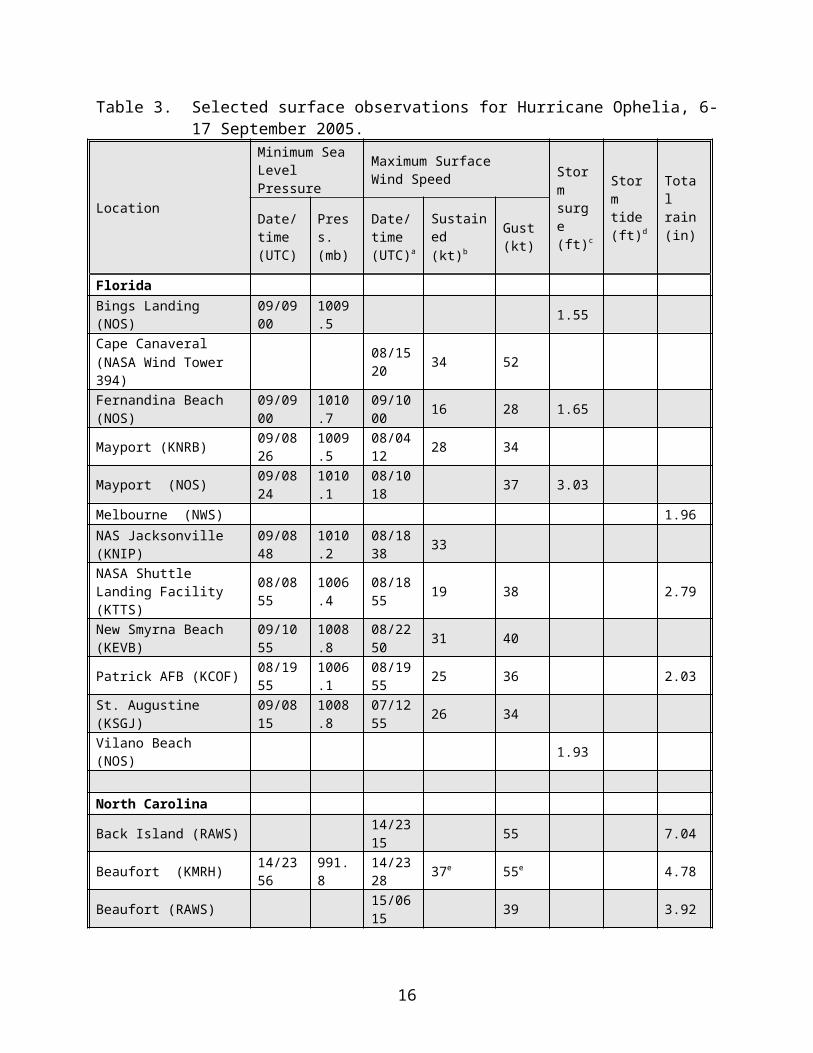
Table 5. Watch and warning summary for Hurricane Ophelia, 6-17 September 2005. Date/Time (UTC) Action Location
6 / 1500 Tropical Storm Warning issued Florida east coast from Jupiter to Titusville
6 / 1500 Tropical Storm Warning issued Grand Bahama, Abaco and Bimini Islands
7 / 0300 Tropical Storm Watch issued Florida east coast from Titusville to Flagler Beach
7 / 0900 Tropical Storm Watch extended northward
Florida east coast from Flagler Beach to Fernandina Beach
7 / 0900 Tropical Storm Warning issued Florida east coast from Sebastian Inlet to Flagler Beach
7 / 0900 Tropical Storm Warning discontinued
Florida east coast from Jupiter to Sebastian Inlet and the Bahamas
7 / 2100 Tropical Storm Warning discontinued Sebastian Inlet to Cocoa Beach
8 / 2100 Tropical Storm Warning extended Cocoa Beach to Sebastian Inlet
9 / 1500 All watches and warnings discontinued Florida east coast
10 / 1500 Hurricane Watch issued Savannah River, South Carolina to Cape Lookout, North Carolina
11 / 0900 Hurricane Watch discontinued
South Carolina coast from Savannah River to Edisto Beach
11 / 2100 Tropical Storm Warning issued South Santee River, South Carolina to Cape Lookout, North Carolina
12 / 0900 Tropical Storm Warning extended South Carolina coast from South Santee River to Edisto Beach
13 / 0300 Hurricane Warning issued South Santee River, South Carolina to Cape Lookout, North Carolina
13 / 0300 Tropical Storm Warning issuedNorth Carolina coast from Cape Lookout to Oregon Inlet including Pamlico Sound
13 / 0900 Hurricane Watch issuedNorth Carolina coast from Cape Lookout to Oregon Inlet including Pamlico Sound
13 / 2100 Hurricane Warning issued North Carolina coast from Cape Lookout to Cape Hatteras
13 / 2100 Hurricane Watch and Tropical Storm Warning issued
North Carolina coast from Oregon Inlet to NC/VA border
13 / 2100 Tropical Storm Watch issued Virginia coast from the NC/VA border to Cape Charles Light
13 / 2200 Hurricane Warning extended North Carolina coast from Cape Hatteras to Oregon Inlet including Pamlico Sound
16
Date/Time (UTC) Action Location
14 / 1500 Hurricane Warning issued Oregon Inlet to NC/VA border including Albemarle Sound
14 / 1500 Hurricane Watch and Tropical Storm Warning issued
Virginia coast from the NC/VA border to Cape Charles Light including lower Chesapeake Bay
14 / 1500 Hurricane Warning discontinued South Carolina coast from South Santee River to Little River
14 / 1500 Tropical Storm Warning discontinued
South Carolina coast south of South Santee River
14 / 1500 Hurricane Watch discontinued South Carolina coast from Edisto Beach to Little River Inlet
14 / 2100 Tropical Storm Warning discontinued South Carolina coast
15 / 0300 Hurricane Warning changed to Tropical Storm Warning
North Carolina coast from Cape Fear to Surf City
15 / 0300 Hurricane Warning discontinued South of Cape Fear, North Carolina
15 / 0900 Hurricane Watch discontinuedVirginia coast from the NC/VA border to Cape Charles Light including lower Chesapeake Bay
15 / 0900 Tropical Storm Warning discontinued
North Carolina coast from Cape Fear to Surf City
15 / 2100 Tropical Storm Watch issuedMassachuestts coast from Woods Hole to Plymouth including Martha’s Vineyard and Nantucket
15 / 2100 Hurricane warning changed to Tropical Storm Warning
Cape Lookout to Cape Charles Light
16 / 0300 Tropical Storm Watch extended Plymouth, Massacuusetts to Point Judith, Rhode Island
16 / 0300 Tropical Storm Warning discontinued
Virginia coast from the NC/VA Border to Cape Charles Light including lower Chesapeake Bay
16 / 0900 Tropical Storm Watch issued Nova Scotia from Yarmouth to Lunenburg
16 / 1500 Tropical Storm Warning issued Watch Hill, Rhode Island to Plymouth, Massachuestts
16 / 1500 All warnings discontinued North Carolina coast
16 / 2100 Tropical Storm Watch issued Nova Scotia from Yarmouth to Halifax
17 / 0300 Tropical Storm Warning issued Nova Scotia from Yarmouth to Lunenberg
17 / 0300 Tropical Storm Watch extended Nova Scotia from Yarmouth to Truno
17 / 0300 Tropical Storm Watch extended Nova Scotia from Lunenberg to Street Harbour
17
Date/Time (UTC) Action Location
17 / 0300 Tropical Storm Warning discontinued
Watch Hill, Rhode Island to Westport, Massachusetts
17 / 0900 Tropical Storm Warning discontinued
Massachusetts coast from Westport to Woods Hole
17 / 1200 Tropical Storm Warning issued Nova Scotia except Cumberland and Colchester
17 / 1200 Tropical Storm Watch issued Prince Edward Island
17 / 1200 Tropical Storm Watch issued Nova Scotia from Cumberland to Colchester
17 / 1500 All warnings discontinued Massachusetts coast
18
15
20
25
30
35
40
45
50
55
60
65
70
-85 -80 -75 -70 -65 -60 -55 -50 -45 -40 -35 -30 -25 -20 -15 -10 -5 0
Hurricane Ophelia6 - 17 September 2005
HurricaneTropical StormTropical Dep.ExtratropicalSubtr. StormSubtr. Dep.
00 UTC Pos/Date12 UTC Position
Low / Wave
PPP Min. press (mb)
1098 7
22
21
20
19
18
151413
12
11
16
17
976 mb
25
30
35
-80 -75
10
98
7
15
1413
12
11
16
976 mb
Figure 1. Best track positions for Hurricane Ophelia, 6 – 17 September 2005. Track during the extratropical stage is based on analyses from the NOAA Ocean Prediction Center.
20
30
40
50
60
70
80
90
100
110
9/5 9/7 9/9 9/11 9/13 9/15 9/17 9/19 9/21 9/23
Hurricane OpheliaSeptember 6 - 17 2005
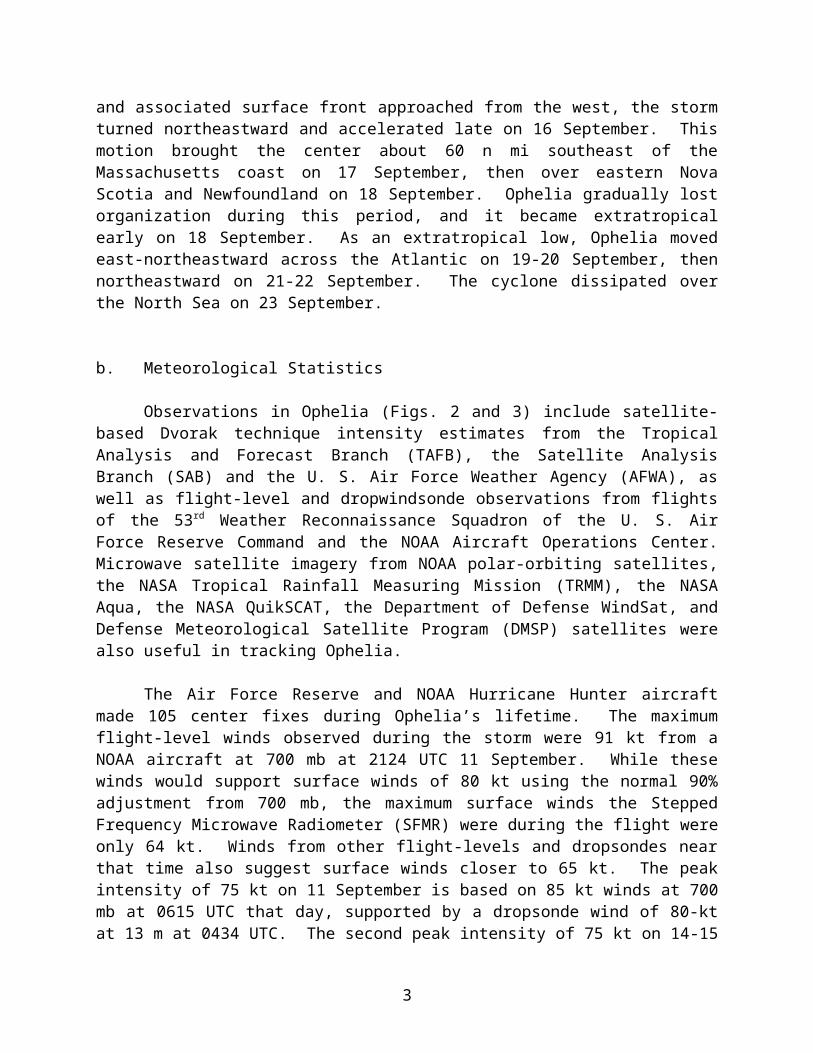
BEST TRACKSat (TAFB)Sat (SAB)Sat (AFWA)Obj T-NumAC (sfc)AC (flt>sfc)AC (DVK P>W)SurfaceDrop (sfc)Drop (LLM xtrp)Drop (MBL xtrp)
Win
d S
peed
(kt)
Date (Month/Day)Figure 2. Selected wind observations and best track maximum sustained surface wind speed curve for Hurricane Ophelia, 6-17
September 2005. Aircraft observations have been adjusted for elevation using 90%, 80%, and 80% reduction factors for observations from 700 mb, 850 mb, and 1500 ft, respectively. Dropwindsonde observations include actual 10 m winds (sfc), as well as surface estimates derived from the mean wind over the lowest 150 m of the wind sounding (LLM), and from the sounding boundary layer mean (MBL). Objective Dvorak estimates represent averages over a three-hour period centered on the nominal observation time. Estimates during the extratropical stage are based on analyses from the NOAA Ocean Prediction Center.
960
970
980
990
1000
1010
1020
9/5 9/7 9/9 9/11 9/13 9/15 9/17 9/19 9/21 9/23
Hurricane OpheliaSeptember 6 - 17 2005
BEST TRACKSat (TAFB)
Sat (SAB)Sat (AFWA)Obj T-NumAC (sfc)Surface
Pre
ssur
e (m
b)
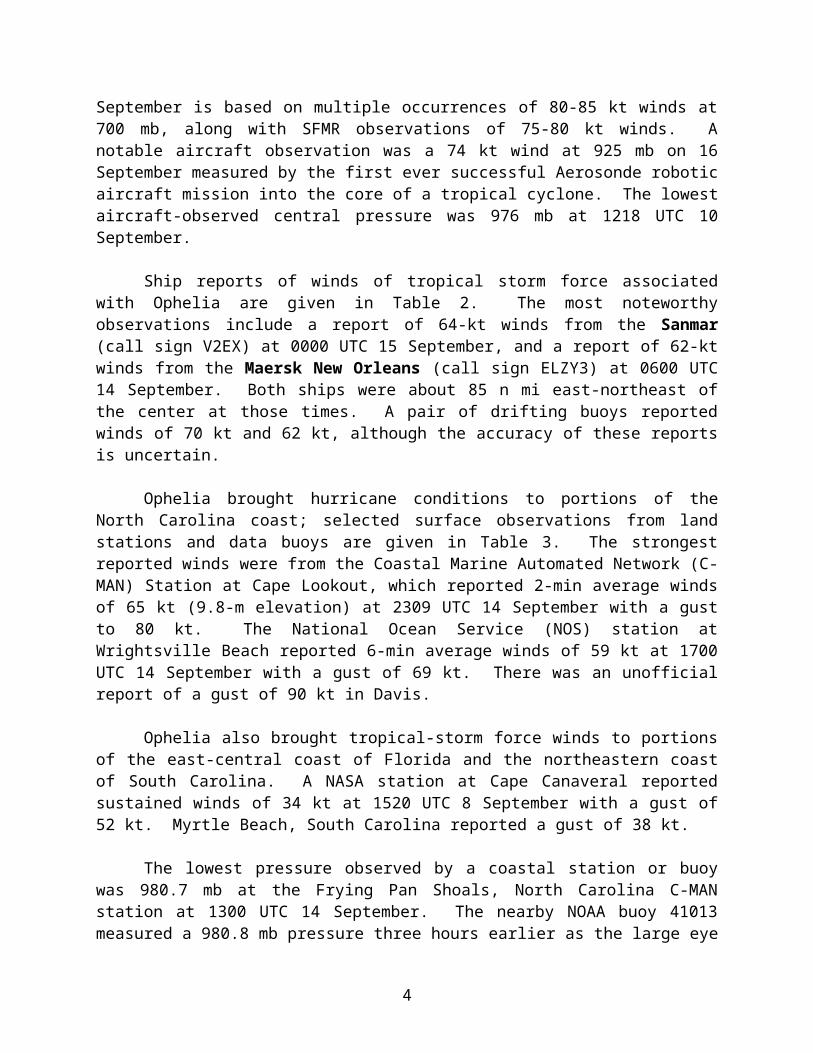
Date (Month/Day)Figure 3. Selected pressure observations and best track minimum central pressure curve for Hurricane Ophelia, 6-17 September
2005. Objective Dvorak estimates represent averages over a three-hour period centered on the nominal observation time. Estimates during the extratropical stage are based on analyses from the NOAA Ocean Prediction Center.