Embed Size (px)
Citation preview
Tropical Cyclone Rainfall Tropical Cyclone Rainfall --
Southwest United States Southwest United States and Northwest Mexicoand Northwest Mexico
David RothNOAA Hydrometeorological Prediction
CenterCamp Springs, MD
September 19, 2007
Tropical Cyclone Tropical Cyclone
Rainfall ClimatologyRainfall Climatology
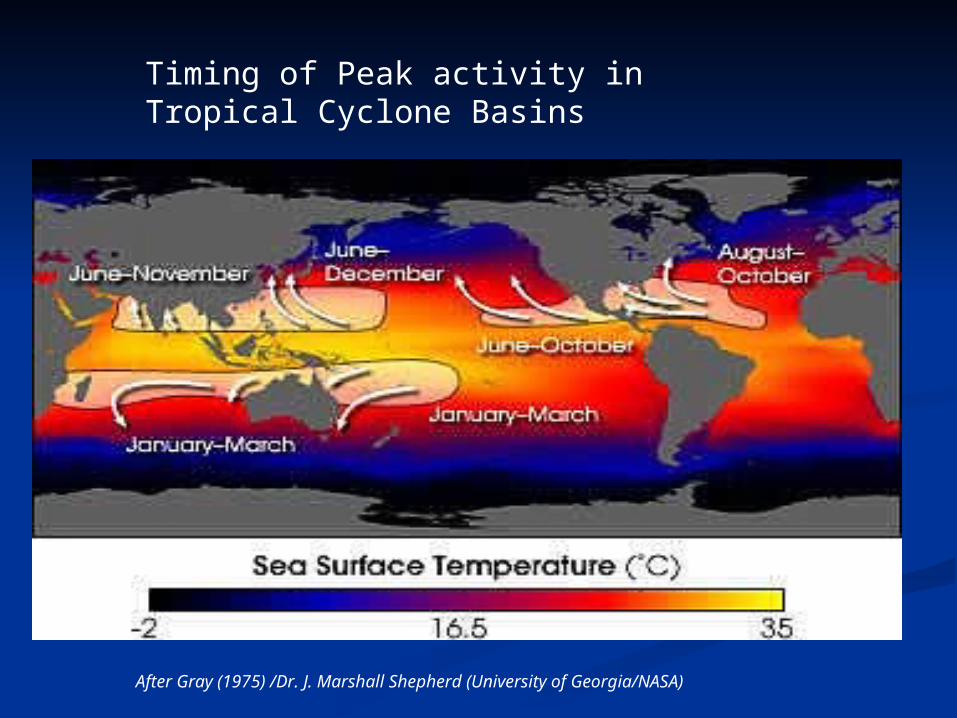
Timing of Peak activity in Tropical Cyclone Basins
After Gray (1975) /Dr. J. Marshall Shepherd (University of Georgia/NASA)
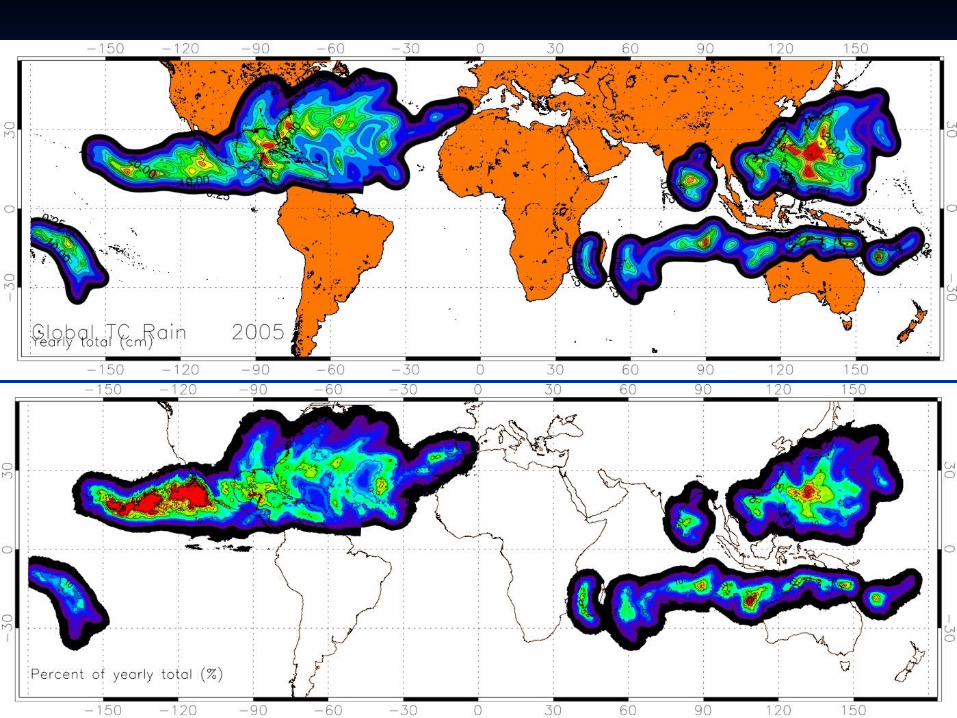
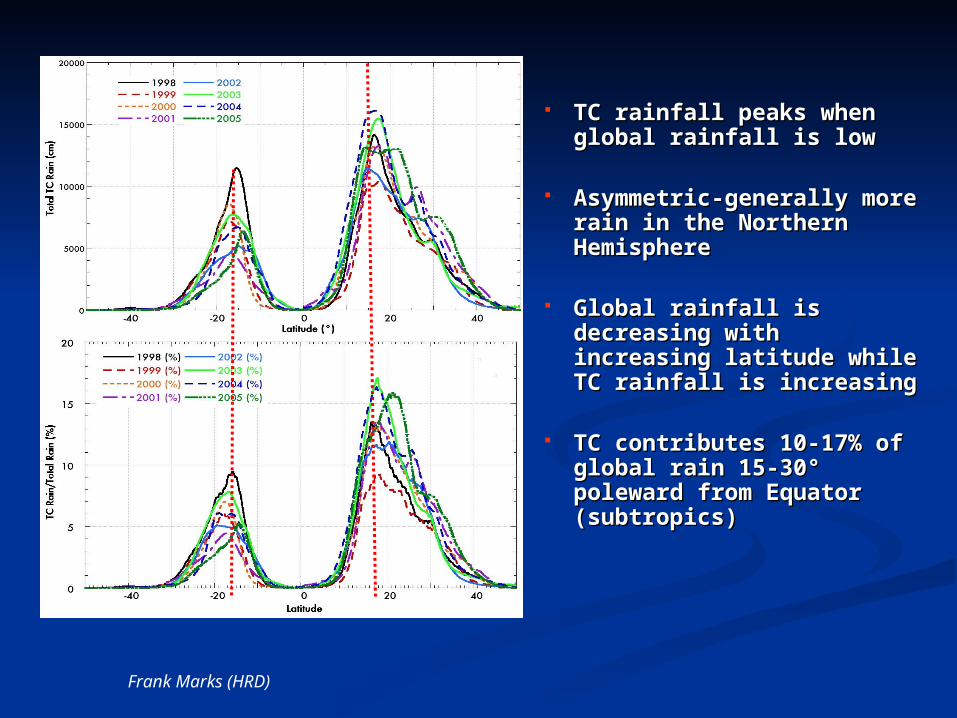
TC rainfall peaks when TC rainfall peaks when global rainfall is lowglobal rainfall is low
Asymmetric-generally Asymmetric-generally more rain in the more rain in the Northern HemisphereNorthern Hemisphere
Global rainfall is Global rainfall is decreasing with decreasing with increasing latitude while increasing latitude while TC rainfall is increasingTC rainfall is increasing
TC contributes 10-17% of TC contributes 10-17% of global rain 15-30° global rain 15-30° poleward from Equator poleward from Equator (subtropics)(subtropics)
050000100000150000200000250000300000350000-40-20020401998 (cm)1999 (cm)2000 (cm)2001 (cm)2002 (cm)2003 (cm)2004 (cm)2005 (cm)
050000100000150000200000250000300000350000-40-20020401998 (cm)1999 (cm)2000 (cm)2001 (cm)2002 (cm)2003 (cm)2004 (cm)2005 (cm)
TC Rain
Frank Marks (HRD)
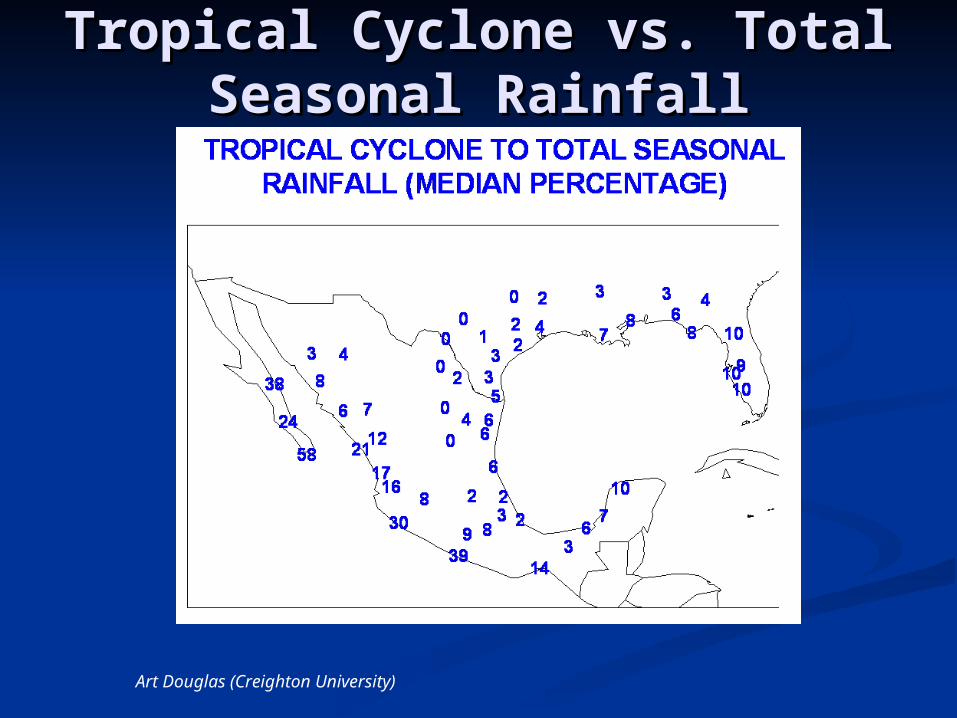
Tropical Cyclone vs. Total Tropical Cyclone vs. Total Seasonal RainfallSeasonal Rainfall
Art Douglas (Creighton University)
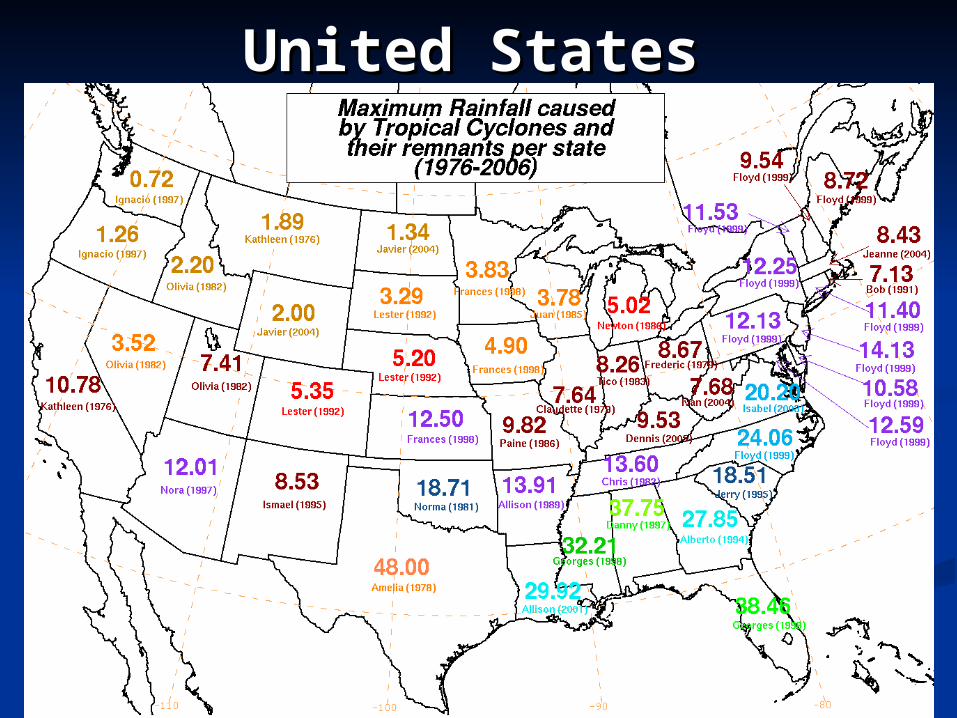
United StatesUnited States
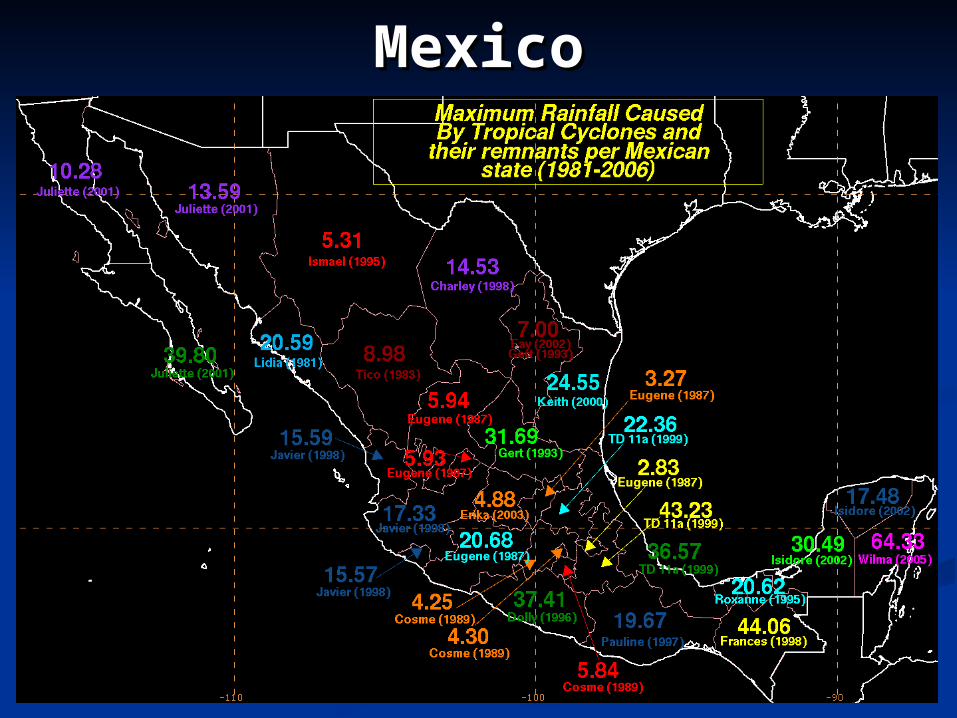
MexicoMexico
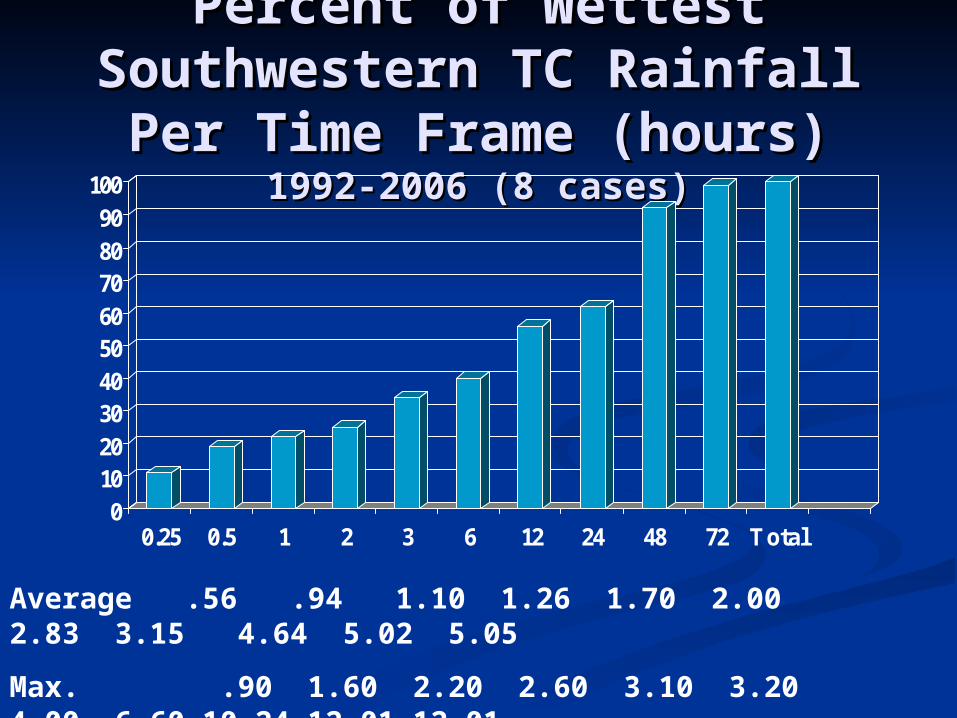
Percent of Wettest Percent of Wettest Southwestern TC Rainfall Southwestern TC Rainfall Per Time Frame (hours)Per Time Frame (hours)
1992-2006 (8 cases)1992-2006 (8 cases)
0102030405060708090
100
0.25 0.5 1 2 3 6 12 24 48 72 Total
Average .56 .94 1.10 1.26 1.70 2.00 2.83 3.15 4.64 5.02 5.05
Max. .90 1.60 2.20 2.60 3.10 3.20 4.00 6.60 10.24 12.01 12.01
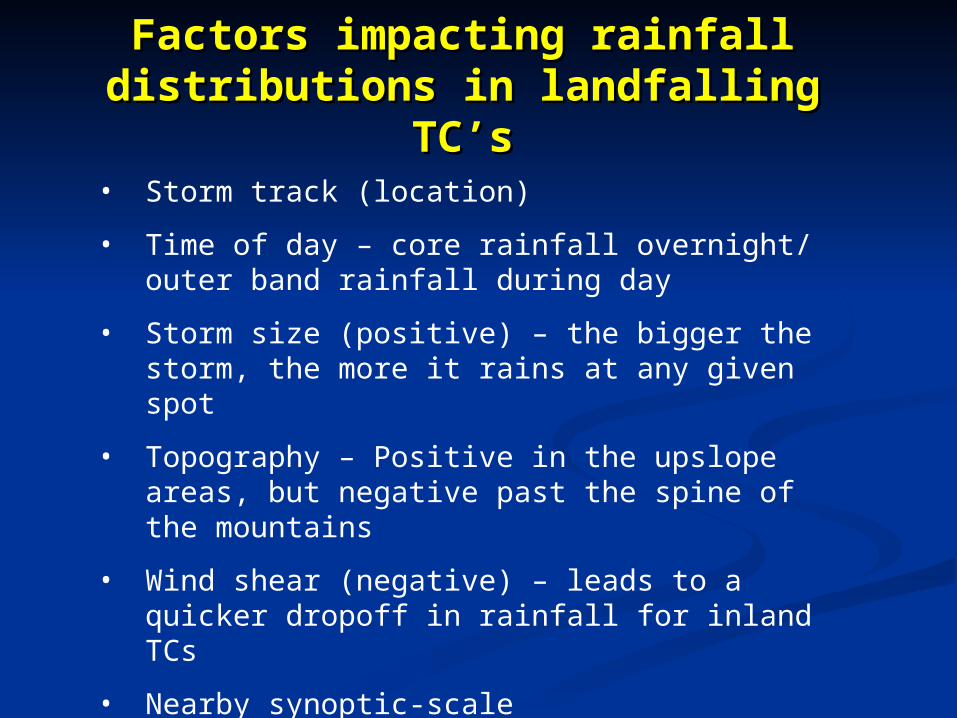
• Storm track (location)
• Time of day – core rainfall overnight/ outer band rainfall during day
• Storm size (positive) – the bigger the storm, the more it rains at any given spot
• Topography – Positive in the upslope areas, but negative past the spine of the mountains
• Wind shear (negative) – leads to a quicker dropoff in rainfall for inland TCs
• Nearby synoptic-scale features/Extratropical Transition
Factors impacting rainfall Factors impacting rainfall distributions in landfalling TC’sdistributions in landfalling TC’s
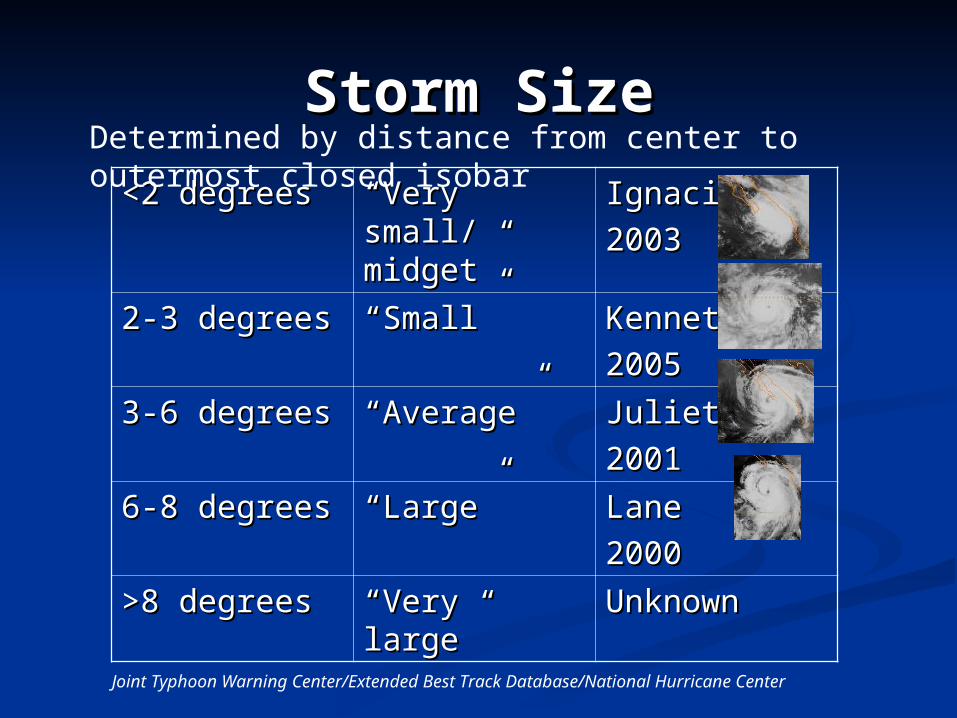
Storm SizeStorm Size
<2 degrees<2 degrees ““Very small/ Very small/ midget”midget”
IgnacioIgnacio
20032003
2-3 degrees2-3 degrees ““Small”Small” KennethKenneth
20052005
3-6 degrees3-6 degrees ““Average”Average” JulietteJuliette
20012001
6-8 degrees6-8 degrees ““Large”Large” LaneLane
20002000
>8 degrees>8 degrees ““Very large”Very large” UnknownUnknown
Determined by distance from center to outermost closed isobar
Joint Typhoon Warning Center/Extended Best Track Database/National Hurricane Center
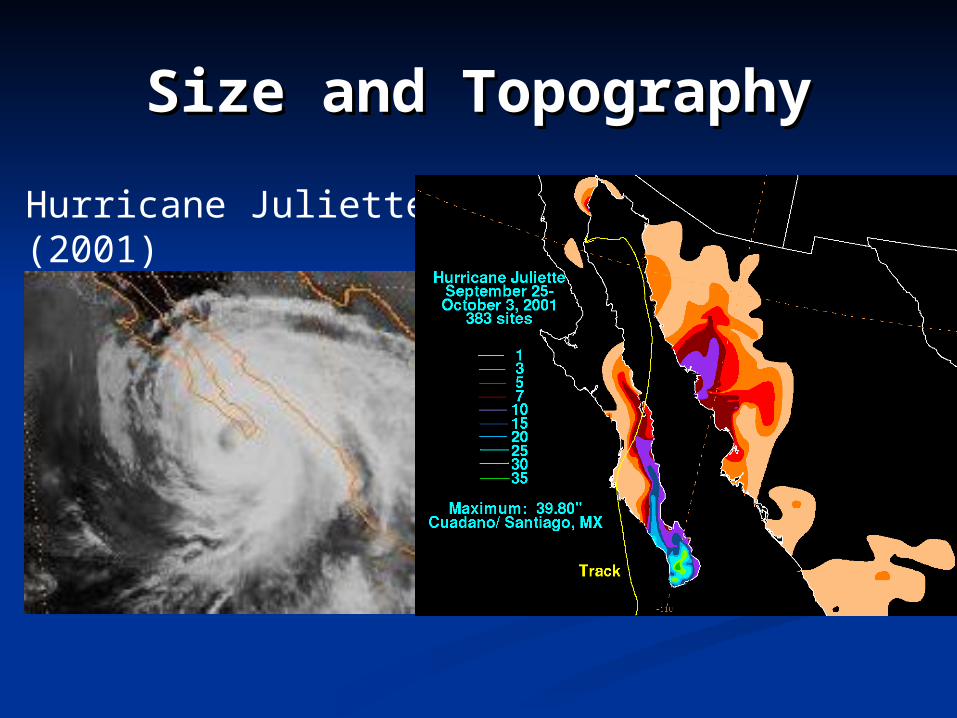
Size and TopographySize and Topography
Hurricane Juliette (2001)
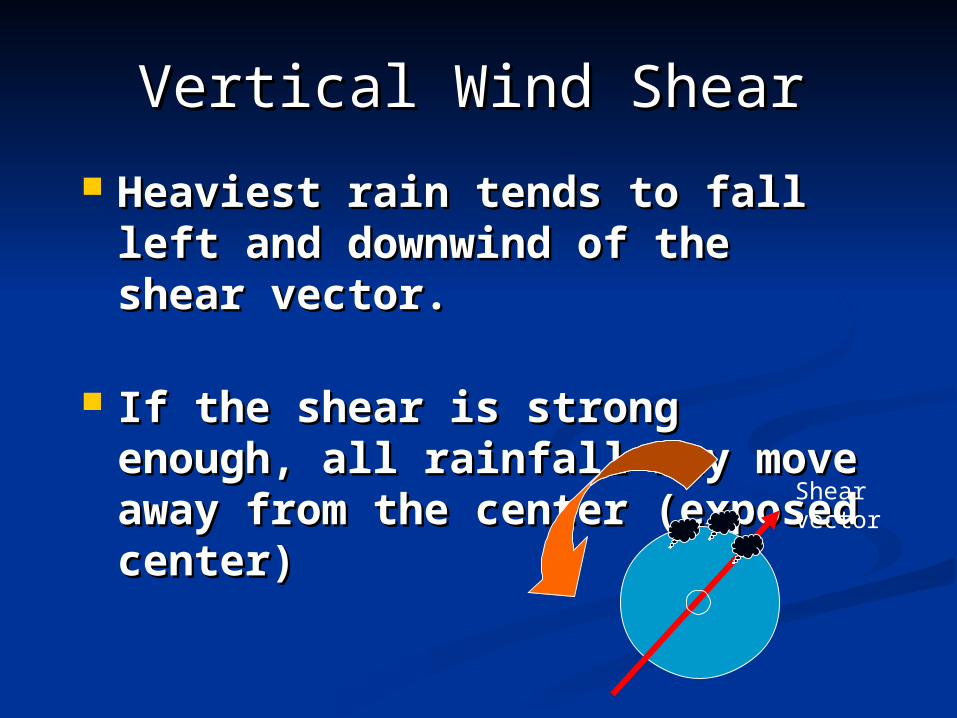
Vertical Wind ShearVertical Wind Shear
Heaviest rain tends to fall left Heaviest rain tends to fall left and downwind of the shear and downwind of the shear vector.vector.
If the shear is strong enough, If the shear is strong enough, all rainfall may move away all rainfall may move away from the center (exposed from the center (exposed center)center)
Shearvector
Heavy Rainfall Heavy Rainfall PREceding TCsPREceding TCs
Termed “PRE” rainfall by Matthew Termed “PRE” rainfall by Matthew Cote/SUNY-Albany researcher of PRE Cote/SUNY-Albany researcher of PRE events (and supplier of PRE-related slides)events (and supplier of PRE-related slides)
Well-removed to the north of a tropical Well-removed to the north of a tropical cyclone and associated with an cyclone and associated with an approaching frontal zone and ahead of approaching frontal zone and ahead of significant upper level troughsignificant upper level trough
Appears to be the dominant method a TC-Appears to be the dominant method a TC-related rainfall across the Western United related rainfall across the Western United States States
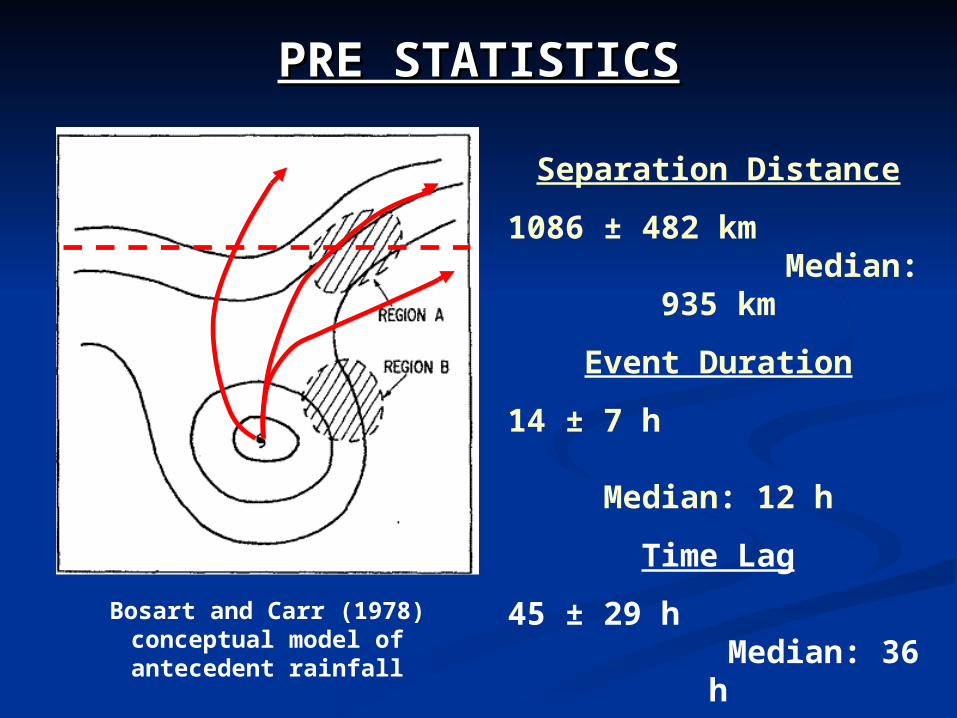
Bosart and Carr (1978) conceptual model of antecedent rainfall
PRE STATISTICSPRE STATISTICS
Separation Distance
1086 ± 482 km Median: 935 km
Event Duration
14 ± 7 h Median: 12 h
Time Lag
45 ± 29 h Median: 36 h
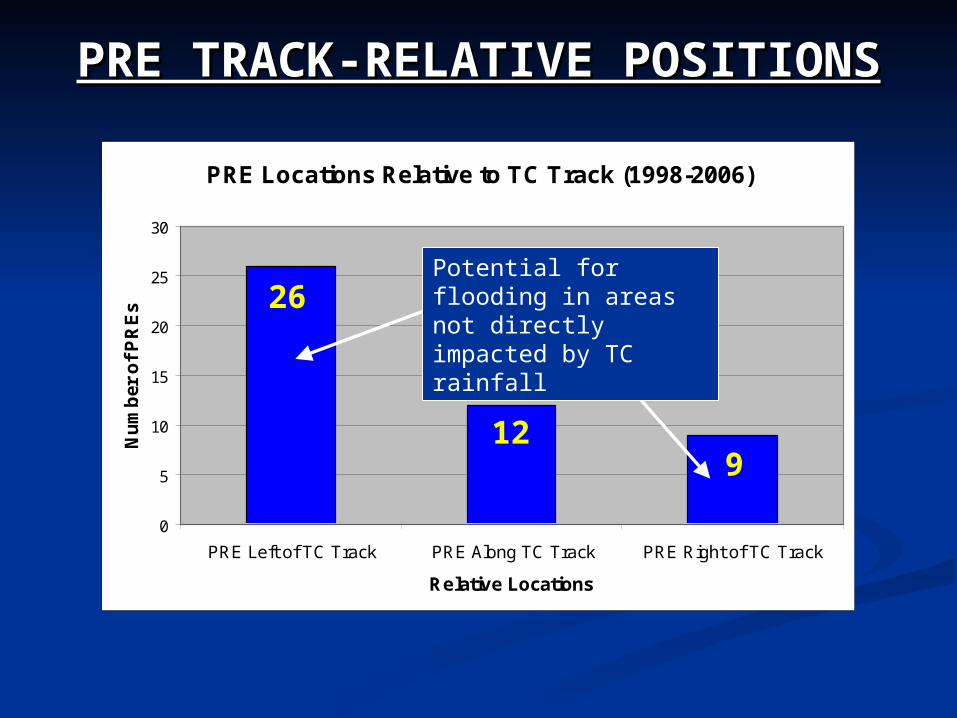
PRE Locations Relative to TC Track (1998-2006)
0
5
10
15
20
25
30
PRE Left of TC Track PRE Along TC Track PRE Right of TC Track
Relative Locations
Nu
mb
er o
f P
RE
s
PRE TRACK-RELATIVE POSITIONSPRE TRACK-RELATIVE POSITIONS
26
129
Potential for flooding in areas not directly impacted by TC rainfall
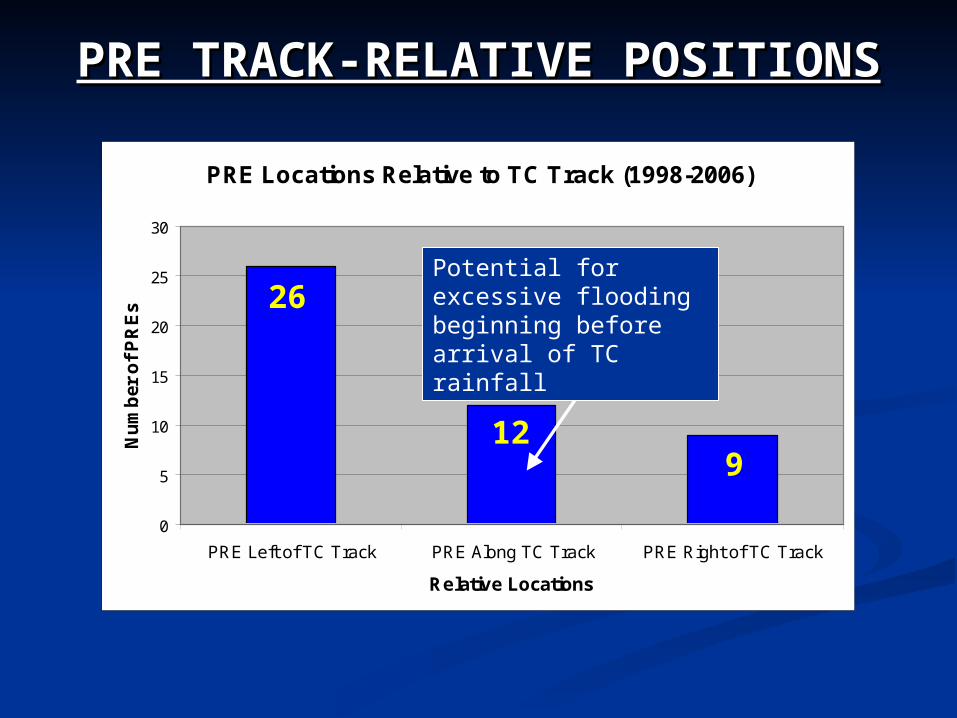
PRE Locations Relative to TC Track (1998-2006)
0
5
10
15
20
25
30
PRE Left of TC Track PRE Along TC Track PRE Right of TC Track
Relative Locations
Nu
mb
er o
f P
RE
s
PRE TRACK-RELATIVE POSITIONSPRE TRACK-RELATIVE POSITIONS
26
129
Potential for excessive flooding beginning before arrival of TC rainfall
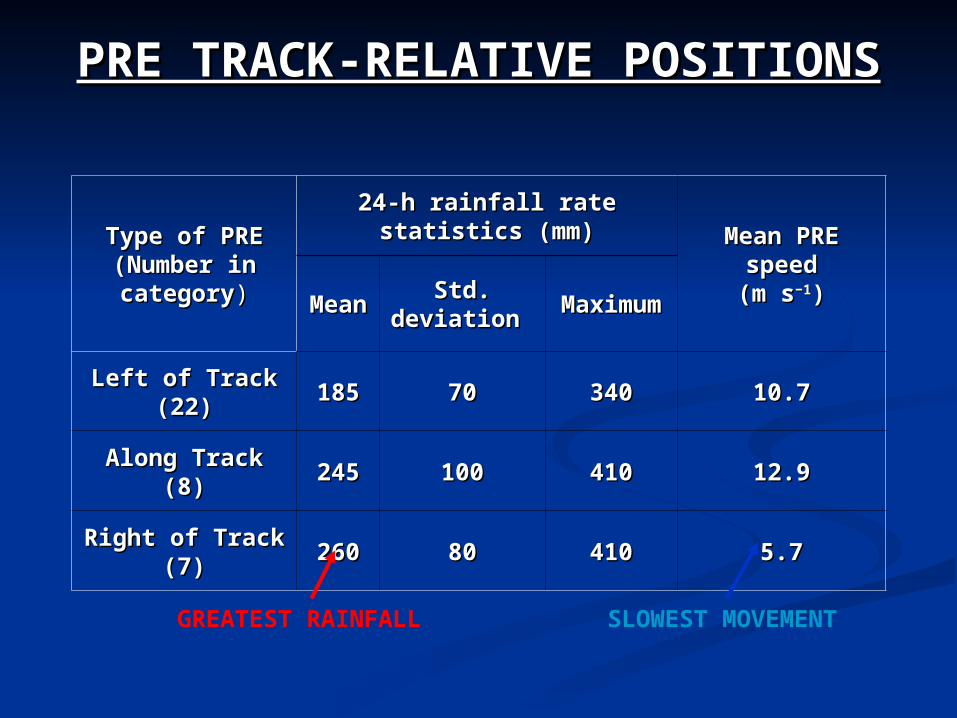
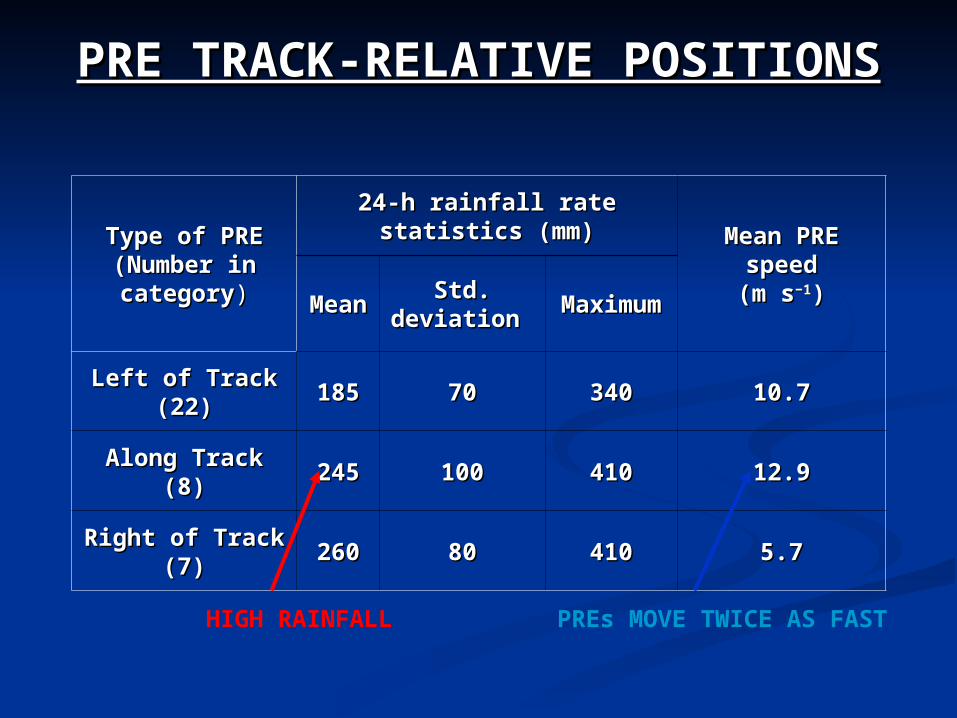
PRE TRACK-RELATIVE POSITIONSPRE TRACK-RELATIVE POSITIONS
Type of PREType of PRE(Number in (Number in categorycategory))
24-h rainfall rate statistics (mm)24-h rainfall rate statistics (mm)Mean PRE Mean PRE
speedspeed(m s(m s−1−1))MeanMean Std. Std.
deviationdeviation Maximum Maximum
Left of Track (22)Left of Track (22) 185185 7070 340340 10.710.7
Along Track (8)Along Track (8) 245245 100100 410410 12.912.9
Right of Track (7)Right of Track (7) 260260 8080 410410 5.75.7
GREATEST RAINFALL SLOWEST MOVEMENT
PRE TRACK-RELATIVE POSITIONSPRE TRACK-RELATIVE POSITIONS
Type of PREType of PRE(Number in (Number in categorycategory))
24-h rainfall rate statistics (mm)24-h rainfall rate statistics (mm)Mean PRE Mean PRE
speedspeed(m s(m s−1−1))MeanMean Std. Std.
deviationdeviation Maximum Maximum
Left of Track (22)Left of Track (22) 185185 7070 340340 10.710.7
Along Track (8)Along Track (8) 245245 100100 410410 12.912.9
Right of Track (7)Right of Track (7) 260260 8080 410410 5.75.7
HIGH RAINFALL PREs MOVE TWICE AS FAST
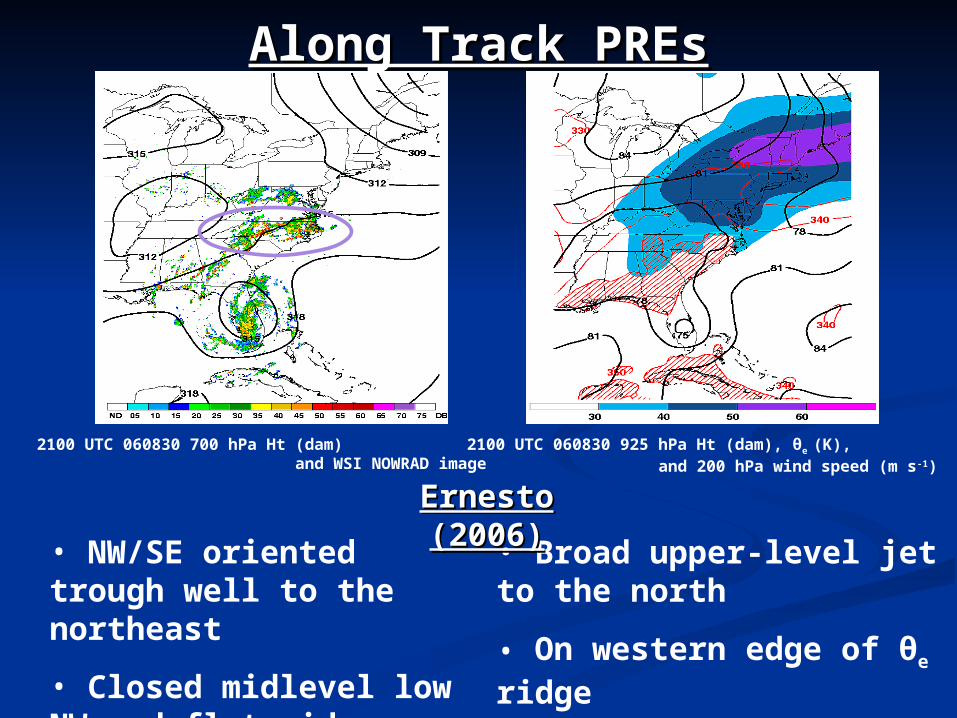
Along Track PREsAlong Track PREs
• NW/SE oriented trough well to the northeast
• Closed midlevel low NW and flat ridge east of TC
• Broad upper-level jet to the north
• On western edge of θe ridge
Ernesto (2006)Ernesto (2006)
2100 UTC 060830 700 hPa Ht (dam) and WSI NOWRAD image
2100 UTC 060830 925 hPa Ht (dam), θe (K), and 200 hPa wind speed (m s-1)
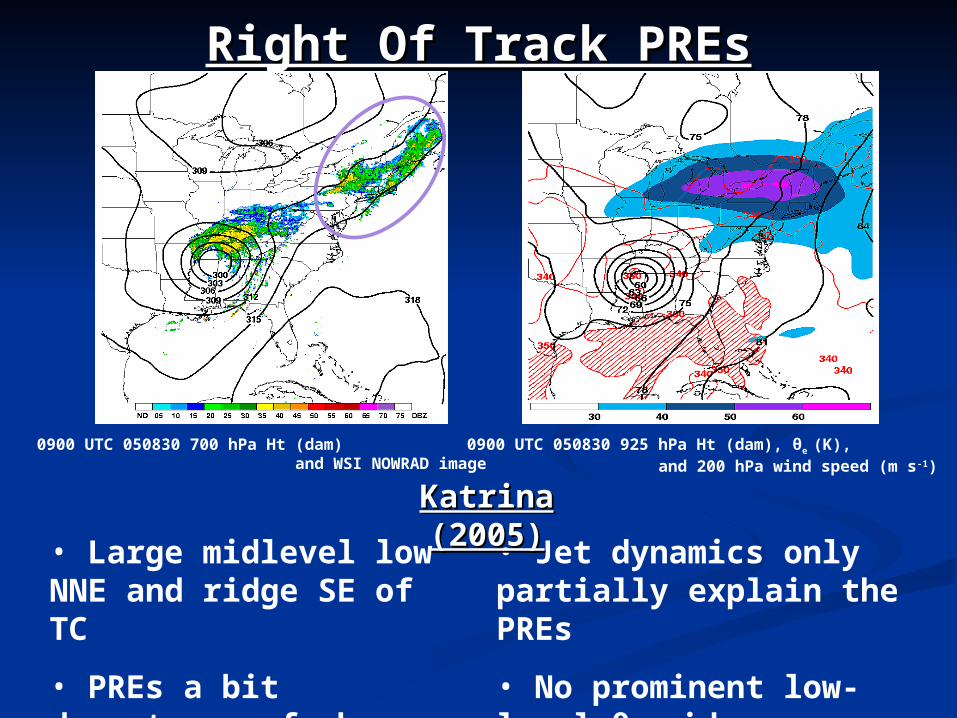
Right Of Track PREsRight Of Track PREs
• Large midlevel low NNE and ridge SE of TC
• PREs a bit downstream of where model predicts
• Jet dynamics only partially explain the PREs
• No prominent low-level θe ridge or gradient near PRE
Katrina (2005)Katrina (2005)
0900 UTC 050830 700 hPa Ht (dam) and WSI NOWRAD image
0900 UTC 050830 925 hPa Ht (dam), θe (K), and 200 hPa wind speed (m s-1)
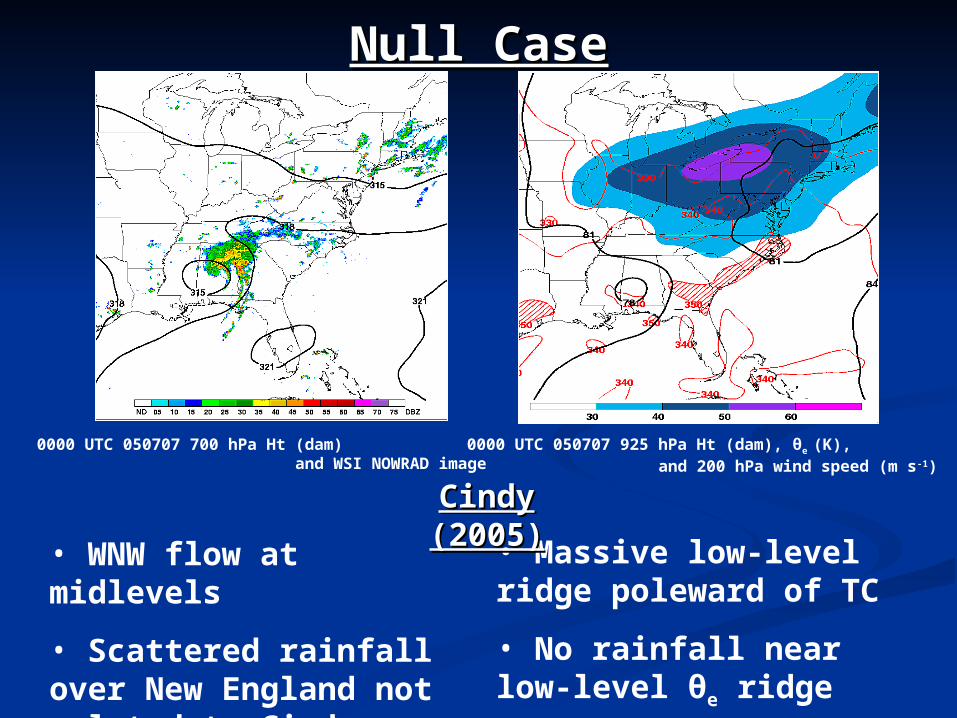
Null CaseNull Case
• WNW flow at midlevels
• Scattered rainfall over New England not related to Cindy
• Massive low-level ridge poleward of TC
• No rainfall near low-level θe ridge
Cindy (2005)Cindy (2005)
0000 UTC 050707 700 hPa Ht (dam) and WSI NOWRAD image
0000 UTC 050707 925 hPa Ht (dam), θe (K), and 200 hPa wind speed (m s-1)
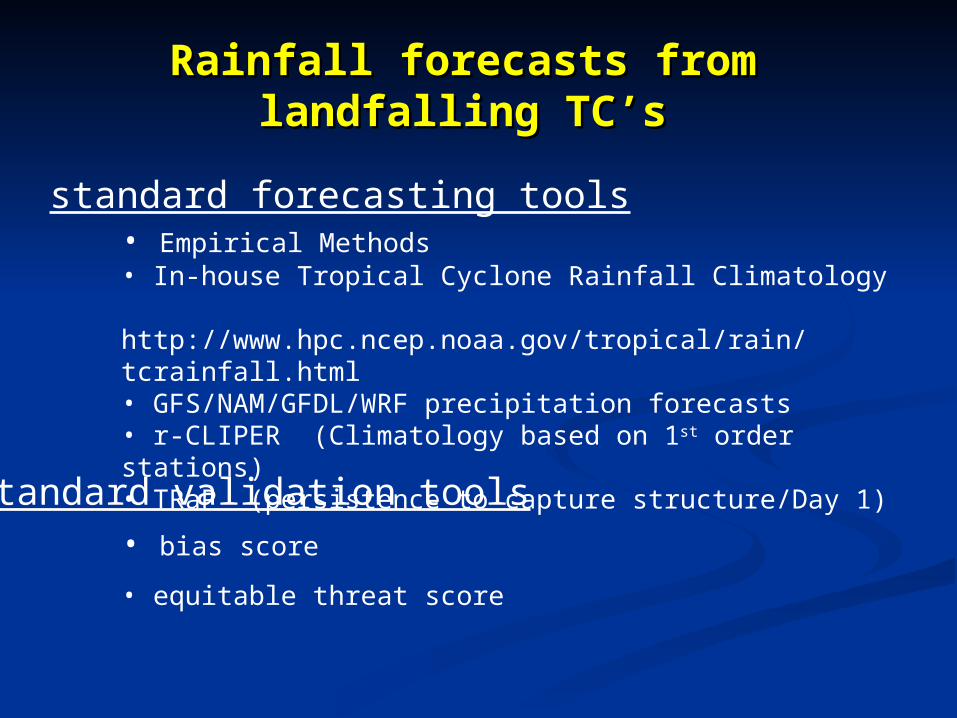
standard forecasting tools
Rainfall forecasts from Rainfall forecasts from landfalling TC’slandfalling TC’s
• Empirical Methods• In-house Tropical Cyclone Rainfall Climatology http://www.hpc.ncep.noaa.gov/tropical/rain/tcrainfall.html• GFS/NAM/GFDL/WRF precipitation forecasts• r-CLIPER (Climatology based on 1st order stations)• TRaP (persistence to capture structure/Day 1)
standard validation tools• bias score
• equitable threat score
Rules of ThumbRules of Thumb Kraft Rule – 1950’s guideline based on a Kraft Rule – 1950’s guideline based on a
broad grid of first order sites. Will not broad grid of first order sites. Will not indicate the maximum in most cases indicate the maximum in most cases (R=100/forward motion in knots). (R=100/forward motion in knots). Environment Canada/Canadian Hurricane Environment Canada/Canadian Hurricane Center use a modified version of Kraft which Center use a modified version of Kraft which halves this amount since most systems halves this amount since most systems entering the country are sheared.entering the country are sheared.
16-inch rule – Long term average of tropical 16-inch rule – Long term average of tropical cyclone rainfall maxima which strike the cyclone rainfall maxima which strike the United States. Vertical wind shear, small United States. Vertical wind shear, small sized tropical cyclones, or movement over sized tropical cyclones, or movement over cooler water prior to landfall can individually cooler water prior to landfall can individually lead to a reduction of about half of this figure. lead to a reduction of about half of this figure. Slow moving and larger than average tropical Slow moving and larger than average tropical cyclones lead to higher values than the cyclones lead to higher values than the average. average.
Picking an analog for a Picking an analog for a TC eventTC event
Size is important…look at the current rain Size is important…look at the current rain shield and compare it to storm totals/storms shield and compare it to storm totals/storms from the pastfrom the past
Is/was there vertical wind shear in current and Is/was there vertical wind shear in current and past events?past events?
Look for storms with similar/parallel tracksLook for storms with similar/parallel tracks Is topography/prism data a consideration?Is topography/prism data a consideration? Look for nearby fronts/depth of nearby upper Look for nearby fronts/depth of nearby upper
troughs for current and possible analogstroughs for current and possible analogs Not all TC events will have a useful analogNot all TC events will have a useful analog
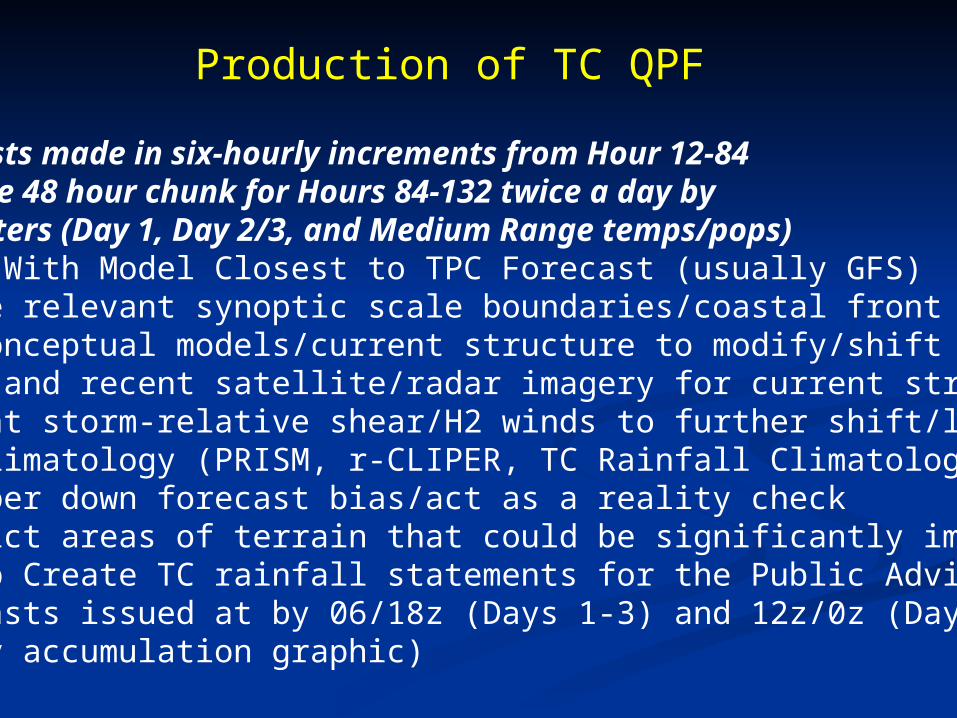
Production of TC QPF
• Forecasts made in six-hourly increments from Hour 12-84 and in one 48 hour chunk for Hours 84-132 twice a day by 3 forecasters (Day 1, Day 2/3, and Medium Range temps/pops)• Start With Model Closest to TPC Forecast (usually GFS)• Locate relevant synoptic scale boundaries/coastal front• Use conceptual models/current structure to modify/shift QPF (TRaP and recent satellite/radar imagery for current structure)• Look at storm-relative shear/H2 winds to further shift/limit QPF • Use climatology (PRISM, r-CLIPER, TC Rainfall Climatology) to: Temper down forecast bias/act as a reality check Depict areas of terrain that could be significantly impacted Help Create TC rainfall statements for the Public Advisories• Forecasts issued at by 06/18z (Days 1-3) and 12z/0z (Days 4-5 and 5-day accumulation graphic)
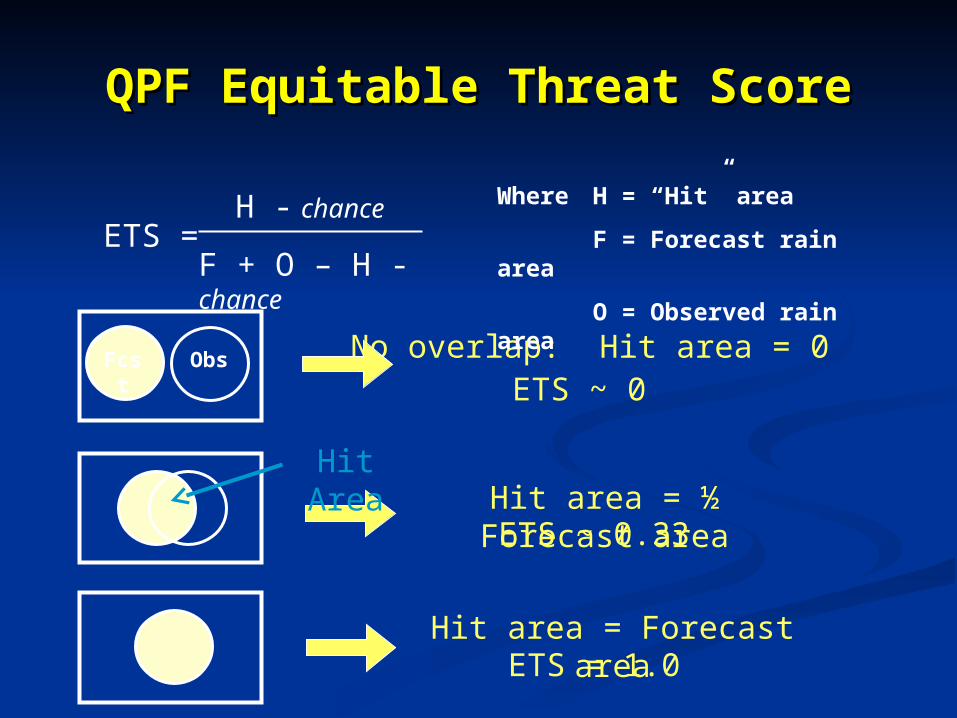
H - chance
F + O – H -chance
ETS =
No overlap: Hit area = 0ETS ~ 0
Hit area = ½ Forecast areaETS ~ 0.33
Where H = “Hit” area
F = Forecast rain area
O = Observed rain area
Hit Area
Hit area = Forecast areaETS = 1.0
Fcst Obs
QPF Equitable Threat ScoreQPF Equitable Threat Score
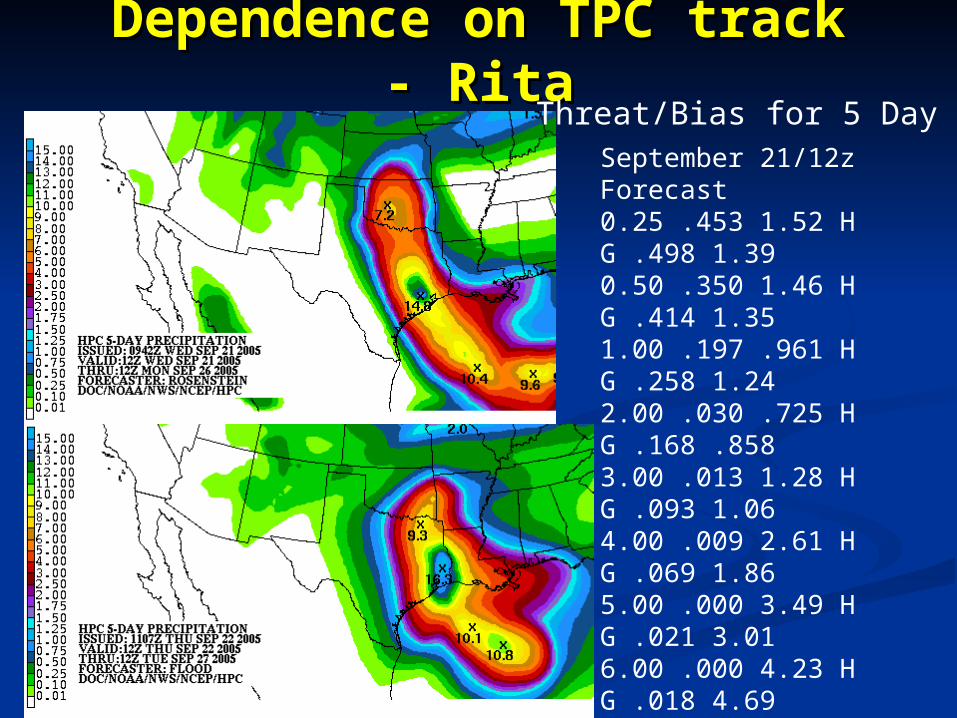
Dependence on TPC track Dependence on TPC track - Rita- Rita
Threat/Bias for 5 Day QPFSeptember 21/12z Forecast0.25 .453 1.52 H G .498 1.39 0.50 .350 1.46 H G .414 1.351.00 .197 .961 H G .258 1.242.00 .030 .725 H G .168 .8583.00 .013 1.28 H G .093 1.064.00 .009 2.61 H G .069 1.865.00 .000 3.49 H G .021 3.016.00 .000 4.23 H G .018 4.69September 22/12z Forecast0.25 .536 1.33 H G .541 1.080.50 .468 1.18 H G .534 .9781.00 .367 1.07 H G .366 .7812.00 .164 .777 H G .234 .7923.00 .163 1.35 H G .224 .9164.00 .128 2.50 H G .199 1.635.00 .090 3.74 H G .174 2.186.00 .090 5.71 H G .161 2.98
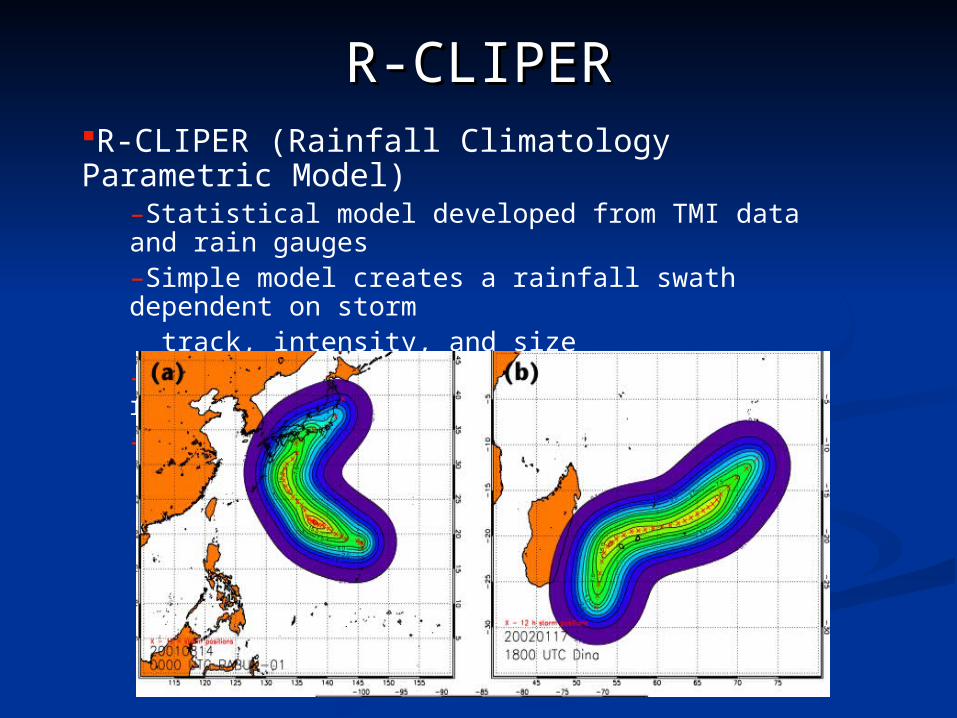
R-CLIPERR-CLIPERR-CLIPER (Rainfall Climatology Parametric Model)
–Statistical model developed from TMI data and rain gauges–Simple model creates a rainfall swath dependent on storm track, intensity, and size–Operational at 0.25o X 0.25o hourly resolution –Asymmetries are not taken into account
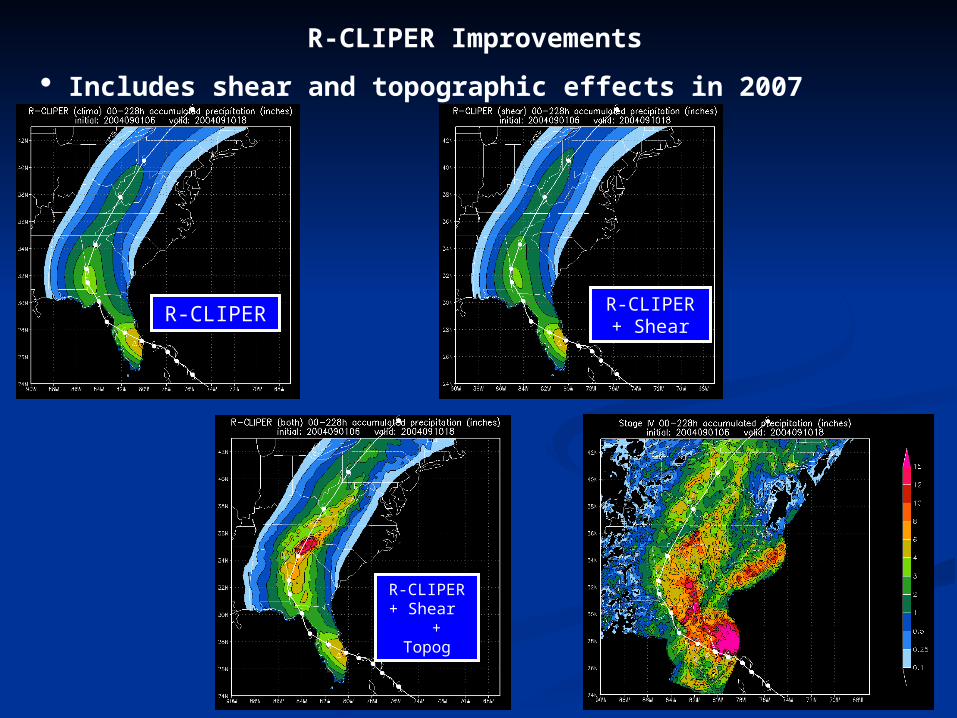
R-CLIPER Improvements
Includes shear and topographic effects in 2007
R-CLIPER + Shear +
Topog
R-CLIPER R-CLIPER + Shear
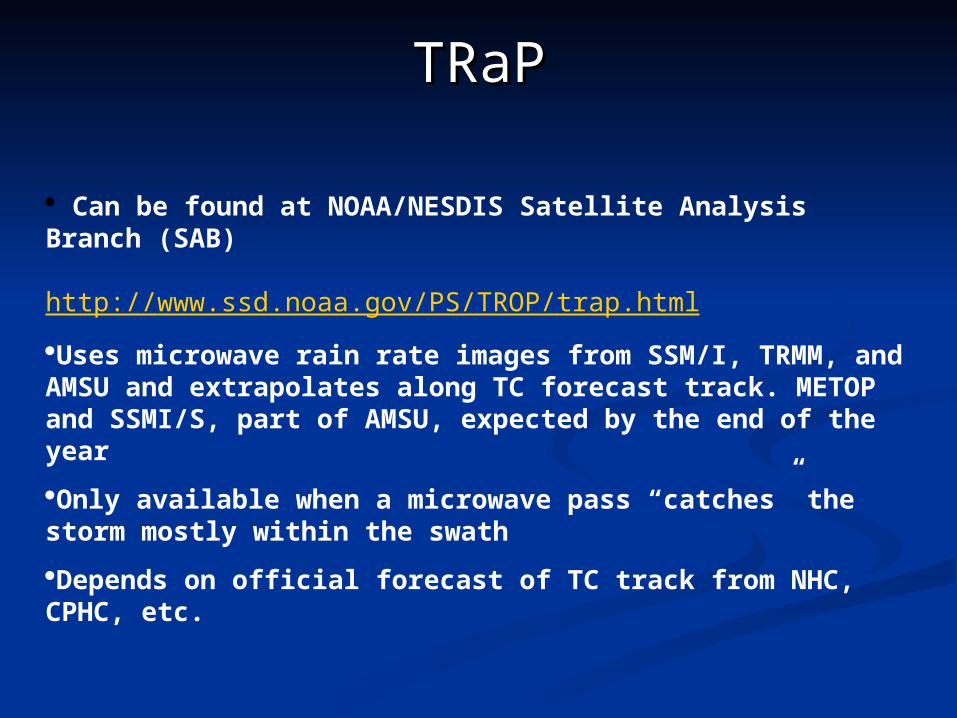
Can be found at NOAA/NESDIS Satellite Analysis Branch (SAB)
http://www.ssd.noaa.gov/PS/TROP/trap.html
Uses microwave rain rate images from SSM/I, TRMM, and AMSU and extrapolates along TC forecast track. METOP and SSMI/S, part of AMSU, expected by the end of the year
Only available when a microwave pass “catches” the storm mostly within the swath
Depends on official forecast of TC track from NHC, CPHC, etc.
TRaPTRaP
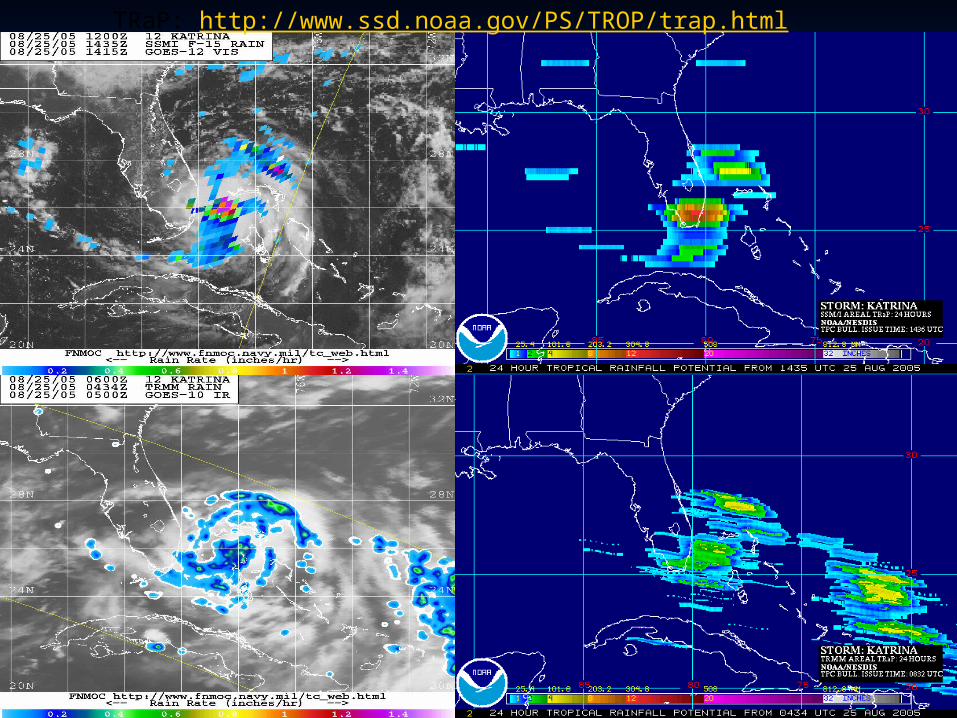
TRaP: http://www.ssd.noaa.gov/PS/TROP/trap.html
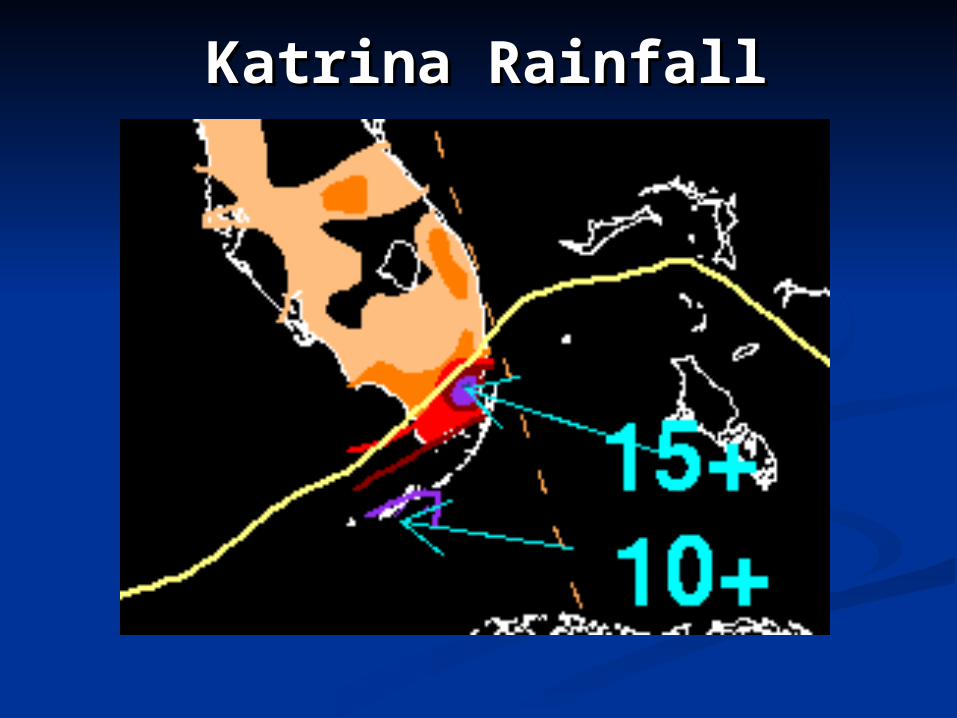
Katrina RainfallKatrina Rainfall
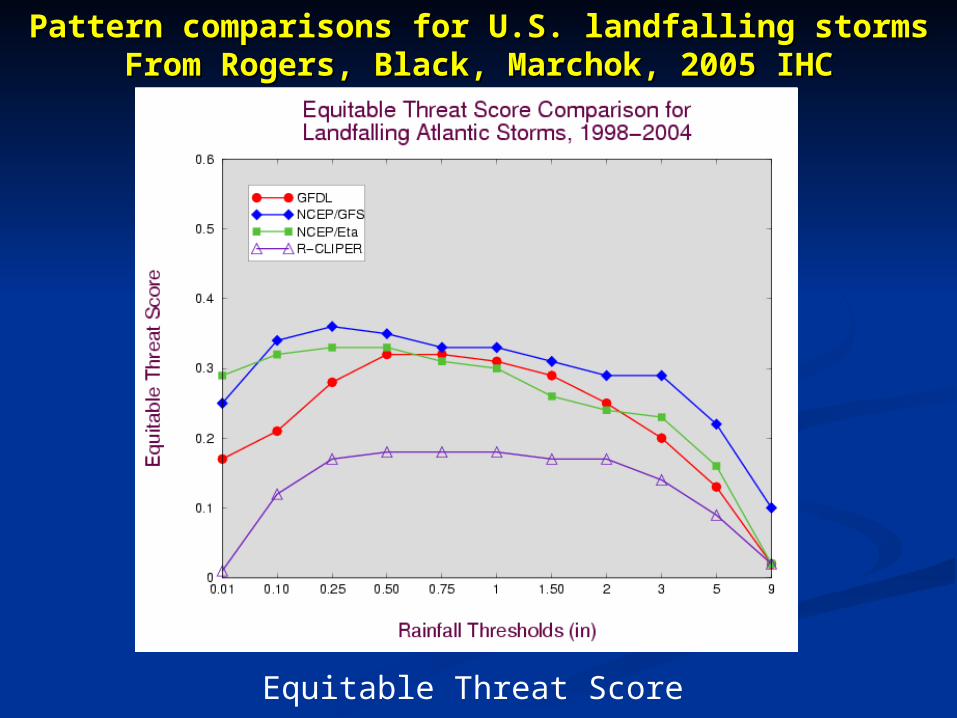
Equitable Threat Score
Pattern comparisons for U.S. landfalling stormsPattern comparisons for U.S. landfalling stormsFrom Rogers, Black, Marchok, 2005 IHCFrom Rogers, Black, Marchok, 2005 IHC
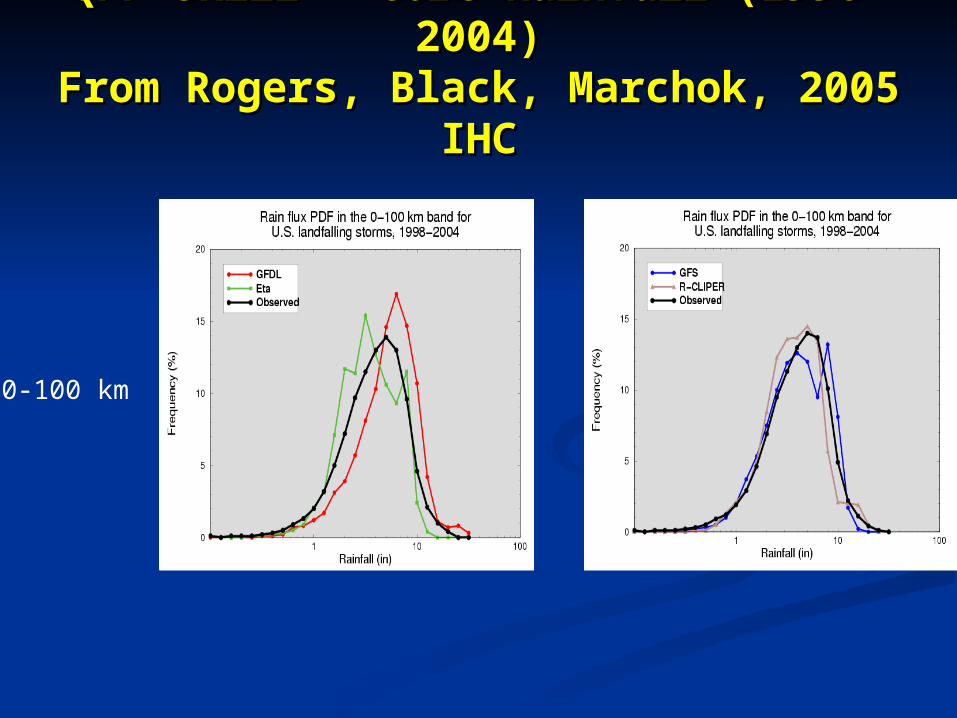
QPF Skill – Core Rainfall (1998-QPF Skill – Core Rainfall (1998-2004)2004)
From Rogers, Black, Marchok, 2005 From Rogers, Black, Marchok, 2005 IHCIHC
0-100 km
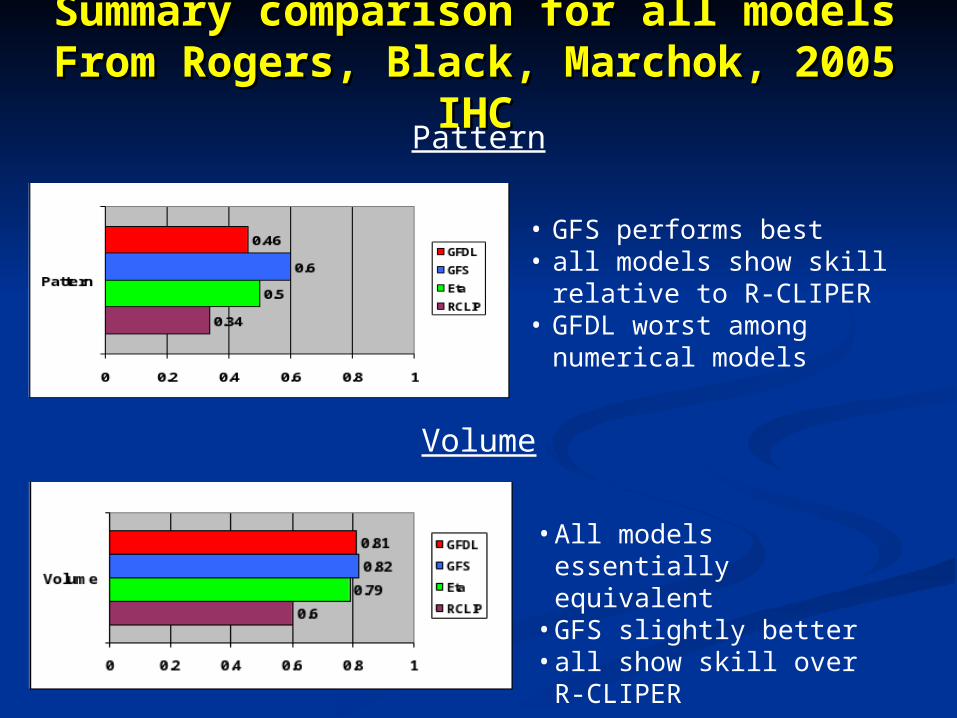
Summary comparison for all modelsSummary comparison for all modelsFrom Rogers, Black, Marchok, 2005 From Rogers, Black, Marchok, 2005
IHCIHC
• GFS performs best• all models show skill relative
to R-CLIPER• GFDL worst among numerical
models
Pattern
•All models essentially equivalent
•GFS slightly better•all show skill over R-
CLIPER
Volume
SummarySummary Tropical cyclones lead to a very small percent of Tropical cyclones lead to a very small percent of
annual rainfall for the Desert Southwest regionally on annual rainfall for the Desert Southwest regionally on an annual basis, individual events can lead to a an annual basis, individual events can lead to a significant portion of the annual rainfall on a local significant portion of the annual rainfall on a local basis.basis.
Tropical cyclone QPF pattern depends on storm size, Tropical cyclone QPF pattern depends on storm size, forecast track, vertical wind shear, topography, depth forecast track, vertical wind shear, topography, depth of upper trough causing recurvature, and SST field the of upper trough causing recurvature, and SST field the cyclone moves over prior to landfallcyclone moves over prior to landfall
While climatology is important to keep in mind, TC While climatology is important to keep in mind, TC QPF is heavily based on the guidance which has the QPF is heavily based on the guidance which has the best verification and is closest to expected TC track best verification and is closest to expected TC track (usually GFS). ECMWF verification will be looked at (usually GFS). ECMWF verification will be looked at after 2007 season, but recent verification shows after 2007 season, but recent verification shows promise across the United States.promise across the United States.