Embed Size (px)
Citation preview
Tropical cyclone Ita flood report
July 2014
Note:
1. Data in this report have been operationally quality controlled but errors may still exist.
2. This product includes data made available to the Bureau by other agencies. Separate approval
may be required to use the data for other purposes. See Appendix 4 for Department of Natural
Resources and Mines Usage Agreement.
3. This report is not a complete set of all data that are available; it is a representation of some of the
key information.
Tropical cyclone Ita flood report Published by the Bureau of Meteorology GPO Box 1289 Melbourne VIC 3001 (03) 9669 4000 [email protected] www.bom.gov.au Except logos and photography, this guide is licensed under a Creative Commons Australia Attribution License. The terms and conditions of the license are at www.creativecommons.org.au © Commonwealth of Australia (Bureau of Meteorology) 2014. Images © Individual copyright holders 2014.
Cover image: Daintree rainforest, Queensland, during wet season just before a thunderstorm.
Photograph by AH Design Concepts (iStockphoto)
Tropical cyclone Ita flood report i
Table of contents
1 Introduction .................................................................................................................... 1
2 Meteorological summary ................................................................................................ 2
2.1 Figures ............................................................................................................... 3
3 Hydrology ...................................................................................................................... 5
3.1 Peak river heights .............................................................................................. 8 3.2 Rainfall maps ................................................................................................... 10 3.3 Rainfall intensity ............................................................................................... 14 3.4 Flood warning services..................................................................................... 21
Appendix 1: Peak heights ..................................................................................................... 22
Appendix 2: Rainfall tables ................................................................................................... 23
Appendix 3: Hydrographs ..................................................................................................... 30
Appendix 4: Department of Natural Resources and Mines Usage Agreement ...................... 39
Tropical cyclone Ita flood report ii
List of tables
Table 3.1.1 Significant peak heights observed during 12-14 April 2014 and historical comparisons ................................................................................................................. 9
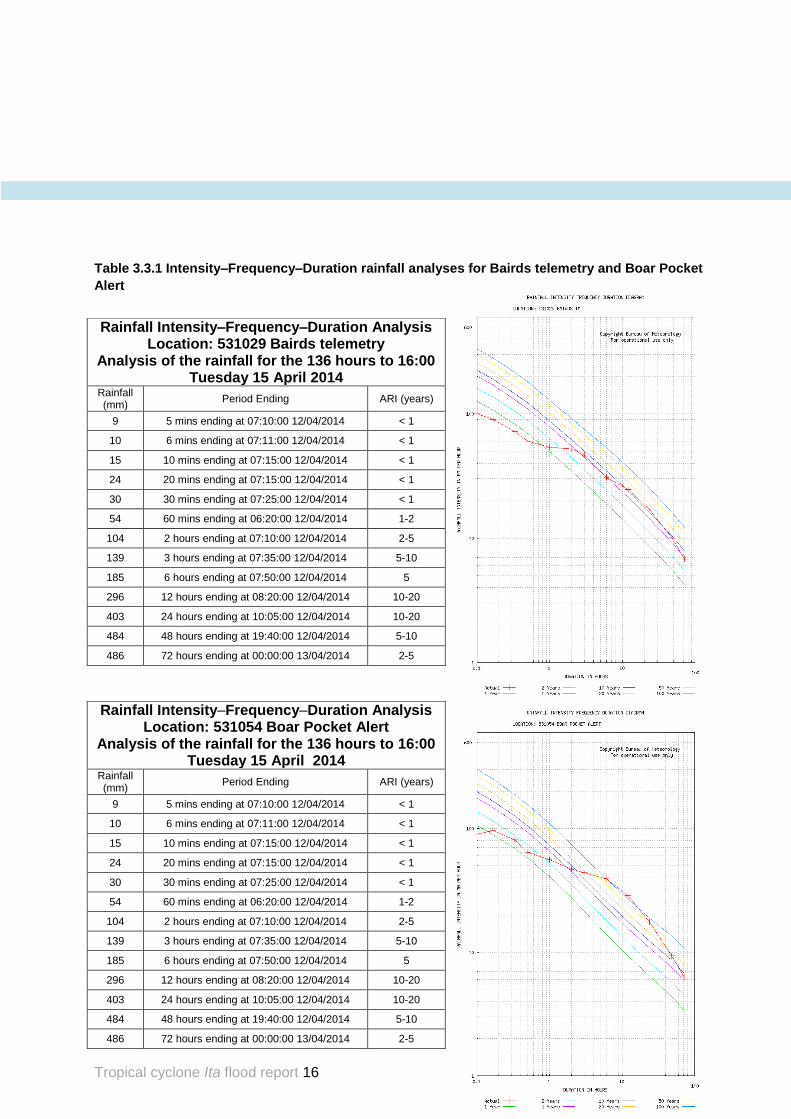
Table 3.3.1 Intensity–Frequency–Duration rainfall analyses for Bairds telemetry and Boar Pocket Alert .......................................................................................................... 16
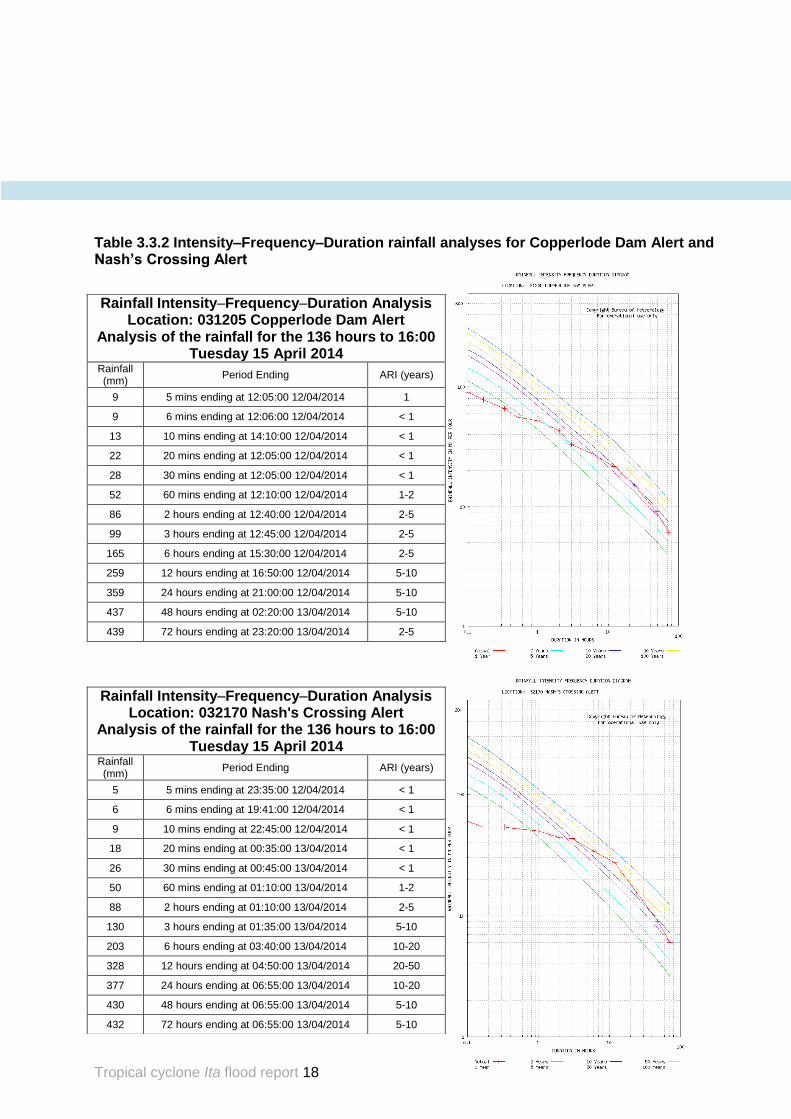
Table 3.3.2 Intensity–Frequency–Duration rainfall analyses for Copperlode Dam Alert and Nash’s Crossing Alert ............................................................................................ 18
Table 3.3.3 for Intensity–Frequency–Duration rainfall analyses for Reeves Alert and Bowen Pump Station Alert ............................................................................................ 20
Table 3.4.1 Number of flood warnings issued for each catchment during tropical cyclone Ita .................................................................................................................... 21
List of figures
Figure 2.1.1 Track of Ita as a tropical low (L) and tropical cyclone and from 2 to 14 April 2014 ..................................................................................................................... 3
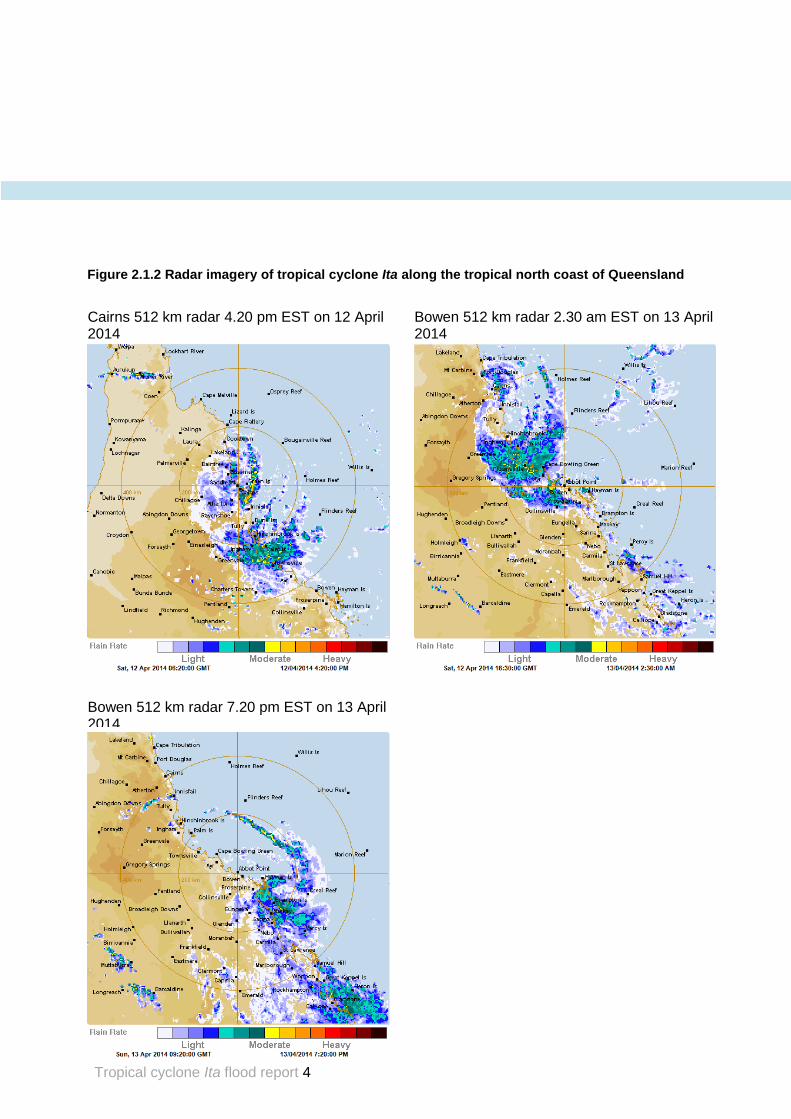
Figure 2.1.2 Radar imagery of tropical cyclone Ita along the tropical north coast of Queensland ..................................................................................................................
Figure 3.1.1 Peak flood heights observed between 9 and 14April 2014 resulting from rainfall produced by tropical cyclone Ita ........................................................................ 8
Figure 3.2.1 Rainfall map of the Far North Queensland River catchments 10-15 April 2014 .............................................................................................................................
Figure 3.2.2 Rainfall map of the Herbert, Johnstone, Tully and Murray River catchments 10-15 April 2014 ........................................................................................
Figure 3.2.3 Rainfall map of the Ross and Haughton River catchments 10-15 April 2014 .............................................................................................................................
Figure 3.2.4 Rainfall map of the Don River catchment 10-15 April 2014 .......................
Figure 3.3.1 Hourly hyetographs for Bairds TM and Boar Pocket Alert .........................
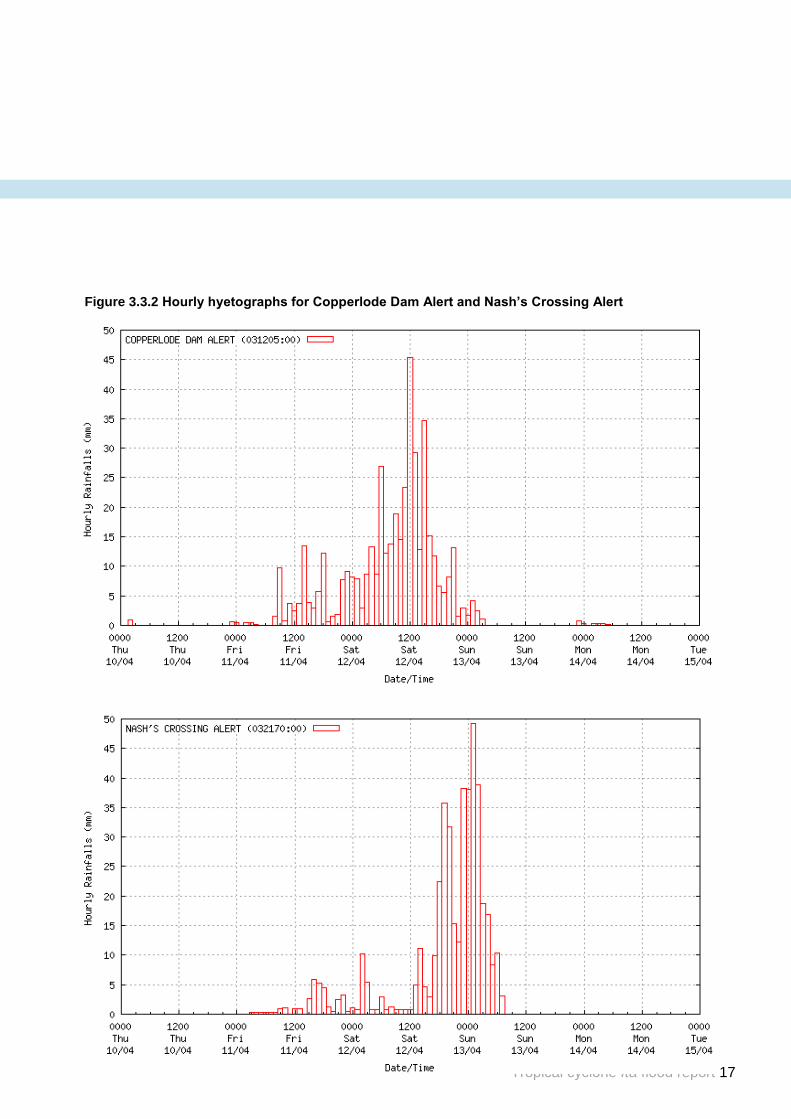
Figure 3.3.2 Hourly hyetographs for Copperlode Dam Alert and Nash’s Crossing Alert
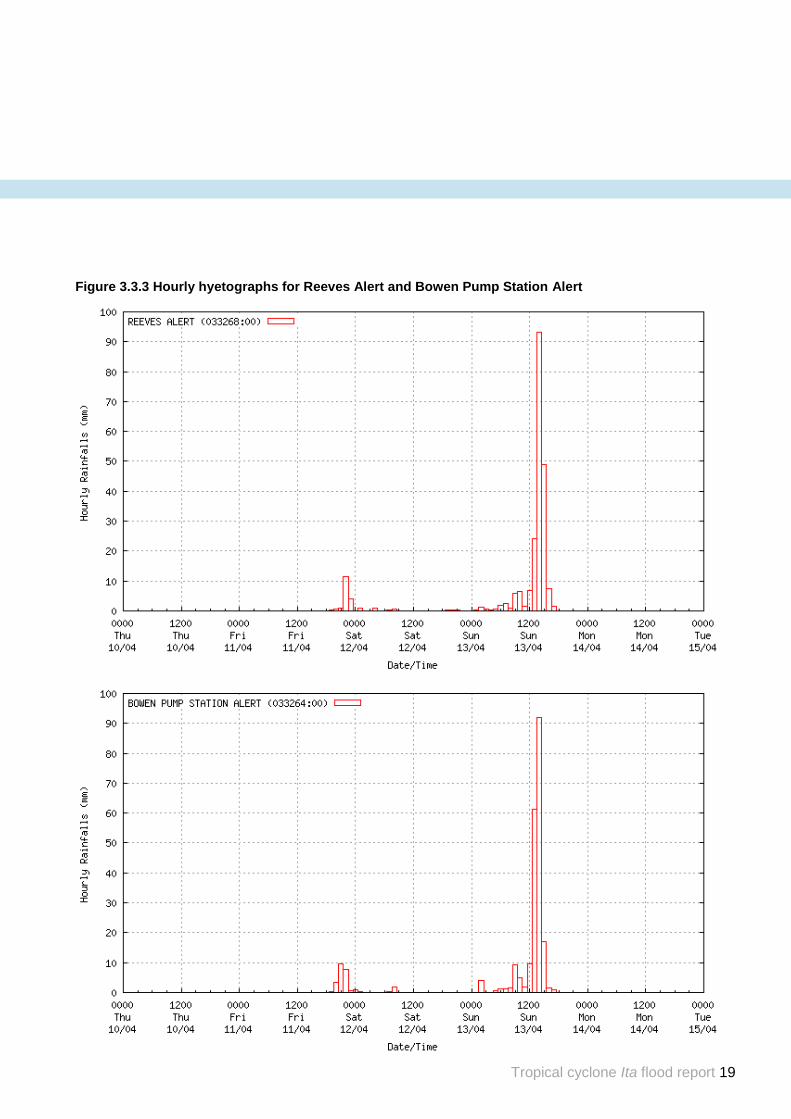
Figure 3.3.3 Hourly hyetographs for Reeves Alert and Bowen Pump Station Alert ........
Tropical cyclone Ita flood report 1
The flooding caused by tropical cyclone Ita was short but significant for North Tropical Coast and Tablelands and the Herbert and Lower Burdekin districts. The majority of rainfall was recorded on 12 April, with the largest total (860 mm) recorded over 48 hours to 9am 13 April at Bellenden Ker Top in the Mulgrave Russell catchment. Flooding above the moderate flood level (and in most instances above the major flood level) occurred in the following basins:
Daintree River (Daintree Village)
Barron River (Kamerunga Bridge)
Mulgrave/Russell Rivers (Peetes Bridge and Gordonvale)
Tully/Murray Rivers (Euramo and Murray Flats)
Herbert River (Gleneagle, Abergowrie Bridge, Ingham, Gairloch and Halifax)
Bohle River (Mt Bohle)
Haughton River (Giru)
Don River (Bowen).
1 Introduction
Tropical cyclone Ita flood report 2
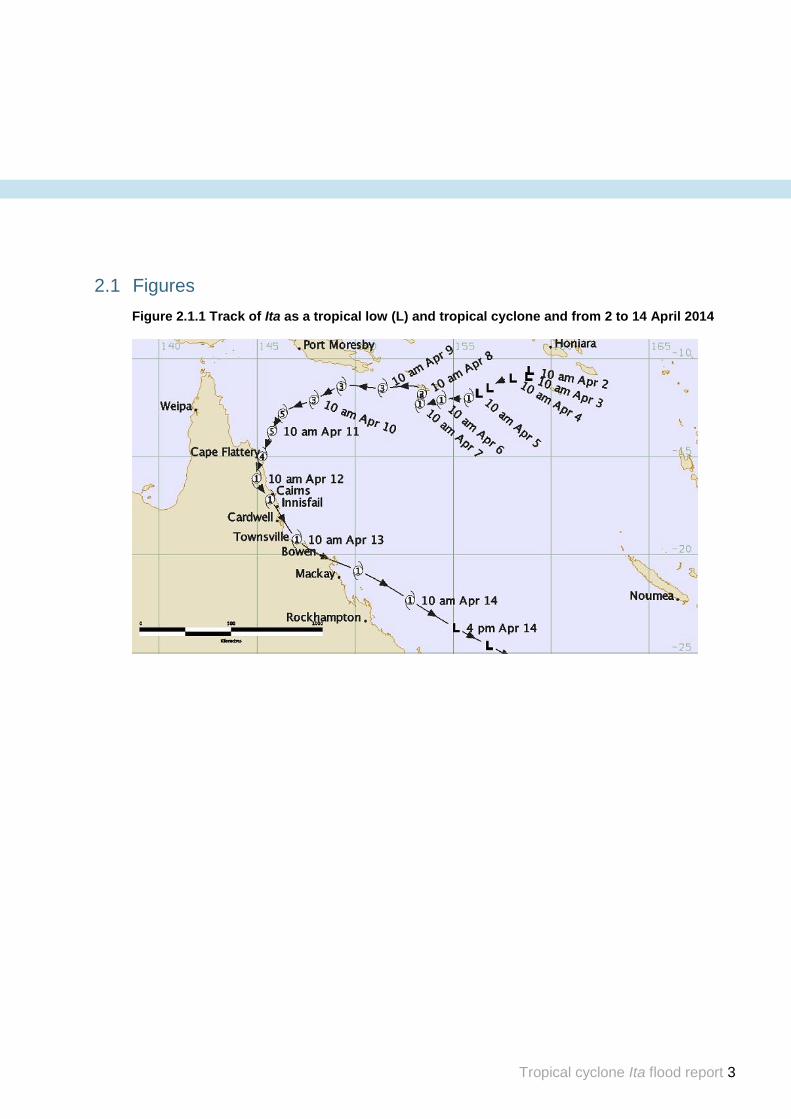
Tropical cyclone Ita began as a tropical low pressure system southwest of the Solomon Islands in the north eastern Coral Sea on 2 April, 2014. Over the next few days it drifted westward while slowly intensifying, and was classified as a category 1 cyclone on the afternoon of 5 April. The cyclone continued to move westward and then stalled south of Sudest Island (Papua New Guinea) for two days while continuing to intensify, reaching category 3 at 11 am on 8 April. It then started moving westward again, passing south of the Papua New Guinea mainland while maintaining its intensity as a category 3 cyclone. On the afternoon of 10 April, Ita intensified very rapidly, reaching category 4 and then category 5 in the span of six hours. At the same time it turned southwest towards the Far North Queensland coast, where it made landfall near Cape Flattery at about 10 pm on the evening of Friday 11 April. Ita weakened somewhat in the hours leading up to landfall and at the time of writing had been rated as a category 4 cyclone at landfall, although this may be revised later once all the data have been reviewed. Cape Flattery automatic weather station recorded a maximum wind gust of 159 km/h. Near landfall, the centre of Ita came within 5km of the resort at Lizard Island. Unofficial readings showed the air pressure dropped to approximately 954 hPa and wind gusts reached approximately 155 km/h before the instrument failed. Considerable vegetation damage but only minor structural damage to buildings was recorded at the resort. Upon landfall, Ita continued to track southward through the inland North Tropical Coast district. It weakened reasonably quickly and passed 20 km west of Cooktown (the closest population centre to Ita's initial landfall) as a category 2 cyclone. Wind gusts of approximately 125 km/h were recorded there. Around 200 buildings sustained (mostly minor) damage, while 16 buildings were severely damaged or totally destroyed. A storm surge of approximately 1.1 m occurred at about midnight, though as this arrived coincident with the low astronomical tide, little if any inundation occurred. Ita weakened further to a category 1 cyclone and maintained this category through the rest of its two day trek southwards along the north Queensland coast, with much of the time spent over land. Gale force winds and damaging wind gusts were recorded at Lucinda, Townsville, Cape Ferguson, Mackay, and Middle Percy Island. The main impacts during this phase of Ita's lifetime, though, were rainfall and flooding. Widespread 24 hour rainfalls of over 300 mm, peaking at approximately 400 mm, were recorded in the North Tropical Coast and Herbert and Lower Burdekin districts. The Daintree, Mulgrave, Haughton, and Herbert rivers all recorded major floods. Flash flooding occurred at Bowen, where 110 mm of rainfall was recorded in one hour.
2 Meteorological summary
Tropical cyclone Ita flood report 3
2.1 Figures
Figure 2.1.1 Track of Ita as a tropical low (L) and tropical cyclone and from 2 to 14 April 2014
Tropical cyclone Ita flood report 4
Cairns 512 km radar 4.20 pm EST on 12 April 2014
Bowen 512 km radar 7.20 pm EST on 13 April 2014
Bowen 512 km radar 2.30 am EST on 13 April 2014
Figure 2.1.2 Radar imagery of tropical cyclone Ita along the tropical north coast of Queensland
Tropical cyclone Ita flood report 5
Tropical cyclone Ita was named on 5 April approximately six days before it made landfall at 10pm on Friday, 11 April near Cape Flattery. Significant rainfall associated with the cyclone was first recorded in the 24 hours to 9 am on 12 April in the Daintree, Barron, Mulgrave/Russell, Johnstone and Herbert Rivers. As the system moved southwards over the next few days the significant rainfall moved with it, affecting the more southern catchments of the Ross/Bohle, Haughton, Lower Burdekin, Don, Proserpine, Pioneer and Fitzroy. Widespread daily totals of 100-300 mm were recorded in all coastal catchments between the Daintree Village and Proserpine between 9 am on 11 April and 9 am on 14 April. River level rises were recorded throughout the North Tropical Coast district with the following providing a summary of the flood levels recorded in each affected catchment during this event.
The hydrology presented in this report concentrates on flooding that occurred in Queensland river
basins, with hydrographs and rainfall data from the Queensland Flood Warning Network stations
only.
Daintree
Heavy rainfall was recorded on 11 April leading to river rises in the Daintree River. Bairds telemetry
(upstream of Daintree Village) recorded 401 mm in the 24 hours to 9 am on 2 April, with
widespread totals of 200 mm or more recorded throughout the area. The major flood level at Bairds
was the second highest flood on record (record flood was recorded in 1957). Downstream major
flood levels at the Daintree Village peaked at 10.5 m, the highest level recorded since 1996. Flood
warnings for the Daintree River commenced on 1 April and were finalised on 13 April.
Barron
Heavy rainfall was recorded on 12 April resulting in significant river rises in the Barron catchment.
The tributaries of the Clohesy River and Flaggy Creek were first to respond to this rainfall.
Widespread rainfall totals between 50 mm and 200 mm were recorded in the 24 hours to 9 am on
12 April and were followed up with a further 100-200 mm in the 24 hours to 9 am on 13 April.
Locally, heavier falls were recorded, including 337 mm at Boar Pocket. Moderate flood levels were
recorded on the Barron River at Kamerunga Bridge (highest since 2006) with river levels just
exceeding the minor flood level downstream at Cairns Airport (highest since 2011). Flood warnings
for the Barron River commenced on 12 April and were finalised the following day.
Mulgrave/Russell
Heavy rainfall was recorded on 12 April resulting in river rises in the Mulgrave and Russell Rivers.
Widespread rainfall totals of 100-150 mm were recorded in the 24 hours to 9 am on 12 April and
were followed up with a further 100-250 mm in the 24 hours to 9 am on 13 April. Major flood levels
were recorded at all sites on the Mulgrave River, with Peetes Bridge and Gordonvale peaking at
their highest levels since March 2012. Minor to moderate flood levels were recorded in the Russell
River. Flood warnings for the Mulgrave and Russell rivers commenced on 12 April and were
finalised the following day.
Johnstone
Heavy rainfall was recorded on the afternoon of 12 April leading to river rises along the lower
Johnstone River. Widespread rainfall totals of 50-170 mm were recorded in the 24 hours to 9 am
on 12 April and were followed up with a further 100-200 mm in the 24 hours to 9 am on 13 April.
Minor flood levels were recorded at all sites along the North Johnstone River. Flood warnings for
the Johnstone River commenced on 12 April and were finalised on 13 April.
3 Hydrology
Tropical cyclone Ita flood report 6
Tully/Murray
Rainfall was recorded during 12 April leading to river rises in the Tully and Murray catchments.
Widespread rainfall totals of 50-170 mm were recorded in the 24 hours to 9 am on 12 April and
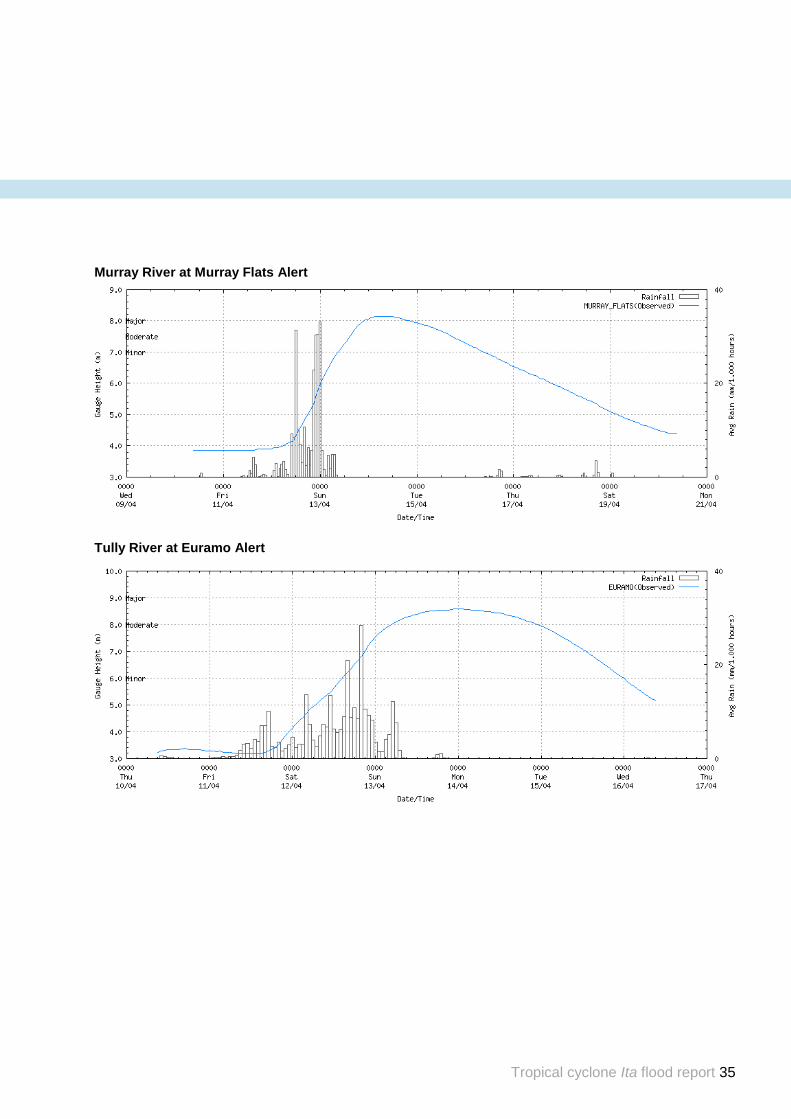
were followed up with a further 150-350 mm in the 24 hours to 9 am on 13 April. Moderate flood
levels were recorded along the Tully River, with Euramo recording its highest levels since January
2013. Major flood levels recorded in the Murray River at Murray Flats were the highest levels
recorded since February 2009. Flood warnings for the Tully and Murray rivers commenced on
12April and were finalised on 16 April.
Herbert
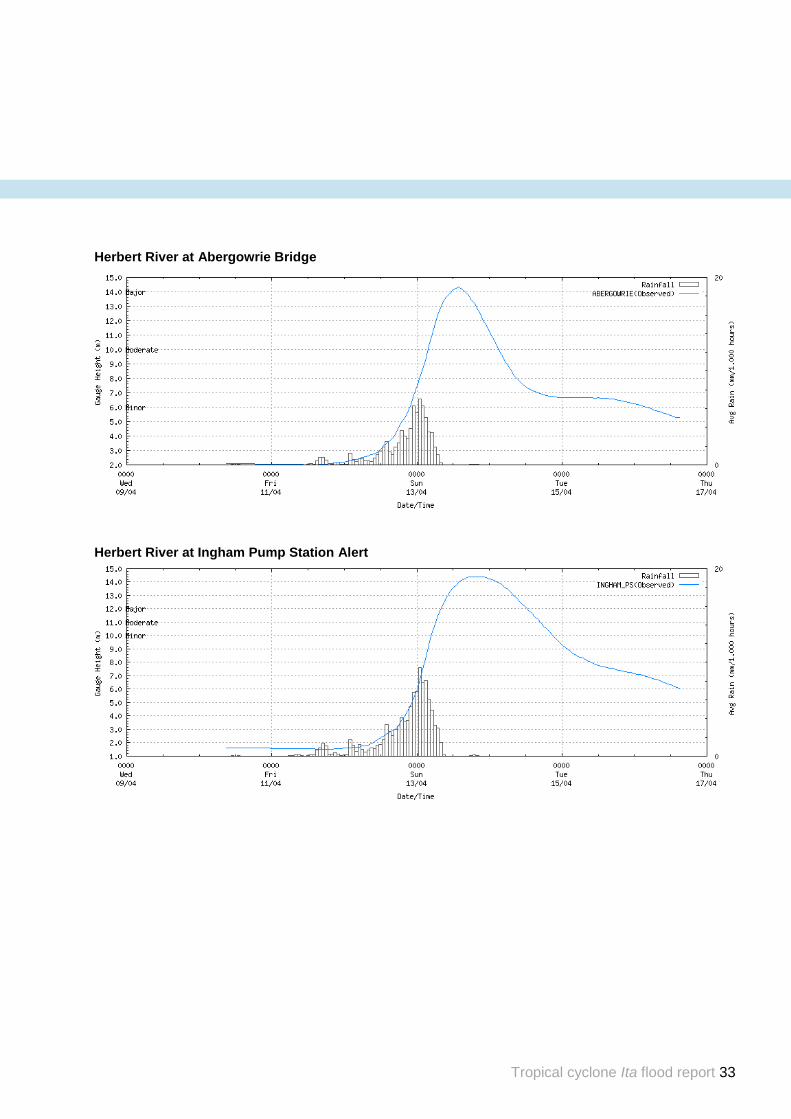
Heavy rainfall was recorded during the afternoon of 12 April leading to river rises in the lower
Herbert River. Widespread rainfall totals of 25-80 mm were recorded in the 24 hours to 9 am on 12
April and were followed up with a further 50-375 mm in the 24 hours to 9 am on 13 April. Major
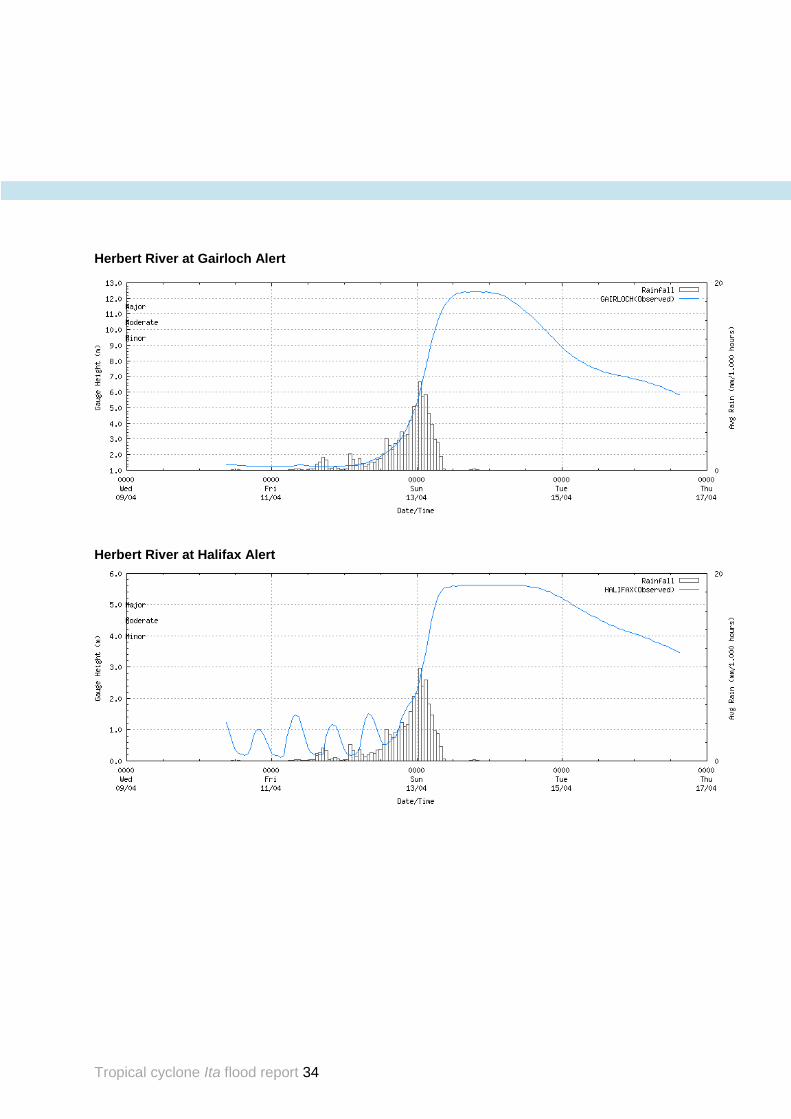
flood levels were recorded at all sites along the Herbert River between Gleneagle and Halifax.
River levels in the lower Herbert River around Ingham and Halifax (including Cordelia and
Macknade) have been assessed to have been the most significant since the February 2009 flood
event. Local sources suggest that 40-50 properties had water over floor level as a result of this
event. Flood warnings for the Herbert River commenced on 12 April and were finalised on 16 April.
Ross/Bohle
Moderate to heavy rainfall was recorded during 13 April leading to river rises in the Ross and Bohle
catchments. Widespread rainfall totals of 25-50 mm were recorded in the 24 hours to 9 am on 12
April and were followed up with a further 150-300 mm in the 24 hours to 9 am on13 April. Moderate
to major flood levels were recorded at all sites along the Bohle River. No significant river level rises
were recorded along the Ross River during this event, but gate operations were required at Ross
River Dam. Flood warnings for the Bohle River commenced on 13 April and were finalised on 14
April.
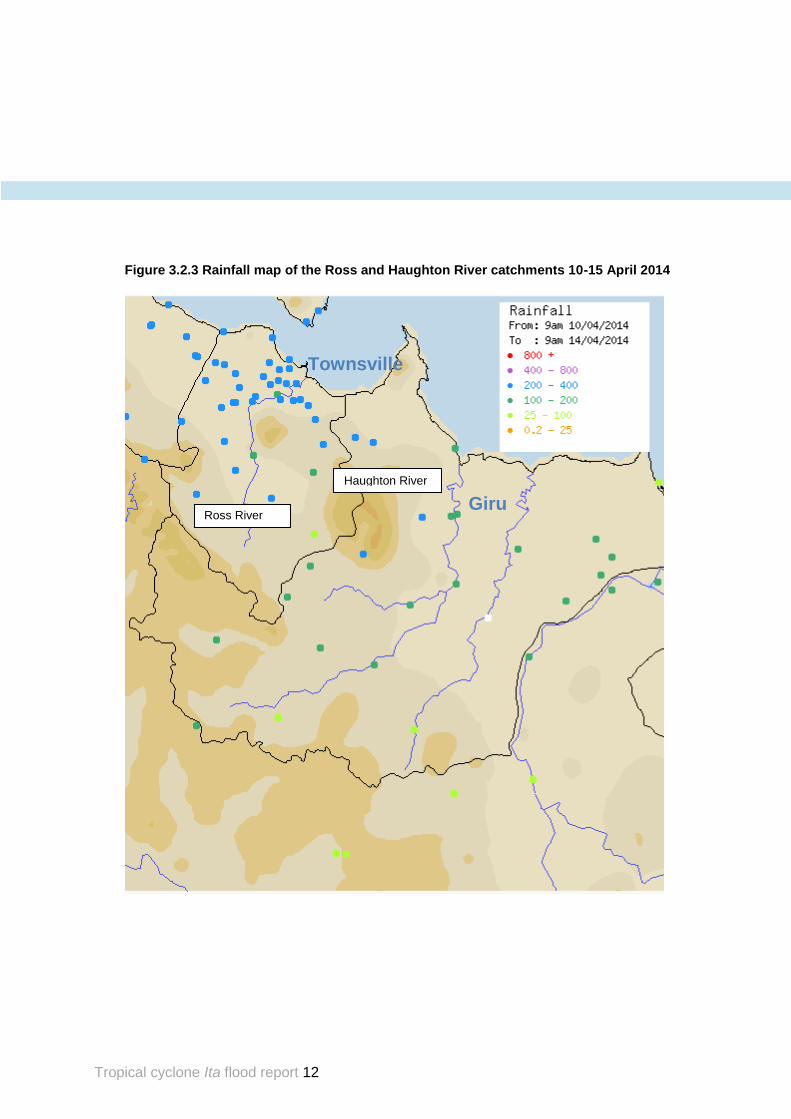
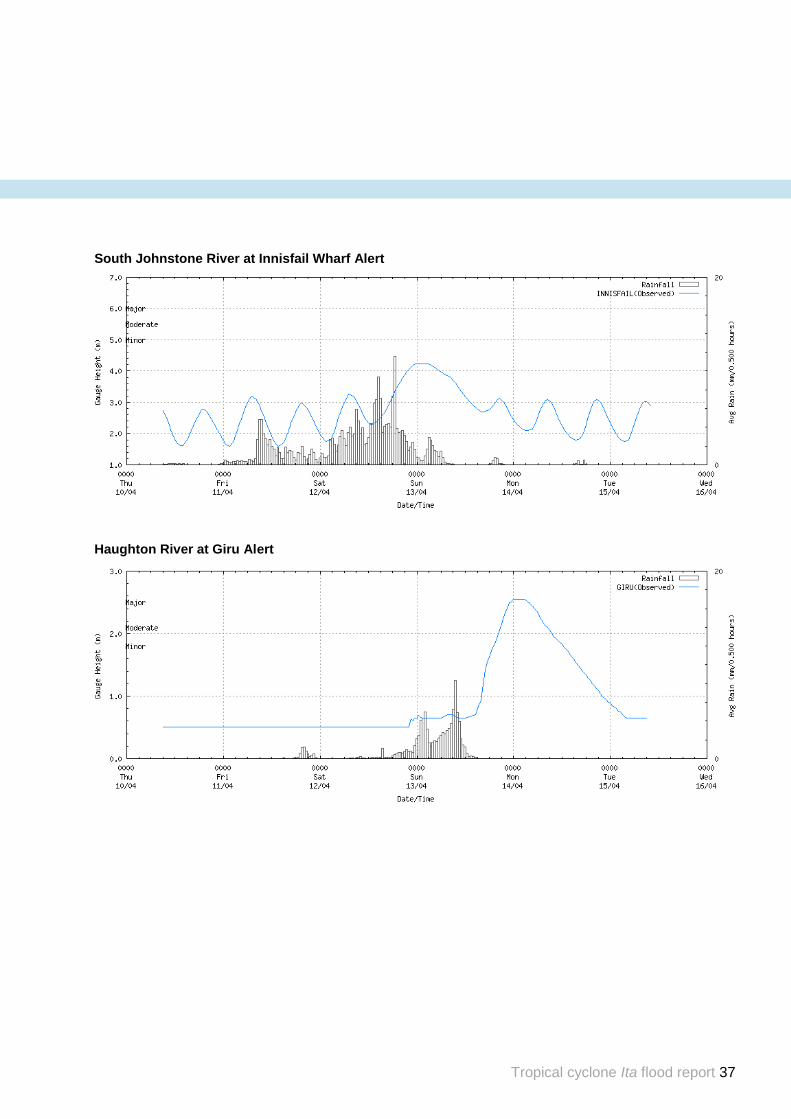
Haughton
Moderate to heavy rainfall was during 13 April leading to river level rises in the Haughton
catchment. Widespread rainfall totals of 100-150 mm were recorded in the 24 hours to 9 am on 13
April (locally heavier falls were recorded, including 281 mm at Upper Major Creek). A further 20-70
mm fell in the 24 hours to 9 am on 14 April. Minor to moderate flood levels were recorded along the
Haughton River between Mt Piccaninny and Powerline, and in Major Creek. Downstream at Giru,
major flood levels peaked at their highest levels since January 2013. Flood warnings for the
Haughton River began on 13 April and were finalised on 14 April.
Burdekin
Moderate to heavy rainfall was recorded in the Burdekin River catchment around Paluma during
12-13 April, with isolated falls of 260-390 mm. Heavy falls also occurred over the lower reaches of
the Burdekin River during 13-14 April with daily totals of 60-90 mm. River level rises occurred
across the catchment, but did not exceed the minor flood level at any location; however, river
levels at Burdekin Dam exceeded the spillway height.
Tropical cyclone Ita flood report 7
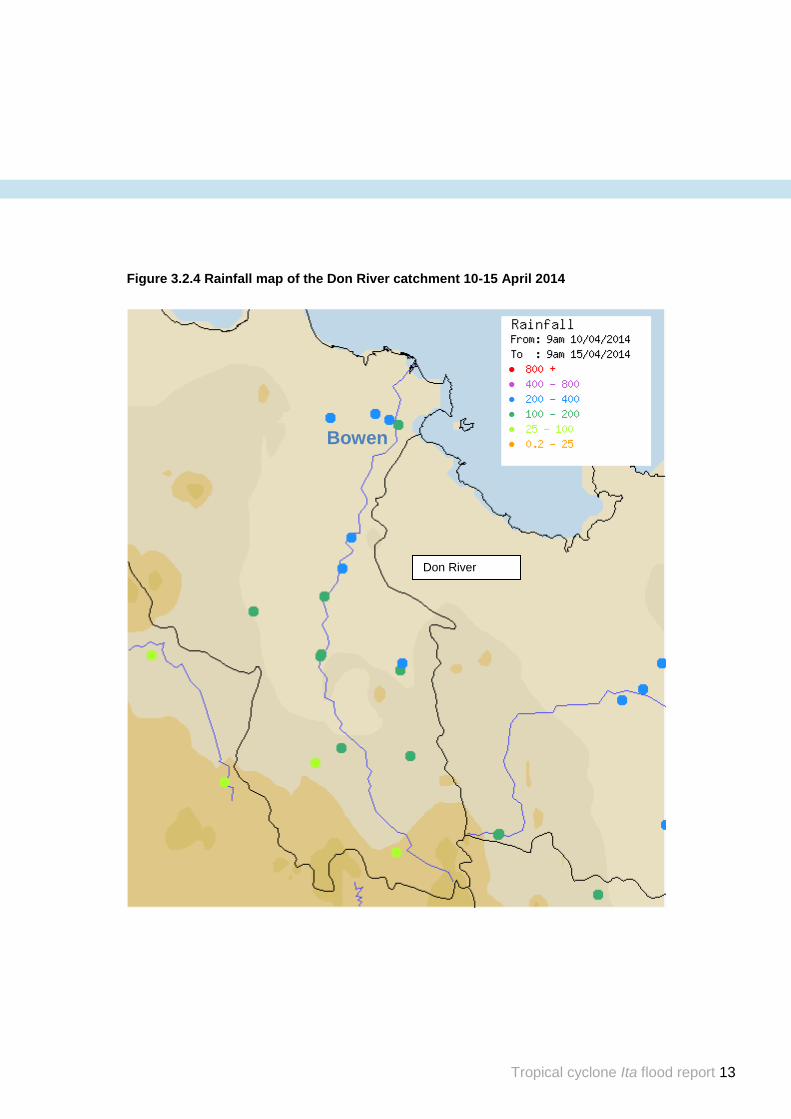
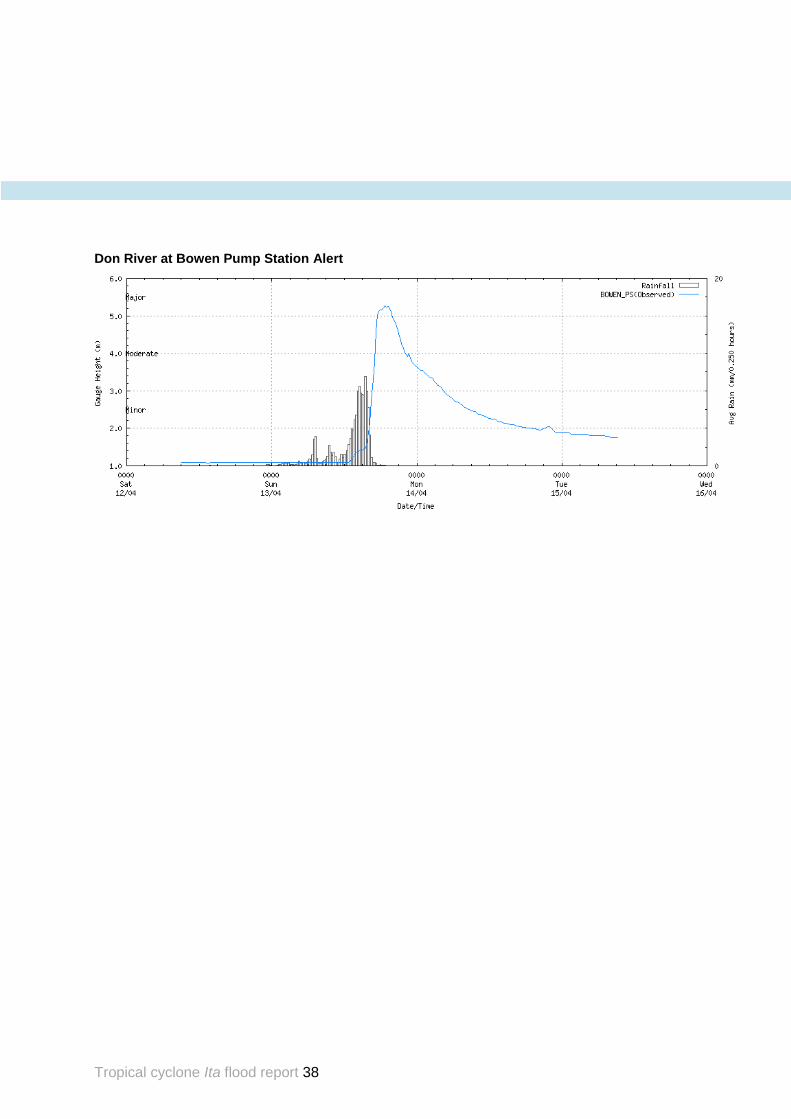
Don
Widespread rainfall totals of 50-200 mm were recorded in the 24 hours to 9 am on 14 April, with
the majority recorded between midday and 2 pm on 13 April. Significant river level rises were
recorded along the Don River between Ida Creek and Bowen Pump Station as a result of this
rainfall. The forecast location of Bowen Pump Station recorded 163 mm in the two hours to 2:15
pm on 13 April. A moderate flood peak of 5.3 m occurred at Bowen Pump Station, which was the
highest level recorded since February 2008. Flood warnings for the Don River began on 13 April
and were finalised on 14 April.
Proserpine
Moderate to heavy rainfall was recorded within the Proserpine River catchment during this event,
with significant localised flooding.
Pioneer
Moderate to heavy rainfall was recorded within the Pioneer River catchment during this event;
however, apart from a small rise in Cattle Creek, no significant river level rises were recorded in
this catchment.
Fitzroy
Moderate to heavy rainfall was recorded within the Connors River catchment, most notably in the
northern tributaries of Prospect and Funnel Creeks, with rainfalls of 30-100 mm recorded in the 24
hours to 9 am on 14 April. River level rises were recorded across the Connors River catchment
with a moderate flood peak recorded at Yatton on the Isaac River. River levels downstream
remained well below minor.
Tropical cyclone Ita flood report 8
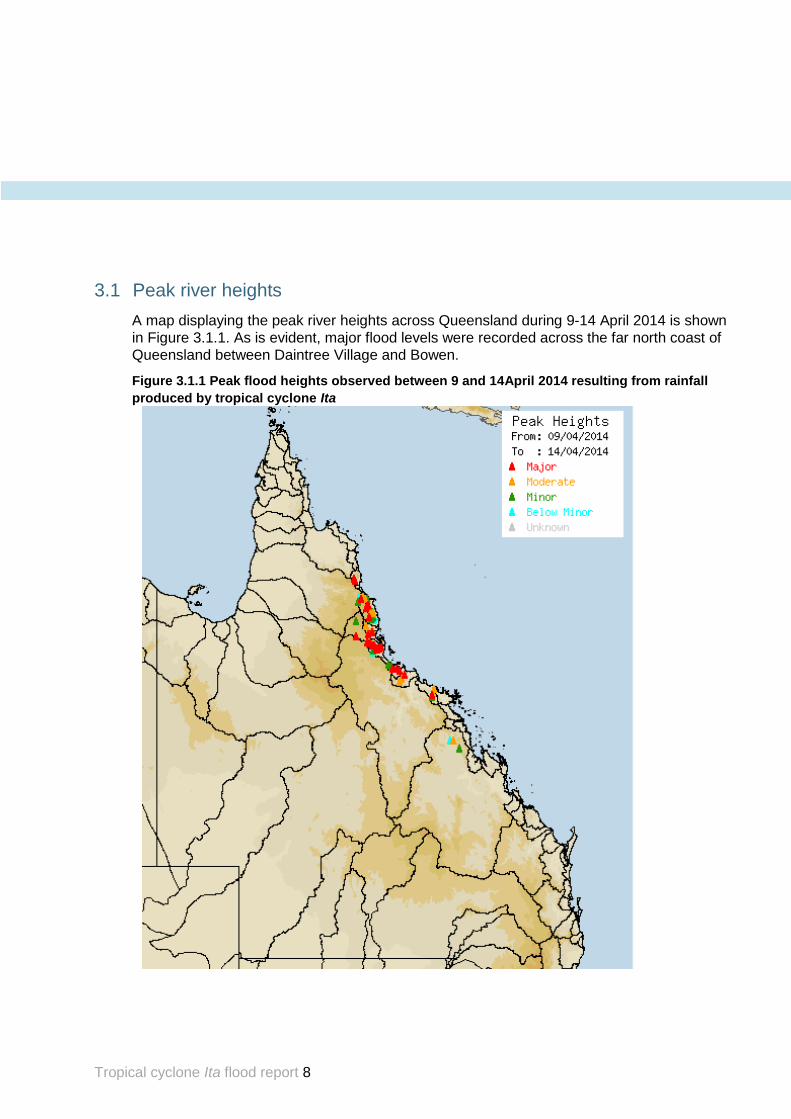
3.1 Peak river heights
A map displaying the peak river heights across Queensland during 9-14 April 2014 is shown
in Figure 3.1.1. As is evident, major flood levels were recorded across the far north coast of
Queensland between Daintree Village and Bowen.
Figure 3.1.1 Peak flood heights observed between 9 and 14April 2014 resulting from rainfall
produced by tropical cyclone Ita
Tropical cyclone Ita flood report 9
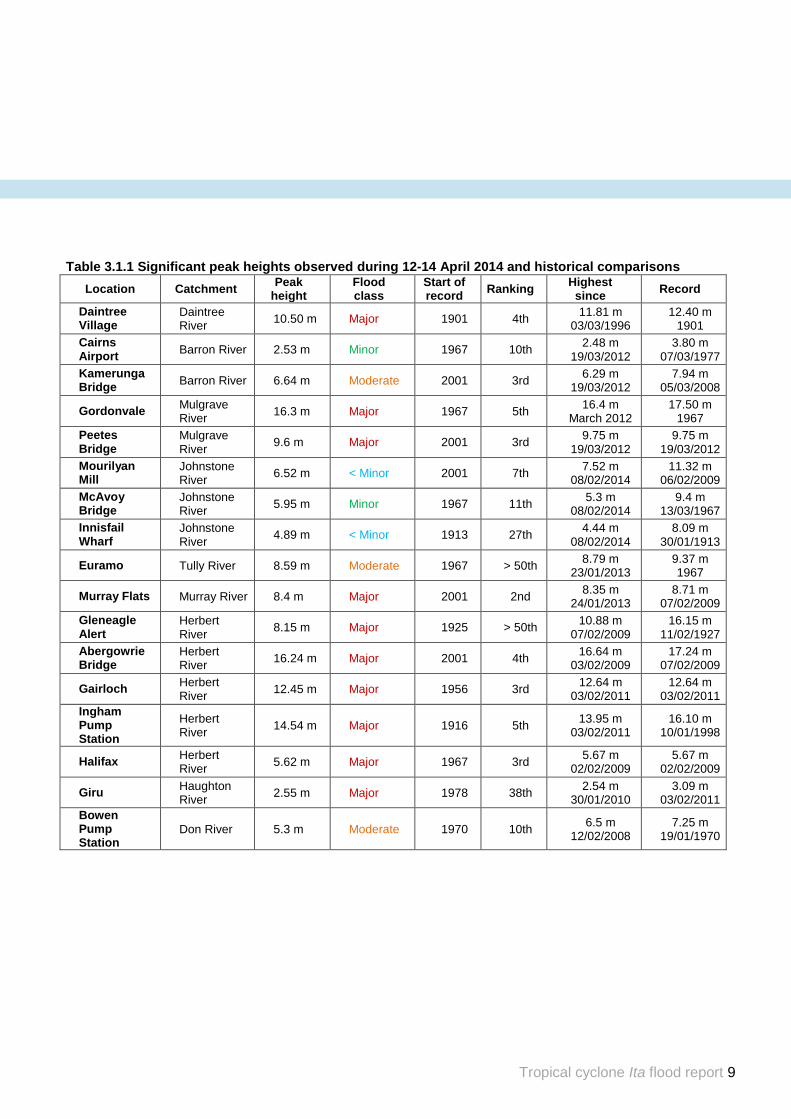
Table 3.1.1 Significant peak heights observed during 12-14 April 2014 and historical comparisons
Location Catchment Peak
height Flood class
Start of record
Ranking Highest
since Record
Daintree Village
Daintree River
10.50 m Major 1901 4th 11.81 m
03/03/1996 12.40 m
1901
Cairns Airport
Barron River 2.53 m Minor 1967 10th 2.48 m
19/03/2012 3.80 m
07/03/1977
Kamerunga Bridge
Barron River 6.64 m Moderate 2001 3rd 6.29 m
19/03/2012 7.94 m
05/03/2008
Gordonvale Mulgrave River
16.3 m Major 1967 5th 16.4 m
March 2012 17.50 m
1967
Peetes Bridge
Mulgrave River
9.6 m Major 2001 3rd 9.75 m
19/03/2012 9.75 m
19/03/2012
Mourilyan Mill
Johnstone River
6.52 m < Minor 2001 7th 7.52 m
08/02/2014 11.32 m
06/02/2009
McAvoy Bridge
Johnstone River
5.95 m Minor 1967 11th 5.3 m
08/02/2014 9.4 m
13/03/1967
Innisfail Wharf
Johnstone River
4.89 m < Minor 1913 27th 4.44 m
08/02/2014 8.09 m
30/01/1913
Euramo Tully River 8.59 m Moderate 1967 > 50th 8.79 m
23/01/2013 9.37 m 1967
Murray Flats Murray River 8.4 m Major 2001 2nd 8.35 m
24/01/2013 8.71 m
07/02/2009
Gleneagle Alert
Herbert River
8.15 m Major 1925 > 50th 10.88 m
07/02/2009 16.15 m
11/02/1927
Abergowrie Bridge
Herbert River
16.24 m Major 2001 4th 16.64 m
03/02/2009 17.24 m
07/02/2009
Gairloch Herbert River
12.45 m Major 1956 3rd 12.64 m
03/02/2011 12.64 m
03/02/2011
Ingham Pump Station
Herbert River
14.54 m Major 1916 5th 13.95 m
03/02/2011 16.10 m
10/01/1998
Halifax Herbert River
5.62 m Major 1967 3rd 5.67 m
02/02/2009 5.67 m
02/02/2009
Giru Haughton River
2.55 m Major 1978 38th 2.54 m
30/01/2010 3.09 m
03/02/2011
Bowen Pump Station
Don River 5.3 m Moderate 1970 10th 6.5 m
12/02/2008 7.25 m
19/01/1970
Tropical cyclone Ita flood report 10
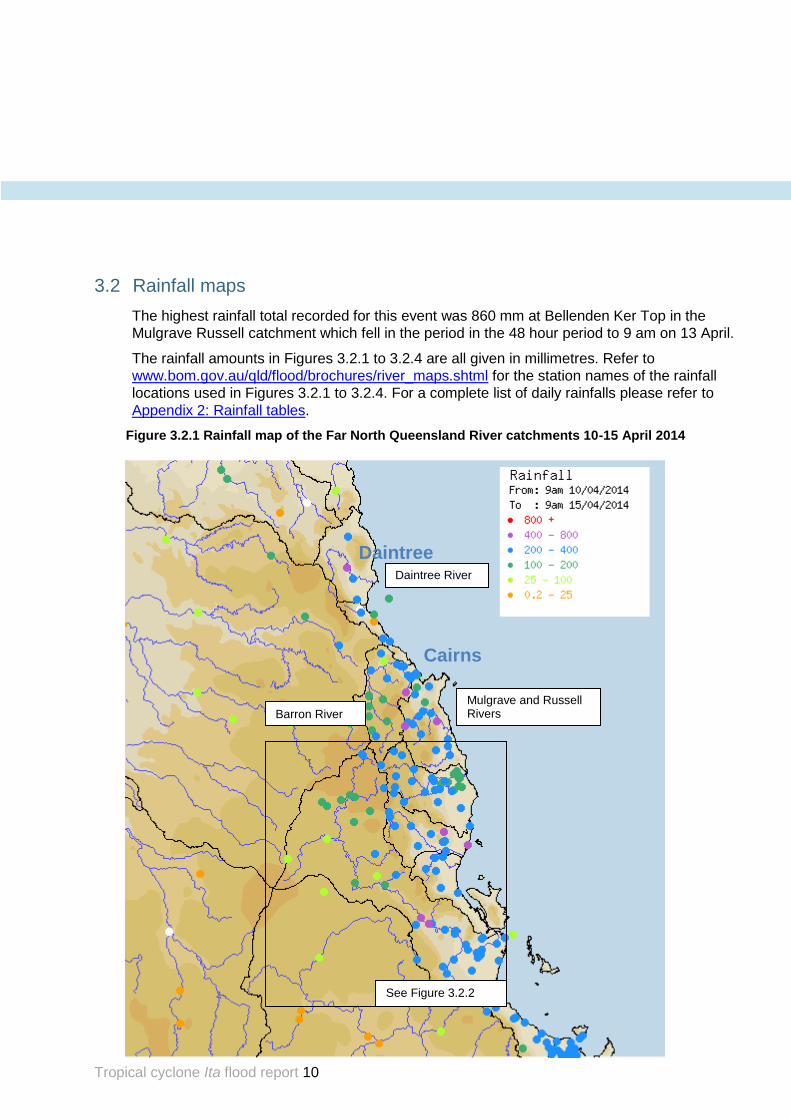
3.2 Rainfall maps
The highest rainfall total recorded for this event was 860 mm at Bellenden Ker Top in the
Mulgrave Russell catchment which fell in the period in the 48 hour period to 9 am on 13 April.
The rainfall amounts in Figures 3.2.1 to 3.2.4 are all given in millimetres. Refer to
www.bom.gov.au/qld/flood/brochures/river_maps.shtml for the station names of the rainfall
locations used in Figures 3.2.1 to 3.2.4. For a complete list of daily rainfalls please refer to
Appendix 2: Rainfall tables.
Barron River
Daintree River
Mulgrave and Russell Rivers
See Figure 3.2.2
Cairns
Daintree
Figure 3.2.1 Rainfall map of the Far North Queensland River catchments 10-15 April 2014
Tropical cyclone Ita flood report 11
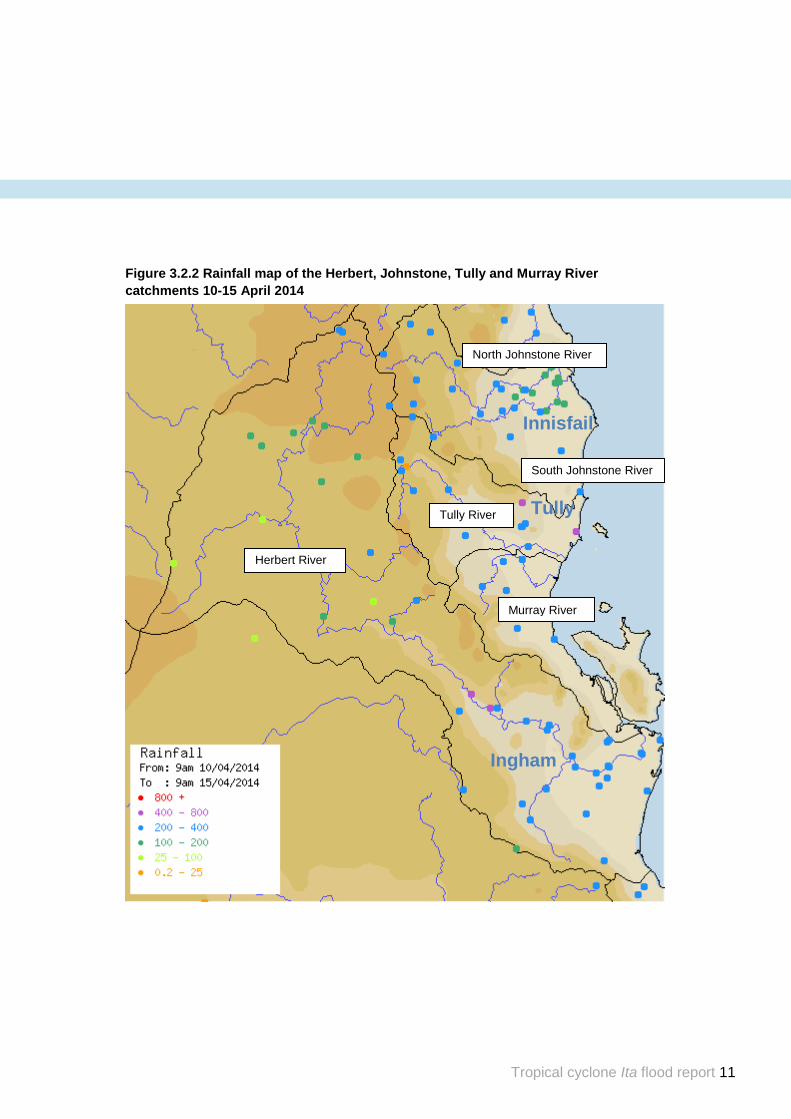
Figure 3.2.2 Rainfall map of the Herbert, Johnstone, Tully and Murray River
catchments 10-15 April 2014
Herbert River
Tully River
Murray River
South Johnstone River
North Johnstone River
Ingham
Tully
Innisfail
Tropical cyclone Ita flood report 12
Figure 3.2.3 Rainfall map of the Ross and Haughton River catchments 10-15 April 2014
Ross River
Haughton River
Giru
Townsville
Tropical cyclone Ita flood report 13
Figure 3.2.4 Rainfall map of the Don River catchment 10-15 April 2014
Don River
Bowen
Tropical cyclone Ita flood report 14
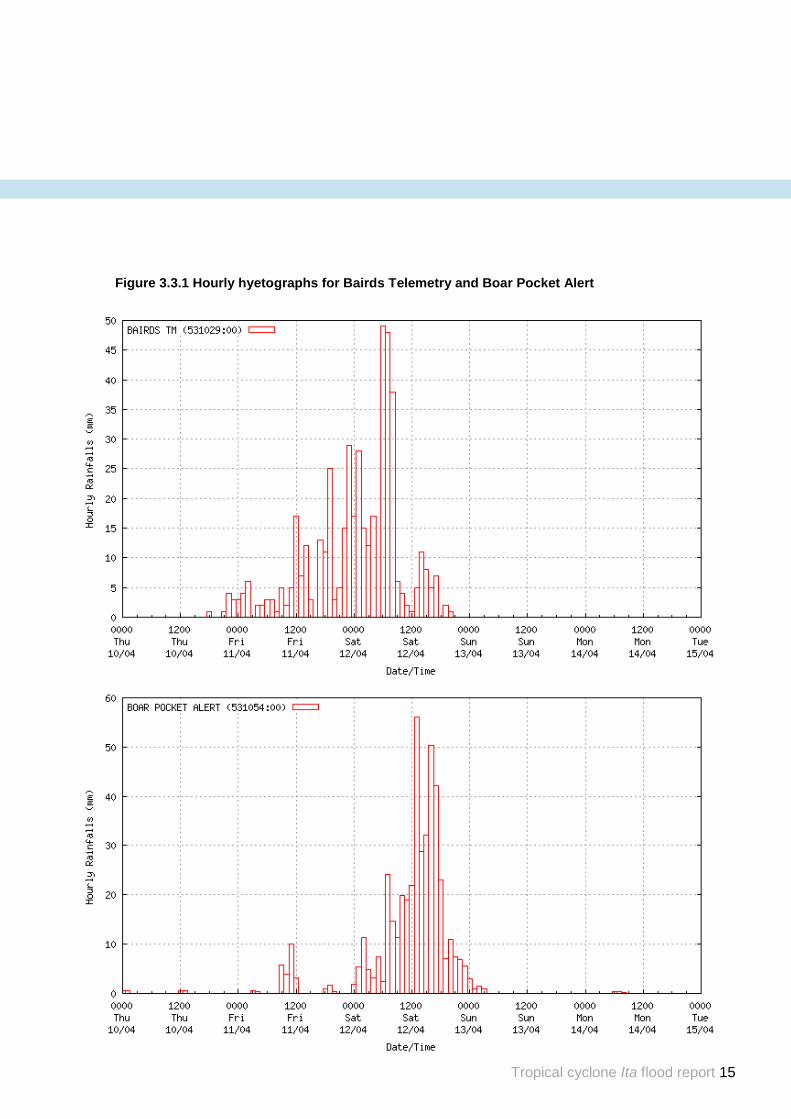
3.3 Rainfall intensity
Hourly hyetographs and an analysis of the duration and intensity of the most significant rainfall totals following tropical cyclone Ita are presented in Figures 3.3.1 and 3.3.2 and Tables 3.3.1 and 3.3.2 respectively. The selected sites include Bairds telemetry in the Daintree River catchment, Boar Pocket Alert in the Barron River catchment, Copperlode Dam Alert on Freshwater Creek in the Barron River catchment, Nash’s Crossing Alert in the Herbert River catchment and Reeves Alert and Bowen Pump Station Alert in the Don River catchment. Short duration rainfall intensities (less than 1 hour) for all locations were typically insignificant, with at least a 10 per cent chance of being exceeded in any one year. The highest rainfall total recorded at an automatic station was 484 mm at Bairds telemetry ; however, the highest intensities recorded at Bairds were 296 mm in 12 hours and 403 mm in 24 hours. Both intensities had a 5-10 per cent chance of being exceeded in any one year. The highest intensity rainfalls recorded during this event were at Boar Pocket Alert, Reeve Alert and Bowen Pump Station Alert, all of which exceeded the 1 per cent Annual Exceedance Probability (AEP). Refer to www.bom.gov.au/qld/flood/brochures/river_maps.shtml for the location of rainfall stations used in Figures 3.3.1 and 3.3.2. Note: A flood frequency analysis would be required to assess the probability of flood peaks recorded at each location. The frequency analysis in this report is for rainfall only.
Tropical cyclone Ita flood report 15
Figure 3.3.1 Hourly hyetographs for Bairds Telemetry and Boar Pocket Alert
Tropical cyclone Ita flood report 16
Table 3.3.1 Intensity–Frequency–Duration rainfall analyses for Bairds telemetry and Boar Pocket
Alert
Rainfall Intensity–Frequency–Duration Analysis Location: 531029 Bairds telemetry
Analysis of the rainfall for the 136 hours to 16:00 Tuesday 15 April 2014
Rainfall (mm)
Period Ending ARI (years)
9 5 mins ending at 07:10:00 12/04/2014 < 1
10 6 mins ending at 07:11:00 12/04/2014 < 1
15 10 mins ending at 07:15:00 12/04/2014 < 1
24 20 mins ending at 07:15:00 12/04/2014 < 1
30 30 mins ending at 07:25:00 12/04/2014 < 1
54 60 mins ending at 06:20:00 12/04/2014 1-2
104 2 hours ending at 07:10:00 12/04/2014 2-5
139 3 hours ending at 07:35:00 12/04/2014 5-10
185 6 hours ending at 07:50:00 12/04/2014 5
296 12 hours ending at 08:20:00 12/04/2014 10-20
403 24 hours ending at 10:05:00 12/04/2014 10-20
484 48 hours ending at 19:40:00 12/04/2014 5-10
486 72 hours ending at 00:00:00 13/04/2014 2-5
Rainfall Intensity–Frequency–Duration Analysis Location: 531054 Boar Pocket Alert
Analysis of the rainfall for the 136 hours to 16:00 Tuesday 15 April 2014
Rainfall (mm)
Period Ending ARI (years)
9 5 mins ending at 07:10:00 12/04/2014 < 1
10 6 mins ending at 07:11:00 12/04/2014 < 1
15 10 mins ending at 07:15:00 12/04/2014 < 1
24 20 mins ending at 07:15:00 12/04/2014 < 1
30 30 mins ending at 07:25:00 12/04/2014 < 1
54 60 mins ending at 06:20:00 12/04/2014 1-2
104 2 hours ending at 07:10:00 12/04/2014 2-5
139 3 hours ending at 07:35:00 12/04/2014 5-10
185 6 hours ending at 07:50:00 12/04/2014 5
296 12 hours ending at 08:20:00 12/04/2014 10-20
403 24 hours ending at 10:05:00 12/04/2014 10-20
484 48 hours ending at 19:40:00 12/04/2014 5-10
486 72 hours ending at 00:00:00 13/04/2014 2-5
Tropical cyclone Ita flood report 17
Figure 3.3.2 Hourly hyetographs for Copperlode Dam Alert and Nash’s Crossing Alert
Tropical cyclone Ita flood report 18
Table 3.3.2 Intensity–Frequency–Duration rainfall analyses for Copperlode Dam Alert and Nash’s Crossing Alert
Rainfall Intensity–Frequency–Duration Analysis Location: 031205 Copperlode Dam Alert
Analysis of the rainfall for the 136 hours to 16:00 Tuesday 15 April 2014
Rainfall (mm)
Period Ending ARI (years)
9 5 mins ending at 12:05:00 12/04/2014 1
9 6 mins ending at 12:06:00 12/04/2014 < 1
13 10 mins ending at 14:10:00 12/04/2014 < 1
22 20 mins ending at 12:05:00 12/04/2014 < 1
28 30 mins ending at 12:05:00 12/04/2014 < 1
52 60 mins ending at 12:10:00 12/04/2014 1-2
86 2 hours ending at 12:40:00 12/04/2014 2-5
99 3 hours ending at 12:45:00 12/04/2014 2-5
165 6 hours ending at 15:30:00 12/04/2014 2-5
259 12 hours ending at 16:50:00 12/04/2014 5-10
359 24 hours ending at 21:00:00 12/04/2014 5-10
437 48 hours ending at 02:20:00 13/04/2014 5-10
439 72 hours ending at 23:20:00 13/04/2014 2-5
Rainfall Intensity–Frequency–Duration Analysis Location: 032170 Nash's Crossing Alert
Analysis of the rainfall for the 136 hours to 16:00 Tuesday 15 April 2014
Rainfall (mm)
Period Ending ARI (years)
5 5 mins ending at 23:35:00 12/04/2014 < 1
6 6 mins ending at 19:41:00 12/04/2014 < 1
9 10 mins ending at 22:45:00 12/04/2014 < 1
18 20 mins ending at 00:35:00 13/04/2014 < 1
26 30 mins ending at 00:45:00 13/04/2014 < 1
50 60 mins ending at 01:10:00 13/04/2014 1-2
88 2 hours ending at 01:10:00 13/04/2014 2-5
130 3 hours ending at 01:35:00 13/04/2014 5-10
203 6 hours ending at 03:40:00 13/04/2014 10-20
328 12 hours ending at 04:50:00 13/04/2014 20-50
377 24 hours ending at 06:55:00 13/04/2014 10-20
430 48 hours ending at 06:55:00 13/04/2014 5-10
432 72 hours ending at 06:55:00 13/04/2014 5-10
Tropical cyclone Ita flood report 19
Figure 3.3.3 Hourly hyetographs for Reeves Alert and Bowen Pump Station Alert
Tropical cyclone Ita flood report 20
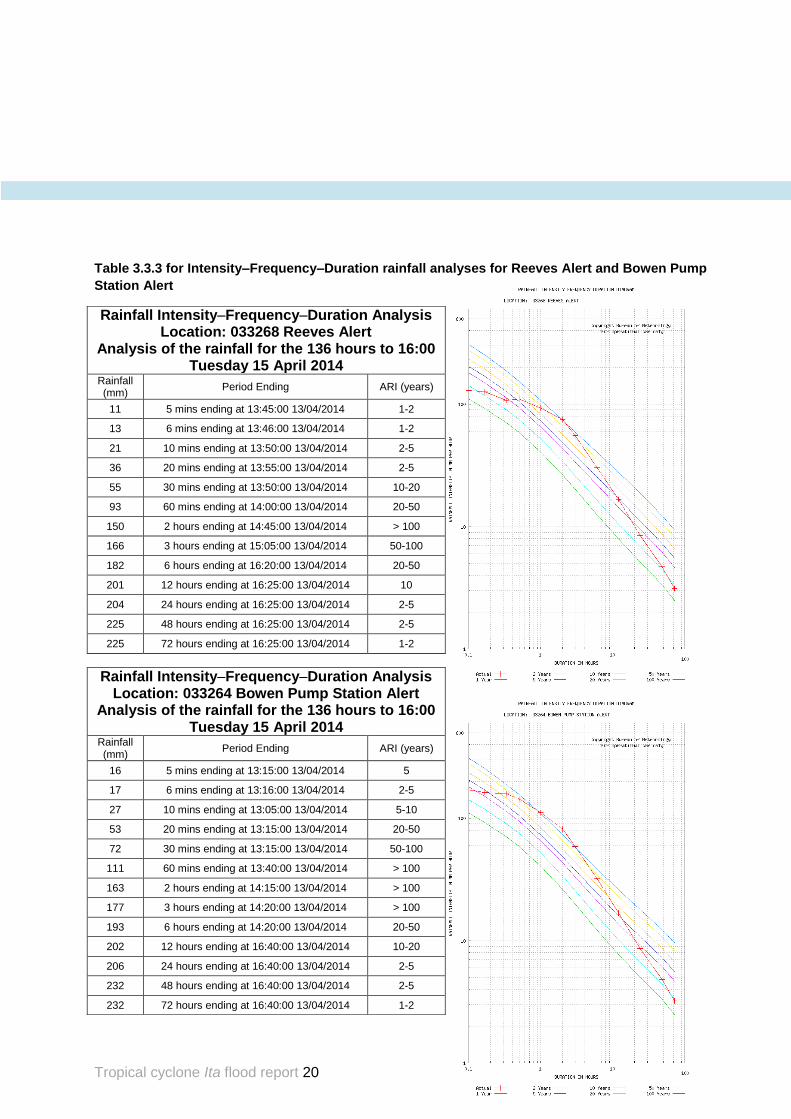
Table 3.3.3 for Intensity–Frequency–Duration rainfall analyses for Reeves Alert and Bowen Pump
Station Alert
Rainfall Intensity–Frequency–Duration Analysis Location: 033268 Reeves Alert
Analysis of the rainfall for the 136 hours to 16:00 Tuesday 15 April 2014
Rainfall (mm)
Period Ending ARI (years)
11 5 mins ending at 13:45:00 13/04/2014 1-2
13 6 mins ending at 13:46:00 13/04/2014 1-2
21 10 mins ending at 13:50:00 13/04/2014 2-5
36 20 mins ending at 13:55:00 13/04/2014 2-5
55 30 mins ending at 13:50:00 13/04/2014 10-20
93 60 mins ending at 14:00:00 13/04/2014 20-50
150 2 hours ending at 14:45:00 13/04/2014 > 100
166 3 hours ending at 15:05:00 13/04/2014 50-100
182 6 hours ending at 16:20:00 13/04/2014 20-50
201 12 hours ending at 16:25:00 13/04/2014 10
204 24 hours ending at 16:25:00 13/04/2014 2-5
225 48 hours ending at 16:25:00 13/04/2014 2-5
225 72 hours ending at 16:25:00 13/04/2014 1-2
Rainfall Intensity–Frequency–Duration Analysis Location: 033264 Bowen Pump Station Alert
Analysis of the rainfall for the 136 hours to 16:00 Tuesday 15 April 2014
Rainfall (mm)
Period Ending ARI (years)
16 5 mins ending at 13:15:00 13/04/2014 5
17 6 mins ending at 13:16:00 13/04/2014 2-5
27 10 mins ending at 13:05:00 13/04/2014 5-10
53 20 mins ending at 13:15:00 13/04/2014 20-50
72 30 mins ending at 13:15:00 13/04/2014 50-100
111 60 mins ending at 13:40:00 13/04/2014 > 100
163 2 hours ending at 14:15:00 13/04/2014 > 100
177 3 hours ending at 14:20:00 13/04/2014 > 100
193 6 hours ending at 14:20:00 13/04/2014 20-50
202 12 hours ending at 16:40:00 13/04/2014 10-20
206 24 hours ending at 16:40:00 13/04/2014 2-5
232 48 hours ending at 16:40:00 13/04/2014 2-5
232 72 hours ending at 16:40:00 13/04/2014 1-2
Tropical cyclone Ita flood report 21
3.4 Flood warning services
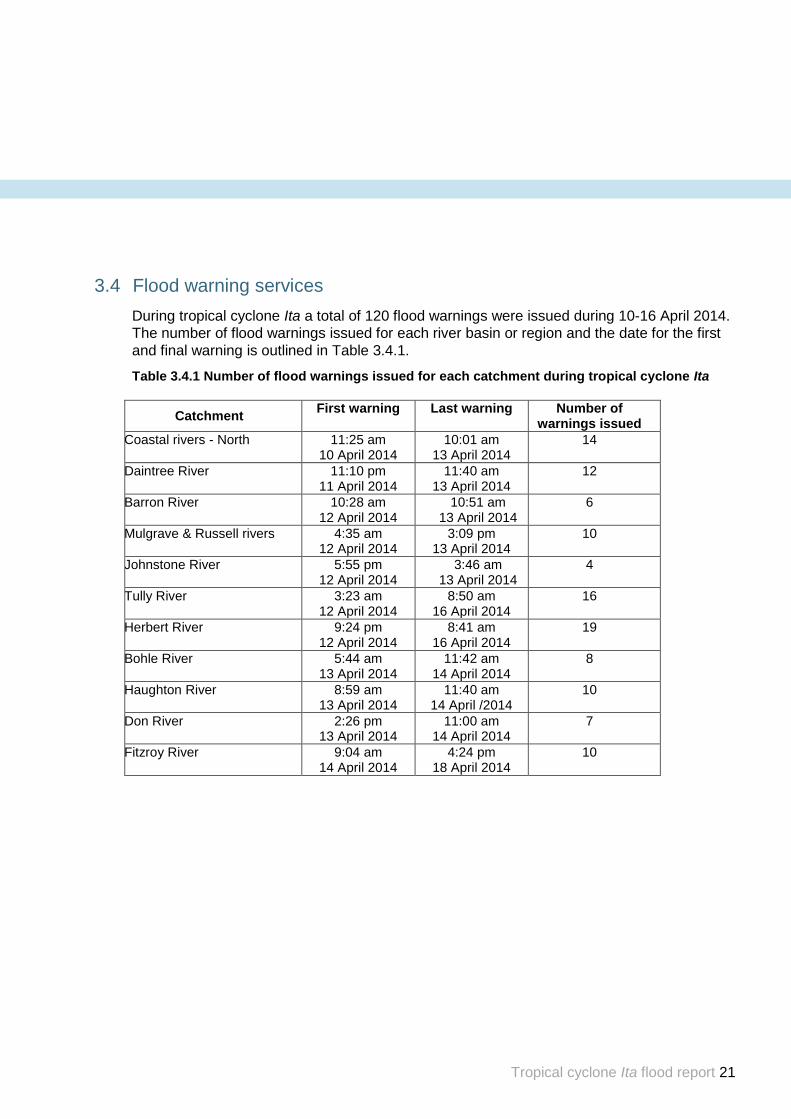
During tropical cyclone Ita a total of 120 flood warnings were issued during 10-16 April 2014.
The number of flood warnings issued for each river basin or region and the date for the first
and final warning is outlined in Table 3.4.1.
Table 3.4.1 Number of flood warnings issued for each catchment during tropical cyclone Ita
Catchment First warning Last warning Number of
warnings issued
Coastal rivers - North 11:25 am 10 April 2014
10:01 am 13 April 2014
14
Daintree River 11:10 pm 11 April 2014
11:40 am 13 April 2014
12
Barron River 10:28 am 12 April 2014
10:51 am 13 April 2014
6
Mulgrave & Russell rivers 4:35 am 12 April 2014
3:09 pm 13 April 2014
10
Johnstone River 5:55 pm 12 April 2014
3:46 am 13 April 2014
4
Tully River 3:23 am 12 April 2014
8:50 am 16 April 2014
16
Herbert River 9:24 pm 12 April 2014
8:41 am 16 April 2014
19
Bohle River 5:44 am 13 April 2014
11:42 am 14 April 2014
8
Haughton River 8:59 am 13 April 2014
11:40 am 14 April /2014
10
Don River 2:26 pm 13 April 2014
11:00 am 14 April 2014
7
Fitzroy River 9:04 am 14 April 2014
4:24 pm 18 April 2014
10
Tropical cyclone Ita flood report 22
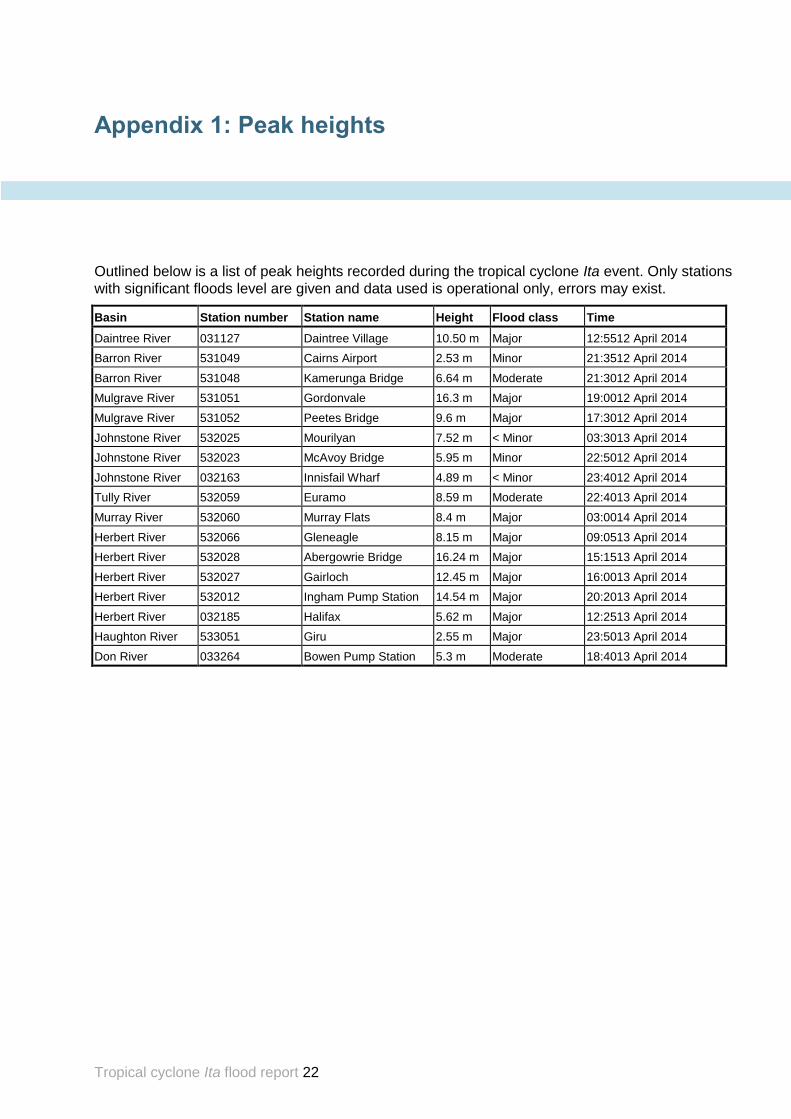
Outlined below is a list of peak heights recorded during the tropical cyclone Ita event. Only stations
with significant floods level are given and data used is operational only, errors may exist.
Basin Station number Station name Height Flood class Time
Daintree River 031127 Daintree Village 10.50 m Major 12:5512 April 2014
Barron River 531049 Cairns Airport 2.53 m Minor 21:3512 April 2014
Barron River 531048 Kamerunga Bridge 6.64 m Moderate 21:3012 April 2014
Mulgrave River 531051 Gordonvale 16.3 m Major 19:0012 April 2014
Mulgrave River 531052 Peetes Bridge 9.6 m Major 17:3012 April 2014
Johnstone River 532025 Mourilyan 7.52 m < Minor 03:3013 April 2014
Johnstone River 532023 McAvoy Bridge 5.95 m Minor 22:5012 April 2014
Johnstone River 032163 Innisfail Wharf 4.89 m < Minor 23:4012 April 2014
Tully River 532059 Euramo 8.59 m Moderate 22:4013 April 2014
Murray River 532060 Murray Flats 8.4 m Major 03:0014 April 2014
Herbert River 532066 Gleneagle 8.15 m Major 09:0513 April 2014
Herbert River 532028 Abergowrie Bridge 16.24 m Major 15:1513 April 2014
Herbert River 532027 Gairloch 12.45 m Major 16:0013 April 2014
Herbert River 532012 Ingham Pump Station 14.54 m Major 20:2013 April 2014
Herbert River 032185 Halifax 5.62 m Major 12:2513 April 2014
Haughton River 533051 Giru 2.55 m Major 23:5013 April 2014
Don River 033264 Bowen Pump Station 5.3 m Moderate 18:4013 April 2014
Appendix 1: Peak heights
Tropical cyclone Ita flood report 23
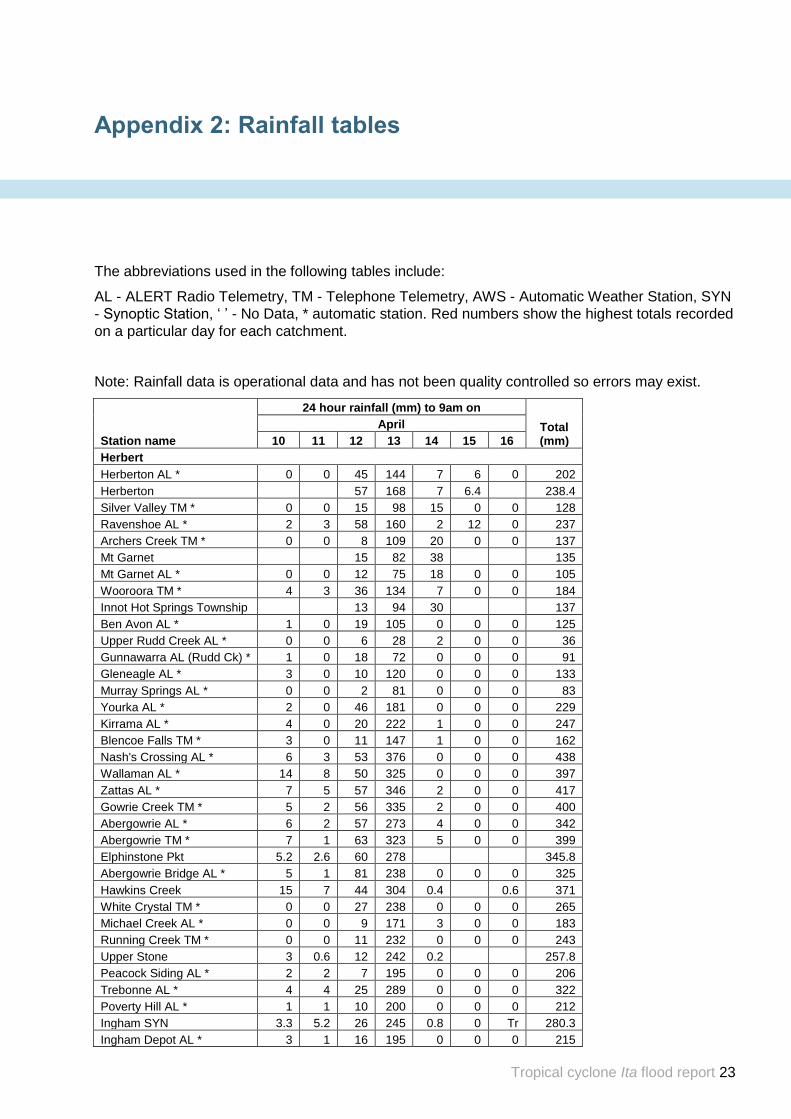
The abbreviations used in the following tables include:
AL - ALERT Radio Telemetry, TM - Telephone Telemetry, AWS - Automatic Weather Station, SYN
- Synoptic Station, ‘ ’ - No Data, * automatic station. Red numbers show the highest totals recorded
on a particular day for each catchment.
Note: Rainfall data is operational data and has not been quality controlled so errors may exist.
Station name
24 hour rainfall (mm) to 9am on
Total (mm)
April
10 11 12 13 14 15 16
Herbert
Herberton AL * 0 0 45 144 7 6 0 202
Herberton 57 168 7 6.4 238.4
Silver Valley TM * 0 0 15 98 15 0 0 128
Ravenshoe AL * 2 3 58 160 2 12 0 237
Archers Creek TM * 0 0 8 109 20 0 0 137
Mt Garnet 15 82 38 135
Mt Garnet AL * 0 0 12 75 18 0 0 105
Wooroora TM * 4 3 36 134 7 0 0 184
Innot Hot Springs Township 13 94 30 137
Ben Avon AL * 1 0 19 105 0 0 0 125
Upper Rudd Creek AL * 0 0 6 28 2 0 0 36
Gunnawarra AL (Rudd Ck) * 1 0 18 72 0 0 0 91
Gleneagle AL * 3 0 10 120 0 0 0 133
Murray Springs AL * 0 0 2 81 0 0 0 83
Yourka AL * 2 0 46 181 0 0 0 229
Kirrama AL * 4 0 20 222 1 0 0 247
Blencoe Falls TM * 3 0 11 147 1 0 0 162
Nash's Crossing AL * 6 3 53 376 0 0 0 438
Wallaman AL * 14 8 50 325 0 0 0 397
Zattas AL * 7 5 57 346 2 0 0 417
Gowrie Creek TM * 5 2 56 335 2 0 0 400
Abergowrie AL * 6 2 57 273 4 0 0 342
Abergowrie TM * 7 1 63 323 5 0 0 399
Elphinstone Pkt 5.2 2.6 60 278 345.8
Abergowrie Bridge AL * 5 1 81 238 0 0 0 325
Hawkins Creek 15 7 44 304 0.4 0.6 371
White Crystal TM * 0 0 27 238 0 0 0 265
Michael Creek AL * 0 0 9 171 3 0 0 183
Running Creek TM * 0 0 11 232 0 0 0 243
Upper Stone 3 0.6 12 242 0.2 257.8
Peacock Siding AL * 2 2 7 195 0 0 0 206
Trebonne AL * 4 4 25 289 0 0 0 322
Poverty Hill AL * 1 1 10 200 0 0 0 212
Ingham SYN 3.3 5.2 26 245 0.8 0 Tr 280.3
Ingham Depot AL * 3 1 16 195 0 0 0 215
Appendix 2: Rainfall tables
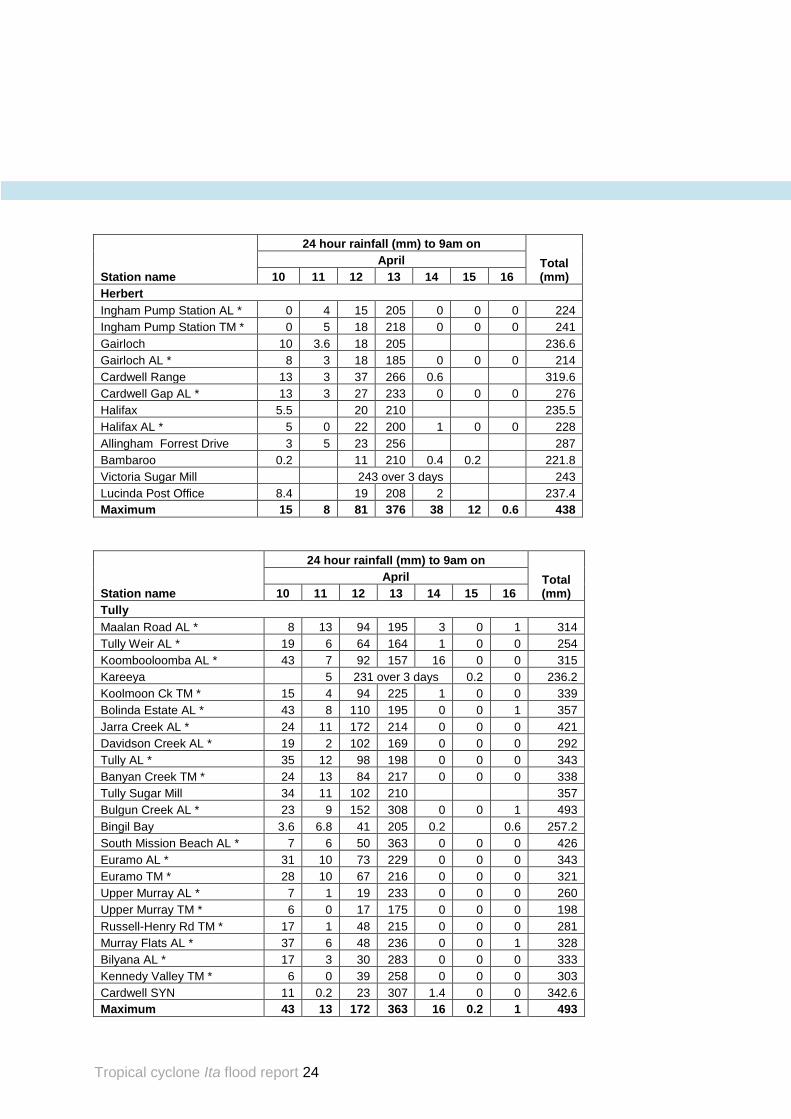
Tropical cyclone Ita flood report 24
Station name
24 hour rainfall (mm) to 9am on
Total (mm)
April
10 11 12 13 14 15 16
Herbert
Ingham Pump Station AL * 0 4 15 205 0 0 0 224
Ingham Pump Station TM * 0 5 18 218 0 0 0 241
Gairloch 10 3.6 18 205 236.6
Gairloch AL * 8 3 18 185 0 0 0 214
Cardwell Range 13 3 37 266 0.6 319.6
Cardwell Gap AL * 13 3 27 233 0 0 0 276
Halifax 5.5 20 210 235.5
Halifax AL * 5 0 22 200 1 0 0 228
Allingham Forrest Drive 3 5 23 256 287
Bambaroo 0.2 11 210 0.4 0.2 221.8
Victoria Sugar Mill 243 over 3 days 243
Lucinda Post Office 8.4 19 208 2 237.4
Maximum 15 8 81 376 38 12 0.6 438
Station name
24 hour rainfall (mm) to 9am on
Total (mm)
April
10 11 12 13 14 15 16
Tully
Maalan Road AL * 8 13 94 195 3 0 1 314
Tully Weir AL * 19 6 64 164 1 0 0 254
Koombooloomba AL * 43 7 92 157 16 0 0 315
Kareeya 5 231 over 3 days 0.2 0 236.2
Koolmoon Ck TM * 15 4 94 225 1 0 0 339
Bolinda Estate AL * 43 8 110 195 0 0 1 357
Jarra Creek AL * 24 11 172 214 0 0 0 421
Davidson Creek AL * 19 2 102 169 0 0 0 292
Tully AL * 35 12 98 198 0 0 0 343
Banyan Creek TM * 24 13 84 217 0 0 0 338
Tully Sugar Mill 34 11 102 210 357
Bulgun Creek AL * 23 9 152 308 0 0 1 493
Bingil Bay 3.6 6.8 41 205 0.2 0.6 257.2
South Mission Beach AL * 7 6 50 363 0 0 0 426
Euramo AL * 31 10 73 229 0 0 0 343
Euramo TM * 28 10 67 216 0 0 0 321
Upper Murray AL * 7 1 19 233 0 0 0 260
Upper Murray TM * 6 0 17 175 0 0 0 198
Russell-Henry Rd TM * 17 1 48 215 0 0 0 281
Murray Flats AL * 37 6 48 236 0 0 1 328
Bilyana AL * 17 3 30 283 0 0 0 333
Kennedy Valley TM * 6 0 39 258 0 0 0 303
Cardwell SYN 11 0.2 23 307 1.4 0 0 342.6
Maximum 43 13 172 363 16 0.2 1 493
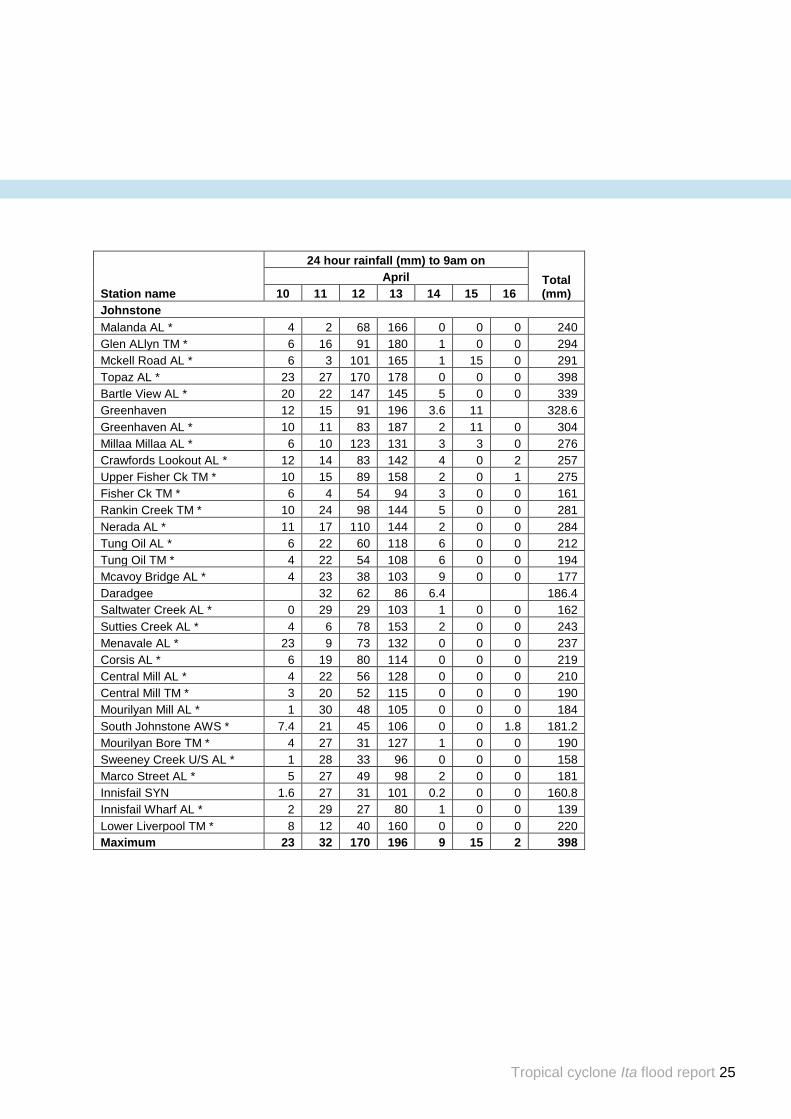
Tropical cyclone Ita flood report 25
Station name
24 hour rainfall (mm) to 9am on
Total (mm)
April
10 11 12 13 14 15 16
Johnstone
Malanda AL * 4 2 68 166 0 0 0 240
Glen ALlyn TM * 6 16 91 180 1 0 0 294
Mckell Road AL * 6 3 101 165 1 15 0 291
Topaz AL * 23 27 170 178 0 0 0 398
Bartle View AL * 20 22 147 145 5 0 0 339
Greenhaven 12 15 91 196 3.6 11 328.6
Greenhaven AL * 10 11 83 187 2 11 0 304
Millaa Millaa AL * 6 10 123 131 3 3 0 276
Crawfords Lookout AL * 12 14 83 142 4 0 2 257
Upper Fisher Ck TM * 10 15 89 158 2 0 1 275
Fisher Ck TM * 6 4 54 94 3 0 0 161
Rankin Creek TM * 10 24 98 144 5 0 0 281
Nerada AL * 11 17 110 144 2 0 0 284
Tung Oil AL * 6 22 60 118 6 0 0 212
Tung Oil TM * 4 22 54 108 6 0 0 194
Mcavoy Bridge AL * 4 23 38 103 9 0 0 177
Daradgee 32 62 86 6.4 186.4
Saltwater Creek AL * 0 29 29 103 1 0 0 162
Sutties Creek AL * 4 6 78 153 2 0 0 243
Menavale AL * 23 9 73 132 0 0 0 237
Corsis AL * 6 19 80 114 0 0 0 219
Central Mill AL * 4 22 56 128 0 0 0 210
Central Mill TM * 3 20 52 115 0 0 0 190
Mourilyan Mill AL * 1 30 48 105 0 0 0 184
South Johnstone AWS * 7.4 21 45 106 0 0 1.8 181.2
Mourilyan Bore TM * 4 27 31 127 1 0 0 190
Sweeney Creek U/S AL * 1 28 33 96 0 0 0 158
Marco Street AL * 5 27 49 98 2 0 0 181
Innisfail SYN 1.6 27 31 101 0.2 0 0 160.8
Innisfail Wharf AL * 2 29 27 80 1 0 0 139
Lower Liverpool TM * 8 12 40 160 0 0 0 220
Maximum 23 32 170 196 9 15 2 398
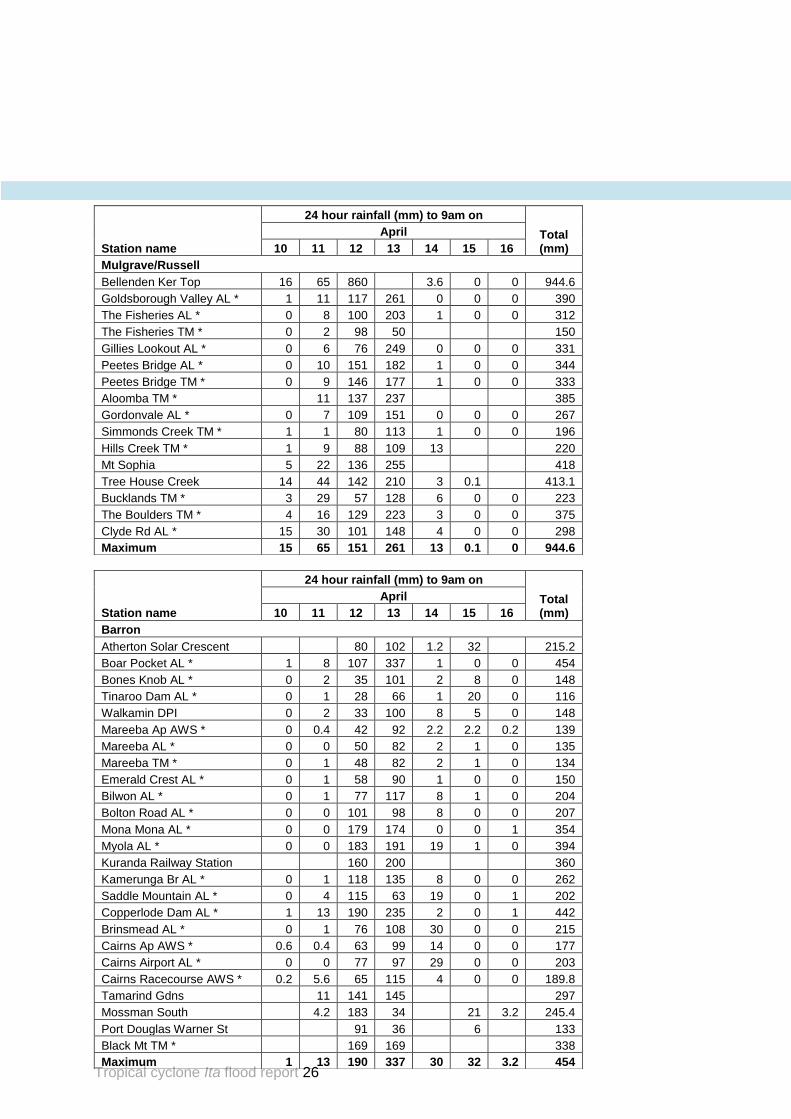
Tropical cyclone Ita flood report 26
Station name
24 hour rainfall (mm) to 9am on
Total (mm)
April
10 11 12 13 14 15 16
Mulgrave/Russell
Bellenden Ker Top 16 65 860 3.6 0 0 944.6
Goldsborough Valley AL * 1 11 117 261 0 0 0 390
The Fisheries AL * 0 8 100 203 1 0 0 312
The Fisheries TM * 0 2 98 50 150
Gillies Lookout AL * 0 6 76 249 0 0 0 331
Peetes Bridge AL * 0 10 151 182 1 0 0 344
Peetes Bridge TM * 0 9 146 177 1 0 0 333
Aloomba TM * 11 137 237 385
Gordonvale AL * 0 7 109 151 0 0 0 267
Simmonds Creek TM * 1 1 80 113 1 0 0 196
Hills Creek TM * 1 9 88 109 13 220
Mt Sophia 5 22 136 255 418
Tree House Creek 14 44 142 210 3 0.1 413.1
Bucklands TM * 3 29 57 128 6 0 0 223
The Boulders TM * 4 16 129 223 3 0 0 375
Clyde Rd AL * 15 30 101 148 4 0 0 298
Maximum 15 65 151 261 13 0.1 0 944.6
Station name
24 hour rainfall (mm) to 9am on
Total (mm)
April
10 11 12 13 14 15 16
Barron
Atherton Solar Crescent 80 102 1.2 32 215.2
Boar Pocket AL * 1 8 107 337 1 0 0 454
Bones Knob AL * 0 2 35 101 2 8 0 148
Tinaroo Dam AL * 0 1 28 66 1 20 0 116
Walkamin DPI 0 2 33 100 8 5 0 148
Mareeba Ap AWS * 0 0.4 42 92 2.2 2.2 0.2 139
Mareeba AL * 0 0 50 82 2 1 0 135
Mareeba TM * 0 1 48 82 2 1 0 134
Emerald Crest AL * 0 1 58 90 1 0 0 150
Bilwon AL * 0 1 77 117 8 1 0 204
Bolton Road AL * 0 0 101 98 8 0 0 207
Mona Mona AL * 0 0 179 174 0 0 1 354
Myola AL * 0 0 183 191 19 1 0 394
Kuranda Railway Station 160 200 360
Kamerunga Br AL * 0 1 118 135 8 0 0 262
Saddle Mountain AL * 0 4 115 63 19 0 1 202
Copperlode Dam AL * 1 13 190 235 2 0 1 442
Brinsmead AL * 0 1 76 108 30 0 0 215
Cairns Ap AWS * 0.6 0.4 63 99 14 0 0 177
Cairns Airport AL * 0 0 77 97 29 0 0 203
Cairns Racecourse AWS * 0.2 5.6 65 115 4 0 0 189.8
Tamarind Gdns 11 141 145 297
Mossman South 4.2 183 34 21 3.2 245.4
Port Douglas Warner St 91 36 6 133
Black Mt TM * 169 169 338
Maximum 1 13 190 337 30 32 3.2 454
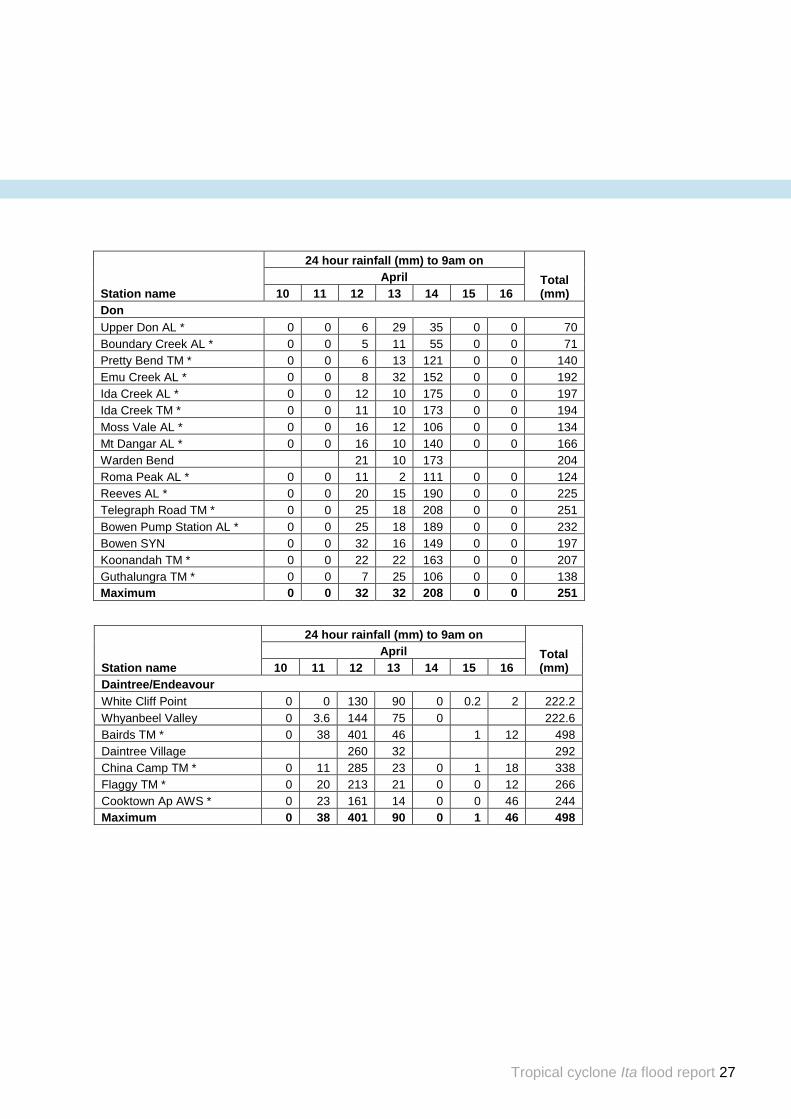
Tropical cyclone Ita flood report 27
Station name
24 hour rainfall (mm) to 9am on
Total (mm)
April
10 11 12 13 14 15 16
Don
Upper Don AL * 0 0 6 29 35 0 0 70
Boundary Creek AL * 0 0 5 11 55 0 0 71
Pretty Bend TM * 0 0 6 13 121 0 0 140
Emu Creek AL * 0 0 8 32 152 0 0 192
Ida Creek AL * 0 0 12 10 175 0 0 197
Ida Creek TM * 0 0 11 10 173 0 0 194
Moss Vale AL * 0 0 16 12 106 0 0 134
Mt Dangar AL * 0 0 16 10 140 0 0 166
Warden Bend 21 10 173 204
Roma Peak AL * 0 0 11 2 111 0 0 124
Reeves AL * 0 0 20 15 190 0 0 225
Telegraph Road TM * 0 0 25 18 208 0 0 251
Bowen Pump Station AL * 0 0 25 18 189 0 0 232
Bowen SYN 0 0 32 16 149 0 0 197
Koonandah TM * 0 0 22 22 163 0 0 207
Guthalungra TM * 0 0 7 25 106 0 0 138
Maximum 0 0 32 32 208 0 0 251
Station name
24 hour rainfall (mm) to 9am on
Total (mm)
April
10 11 12 13 14 15 16
Daintree/Endeavour
White Cliff Point 0 0 130 90 0 0.2 2 222.2
Whyanbeel Valley 0 3.6 144 75 0 222.6
Bairds TM * 0 38 401 46 1 12 498
Daintree Village 260 32 292
China Camp TM * 0 11 285 23 0 1 18 338
Flaggy TM * 0 20 213 21 0 0 12 266
Cooktown Ap AWS * 0 23 161 14 0 0 46 244
Maximum 0 38 401 90 0 1 46 498
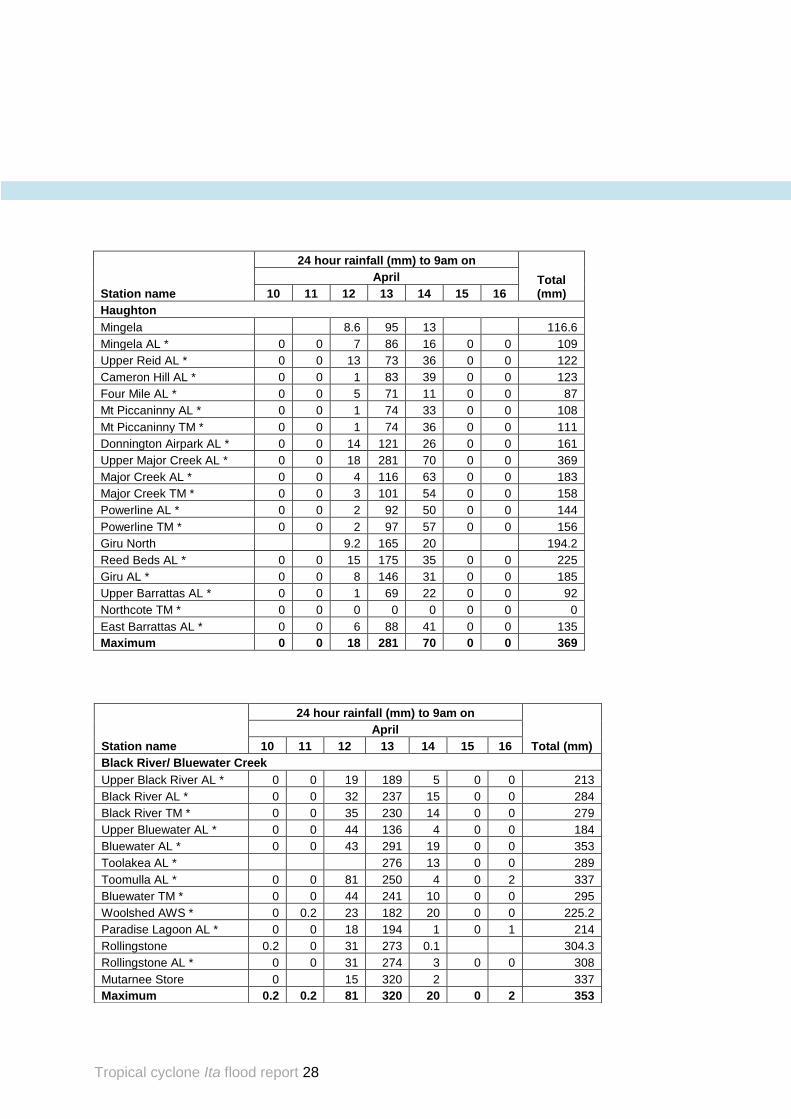
Tropical cyclone Ita flood report 28
Station name
24 hour rainfall (mm) to 9am on
Total (mm)
April
10 11 12 13 14 15 16
Haughton
Mingela 8.6 95 13 116.6
Mingela AL * 0 0 7 86 16 0 0 109
Upper Reid AL * 0 0 13 73 36 0 0 122
Cameron Hill AL * 0 0 1 83 39 0 0 123
Four Mile AL * 0 0 5 71 11 0 0 87
Mt Piccaninny AL * 0 0 1 74 33 0 0 108
Mt Piccaninny TM * 0 0 1 74 36 0 0 111
Donnington Airpark AL * 0 0 14 121 26 0 0 161
Upper Major Creek AL * 0 0 18 281 70 0 0 369
Major Creek AL * 0 0 4 116 63 0 0 183
Major Creek TM * 0 0 3 101 54 0 0 158
Powerline AL * 0 0 2 92 50 0 0 144
Powerline TM * 0 0 2 97 57 0 0 156
Giru North 9.2 165 20 194.2
Reed Beds AL * 0 0 15 175 35 0 0 225
Giru AL * 0 0 8 146 31 0 0 185
Upper Barrattas AL * 0 0 1 69 22 0 0 92
Northcote TM * 0 0 0 0 0 0 0 0
East Barrattas AL * 0 0 6 88 41 0 0 135
Maximum 0 0 18 281 70 0 0 369
Station name
24 hour rainfall (mm) to 9am on
Total (mm)
April
10 11 12 13 14 15 16
Black River/ Bluewater Creek
Upper Black River AL * 0 0 19 189 5 0 0 213
Black River AL * 0 0 32 237 15 0 0 284
Black River TM * 0 0 35 230 14 0 0 279
Upper Bluewater AL * 0 0 44 136 4 0 0 184
Bluewater AL * 0 0 43 291 19 0 0 353
Toolakea AL * 276 13 0 0 289
Toomulla AL * 0 0 81 250 4 0 2 337
Bluewater TM * 0 0 44 241 10 0 0 295
Woolshed AWS * 0 0.2 23 182 20 0 0 225.2
Paradise Lagoon AL * 0 0 18 194 1 0 1 214
Rollingstone 0.2 0 31 273 0.1 304.3
Rollingstone AL * 0 0 31 274 3 0 0 308
Mutarnee Store 0 15 320 2 337
Maximum 0.2 0.2 81 320 20 0 2 353
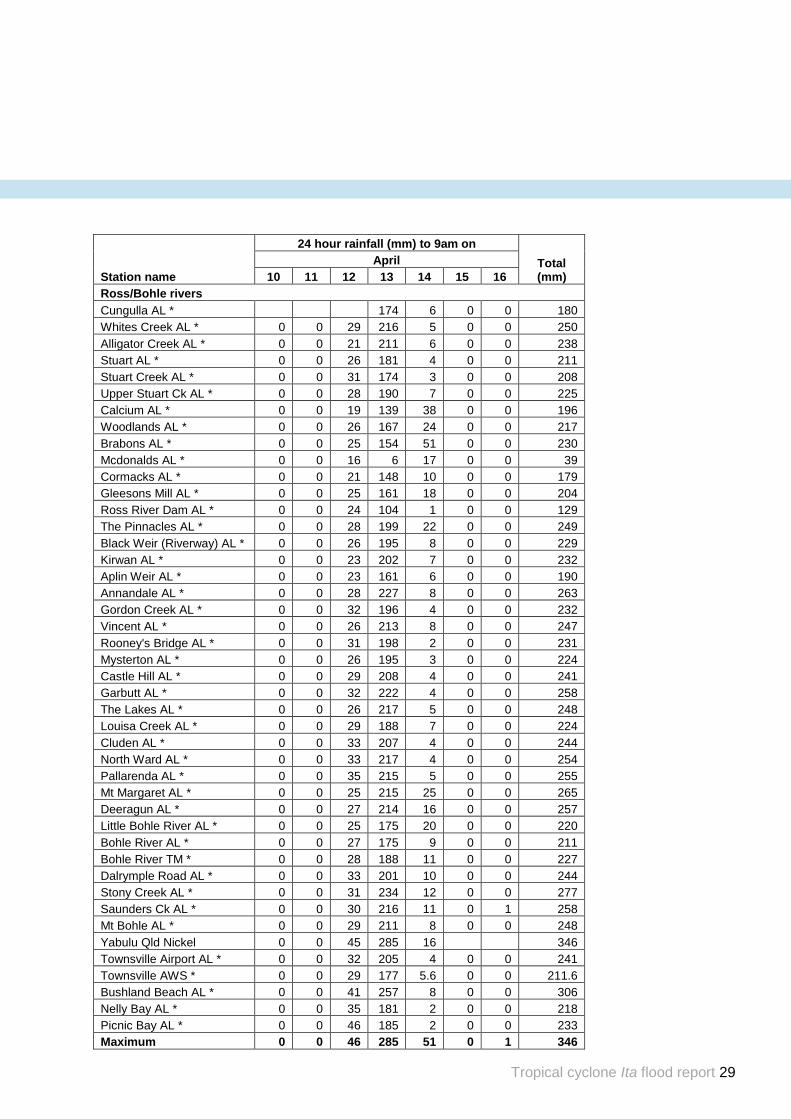
Tropical cyclone Ita flood report 29
Station name
24 hour rainfall (mm) to 9am on
Total (mm)
April
10 11 12 13 14 15 16
Ross/Bohle rivers
Cungulla AL * 174 6 0 0 180
Whites Creek AL * 0 0 29 216 5 0 0 250
Alligator Creek AL * 0 0 21 211 6 0 0 238
Stuart AL * 0 0 26 181 4 0 0 211
Stuart Creek AL * 0 0 31 174 3 0 0 208
Upper Stuart Ck AL * 0 0 28 190 7 0 0 225
Calcium AL * 0 0 19 139 38 0 0 196
Woodlands AL * 0 0 26 167 24 0 0 217
Brabons AL * 0 0 25 154 51 0 0 230
Mcdonalds AL * 0 0 16 6 17 0 0 39
Cormacks AL * 0 0 21 148 10 0 0 179
Gleesons Mill AL * 0 0 25 161 18 0 0 204
Ross River Dam AL * 0 0 24 104 1 0 0 129
The Pinnacles AL * 0 0 28 199 22 0 0 249
Black Weir (Riverway) AL * 0 0 26 195 8 0 0 229
Kirwan AL * 0 0 23 202 7 0 0 232
Aplin Weir AL * 0 0 23 161 6 0 0 190
Annandale AL * 0 0 28 227 8 0 0 263
Gordon Creek AL * 0 0 32 196 4 0 0 232
Vincent AL * 0 0 26 213 8 0 0 247
Rooney's Bridge AL * 0 0 31 198 2 0 0 231
Mysterton AL * 0 0 26 195 3 0 0 224
Castle Hill AL * 0 0 29 208 4 0 0 241
Garbutt AL * 0 0 32 222 4 0 0 258
The Lakes AL * 0 0 26 217 5 0 0 248
Louisa Creek AL * 0 0 29 188 7 0 0 224
Cluden AL * 0 0 33 207 4 0 0 244
North Ward AL * 0 0 33 217 4 0 0 254
Pallarenda AL * 0 0 35 215 5 0 0 255
Mt Margaret AL * 0 0 25 215 25 0 0 265
Deeragun AL * 0 0 27 214 16 0 0 257
Little Bohle River AL * 0 0 25 175 20 0 0 220
Bohle River AL * 0 0 27 175 9 0 0 211
Bohle River TM * 0 0 28 188 11 0 0 227
Dalrymple Road AL * 0 0 33 201 10 0 0 244
Stony Creek AL * 0 0 31 234 12 0 0 277
Saunders Ck AL * 0 0 30 216 11 0 1 258
Mt Bohle AL * 0 0 29 211 8 0 0 248
Yabulu Qld Nickel 0 0 45 285 16 346
Townsville Airport AL * 0 0 32 205 4 0 0 241
Townsville AWS * 0 0 29 177 5.6 0 0 211.6
Bushland Beach AL * 0 0 41 257 8 0 0 306
Nelly Bay AL * 0 0 35 181 2 0 0 218
Picnic Bay AL * 0 0 46 185 2 0 0 233
Maximum 0 0 46 285 51 0 1 346
Tropical cyclone Ita flood report 30
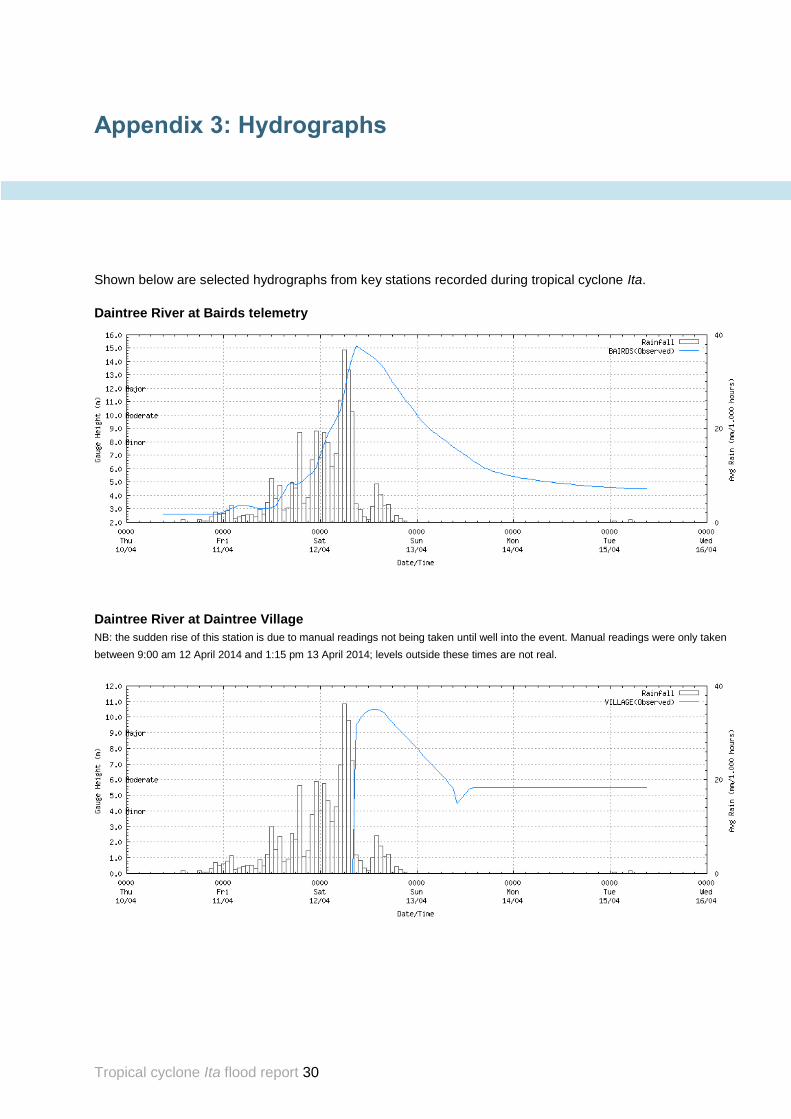
Shown below are selected hydrographs from key stations recorded during tropical cyclone Ita.
Daintree River at Bairds telemetry
Daintree River at Daintree Village
NB: the sudden rise of this station is due to manual readings not being taken until well into the event. Manual readings were only taken
between 9:00 am 12 April 2014 and 1:15 pm 13 April 2014; levels outside these times are not real.
Appendix 3: Hydrographs
Tropical cyclone Ita flood report 31
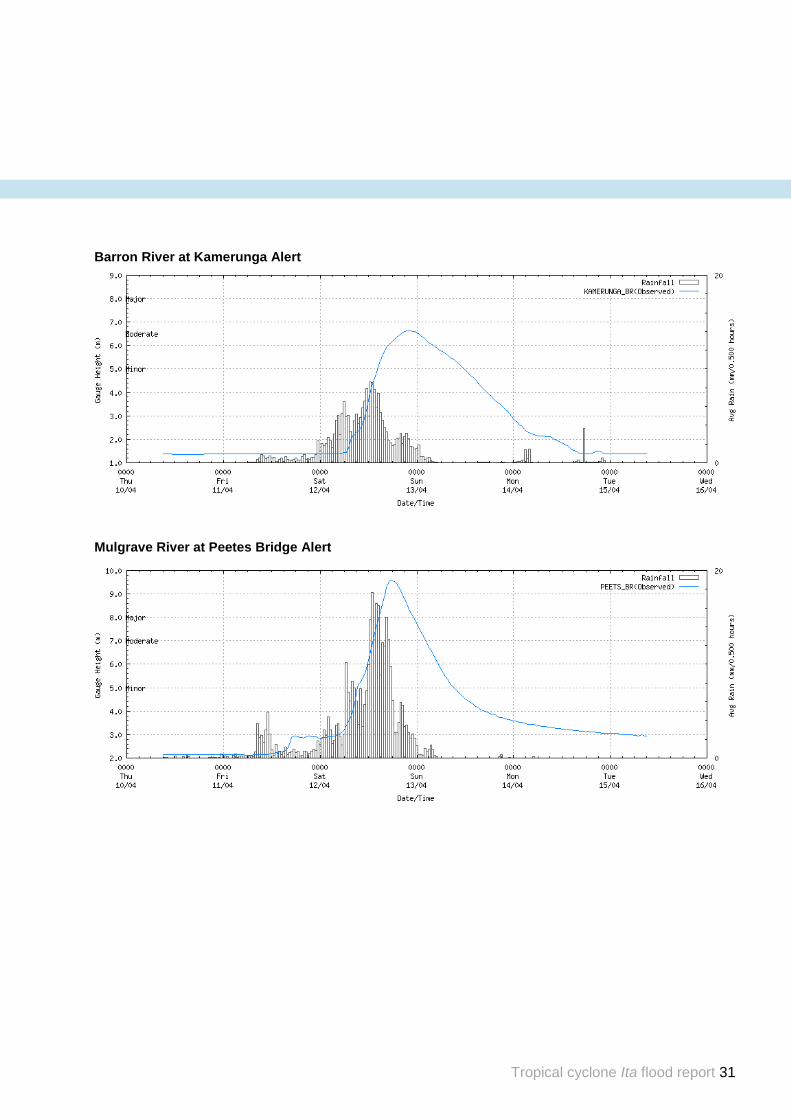
Barron River at Kamerunga Alert
Mulgrave River at Peetes Bridge Alert
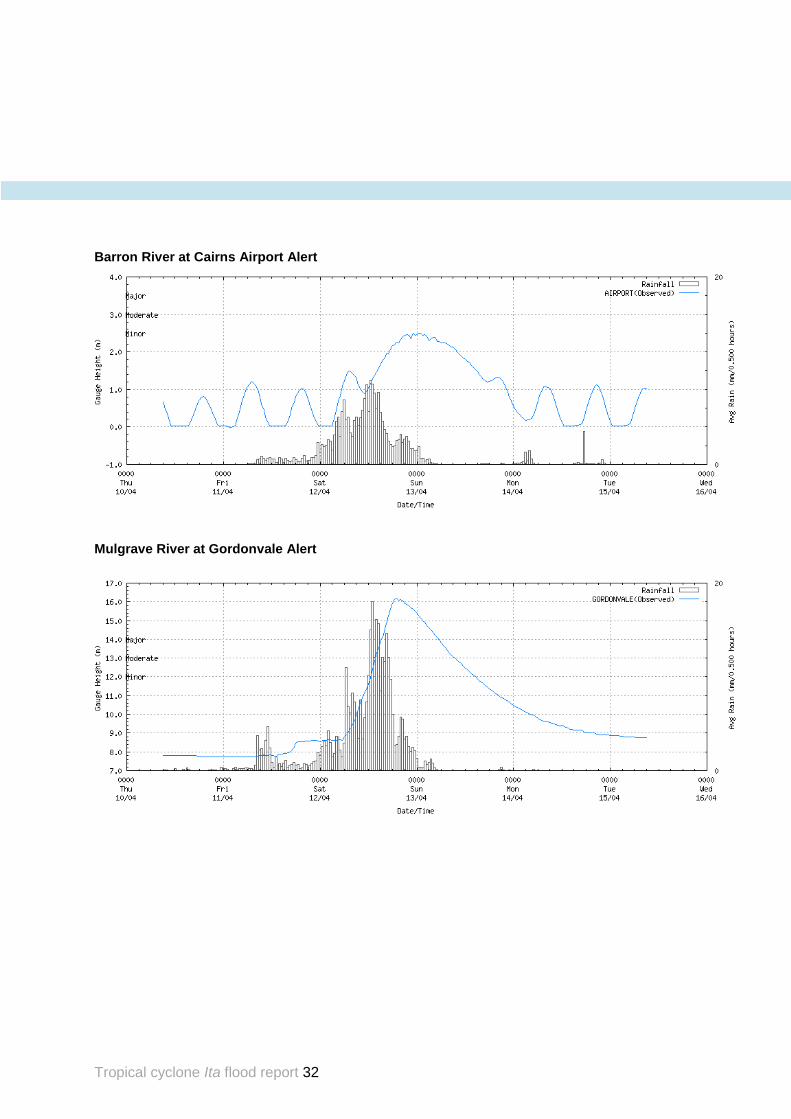
Tropical cyclone Ita flood report 32
Barron River at Cairns Airport Alert
Mulgrave River at Gordonvale Alert
Tropical cyclone Ita flood report 33
Herbert River at Abergowrie Bridge
Herbert River at Ingham Pump Station Alert
Tropical cyclone Ita flood report 34
Herbert River at Gairloch Alert
Herbert River at Halifax Alert
Tropical cyclone Ita flood report 35
Murray River at Murray Flats Alert
Tully River at Euramo Alert
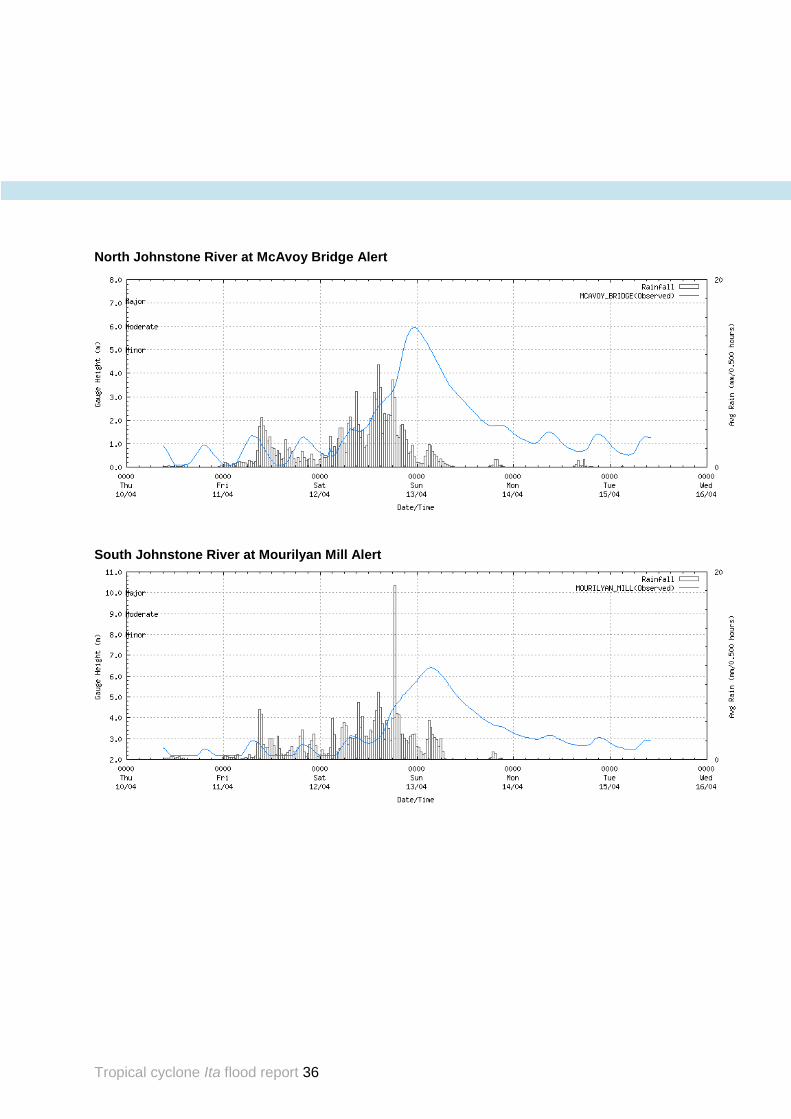
Tropical cyclone Ita flood report 36
North Johnstone River at McAvoy Bridge Alert
South Johnstone River at Mourilyan Mill Alert
Tropical cyclone Ita flood report 37
South Johnstone River at Innisfail Wharf Alert
Haughton River at Giru Alert
Tropical cyclone Ita flood report 38
Don River at Bowen Pump Station Alert
Tropical cyclone Ita flood report 39
User licence for digital data
Permitted use:
You may use the data for your own purposes (including supply to consultants for a specific consultancy project for you, but the consultants must return or destroy the data when the project is finished). You must not sell or distribute the data.
You must display this copyright notice on any copies of the data, however altered, reformatted or redisplayed, if you supply the data to a consultant or copy it for backup purposes:“© The State of Queensland (Department of Natural Resources and Mines) [2013]”.
You may create and distribute hardcopy products and non-editable digital images (e.g. PDF files) based on or containing the data, provided all the following conditions are met:
o The product(s) must be distributed at no charge, and revenue cannot be generated to offset any free distribution (e.g. advertising/sponsorship).
o You must display this acknowledgment on the product(s): “Based on or contains data provided by the State of Queensland (Department of Natural Resources and Mines) [year]. In consideration of the State permitting use of this data you acknowledge and agree that the State gives no warranty in relation to the data (including accuracy, reliability, completeness, currency or suitability) and accepts no liability (including without limitation, liability in negligence) for any loss, damage or costs (including consequential damage) relating to any use of the data. Data must not be used for direct marketing or be used in breach of the privacy laws.”
o You must include metadata with the product(s) and the metadata must incorporate as a minimum the metadata supplied with this data.
Obligations:
You must not use the data for direct marketing or in breach of the privacy laws.
If you wish to distribute the data or distribute product(s) for a charge you must organise a different licence, by contacting the Department of Natural Resources and Mines ([email protected]). Ownership: The State of Queensland, as represented by the Department of Natural Resources and Mines (NRM), is the owner of the intellectual property rights in and to the data, or has the right to make this data available under licence arrangements. External contributors to data are listed on the website watermonitoring.dnrm.qld.gov.au/host.htm .
Disclaimer and indemnity:
You agree to accept all responsibility and risks associated with the use of the data. NRM makes no
representations or warranties in relation to the data, and, you agree that, to the extent permitted by law, all
warranties relating to accuracy, reliability, completeness, currency or suitability for any particular purpose
and all liability for any loss, damage or costs (including consequential damage) incurred in any way
(including but not limited to that arising from negligence) in connection with any use of or reliance on the data
are excluded or limited. You agree to continually indemnify the State of Queensland and NRM (and their
officers and employees) against any loss, cost, expense, damage and liability of any kind (including
consequential damage and liability in negligence) arising directly or indirectly from or related to any claim
relating to your use of the data or any product made from the data.
Appendix 4: Department of Natural Resources and Mines
Usage Agreement