Embed Size (px)
Citation preview
tRNomics: Genomic Organization andProcessing patterns of tRNAs
Von der Fakultat fur Mathematik und Informatikder Universitat Leipzig
angenommene
DISSERTATION
zur Erlangung des akademischen Grades
DOCTOR RERUM NATURALIUM
(Dr. rer. nat.)
im Fachgebiet Informatik
vorgelegtvon M. Sc. Clara Isabel Bermudez Santana
geboren am 11. Juni 1973 in Chiquinquira, Kolumbien
Die Annahme der Dissertation wurde empfohlen von:
1. Professor Dr. Peter F. Stadler (Leipzig, Deutschland)2. Professor Dr. Eric Westhof (Straßbourg, Frankreich)
Die Verleihung des akademischen Grades erfolgt mit Beste-hen der Verteidigung am 13.09.2010 mit dem Gesamtpradikat
magna cum laude.

To
Tomas and GustavoYour love makes me at once keep going through


Acknowledgments
• I am heartily thankful to my supervisor, Peter F. Stadler, whose encouragement,guidance, goodwill and support from the initial to the final level of this thesis enabledme to develop an understanding of the subject. To him for being Peter and helpingme to go deeper in many aspects of my life and my scientific career.
• I owe my deepest gratitude to Jens and Petra for supporting me and my family inevery aspect of my time in Leipzig.
• I am certain to say I am lucky for having a nice time not only 3 mts around the office320.2 but also at the third floor of Hartelstrasse 16-18. Thanks to all of you whosupported me and my family during these 4 years in Leipzig.
• To the people who found time at the hard starting of this thesis: Maribel, Borut,Markus, Camille, Claudia and Dominic. Thanks specially to Maribel and Borut forsupporting me plenty of energy and enthusiasm.
• To Steve and David for our survey in transcriptome analysis and their disposition towork. It was a pleasure to work with them.
• To the people who helped and supported me in every aspect at the end of this project:Steve, David, Toralf, Camille, Jane, Jana, Sonja, Claudia, Hakim and Stephan.
• To Claudia S. Copeland for her friendship and finding a gap for editing the manuscript.
• My lovely Markus for being so patient with “my sorry ... Do you have a little time?”... Thanks forever.
• To Jan whose encouragement and smiles after his harder days always make me re-think of my life.
• To Gustavo for being husband, mother and father without loosing and losing his ownprojects on life.
• To Tomas since October 1999 for helping me to feel every day of my life as a newamazing day.
• To Valeria, Maria and the families: Rubiano Ateorthua, Vasquez, Bermudez Santanaand Santana Palacios for supporting Gustavo at home.
• To my patient parents Stella and Jaime who let me to go far away one day.
• To Carmen for the time that she believed in our friendship.
• To my Slovenian friends Borut and Bora who were my step-family during this 4 years.
• To my lovely friends Diana (my angel in Leipzig), Cata, Claudia, Maribel (my devilin Leipzig), Gloria and Jaqueline, Johan and Jaime O.
• To all our afterwork drinks and food with Gustavo, Maribel, Diana, Steve, Claudia,Jose and Jorge under the spell of Juanes, Celia Cruz, Linda Ronstadt and Jose Jose.
• To the nice time and support at the Leipzig International School. Thanks for thewonderful time shared with the Gregorian, Alpers, Schenkel and Hipps Families.
• To the Bier-Informatik mothers Barbel, Petra, Kristin, Claudia, Manja and Jana.
• For the exotic mixture Swiss-Algerian-Venezuelan-Austrian on winter 2009 that broughtme joy.
• To all our Fall and Winter Seminars and their organizers.
• To all the people around Ritterstrasse 12.
• To Prof. Dr. Martin Middendorf for supporting my scholarship extension..
• To Prof. Dr. Jurgen Jost at the Max Planck Institute for Mathematics in the Sciences(MIS) in Leipzig.
• Without hesitate to the Universidad Nacional de Colombia and DAAD-Alecol programfor the financial support.
• and to Arpe Caspary for designing Alecol to offer more German-Colombian academicexchange.
iv
Preface
The RNA world hypothesis places RNA at center-stage during the origin of life, and hasreceived support from many authors. In spite of difficulties in need of further examination,studies during the last ten years have demonstrated important aspects of RNA biologythat were not previously known. These studies support the idea of a critical role for RNAin cellular function. Many catalytic functions for RNA are known, including translationby ribosomal RNA processing of pre-mRNA by nuclear ribonucleoproteins (snRNPs), RNAediting, and reverse transcription. In Eukaryotes, many other sorts of small RNAs haverecently received attention as key components of regulatory systems, as well as main playersin the RNA silencing mechanism.
No less important is the discovery of new functions and distributions of different sortsof ncRNAs, such as small nucleolar RNAs (snoRNAs), which were initially associated with aspecific cellular compartment and were assumed to function exclusively as target ribosomalRNAs, but which are now being associated with different functions and broader locations.More intriguing have been recent findings indicating that snoRNAs can be processed toyield microRNA-like RNAs, and that there is a plausible connection between RNA silencingand snoRNA-mediated RNA processing systems.
Recent advances in the biology of transfer RNAs (tRNAs) have not only enriched ourknowledge about their functions in translation but also posit that these classical non-codinghousekeeping RNAs are key components of the small RNA-mediated gene regulation system.As occurred for the understanding of snoRNA cellular location, the knowledge of tRNAcellular location has expanded. Biosynthesis of tRNA was previously thought to occur solelyin the nucleus, with tRNA functioning only in the cytoplasm of eukaryotic cells. However,based on recent findings demonstrating that pre-tRNA splicing can occur in the cytoplasm,that aminoacylation is also possible in the nucleus, and that tRNA retrograde travel (fromthe cytoplasm to the nucleus) is possible, it is clear that tRNA will be discovered to havemany unanticipated functions in diverse cellular processes. In the next decade, plenty ofsurprises are expected, not only with regard to the nuclear-cytoplasmic dynamics of tRNAbut also for its importance in the global regulation of RNA silencing. Many respect oftRNA biology is presented on chapter 1, some issues discused are part of the publicationTanzer, T., Riester, M., Hertel, J., Bermudez-Santana, C, Gorodkin, J. Hofacker, I.Stadler. P.F. Evolutionary Genomics and Systems Biology: Chapter: Evolutionary genomics
of microRNAs and their relatives. March 2010, Wiley-Blackwell.
tRNAs are among the most ancient genes and can be traced back to the putative RNAWorld. They are ubiquitous in all organisms, but a comparative survey of genomic organi-zation is not available in the literature. Although the diversity of tRNA genes in eukaryoteshas been previously reported for 11 eukaryotic genomes, and a comparison of 50 genomes
v
from all three domains of life reveals domain-specific structural and functional features aswell as a suggestive diversity of tRNA function, less is known about their specific configu-ration. Therefore, in chapter 2, we present a computational survey to gain insight into thegenomic locations of tRNAs on a genome wide scale. The main contributions are basedon the following publications: Genomic Organization of Eukaryotic tRNAs. Bermudez-Santana C.I., Stephan-Otto, C., Kirtsten, T. Engelhardt, J, Prohaska, S., Steigele, S. andStadler, P.F. 2010, BMC genomics. In press., Homology-Based Annotation of Non-coding
RNAs in the Genomes of Schistosoma mansoni and Schistosoma japonicum Copeland, C.,Marz, M., Dominic, R. D., Hertel, J., Brindley, P., Bermudez-Santana, C., Kehr, S.,Stephan, C., Stadler, P.F. BMC Genomics 2009, 10:464. and Comparative Analysis of
Non-Coding RNAs in Nematodes Tafer, H., Rose, D., Marz, M., Hertel, J., Bartschat,S., Kehr, S., Otto, W., Donath, A., Tanzer, A., Bermudez-Santana, C., Gruber, A.,Juhling, F., Engelhardt, J., Busch, A., Hiller, M., Stadler, P. Dieterich, C. 2010. Submittedto Genome Consortium.
Recent findings from transcriptome data analysis regarding the processing of tRNA-derived small RNAs presented the opportunity to undertake a detailed comparison of plau-sible patterns of tRNAs based on the analysis of deep sequencing libraries. Since recentstudies have revealed roles for tRNAs as plausible players in other diverse aspects of cellu-lar biology, we present in chapter 3 a computational survey to identify and classify threemain classes of ncRNAs from a human brain library. This chapter is based on the followingpublications: Identification and Classification of Small RNAs in Transcriptome Sequence
Data. Langenberger, D., Bermudez-Santana, C.I., Stadler, P.F., Hoffmann, S. Pac SympBiocomput. 2010:80-7 and Evidence for Human microRNA-Offset RNAs in Small RNA Se-
quencing Data. Langenberger, D., Bermudez-Santana, C., Hertel, J., Khaitovich, P.,Hoffmann, S., Stadler, P.F. Bioinformatics. 2009 Sep 15;25(18):2298-301.
Finally, we extended our survey to analyze and classify patterns of small RNA derivedfrom tRNA families. We have developed a new approach based on the classification oftRNA-short-read-block patterns from small RNA libraries from Bos taurus, Caenorhabditis
elegans, Canis familiaris, Drosophila melanogaster, Gallus gallus, Homo sapiens, Macaca
mulatta, Mus musculus and Rattus norvegicus. This study will be presented in the Four-teenth Conference on Research in Computational Molecular Biology. Searching tRNA pro-
cessing patterns in transcriptome sequencing data. Bermudez-Santana, C.I., Langen-berger, D., Hoffmann, S. Stadler, P.F. RECOMB. 2010. August, Lisbon, Portugal.
In summary, these chapters include findings of three novel aspects of tRNA biology:genome organization, preliminary transcriptome data analysis, and the classification of anovel class of tRNA-derived small RNAs from transcriptome data. In general, this surveyconcluded that the genomic organization of tRNA is characterized by complex, lineage-specific patterns with extensive variability that is in striking contrast to the extreme levelsof sequence-conservation in the tRNA genes themselves. Our comprehensive analysis ofeukaryotic tRNA gene distributions provides a basis for further studies into the interplayof tRNA gene arrangements and genome organization in general. This tRNA processingsurvey illustrated that patterns are generally conserved across species but that some super-families are outliers. The analysis suggests that every tRNA has a specific pattern and thusundergoes a characteristic maturation. The mechanism underlying the processing of thesetRNA shreds remains to be clarified, as do any related functional implications.
vi
Abstract
Surprisingly little is known about the organization and distribution of tRNAs and tRNA-related sequences on a genome-wide scale. While tRNA complements are usually reportedin passing as part of genome annotation efforts, and peculiar features such as the tan-dem arrangements of tRNAs in Entamoeba histolytica have been described in some detail,comparative studies are rare. We therefore set out to systematically survey the genomicarrangement of tRNAs in a wide range of eukaryotes to identify common patterns andtaxon-specific peculiarities. We found that tRNA complements evolve rapidly and thattRNA locations are subject to rapid turnover. At the phylum level, distributions of tRNAnumbers are very broad, with standard deviations on the order of the mean. Even withinfairly closely related species, we observe dramatic changes in local organization. Consistentwith this variability, syntenic conservation of tRNAs is also poor in general, with turn-overrates comparable to those of unconstrained sequence elements. We conclude that thegenomic organization of tRNAs shows complex, lineage-specific patterns characterized byextensive variability, and that this variability is in striking contrast to the extreme levels ofsequence-conservation of the tRNA genes themselves. Our comprehensive analysis of eu-karoyotic tRNA distributions provides a basis for further studies into the interplay betweentRNA gene arrangements and genome organization in general.
Secondly, we focused on the investigation of small non-coding RNAs (ncRNAs) fromwhole transcriptome data. Since ncRNAs constitute a significant part of the transcriptome,we explore this data to detect and classify patterns derived from transcriptome-associatedloci. We selected three distinct ncRNA classes: microRNAs, snoRNAs and tRNAs, all ofwhich undergo maturation processes that lead to the production of shorter RNAs. Aftermapping the sequences to the reference genome, specific patterns of short reads were ob-served. These read patterns appeared to reflect RNA processing and, if so, should specifythe RNA transcripts from which they are derived. In order to investigate whether the shortread patterns carry information on the particular ncRNA class from which they orginate, weperformed a random forest classification on the three distinct ncRNA classes listed above.Then, after exploring the potential classification of general groups of ncRNAs, we focusedon the identification of small RNA fragments derived from tRNAs. After mapping tran-scriptome sequence data to reference genomes, we searched for specific short read patternsreflecting tRNA processing. In this context, we devised a common tRNA coordinate systembased on conservation and secondary structure information that allows vector representationof processing products and thus comparison of different tRNAs by anticodon and aminoacid. We report patterns of tRNA processing that seem to be conserved across species.Though the mechanisms and functional implications underlying these patterns remain tobe clarified, our analysis suggests that each type of tRNA exhibits a specific pattern andthus appears to undergo a characteristic maturation process.
vii


Contents
1 tRNA world and its link to RNAi pathway 31.1 tRNA biology . . . . . . . . . . . . . . . . . . . . . . . . . . . . . . . . . 31.2 Linking transcriptome analysis and HTS technology . . . . . . . . . . . . 71.3 Computational identification of tRNA candidates . . . . . . . . . . . . . . 12
2 Genomic Organization of Eukaryotic tRNAs 152.1 Introduction . . . . . . . . . . . . . . . . . . . . . . . . . . . . . . . . . 152.2 Methodology . . . . . . . . . . . . . . . . . . . . . . . . . . . . . . . . . 172.3 Results and Discusions . . . . . . . . . . . . . . . . . . . . . . . . . . . . 202.4 Conclusions . . . . . . . . . . . . . . . . . . . . . . . . . . . . . . . . . . 32
3 non-coding RNA identification from transcriptome data 353.1 Introduction . . . . . . . . . . . . . . . . . . . . . . . . . . . . . . . . . 353.2 Methodology . . . . . . . . . . . . . . . . . . . . . . . . . . . . . . . . . 363.3 Results . . . . . . . . . . . . . . . . . . . . . . . . . . . . . . . . . . . . 403.4 Discussion . . . . . . . . . . . . . . . . . . . . . . . . . . . . . . . . . . 503.5 Conclusions . . . . . . . . . . . . . . . . . . . . . . . . . . . . . . . . . . 52
4 Computational analysis of tRNA-derived small RNAs 534.1 Introduction . . . . . . . . . . . . . . . . . . . . . . . . . . . . . . . . . 534.2 Methodology . . . . . . . . . . . . . . . . . . . . . . . . . . . . . . . . . 544.3 Results . . . . . . . . . . . . . . . . . . . . . . . . . . . . . . . . . . . . 584.4 Discussion . . . . . . . . . . . . . . . . . . . . . . . . . . . . . . . . . . 634.5 Conclusions . . . . . . . . . . . . . . . . . . . . . . . . . . . . . . . . . . 67
5 Conclusions and outlook 685.1 Conclusions . . . . . . . . . . . . . . . . . . . . . . . . . . . . . . . . . . 685.2 Outlook . . . . . . . . . . . . . . . . . . . . . . . . . . . . . . . . . . . 69
List of Figures 75
List of Tables 76
Bibliography 76
Curriculum Vitae 91
1

CONTENTS
2
Chapter 1
tRNA world and its link to RNAipathway
1.1 tRNA biology
RNAs have been found to participate in an ever-increasing number of pathways of cellularfunctionality. It is well accepted that most RNA function relies on specific patterns of basepairing and molecular interactions within a single RNA molecule or among sets of interact-ing molecules, either RNA-RNA, RNA-protein or RNA-cofactors. However, RNA structurecan be considered at a number of different levels. Structured RNA can achieve its functionat the level of single-stranded ribonucleic sequences (small RNAs or long RNAs), patternsof double-helical stretches interspersed with loops (RNA secondary structure), or complexinteractions between secondary structure elements forming three-dimensional functionalunits (tertiary structure). Functional RNA molecules (tRNAs, rRNAs, snoRNAs, microR-NAs, etc.) usually have characteristic spatial structures [101]. During the last decade, bothexperimental and computational research approaches based on these structures have shownthat many important aspects of cell biology are dependent on structured RNAs. TransferRNAs (tRNAs) are among the most ancient of RNA genes. They can be traced back tothe putative RNA World [54], before the separation of the three Domains of Life. There isclear evidence, furthermore, that all tRNA genes are homologs, deriving from an ancestral“proto-tRNA” [42], which in turn may have emerged from even smaller components, seee.g. [41, 147, 33, 51, 34]. tRNAs are essential molecules for protein biosynthesis that cou-ple specific amino acids with corresponding codons. Thus, tRNA functions as an adaptermolecule that converts the genetic information stored in the genomic nucleotide sequenceinto amino acid sequences [129]. This process is achieved through molecular interactionbetween tRNA and aminoacyl-tRNA synthetases (aaRSs). This interaction assures trans-lation fidelity through accurate recognition of aaRSs and discrimination between cognateand non-cognate tRNAs by aaRSs. Recognition motifs, structural features required fortRNA aminoacylation by aaRSs, play a major role in maintaining tRNA amino acid speci-ficity [74, 29, 152, 73]. Later, recognition motifs are also required for highly coordinatedinteractions with the ribosome.
3
CHAPTER 1. TRNA WORLD AND ITS LINK TO RNAI PATHWAY
7
6
5
4
3
2
1
66
67
68
69
70
71
72
73
74
75
76
65 64 63 62 61
49 50 51 52 53
60 59
58
54 55
56
57
8
9
10111213
25242322
14
1516
17
17A
18
21
20B20A
20
19
26
27
28
29
30
31
43
42
41
40
39
32
33
3435
36
37
38
44
45
46
47
47A
47B
47C
47D47E
47F
47G
47H
47I
47J
47K
47L
47M
47N
47O
47P
48
D loop
I
Anticodon loop
b
c
5’P
II
3’OH
Acceptor stem
a
d
e
III
Variable loop
IV
TΨC loop
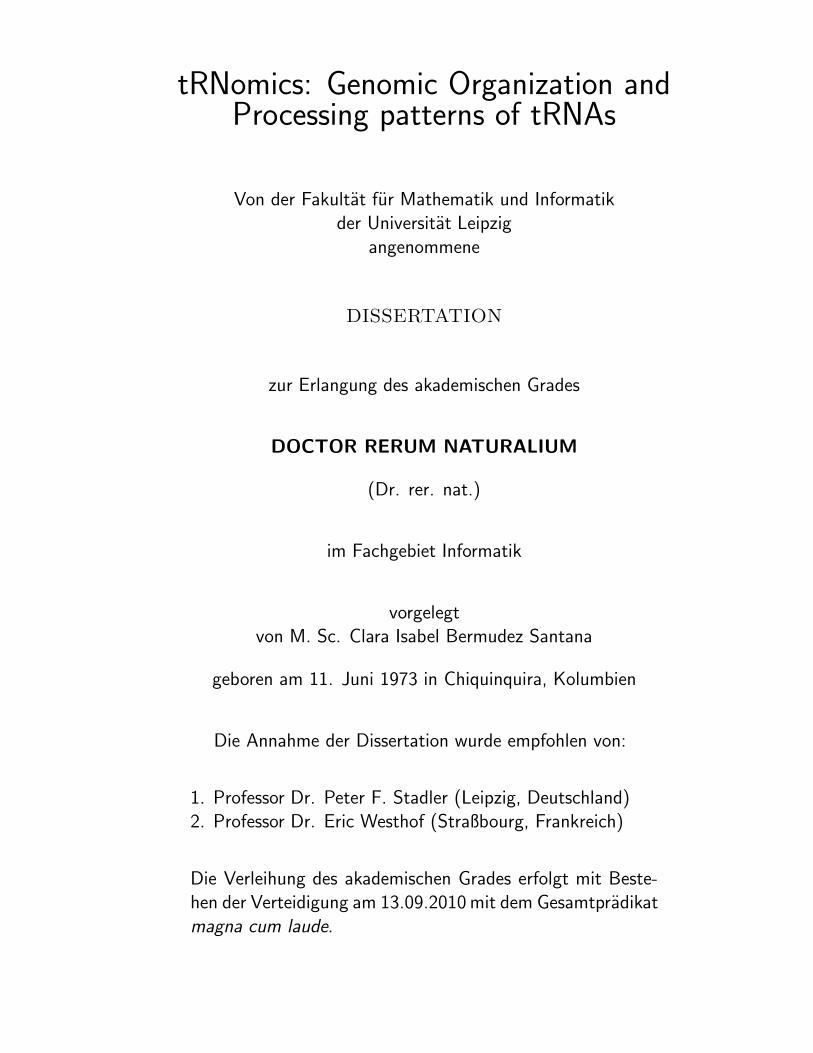
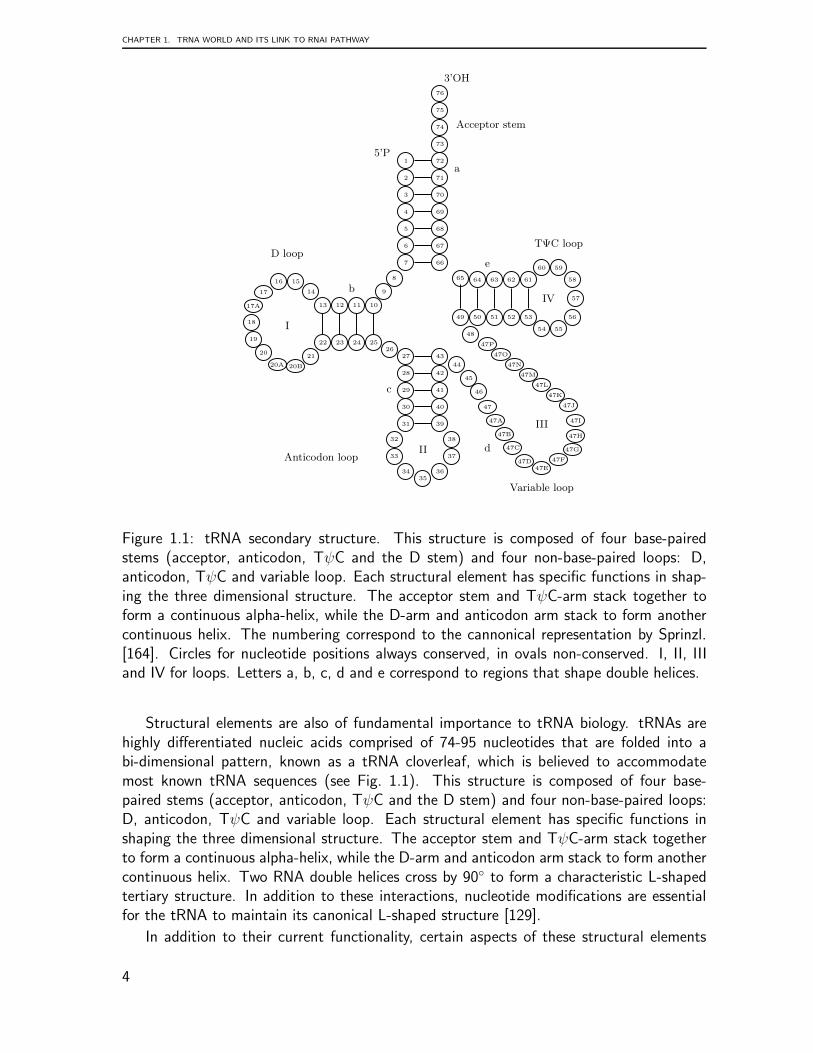
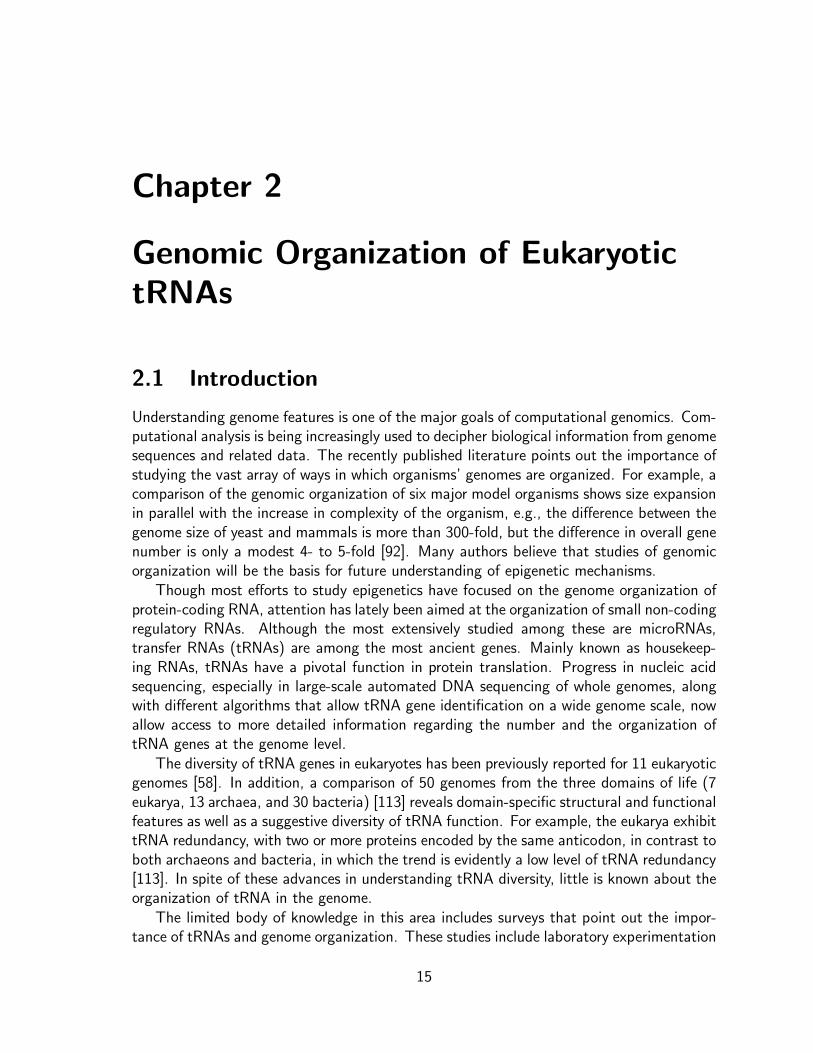
Figure 1.1: tRNA secondary structure. This structure is composed of four base-pairedstems (acceptor, anticodon, TψC and the D stem) and four non-base-paired loops: D,anticodon, TψC and variable loop. Each structural element has specific functions in shap-ing the three dimensional structure. The acceptor stem and TψC-arm stack together toform a continuous alpha-helix, while the D-arm and anticodon arm stack to form anothercontinuous helix. The numbering correspond to the cannonical representation by Sprinzl.[164]. Circles for nucleotide positions always conserved, in ovals non-conserved. I, II, IIIand IV for loops. Letters a, b, c, d and e correspond to regions that shape double helices.
Structural elements are also of fundamental importance to tRNA biology. tRNAs arehighly differentiated nucleic acids comprised of 74-95 nucleotides that are folded into abi-dimensional pattern, known as a tRNA cloverleaf, which is believed to accommodatemost known tRNA sequences (see Fig. 1.1). This structure is composed of four base-paired stems (acceptor, anticodon, TψC and the D stem) and four non-base-paired loops:D, anticodon, TψC and variable loop. Each structural element has specific functions inshaping the three dimensional structure. The acceptor stem and TψC-arm stack togetherto form a continuous alpha-helix, while the D-arm and anticodon arm stack to form anothercontinuous helix. Two RNA double helices cross by 90◦ to form a characteristic L-shapedtertiary structure. In addition to these interactions, nucleotide modifications are essentialfor the tRNA to maintain its canonical L-shaped structure [129].
In addition to their current functionality, certain aspects of these structural elements
4
1.1. TRNA BIOLOGY
point to one of the more surprising steps in the origin, diversification and maintenance of life.The acceptor stem includes the 5’ and 3’ ends of the tRNA and the 3’ end harbors a 3’CCAmotive that is aminoacylated with a specific amino acid by cognate aaRSs. The anticodonstem harbors the anticodon loop where the anticodon triplet is located. This triplet, throughthe mediation of the ribosome and other enzymes, facilitates subsequent decoding of thegenetic code by inducing binding of the tRNA to its complementary anticodon sequenceson the mRNA [74]. This deciphering of the primary genetic code establishes the crucialrole of tRNA structure in the decoding of genetic information [74]. However, the existenceof a second genetic code, written into the structure of the tRNA and the aaRSs, has alsobeen widely documented. This code presumably recognizes determinants of tRNA identityhidden in a highly conserved and compact common structure with L shaped architecture [74,29]. Many efforts have been made to characterize the interaction between this sequence-structure and aminoacylation steps [152]. Although the diversity and conservation of thetRNA world is well documented [142], several fundamental biological questions remain open.These include questions regarding aspects of tRNA identity, its role in the evolution of thegenetic code, and its role in nucleotide modifications, as well as the effect of structuraldeviation of tRNA on aminoacylation [60] [73].
CCA
CCA
RNase P
RNase Z
CCA enzyme
precursor tRNA mature tRNA
modification
D
Gm
LT
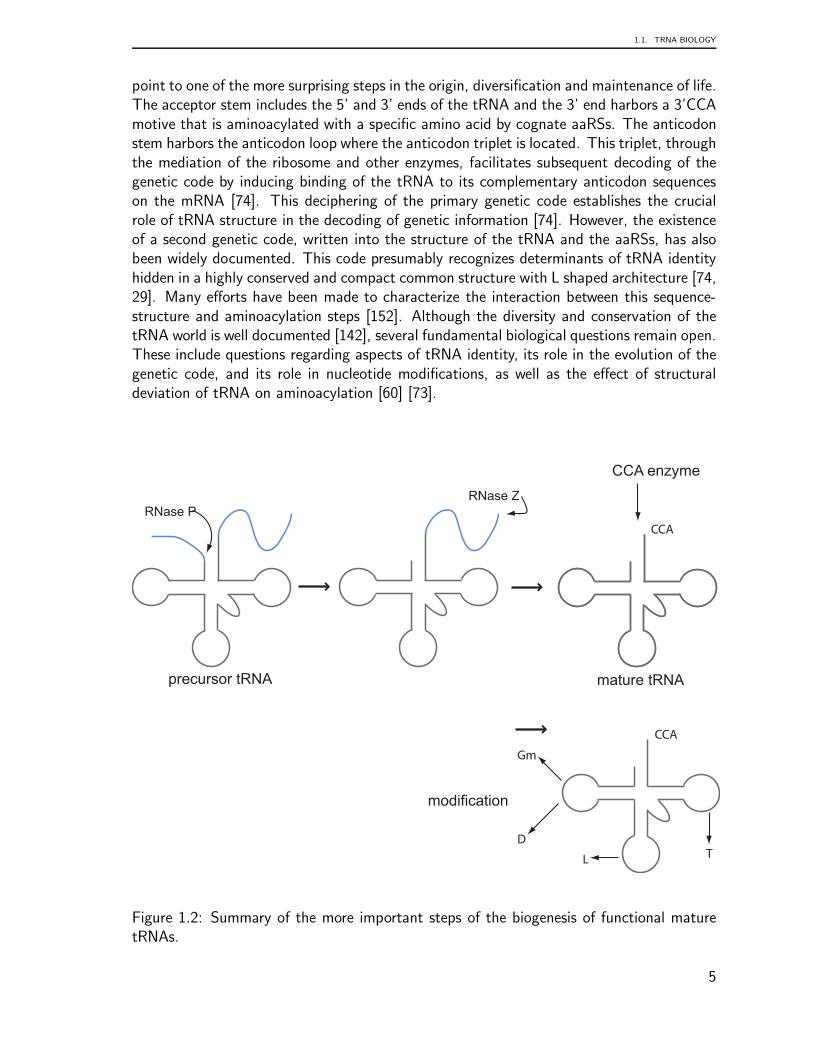
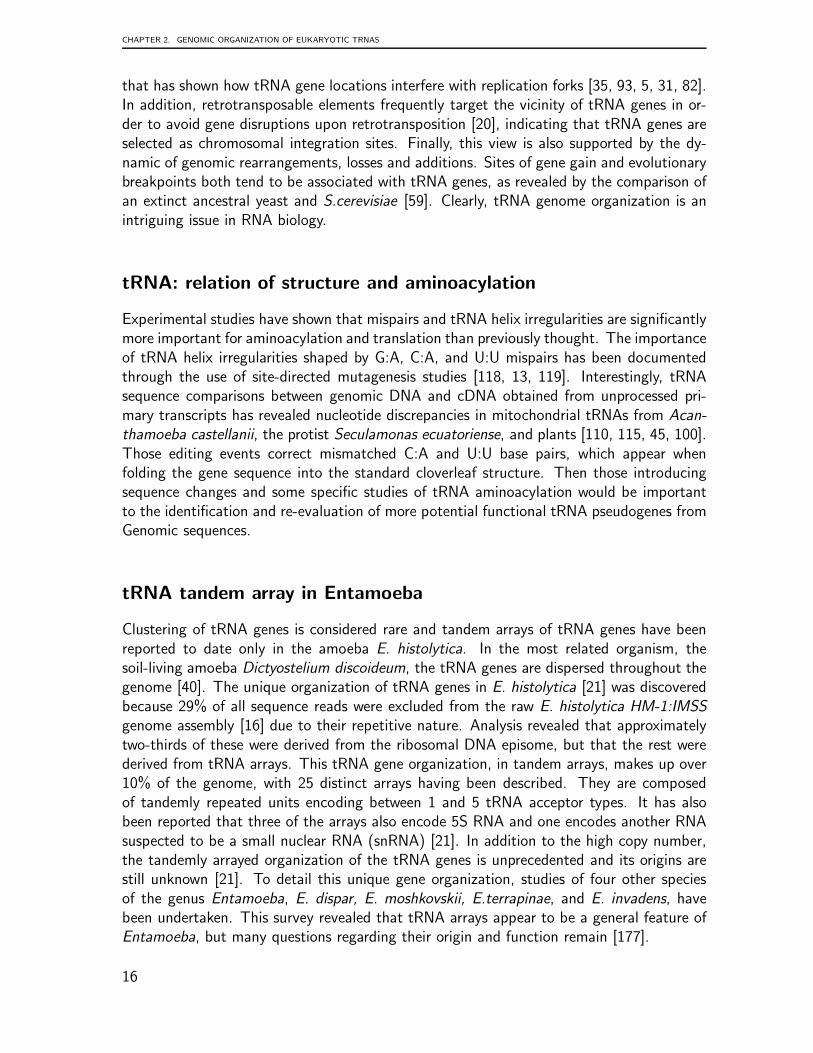
Figure 1.2: Summary of the more important steps of the biogenesis of functional maturetRNAs.
5
CHAPTER 1. TRNA WORLD AND ITS LINK TO RNAI PATHWAY
The biogenesis of functional mature tRNAs is an amazingly complicated process [189].The tRNA is first transcribed by RNA polymerase III (in eukaryotes) as a precursor with5’ leader and 3’ trailer extensions [129]. Thus, tRNA transcripts must be processed intotheir standard length, but they then must also be posttranscriptionally modified. Threemain steps lead their maturation: (1) removal of the 5’ leader and 3’ trailer extensions, (2)modification of some nucleic bases, and (3) addition of CCA to their 3’ ends. For the subsetof intronic tRNAs, an extra step, the splicing out of an intron (intervening sequence), isalso required.
The complexity of tRNA maturation requires a chain of interactions of diverse proteins.The La protein autoantigen, which functions in the earliest stages of the biogenesis ofmany noncoding RNAs [25], is the first protein in this chain. This phosphoprotein formsa complex La-pre-tRNA that protects the pre-tRNA 3’ end from degradation and assistsin correct folding of certain pre-tRNAs. It is also the substrate of the ribonucleoproteinenzyme RNase P, which removes the 5’ leader sequence through a single endonucleolyticcleavage [25].
Processing of the 3’ end is more complicated. In E. coli, the 3’ end CCA is encodedby its tRNA complement. RNase E carries out the first step of tRNA maturation throughcleavage at positions usually a few nucleotides downstream of the 3’ end of the tRNA, eithertogether with or after RNase P action. Then, many other exoribonucleases, mainly RNase T,PH, D, II, etc., shorten the trailer. If the exonucleases trim the trailer sequence beyond theamino acid attachment CCA sequence, a template-independent RNA polymerase, known asCCA-adding enzyme, repairs the CCA terminus [129]. RNase Z endonucleolytically cleavesthe sequence 5’ of the CCA sequence, and then the CCA terminus is synthesized de novoby CCA-adding enzyme. In eukaryotes, RNase Z cleaves after discriminator nucleotides intRNA precursors that are generally CCA-less. The addition of CCA to eukaryotic CCA-lesstRNAs is catalyzed by tRNA nucleotidyl transferase [107].
In a third universal step, maturation of tRNAs is accomplished by a set of enzymesthat act on multiple tRNA substrates, catalyzing the same base modification at a particularposition, or a defined set of positions [141]. tRNA modifications are divided into two maincategories. Modifications localized in the tRNA core region (D- and TψC) that contributeto the stabilization of the L-shaped tertiary structure and modifications occurring withinthe anticodon loop have the dual functions of precise codon pairing on the one hand andaccurate recognition by the cognate aminoacyl-tRNA synthetases on the other. [129]. SeeFig. 1.2. However, alterations to the mechanisms that assure tRNA structural stabilityand the universality of tRNA modifications, which are normally extensively and extremelystable, are also well documented [18, 25, 129]. Some tRNAs lacking specific modificationsare subject to degradation pathways [141] and to rapid tRNA decay.
Besides their primary ancestral function in translation, tRNAs appear to have acquiredseveral additional modes of employment throughout evolution. Several recent studies, forinstance, have reported tRNA-derived small RNAs in different Eukaryotic clades [106, 154,19, 23, 98], which at least in part appear to be utilized in the RNAi pathway. Furthermore,tRNA genes are a prolific source of repetitive elements (SINEs) [167], and of tRNA-derivedsmall RNAs such as the small brain-specific non-messenger RNA BC1 RNA [148, 80] andother SINE-derived ncRNAs [132].
Multiple copies of functional tRNA genes, numerous pseudogenes, and tRNA-derived
6
1.2. LINKING TRANSCRIPTOME ANALYSIS AND HTS TECHNOLOGY
repeats are characteristic byproducts of tRNA evolution throughout the Eukarya [49]. Ingeneral, tRNA genes appear to evolve rapidly. In E. coli, the rate of tRNA gene duplica-tion/deletion events is on the order of one per million years [187], and a recent analysisof schistosome genomes revealed striking differences in the tRNA complement between theclosely related platyhelminths S. mansoni and S. japonicum [26].
Although the sequence and structural evolution of tRNAs themselves has received quitea bit of attention [70, 58, 113, 114], much less is known about the genomic organization oftRNA genes. Recent evidence, however, indicates that tRNA genes play a role in eukaryoticgenome organization [120], e.g. by acting as barriers that separate chromatin domains. Intrypanosomes, for example, tRNA genes mostly appear at the boundaries of transcriptionalunits and may be involved in the deposition of special nucleosome variants in these regions[173]. Furthermore, there is a link between tRNA loci, in particular clusters of tRNA genes,and chromosomal instability [35, 93, 5, 31, 82]. A recent study showed that tRNA genesmay act as barriers to the progression of the DNA replication fork [120], providing a possiblemechanism for the formation of genomic fragile sites. The genomic evolution of tRNA genesthus may be linked to the evolution of genome organization. Nevertheless, reports on clade-specific features, such as the strong increase in tRNA introns seen in Thermoproteales [166],are rare.
A peculiar feature of tRNA gene organization is the pattern of tRNA tandem repeats,which so far has been reported only in the protistan parasite Entamoeba histolytica [177, 21].MicroRNAs derived from a precursor in which an imperfectly matched inverted repeat formsa partly double-stranded region, as observed in Chlamydomonas [123, 192], furthermore,suggests that head-to-head or tail-to-tail arrangements of tRNA genes might be an evolu-tionary source of small RNAs.
1.2 Linking transcriptome analysis and HTS technology
The transcriptome is defined as the complement of all RNA molecules, including mRNA,rRNA, tRNA, miRNA, snoRNA, snRNAs, and many other types of non-coding RNA, tran-scribed in one cell or a population of cells. More formal definitions include quantificationof this transcribed material and its relation to differential tissue expression [185]. Efforts tounderstand the transcriptome have led to the identification of new regulatory elements andthe deciphering of key regulatory elements in developmental and disease biology as well dra-matically improved sequencing techniques. Since the initial work of Sanger [150, 149], theonly sequencing method used 30 years ago, biology has benefited from huge improvementsin genome analysis affecting diverse research areas and applied fields. Over the years, theincrease in throughput demand for DNA sequencing has driven the development of next-generation sequencing methods that have in turn led to the development of diverse newfields within biology. Next-generation sequencing technologies are transforming the fieldof genomic science and indeed the field of biology in general [153]. Hundreds of papershave been published in these new fields, ranging from quantitative data on specific bio-logical functions to characterization of the full genetic potential for the sustainable use ofecosystems.
However, the goal of deciphering whole organisms’ genomes necessitated a dramatic
7
CHAPTER 1. TRNA WORLD AND ITS LINK TO RNAI PATHWAY
increase in DNA sequencing throughput ability, and this requirement was met through theimpact of automated capillary electrophoresis. A major revolution in sequencing appeared in2005 with the publication of shotgun sequencing and de novo assembly of the Mycoplasma
genitalium genome using open micro-fabricated high density picoliter reactors [116]. Thishighly parallel sequencing system, developed by 454 Life Sciences, presented biologists witha new technology to greatly reduce reaction volume requirements. Then, also in 2005,George Church lab reported the development of the multiplex polony sequencing protocol,used for the first time to resequence an evolved strain of Escherichia coli with an accuracyof less than one error per million consensus bases [155]. Some other biological studies utilizemassive parallel sequencing systems like the Solexa 1G sequencing technology, developedto map histone modifications in the human genome [11]. To map protein-DNA interactionsacross entire mammalian genomes, another group developed the large-scale chromatin im-munoprecipitation assay (ChIPSeq), based on direct ultrahigh-throughput DNA sequencing[83]. RNA sequencing (RNA-seq), a revolutionary tool for deciphering the complexity of cellbiology expression, combines HTS technology and quantitative measurement of transcriptsand their isoforms (for a review see [185]). The RNA-seq approach has enabled the mappingand quantification of mammalian transcriptomes [124], characterization of the transcrip-tomes of stem cells, profiling of the HeLa S3 transcriptome [22, 117], understanding ofthe transcriptional landscape of the yeast genome [127], development of highly integratedsingle-base resolution maps of the epigenome in Arabidopsis [109], transcriptome-guidedcharacterization of genomic rearrangements in a breast cancer cell line [191], and charac-terization of transcriptome-based aspects of many other human diseases. In addition, thistool has enabled the emergence of one of the major areas for modern genetics: the studyof alternative promoters used for transcript production [165].
Mapping problem By the time of the appearance of the new sequencing methods, mostcriticisms were mainly focused on the size of the read product; first read sizes rarely exceeded25 bp. This was followed by skepticism founded on the needs to handle large volumes ofdata, and is being addressed by the development of new sequencing hardware and compu-tational models, still an ongoing process. Thus, biologists and computer scientists continueto face new challenges to transform biology. In the words of Schuster [153], “this goal will
only be achieved through the development of structurally, biochemically, and biophysically
detailed computational models based directly on experimental data. Once developed, these
models can be simulated, analyzed, and understood through application of modern engi-
neering and computational approaches, and the knowledge gained from these analyses can
be applied to the design of additional experiments”. With the availability of more non-Sanger sequencing methods, it is now becoming possible to assess both next-generationsequencing accuracy and the curation of the vast majority of Sanger-based referenced se-quences in the public databases [153]. This will allow exhaustive exploration of the vastinformation derived from transcriptome data and the development of new computationalapproaches.
Once the size of the reads produced by HTS increased to more than 400 bp, verydifferent error models were also faced for the new sequencing technology. For example inSolexa, the more frequent read-error types are mismatches, whereas those of 454’s GS FLXare insertions and delections [72].
8
1.2. LINKING TRANSCRIPTOME ANALYSIS AND HTS TECHNOLOGY
Later, demand for the development of new mapping methods was intensified, and newlyavailable methods are designed specifically to allow mismatch matching of short reads.Some of them only fill the necessities of specific technologies; for instances SOAP [104] andMaq [102] to map Solexa or SOliD reads, and longer reads cannot be mapped. SOAP canperform both ungapped and gapped alignments, and has special modules for the alignmentof pair-end small RNA and mRNA tag sequences. In Maq, furthermore, the problem ofone or two mutations or sequencing errors in a short read leading to its mapping to thewrong location is solved by keeping all of the reads that can be mapped and evaluating thelikelihood of incorrect positioning for each of them. With this approach, poor alignmentscan still be discarded later. Other software, such as [108], are based on extension of themultiple-spaced seeds method, in which different seeds are designed on different positionsof a read. The seeds designed only to address the issue of mismatches were demonstratedto also have very high sensitivity when indels are present. Finally, segemehl is one approachdealing simultaneously with insertions, deletions, and mismatches. This matching methoduses a variation of enhanced suffix arrays to allow a coherent treatment of these read errorsources through the modification of matching statistics in such a way that all of the errorsources are evaluated efficiently [72].
HTS and its importance to the study of the RNAi pathway The new DNA se-quencing technologies have significantly improved throughput and dramatically reducedcost compared with capillary-based electrophoresis systems [155] and have significantly in-fluenced today’s biology. On the other hand, though the main problem of HTS was solved,the new technologies have created new challenges for the study of the transcriptome, partic-ularly the small RNA fraction. As a consequence, a new abundant class of small noncodingRNAs was discovered. Thus, frontiers of knowledge have been expanded not only to in-crease our comprehension of expression and regulation, but also to allow the discovery of atiny world that re-evaluates our comprehension of cellular functionality in many respects.
In transcriptome analysis, much attention is currently focused on understanding the roleof alternative promoters in generating transcript diversity, both for protein-encoding RNAs(traditionally thought of as gene transcripts) and non-protein-encoding RNAs (ncRNAs).Whole-transcriptome analysis of many species and cell types reveals massive expression ofncRNAs. It is widely believed that ncRNAs act as regulators of transcription and trans-lation. Recent investigations of whole RNA cDNA libraries generated by high throughputsequencing (HTS) have shown that these libraries contain both primary and processed tran-scripts. Further, recent mapping of functional sequence elements in the human genome hascorroborated the cDNA-based finding that ncRNAs compose a significant portion of thetranscriptome. Finally, numerous studies have illustrated how some mutant RNAs can causedisease [134]. In response to these findings, comprehensive computational approaches areemerging to characterize the vast repertory of ncRNA expression.
One of the major impacts of HTS on transcriptome studies is the characterizationof RNA interference (RNAi). This system, based mainly on three classes of small RNAmolecules, microRNA (miRNA), small interfering RNA (siRNA) and piwiRNA (piRNA),was discovered in 1986 and 1990 through observations of transcriptional inhibition by an-tisense RNA expressed in transgenic plants [38], and reports of unexpected outcomes inexperiments performed by plant scientists in the early 1990s [130]. Although the discov-
9
CHAPTER 1. TRNA WORLD AND ITS LINK TO RNAI PATHWAY
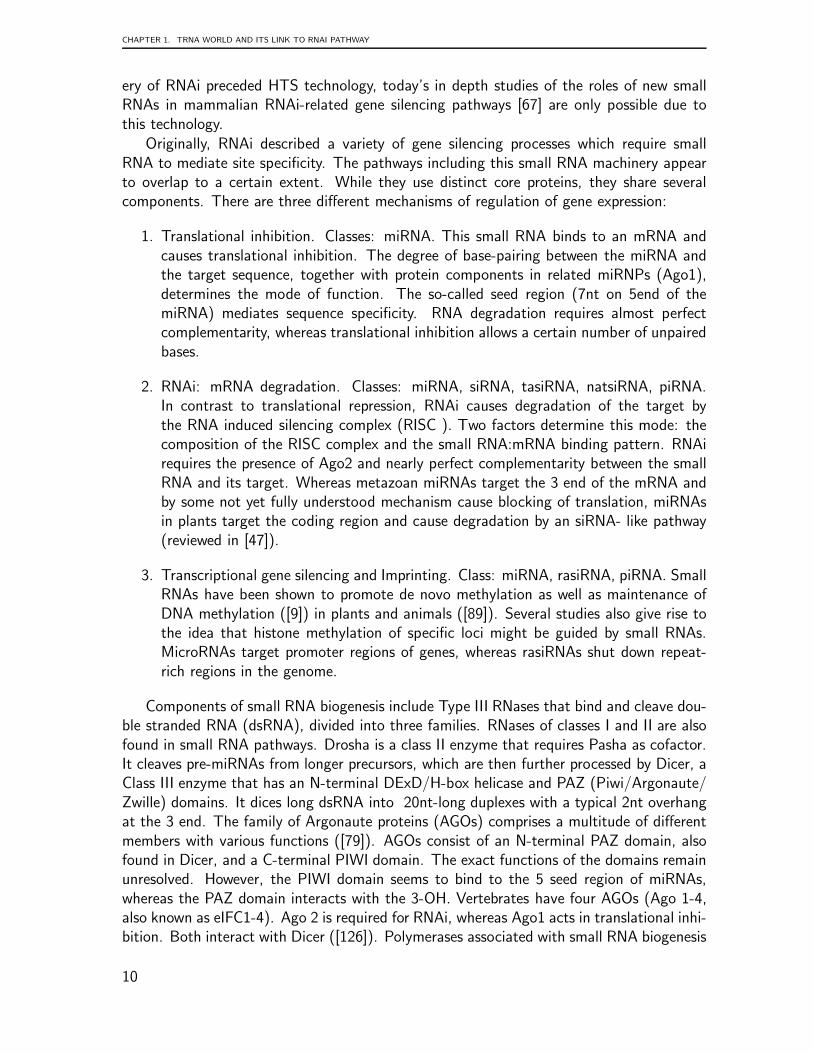
ery of RNAi preceded HTS technology, today’s in depth studies of the roles of new smallRNAs in mammalian RNAi-related gene silencing pathways [67] are only possible due tothis technology.
Originally, RNAi described a variety of gene silencing processes which require smallRNA to mediate site specificity. The pathways including this small RNA machinery appearto overlap to a certain extent. While they use distinct core proteins, they share severalcomponents. There are three different mechanisms of regulation of gene expression:
1. Translational inhibition. Classes: miRNA. This small RNA binds to an mRNA andcauses translational inhibition. The degree of base-pairing between the miRNA andthe target sequence, together with protein components in related miRNPs (Ago1),determines the mode of function. The so-called seed region (7nt on 5end of themiRNA) mediates sequence specificity. RNA degradation requires almost perfectcomplementarity, whereas translational inhibition allows a certain number of unpairedbases.
2. RNAi: mRNA degradation. Classes: miRNA, siRNA, tasiRNA, natsiRNA, piRNA.In contrast to translational repression, RNAi causes degradation of the target bythe RNA induced silencing complex (RISC ). Two factors determine this mode: thecomposition of the RISC complex and the small RNA:mRNA binding pattern. RNAirequires the presence of Ago2 and nearly perfect complementarity between the smallRNA and its target. Whereas metazoan miRNAs target the 3 end of the mRNA andby some not yet fully understood mechanism cause blocking of translation, miRNAsin plants target the coding region and cause degradation by an siRNA- like pathway(reviewed in [47]).
3. Transcriptional gene silencing and Imprinting. Class: miRNA, rasiRNA, piRNA. SmallRNAs have been shown to promote de novo methylation as well as maintenance ofDNA methylation ([9]) in plants and animals ([89]). Several studies also give rise tothe idea that histone methylation of specific loci might be guided by small RNAs.MicroRNAs target promoter regions of genes, whereas rasiRNAs shut down repeat-rich regions in the genome.
Components of small RNA biogenesis include Type III RNases that bind and cleave dou-ble stranded RNA (dsRNA), divided into three families. RNases of classes I and II are alsofound in small RNA pathways. Drosha is a class II enzyme that requires Pasha as cofactor.It cleaves pre-miRNAs from longer precursors, which are then further processed by Dicer, aClass III enzyme that has an N-terminal DExD/H-box helicase and PAZ (Piwi/Argonaute/Zwille) domains. It dices long dsRNA into 20nt-long duplexes with a typical 2nt overhangat the 3 end. The family of Argonaute proteins (AGOs) comprises a multitude of differentmembers with various functions ([79]). AGOs consist of an N-terminal PAZ domain, alsofound in Dicer, and a C-terminal PIWI domain. The exact functions of the domains remainunresolved. However, the PIWI domain seems to bind to the 5 seed region of miRNAs,whereas the PAZ domain interacts with the 3-OH. Vertebrates have four AGOs (Ago 1-4,also known as eIFC1-4). Ago 2 is required for RNAi, whereas Ago1 acts in translational inhi-bition. Both interact with Dicer ([126]). Polymerases associated with small RNA biogenesis
10
1.2. LINKING TRANSCRIPTOME ANALYSIS AND HTS TECHNOLOGY
include DNA polymerase II for miRNAs. Organisms with strong siRNA activity require an-other enzyme in order to multiply their response to parasitic RNAs. In plants, protozoans,and lower metazoans, RdRP (RNA dependent RNA polymerase) performs siRNA-primedsynthesis of dsRNA, which is then cleaved by RISC and Dicer homologs.
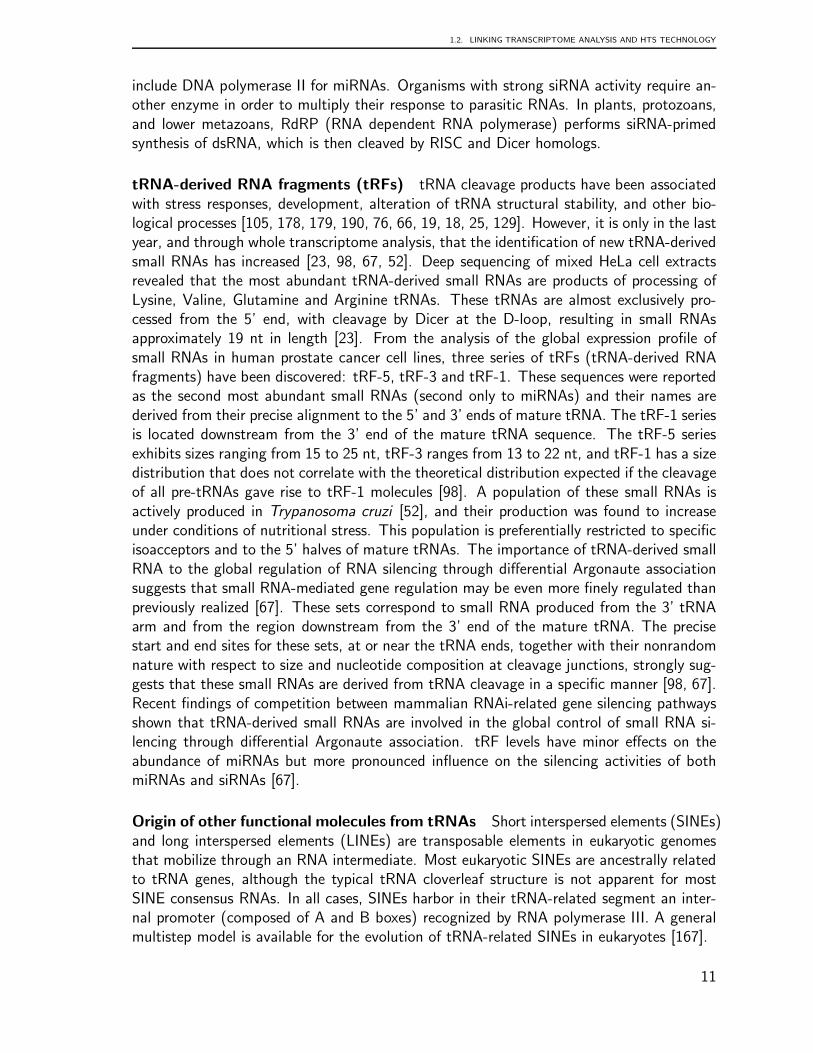
tRNA-derived RNA fragments (tRFs) tRNA cleavage products have been associatedwith stress responses, development, alteration of tRNA structural stability, and other bio-logical processes [105, 178, 179, 190, 76, 66, 19, 18, 25, 129]. However, it is only in the lastyear, and through whole transcriptome analysis, that the identification of new tRNA-derivedsmall RNAs has increased [23, 98, 67, 52]. Deep sequencing of mixed HeLa cell extractsrevealed that the most abundant tRNA-derived small RNAs are products of processing ofLysine, Valine, Glutamine and Arginine tRNAs. These tRNAs are almost exclusively pro-cessed from the 5’ end, with cleavage by Dicer at the D-loop, resulting in small RNAsapproximately 19 nt in length [23]. From the analysis of the global expression profile ofsmall RNAs in human prostate cancer cell lines, three series of tRFs (tRNA-derived RNAfragments) have been discovered: tRF-5, tRF-3 and tRF-1. These sequences were reportedas the second most abundant small RNAs (second only to miRNAs) and their names arederived from their precise alignment to the 5’ and 3’ ends of mature tRNA. The tRF-1 seriesis located downstream from the 3’ end of the mature tRNA sequence. The tRF-5 seriesexhibits sizes ranging from 15 to 25 nt, tRF-3 ranges from 13 to 22 nt, and tRF-1 has a sizedistribution that does not correlate with the theoretical distribution expected if the cleavageof all pre-tRNAs gave rise to tRF-1 molecules [98]. A population of these small RNAs isactively produced in Trypanosoma cruzi [52], and their production was found to increaseunder conditions of nutritional stress. This population is preferentially restricted to specificisoacceptors and to the 5’ halves of mature tRNAs. The importance of tRNA-derived smallRNA to the global regulation of RNA silencing through differential Argonaute associationsuggests that small RNA-mediated gene regulation may be even more finely regulated thanpreviously realized [67]. These sets correspond to small RNA produced from the 3’ tRNAarm and from the region downstream from the 3’ end of the mature tRNA. The precisestart and end sites for these sets, at or near the tRNA ends, together with their nonrandomnature with respect to size and nucleotide composition at cleavage junctions, strongly sug-gests that these small RNAs are derived from tRNA cleavage in a specific manner [98, 67].Recent findings of competition between mammalian RNAi-related gene silencing pathwaysshown that tRNA-derived small RNAs are involved in the global control of small RNA si-lencing through differential Argonaute association. tRF levels have minor effects on theabundance of miRNAs but more pronounced influence on the silencing activities of bothmiRNAs and siRNAs [67].
Origin of other functional molecules from tRNAs Short interspersed elements (SINEs)and long interspersed elements (LINEs) are transposable elements in eukaryotic genomesthat mobilize through an RNA intermediate. Most eukaryotic SINEs are ancestrally relatedto tRNA genes, although the typical tRNA cloverleaf structure is not apparent for mostSINE consensus RNAs. In all cases, SINEs harbor in their tRNA-related segment an inter-nal promoter (composed of A and B boxes) recognized by RNA polymerase III. A generalmultistep model is available for the evolution of tRNA-related SINEs in eukaryotes [167].
11
CHAPTER 1. TRNA WORLD AND ITS LINK TO RNAI PATHWAY
Another tRNA-derived functional molecule is the rodent BC1 RNA, a small brain-specificnon-messenger RNA. BC1 RNA is specifically transported into the dendrites of neuronalcells, where it is proposed to play a role in the regulation of translation near synapses[148]. A previous study demonstrated that the 5’ domain of BC1 RNA was derived fromAlanine tRNA. However, evidence indicates that changes accumulated during evolutionhave created an extended stem-loop that does not fold into the predicted canonical tRNAcloverleaf structure. BC1 RNA has been associated with fragile X syndrome (caused bythe functional absence of the fragile X mental retardation protein, FMRP). However, thespecific details of interactions between FMRP and BC1 RNA remain controversial, althoughBC1 RNA has been proposed to repress translation initiation at the level of 48S complexformation [148].
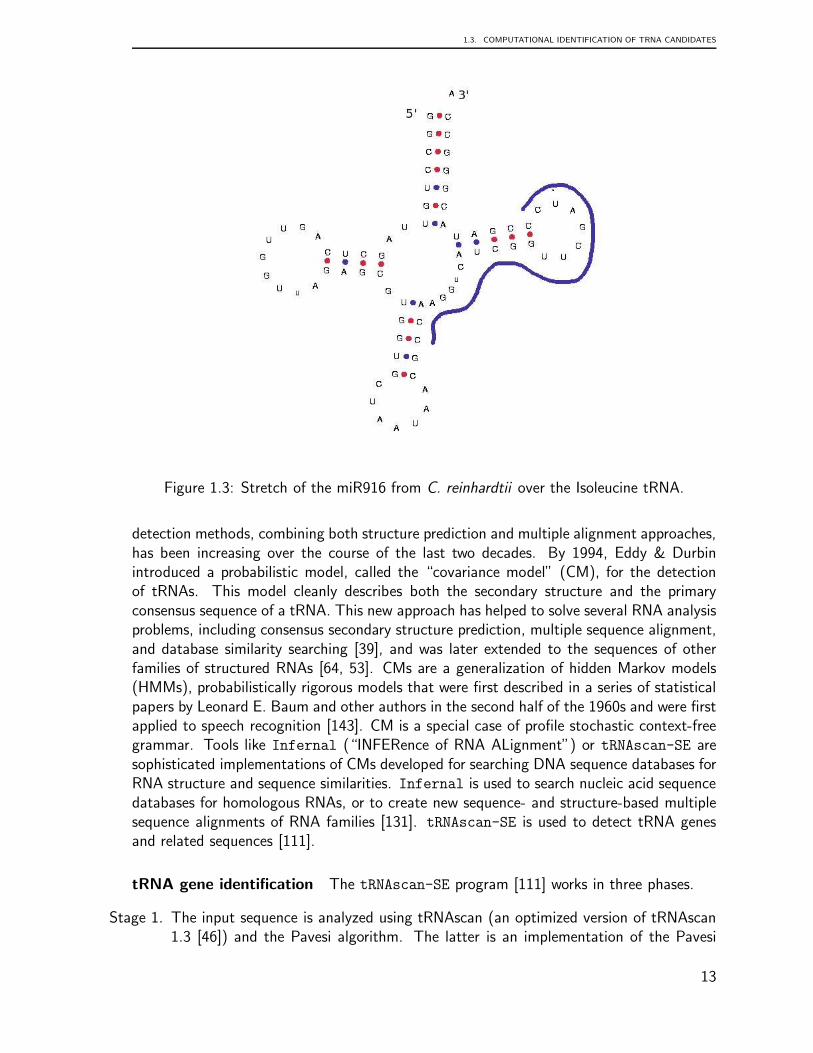
miR916 from Chlamydomonas reinhardtii Analysis of the transcriptome of the uni-cellular algae C. reinhardtii led to the discovery of the existence of miRNAs in unicellularorganisms [123, 192]. These studies showed that C. reinhardtii contains putative evolu-tionary precursors of miRNAs and species of siRNAs resembling those in higher plants,indicating that complex RNA-silencing systems evolved before multicellularity and were afeature of primitive eukaryotic cells [123, 192].
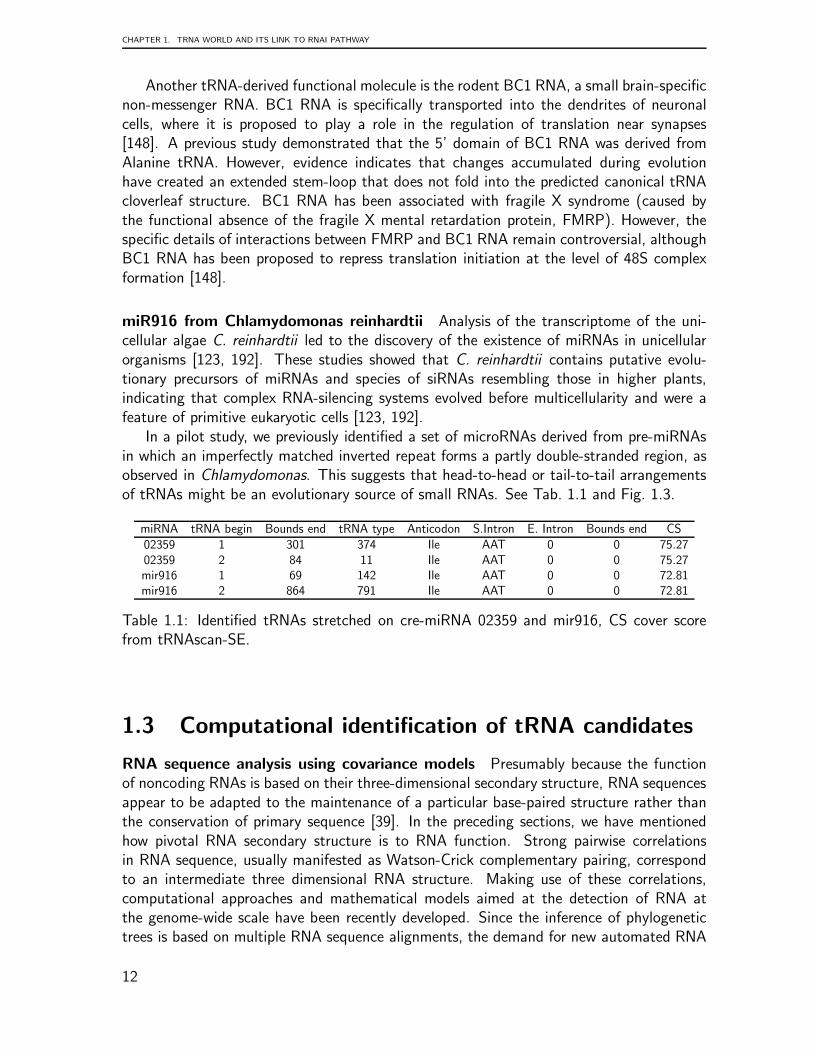
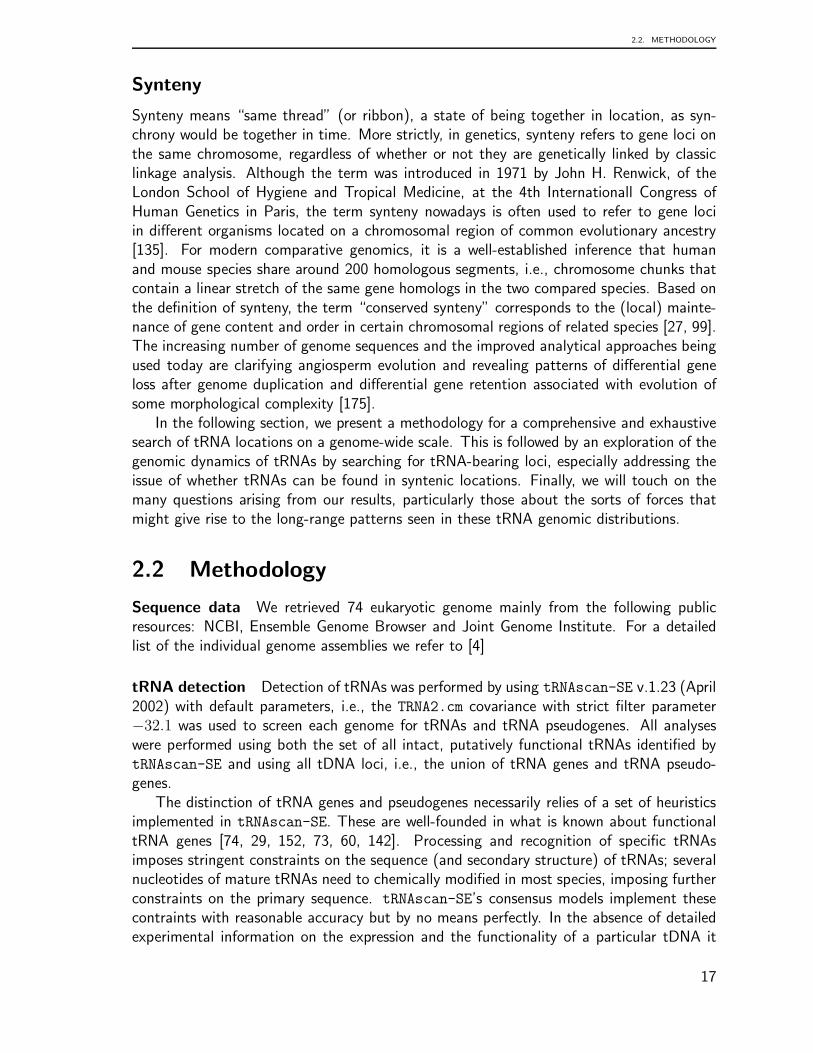
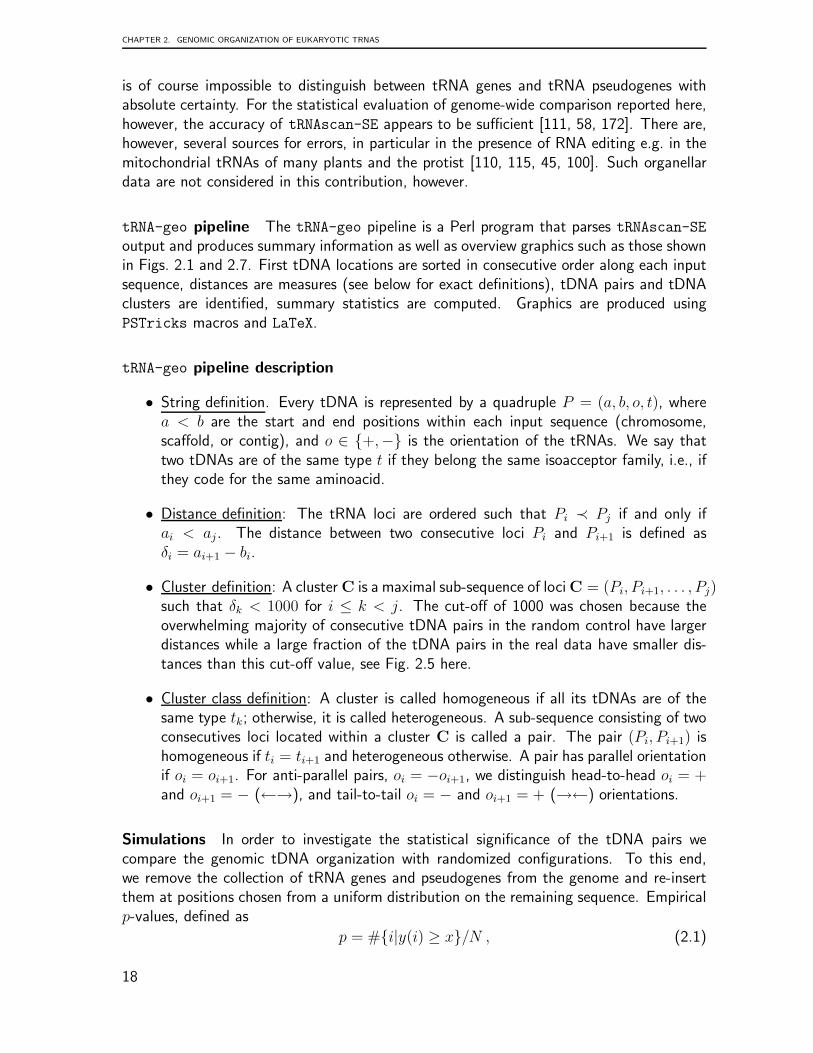
In a pilot study, we previously identified a set of microRNAs derived from pre-miRNAsin which an imperfectly matched inverted repeat forms a partly double-stranded region, asobserved in Chlamydomonas. This suggests that head-to-head or tail-to-tail arrangementsof tRNAs might be an evolutionary source of small RNAs. See Tab. 1.1 and Fig. 1.3.
miRNA tRNA begin Bounds end tRNA type Anticodon S.Intron E. Intron Bounds end CS02359 1 301 374 Ile AAT 0 0 75.2702359 2 84 11 Ile AAT 0 0 75.27mir916 1 69 142 Ile AAT 0 0 72.81mir916 2 864 791 Ile AAT 0 0 72.81
Table 1.1: Identified tRNAs stretched on cre-miRNA 02359 and mir916, CS cover scorefrom tRNAscan-SE.
1.3 Computational identification of tRNA candidates
RNA sequence analysis using covariance models Presumably because the functionof noncoding RNAs is based on their three-dimensional secondary structure, RNA sequencesappear to be adapted to the maintenance of a particular base-paired structure rather thanthe conservation of primary sequence [39]. In the preceding sections, we have mentionedhow pivotal RNA secondary structure is to RNA function. Strong pairwise correlationsin RNA sequence, usually manifested as Watson-Crick complementary pairing, correspondto an intermediate three dimensional RNA structure. Making use of these correlations,computational approaches and mathematical models aimed at the detection of RNA atthe genome-wide scale have been recently developed. Since the inference of phylogenetictrees is based on multiple RNA sequence alignments, the demand for new automated RNA
12
1.3. COMPUTATIONAL IDENTIFICATION OF TRNA CANDIDATES
Figure 1.3: Stretch of the miR916 from C. reinhardtii over the Isoleucine tRNA.
detection methods, combining both structure prediction and multiple alignment approaches,has been increasing over the course of the last two decades. By 1994, Eddy & Durbinintroduced a probabilistic model, called the “covariance model” (CM), for the detectionof tRNAs. This model cleanly describes both the secondary structure and the primaryconsensus sequence of a tRNA. This new approach has helped to solve several RNA analysisproblems, including consensus secondary structure prediction, multiple sequence alignment,and database similarity searching [39], and was later extended to the sequences of otherfamilies of structured RNAs [64, 53]. CMs are a generalization of hidden Markov models(HMMs), probabilistically rigorous models that were first described in a series of statisticalpapers by Leonard E. Baum and other authors in the second half of the 1960s and were firstapplied to speech recognition [143]. CM is a special case of profile stochastic context-freegrammar. Tools like Infernal (“INFERence of RNA ALignment”) or tRNAscan-SE aresophisticated implementations of CMs developed for searching DNA sequence databases forRNA structure and sequence similarities. Infernal is used to search nucleic acid sequencedatabases for homologous RNAs, or to create new sequence- and structure-based multiplesequence alignments of RNA families [131]. tRNAscan-SE is used to detect tRNA genesand related sequences [111].
tRNA gene identification The tRNAscan-SE program [111] works in three phases.
Stage 1. The input sequence is analyzed using tRNAscan (an optimized version of tRNAscan1.3 [46]) and the Pavesi algorithm. The latter is an implementation of the Pavesi
13

CHAPTER 1. TRNA WORLD AND ITS LINK TO RNAI PATHWAY
search algorithm [137] known as EufindtRNA. Results from both programs are thenmerged into one list of candidate tRNAs. The Pavesi algorithm is based on a modifiedversion of the general weight matrix procedure; their algorithm relies on the recog-nition of two intragenic control regions, known as A and B boxes, a transcriptiontermination signal, and the evaluation of the spacing between these elements [137].
Stage 2. tRNAscan-SE is used to extract the candidate subsequences and pass these segmentsto covels, a covariance model search program [39]. Covels applies a tRNA covariancemodel (TRNA2.cm) that was made through the structural alignment of 1415 tRNAsfrom the 1993 Sprinzl database [164] with some editions [39]. To improve intronprediction, intron sequences were manually inserted into the Sprinzl alignment for 38intron-containing tRNAs of known genomic sequence.
Stage 3. tRNAscan-SE takes predicted tRNAs that have been confirmed with covels, logs oddsscores of over 20.0 bits, trims the tRNA bounds to those predicted by covels, andruns the covariance model global structure alignment program coves [39] to get asecondary structure prediction. The tRNA isotype is predicted by identifying theanticodon within the coves secondary structure output. Introns are identified fromthis output as runs of five or more consecutive non-consensus nucleotides within theanticodon loop.
Stage 4. tRNAscan-SE uses heuristics to try to distinguish pseudogenes from true tRNAs,primarily on the basis of a lack of tRNA-like secondary structure. A second tRNAcovariance model (TRNA2ns.cm) was created from the same alignment, under theconstraint that no secondary structure is conserved (this model is effectively just asequence profile, or hidden Markov model). By subtracting a tRNA’s similarity score(similarity to the primary structure-only model) from that using the complete tRNAmodel, a secondary structure-only score is obtained. In Bayesian terms, this differencecan be viewed as the evidence for a complete tRNA model, as opposed to a sequence-only pseudogene model (lacking secondary structure). We observed that tRNAs withlow scores for either component of the total score were often pseudogenes. Thus,tRNAs are marked as likely pseudogenes if they have either a score of <10 bits for theprimary sequence component of the total score, or a score of <5bits for the secondarystructure component of the total score.
The sensitivity of tRNAscan-SE relies on the identification of 99-100% of transfer RNAgenes in a DNA genome while presenting less than one false positive per 15 gigabases. Theselectivity is measured by its ability to avoid misidentifying non-tRNA sequences as truetRNAs. In human genomes, the program’s false positive rate is zero except for the casesof tRNA-derived SINEs and tRNA pseudogenes [39].
14
Chapter 2
Genomic Organization of EukaryotictRNAs
2.1 Introduction
Understanding genome features is one of the major goals of computational genomics. Com-putational analysis is being increasingly used to decipher biological information from genomesequences and related data. The recently published literature points out the importance ofstudying the vast array of ways in which organisms’ genomes are organized. For example, acomparison of the genomic organization of six major model organisms shows size expansionin parallel with the increase in complexity of the organism, e.g., the difference between thegenome size of yeast and mammals is more than 300-fold, but the difference in overall genenumber is only a modest 4- to 5-fold [92]. Many authors believe that studies of genomicorganization will be the basis for future understanding of epigenetic mechanisms.
Though most efforts to study epigenetics have focused on the genome organization ofprotein-coding RNA, attention has lately been aimed at the organization of small non-codingregulatory RNAs. Although the most extensively studied among these are microRNAs,transfer RNAs (tRNAs) are among the most ancient genes. Mainly known as housekeep-ing RNAs, tRNAs have a pivotal function in protein translation. Progress in nucleic acidsequencing, especially in large-scale automated DNA sequencing of whole genomes, alongwith different algorithms that allow tRNA gene identification on a wide genome scale, nowallow access to more detailed information regarding the number and the organization oftRNA genes at the genome level.
The diversity of tRNA genes in eukaryotes has been previously reported for 11 eukaryoticgenomes [58]. In addition, a comparison of 50 genomes from the three domains of life (7eukarya, 13 archaea, and 30 bacteria) [113] reveals domain-specific structural and functionalfeatures as well as a suggestive diversity of tRNA function. For example, the eukarya exhibittRNA redundancy, with two or more proteins encoded by the same anticodon, in contrast toboth archaeons and bacteria, in which the trend is evidently a low level of tRNA redundancy[113]. In spite of these advances in understanding tRNA diversity, little is known about theorganization of tRNA in the genome.
The limited body of knowledge in this area includes surveys that point out the impor-tance of tRNAs and genome organization. These studies include laboratory experimentation
15
CHAPTER 2. GENOMIC ORGANIZATION OF EUKARYOTIC TRNAS
that has shown how tRNA gene locations interfere with replication forks [35, 93, 5, 31, 82].In addition, retrotransposable elements frequently target the vicinity of tRNA genes in or-der to avoid gene disruptions upon retrotransposition [20], indicating that tRNA genes areselected as chromosomal integration sites. Finally, this view is also supported by the dy-namic of genomic rearrangements, losses and additions. Sites of gene gain and evolutionarybreakpoints both tend to be associated with tRNA genes, as revealed by the comparison ofan extinct ancestral yeast and S.cerevisiae [59]. Clearly, tRNA genome organization is anintriguing issue in RNA biology.
tRNA: relation of structure and aminoacylation
Experimental studies have shown that mispairs and tRNA helix irregularities are significantlymore important for aminoacylation and translation than previously thought. The importanceof tRNA helix irregularities shaped by G:A, C:A, and U:U mispairs has been documentedthrough the use of site-directed mutagenesis studies [118, 13, 119]. Interestingly, tRNAsequence comparisons between genomic DNA and cDNA obtained from unprocessed pri-mary transcripts has revealed nucleotide discrepancies in mitochondrial tRNAs from Acan-
thamoeba castellanii, the protist Seculamonas ecuatoriense, and plants [110, 115, 45, 100].Those editing events correct mismatched C:A and U:U base pairs, which appear whenfolding the gene sequence into the standard cloverleaf structure. Then those introducingsequence changes and some specific studies of tRNA aminoacylation would be importantto the identification and re-evaluation of more potential functional tRNA pseudogenes fromGenomic sequences.
tRNA tandem array in Entamoeba
Clustering of tRNA genes is considered rare and tandem arrays of tRNA genes have beenreported to date only in the amoeba E. histolytica. In the most related organism, thesoil-living amoeba Dictyostelium discoideum, the tRNA genes are dispersed throughout thegenome [40]. The unique organization of tRNA genes in E. histolytica [21] was discoveredbecause 29% of all sequence reads were excluded from the raw E. histolytica HM-1:IMSS
genome assembly [16] due to their repetitive nature. Analysis revealed that approximatelytwo-thirds of these were derived from the ribosomal DNA episome, but that the rest werederived from tRNA arrays. This tRNA gene organization, in tandem arrays, makes up over10% of the genome, with 25 distinct arrays having been described. They are composedof tandemly repeated units encoding between 1 and 5 tRNA acceptor types. It has alsobeen reported that three of the arrays also encode 5S RNA and one encodes another RNAsuspected to be a small nuclear RNA (snRNA) [21]. In addition to the high copy number,the tandemly arrayed organization of the tRNA genes is unprecedented and its origins arestill unknown [21]. To detail this unique gene organization, studies of four other speciesof the genus Entamoeba, E. dispar, E. moshkovskii, E.terrapinae, and E. invadens, havebeen undertaken. This survey revealed that tRNA arrays appear to be a general feature ofEntamoeba, but many questions regarding their origin and function remain [177].
16
2.2. METHODOLOGY
Synteny
Synteny means “same thread” (or ribbon), a state of being together in location, as syn-chrony would be together in time. More strictly, in genetics, synteny refers to gene loci onthe same chromosome, regardless of whether or not they are genetically linked by classiclinkage analysis. Although the term was introduced in 1971 by John H. Renwick, of theLondon School of Hygiene and Tropical Medicine, at the 4th Internationall Congress ofHuman Genetics in Paris, the term synteny nowadays is often used to refer to gene lociin different organisms located on a chromosomal region of common evolutionary ancestry[135]. For modern comparative genomics, it is a well-established inference that humanand mouse species share around 200 homologous segments, i.e., chromosome chunks thatcontain a linear stretch of the same gene homologs in the two compared species. Based onthe definition of synteny, the term “conserved synteny” corresponds to the (local) mainte-nance of gene content and order in certain chromosomal regions of related species [27, 99].The increasing number of genome sequences and the improved analytical approaches beingused today are clarifying angiosperm evolution and revealing patterns of differential geneloss after genome duplication and differential gene retention associated with evolution ofsome morphological complexity [175].
In the following section, we present a methodology for a comprehensive and exhaustivesearch of tRNA locations on a genome-wide scale. This is followed by an exploration of thegenomic dynamics of tRNAs by searching for tRNA-bearing loci, especially addressing theissue of whether tRNAs can be found in syntenic locations. Finally, we will touch on themany questions arising from our results, particularly those about the sorts of forces thatmight give rise to the long-range patterns seen in these tRNA genomic distributions.
2.2 Methodology
Sequence data We retrieved 74 eukaryotic genome mainly from the following publicresources: NCBI, Ensemble Genome Browser and Joint Genome Institute. For a detailedlist of the individual genome assemblies we refer to [4]
tRNA detection Detection of tRNAs was performed by using tRNAscan-SE v.1.23 (April2002) with default parameters, i.e., the TRNA2.cm covariance with strict filter parameter−32.1 was used to screen each genome for tRNAs and tRNA pseudogenes. All analyseswere performed using both the set of all intact, putatively functional tRNAs identified bytRNAscan-SE and using all tDNA loci, i.e., the union of tRNA genes and tRNA pseudo-genes.
The distinction of tRNA genes and pseudogenes necessarily relies of a set of heuristicsimplemented in tRNAscan-SE. These are well-founded in what is known about functionaltRNA genes [74, 29, 152, 73, 60, 142]. Processing and recognition of specific tRNAsimposes stringent constraints on the sequence (and secondary structure) of tRNAs; severalnucleotides of mature tRNAs need to chemically modified in most species, imposing furtherconstraints on the primary sequence. tRNAscan-SE’s consensus models implement thesecontraints with reasonable accuracy but by no means perfectly. In the absence of detailedexperimental information on the expression and the functionality of a particular tDNA it
17
CHAPTER 2. GENOMIC ORGANIZATION OF EUKARYOTIC TRNAS
is of course impossible to distinguish between tRNA genes and tRNA pseudogenes withabsolute certainty. For the statistical evaluation of genome-wide comparison reported here,however, the accuracy of tRNAscan-SE appears to be sufficient [111, 58, 172]. There are,however, several sources for errors, in particular in the presence of RNA editing e.g. in themitochondrial tRNAs of many plants and the protist [110, 115, 45, 100]. Such organellardata are not considered in this contribution, however.
tRNA-geo pipeline The tRNA-geo pipeline is a Perl program that parses tRNAscan-SE
output and produces summary information as well as overview graphics such as those shownin Figs. 2.1 and 2.7. First tDNA locations are sorted in consecutive order along each inputsequence, distances are measures (see below for exact definitions), tDNA pairs and tDNAclusters are identified, summary statistics are computed. Graphics are produced usingPSTricks macros and LaTeX.
tRNA-geo pipeline description
• String definition. Every tDNA is represented by a quadruple P = (a, b, o, t), wherea < b are the start and end positions within each input sequence (chromosome,scaffold, or contig), and o ∈ {+,−} is the orientation of the tRNAs. We say thattwo tDNAs are of the same type t if they belong the same isoacceptor family, i.e., ifthey code for the same aminoacid.
• Distance definition: The tRNA loci are ordered such that Pi ≺ Pj if and only ifai < aj . The distance between two consecutive loci Pi and Pi+1 is defined asδi = ai+1 − bi.
• Cluster definition: A cluster C is a maximal sub-sequence of loci C = (Pi, Pi+1, . . . , Pj)such that δk < 1000 for i ≤ k < j. The cut-off of 1000 was chosen because theoverwhelming majority of consecutive tDNA pairs in the random control have largerdistances while a large fraction of the tDNA pairs in the real data have smaller dis-tances than this cut-off value, see Fig. 2.5 here.
• Cluster class definition: A cluster is called homogeneous if all its tDNAs are of thesame type tk; otherwise, it is called heterogeneous. A sub-sequence consisting of twoconsecutives loci located within a cluster C is called a pair. The pair (Pi, Pi+1) ishomogeneous if ti = ti+1 and heterogeneous otherwise. A pair has parallel orientationif oi = oi+1. For anti-parallel pairs, oi = −oi+1, we distinguish head-to-head oi = +and oi+1 = − (←→), and tail-to-tail oi = − and oi+1 = + (→←) orientations.
Simulations In order to investigate the statistical significance of the tDNA pairs wecompare the genomic tDNA organization with randomized configurations. To this end,we remove the collection of tRNA genes and pseudogenes from the genome and re-insertthem at positions chosen from a uniform distribution on the remaining sequence. Empiricalp-values, defined as
p = #{i|y(i) ≥ x}/N , (2.1)
18
2.2. METHODOLOGY
where y(i) is the number of clustered tRNAs in replicate i, x is the number of clusteredtRNAs in the genome, are determined from N = 50 to N = 1000 random replicates.For large (insignificant) p-values, simulations were terminated at fewer replicates to savecomputer time.
Statistical tests Were performed using the R statistics environment [1]. In particular,Fisher’s exact test [48] with 2× 2 contingency tables was used in order to test whether theobserved proportion of homogenous and heterogeneous pairs depends strongly on whethertRNA pseudogenes are included in the analyis or not.
Synteny To analyze the synteny between species, we utilized two different pipelines de-pending on available genomic data and their interrelations in public data sources. TheBioFuice [91] integration platform is used to analyze the synteny in eight different ver-tebrate species Homo sapiens, Pan troglodytes, Pongo pygmaeus, Macaca mulatta, Mus
musculus, Monodelphis domestica, Gallus gallus, and Xenopus tropicalis. The analysis runsin several steps. Firstly, the Ensembl data source (version 53) is utilized to create thegenomic mappings between the tRNAs and/or tRNA pseudogenes and at most five consec-utive protein-coding flanking genes in both directions, up- and downstream. The number5 was chosen pragmatically as a trade-off between the need to evaluate local informationand the unavoidable incompleteness of genome annotations, whence homologs of manygenes are missing in individual genomes. These genomic mappings are chromosome- andstrand-specific, i.e., the resulting genes are located on the same chromosome and strand asthe input tDNAs. Next, the resulting genes are associated to protein-coding genes of othermammalian species using the homologous data available in Ensembl Compara (version 53).These homology relationships between genes in different species are then filtered to focuson those genes flanking tRNAs. Finally, tDNAs of different mammals can be associatedbased on the genomic mappings to their flanking genes (gene-tRNA) and the homologyrelations between those (gene-gene).
We consider two alternatives for creating such tDNA relationships:
1. Two tDNAs are associated by the single-sided linkage relation if there is at leastone homology relationship between their pre-selected flanking genes. Here we donot require that the homologous genes have the same relative orientation or relativelocation w.r.t. to the tDNAs.
2. Two tDNAs are associated by the two-sided linkage relation if there is at least onepair of homologous genes in both the up-stream and the down-stream region. Again,relative orientations are not taken into account. The tDNAs need to be locatedbetween the two homologous gene-pairs, however.
The Single-sided linkage relation turns out to be not very informative because many-to-manyhomology relations for large gene families and the relatively large regions used to define thesynteny relation severely limit the sensitivity. We therefore limit a details discussion to thetwo-sided linkage relation.
For invertebrate genomes, synteny information was extracted directly from genomeannotation using a custom-made pipeline based on Perl and awk scripts. For the nematodes
19
CHAPTER 2. GENOMIC ORGANIZATION OF EUKARYOTIC TRNAS
C. elegans, C. briggsae, C. japonica, C. brenneri, C. remanei we considered a region of40.000nt up- and downstream of the tRNA loci. A pair of tDNAs was defined as syntenicif we could found in this range at least two orthologous proteins between them. Theflanking proteins were taken from the genome annotation gff-files from Wormbase WS204.A list of orthologous proteins was computed using OrthoMCL [103] to determine if twoproteins are ortholog. Tab. 2.4 summarizes the prevalence of tRNA synteny within thegenus Caenorhabditis. The tDNAs in the genus Drosophila were analyzed in the same way.The flanking proteins were take from Flybase (release FB2009 09). Since a sufficientlycomplete orthology annotation was not readily available, we used ProteinOrtho [96] forthis purpose. The results are compiled in [4].
The fraction of syntenically conserved tDNAs was compared to the evolutionary dis-tances for each pair of genomes in the three data sets described above. The evolutionarydistance for the Vertebrates and Nematodes is gathered by the tree model underlying theUCSC 28-way alignments [121]. For the genus Drosophila the evolutionary distances aregenomic mutation distances computed from 4-fold degenerated sites in all coding regionscorrected for base composition as in [174].
Codon bias usage Codon bias usage was done by using the codon usage table from[128]. A total of 52988 codons corresponding to 217 CDS from S. japonicum, 8160 codonsof 13 CDS from S. mediterranea and 161225 codons of 369 CDS from S. mansoni wereanalyzed.
RepeatMasker RepeatMasker [159] is a program that screens DNA sequences for inter-spersed repeats and low complexity DNA sequences. Sequence comparisons in RepeatMaskerare performed by so-called cross match program [63], an efficient implementation of theSmith-Waterman-Gotoh algorithm [160, 61]. The general purpose of this utility is to com-pare any two sets of DNA sequences. In our survey we have compared the set of detectedtRNA genes against libraries of repeats [159].
2.3 Results and Discusions
For each of the 74 genomes included in our survey we collected summary statistics onthe number of tRNA gene and tRNA pseudogenes as well as on their genomic clusters.To simplify the language, we will use the term “tDNA” to refer to both tRNA genes andtRNA pseudogenes, while “tRNA gene” will be reserved to loci with probably intact tRNAsequences. In practise, we use tRNAscan-SE to distinguish between tRNA genes and tRNApseudogenes (see Methods for details).
We define two adjacent tRNA gene or tDNAs as “clustered” if their distance is lessthan 1000 nucleotides. This threshold is motivated by a statistical analysis of the distancesbetween adjacent tDNA loci, which shows that at this distance we have to expect very fewor no tDNA pairs in the genomes under investigation (see Methods for details). We thendistinguish between homogeneous clusters, consisting of tDNA with the same isoacceptorfamily (i.e., coding for the same aminoacid), and heterogeneous clusters. Within clusters,we separately consider the three relative orientations →→, ←→, and →←. Data have
20
2.3. RESULTS AND DISCUSIONS
Monosiga
A
0
1e1
1e2
1e3
1e4
1e5
1e6
B0 100
C0 100
C’0 100
E0 100
D0 100
E’0 100
D’0 100
Nematostella
A
0
1e1
1e2
1e3
1e4
1e5
1e6
B0 100
C0 100
C’0 100
E0 100
D0 100
E’0 100
D’0 100
Danio
A
0
1e1
1e2
1e3
1e4
1e5
1e6
B0 100
C0 100
C’0 100
E0 100
D0 100
E’0 100
D’0 100
Bos
A
0
1e1
1e2
1e3
1e4
1e5
1e6
B0 100
C0 100
C’0 100
E0 100
D0 100
E’0 100
D’0 100
Physcomitrella
A
0
1e1
1e2
1e3
1e4
1e5
1e6
B0 100
C0 100
C’0 100
E0 100
D0 100
E’0 100
D’0 100
Arabidopsis
A
0
1e1
1e2
1e3
1e4
1e5
1e6
B0 100
C0 100
C’0 100
E0 100
D0 100
E’0 100
D’0 100
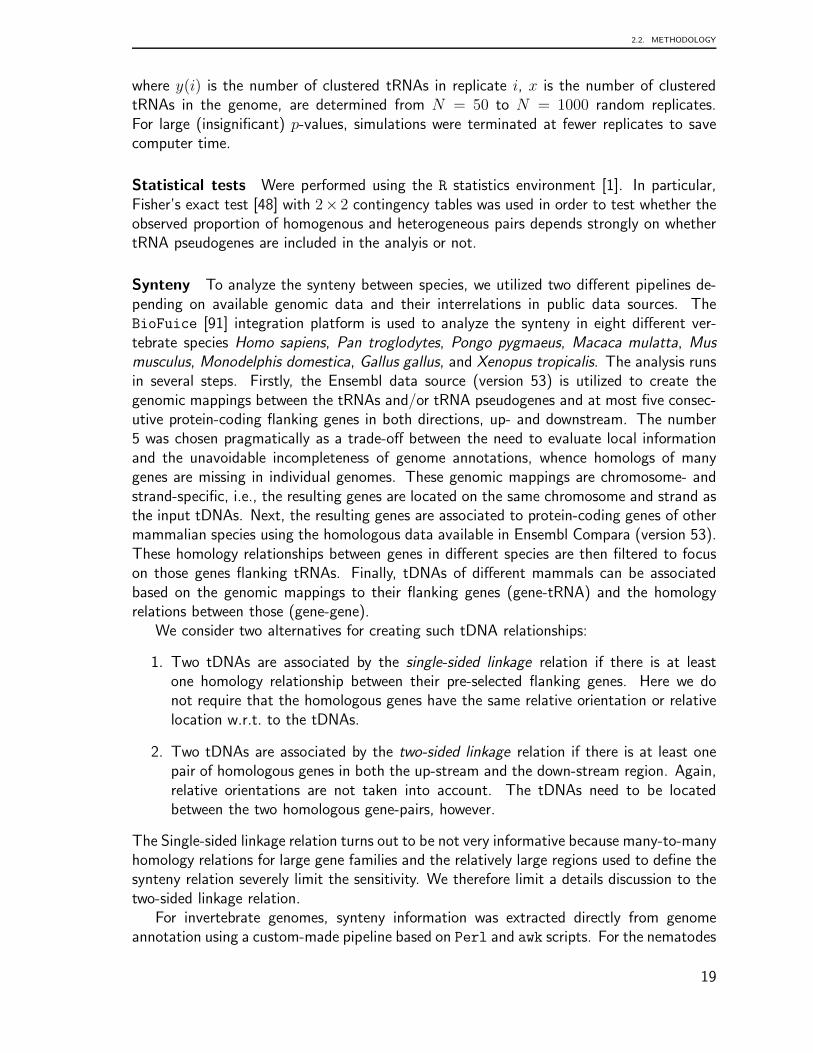
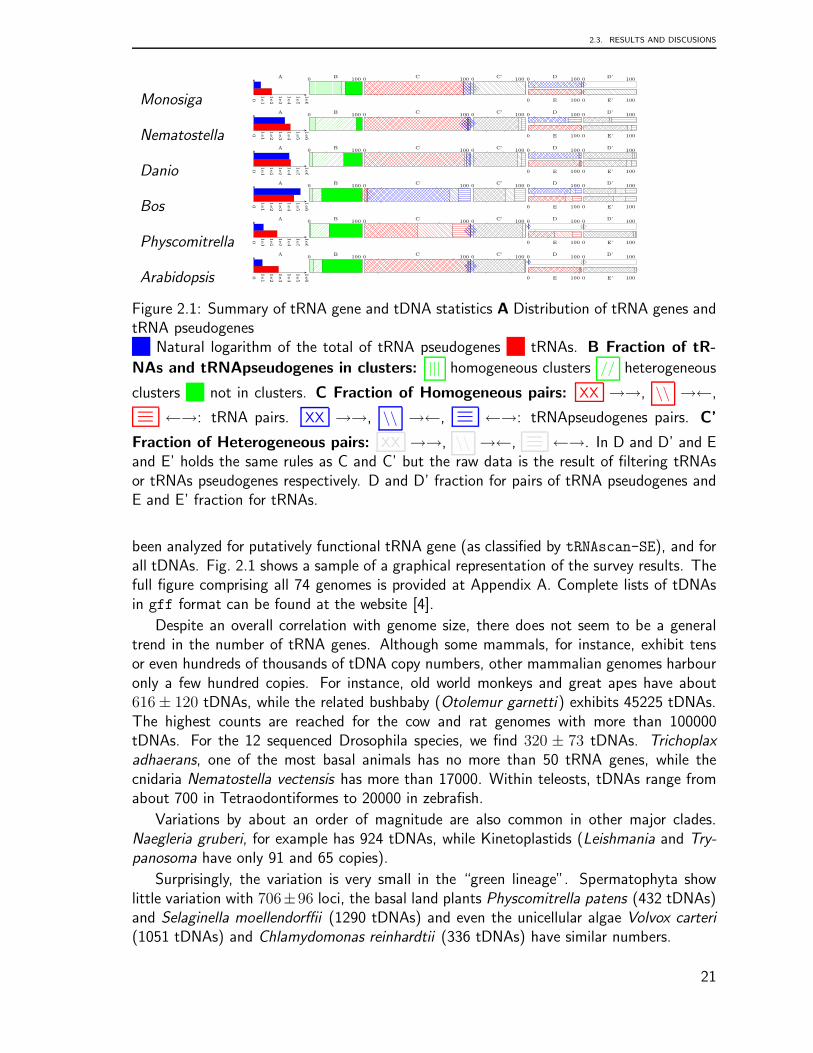
Figure 2.1: Summary of tRNA gene and tDNA statistics A Distribution of tRNA genes andtRNA pseudogenesX Natural logarithm of the total of tRNA pseudogenes X tRNAs. B Fraction of tR-
NAs and tRNApseudogenes in clusters: ||| homogeneous clusters // heterogeneous
clusters X not in clusters. C Fraction of Homogeneous pairs: XX →→, \\ →←,
≡ ←→: tRNA pairs. XX →→, \\ →←, ≡ ←→: tRNApseudogenes pairs. C’
Fraction of Heterogeneous pairs: XX →→, \\ →←, ≡ ←→. In D and D’ and Eand E’ holds the same rules as C and C’ but the raw data is the result of filtering tRNAsor tRNAs pseudogenes respectively. D and D’ fraction for pairs of tRNA pseudogenes andE and E’ fraction for tRNAs.
been analyzed for putatively functional tRNA gene (as classified by tRNAscan-SE), and forall tDNAs. Fig. 2.1 shows a sample of a graphical representation of the survey results. Thefull figure comprising all 74 genomes is provided at Appendix A. Complete lists of tDNAsin gff format can be found at the website [4].
Despite an overall correlation with genome size, there does not seem to be a generaltrend in the number of tRNA genes. Although some mammals, for instance, exhibit tensor even hundreds of thousands of tDNA copy numbers, other mammalian genomes harbouronly a few hundred copies. For instance, old world monkeys and great apes have about616± 120 tDNAs, while the related bushbaby (Otolemur garnetti) exhibits 45225 tDNAs.The highest counts are reached for the cow and rat genomes with more than 100000tDNAs. For the 12 sequenced Drosophila species, we find 320 ± 73 tDNAs. Trichoplax
adhaerans, one of the most basal animals has no more than 50 tRNA genes, while thecnidaria Nematostella vectensis has more than 17000. Within teleosts, tDNAs range fromabout 700 in Tetraodontiformes to 20000 in zebrafish.
Variations by about an order of magnitude are also common in other major clades.Naegleria gruberi, for example has 924 tDNAs, while Kinetoplastids (Leishmania and Try-
panosoma have only 91 and 65 copies).
Surprisingly, the variation is very small in the “green lineage”. Spermatophyta showlittle variation with 706±96 loci, the basal land plants Physcomitrella patens (432 tDNAs)and Selaginella moellendorffii (1290 tDNAs) and even the unicellular algae Volvox carteri
(1051 tDNAs) and Chlamydomonas reinhardtii (336 tDNAs) have similar numbers.
21
CHAPTER 2. GENOMIC ORGANIZATION OF EUKARYOTIC TRNAS
7.0 8.0 9.0 10.0log10(genome size)
0.0
1.0
2.0
3.0
4.0
5.0
6.0
log 10
(tR
NA
gen
es)
tRNAspseudogenesall
0.66
0.93
1.61
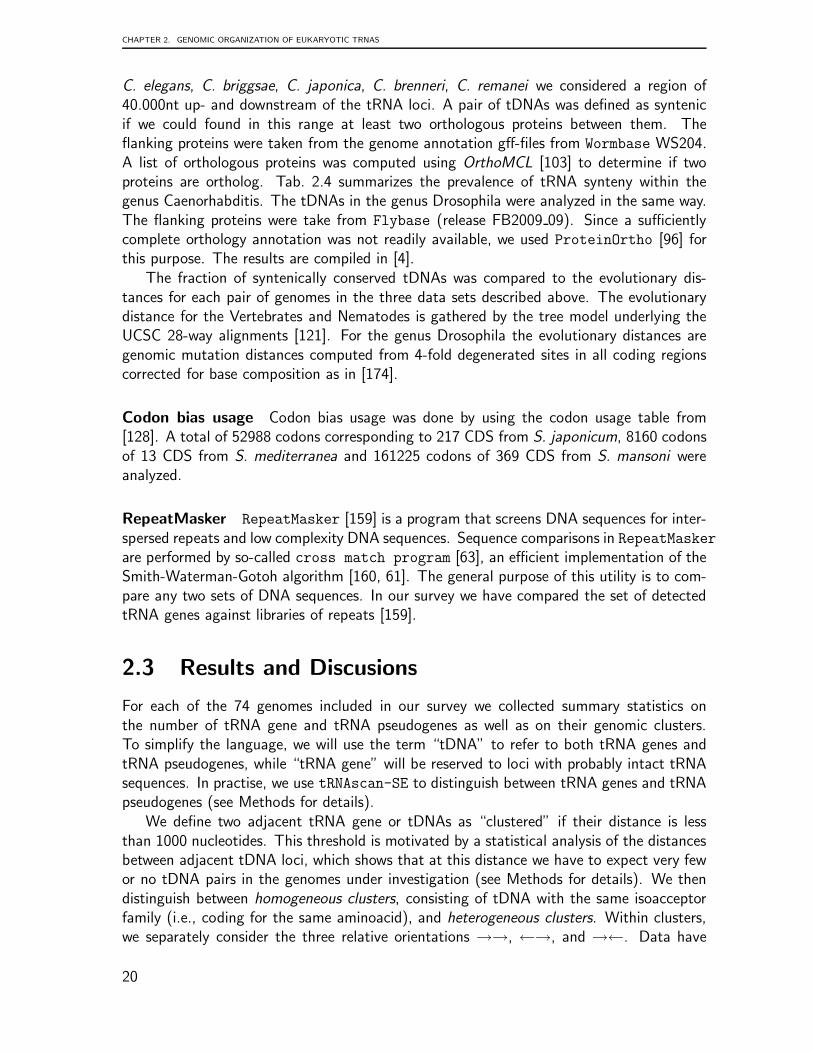
Figure 2.2: Correlation of thenumber of tDNAs with genomesize. The slopes of the three re-gressions are significantly differ-ent: Intact tRNA gene (•, α =0.658±0.076), tRNA pseudogenes(�, α = 1.615±0.181), total num-ber of tDNAs (×, α = 0.930 ±0.096)
Despite the often large variation among even closely related lineages, we observe theexpected correlation between the number of tDNAs with genome size, Fig. 2.2. The correla-tion is significant, with correlation coefficient ρ ∈ (0.71 . . . 0.76), but subject to a high levelof variation reflecting large differences in the evolutionary history of different lineages. Whilethe total number of tDNAs scales approximately linearly with genome size, α = 0.93±0.10,the growth in the number of intact, probably functional tRNA genes is much slower, consis-tent with N2/3. The number of tRNA pseudogenes, on the other hand, grows faster thanlinearly, ∼ N1.61±0.18. The reasons for this difference in scaling remains unclear. One mayspeculate that selective forces maintain only a limited number of functional tDNA copiescausing the sub-linear growth of intact tRNA genes with genome size, while the duplica-tion/deletion mechanism acts towards a uniform coverage of the genome with a rate that isto a first approximation constant throughout eukaryotic genome, accounting for the lineargrowth of the total number of tDNAs.
Several selective forces could act on the tRNA genes and/or all tDNA loci to cap theirnumber. The bias towards small deletions over insertions observed in [92] is one potentialcandidate that is independent of special properties of tRNAs. Variations in codon usagemight provide another selection-based explanation for the variation of tDNA copy numbers.In eubacteria, a correlation between tRNA abundance, tRNA gene copy number, and codonusage is well established [146]. Whether codon bias causes tDNA copy number variationor vice versa remains topic of an intense debate, however. A mechanistic explanationdescribing the coevolution of codon usage with tRNA gene content is given in [69]. Itremains unclear to what extent the correlation of tRNA copy numbers and codon usagecarries over to eukaryotic genomes. A detailed investigation in Schistosoma mansoni andSchistosoma japonicum finds no correlation between tRNA gene numbers and codon usage,while a statistically significant but still very weak correlation is observed in Schmidtea
mediterranea [26]. In Nasonia, the correlation of codon usage and the copy numbersof tRNA genes appears to be restricted to highly expressed genes. The strength of thiscorrelation decreases with GC-content in plant genomes [125].
22
2.3. RESULTS AND DISCUSIONS
100
101
102
103
0 2 4 6 8 10 12 14
Fre
quen
cy Protists, n=11
100
101
102
0 1 2 3 4 5
Fre
quen
cy Fungi, n=5
100
101
102
0 5 10 15 20 25 30
Fre
quen
cy C. intestinalis, n=1
100
101
102
103
0 50 100 150 200 250 300
Fre
quen
cy N. vectensis, n=1
100
101
102
103
0 2 4 6 8 10 12 14 16
Fre
quen
cy Drosophilids, n=12
100
101
102
103
0 50 100 150 200 250
Fre
quen
cy Teleostei, n=5
100
101
102
103
0 10 20 30 40 50 60 70 80
freq
uenc
y
Cluster size
Viridiplantae, n=10
100101102103104105
0 2 4 6 8 10 12 14 16
freq
uenc
y
Cluster size
Mammalia, n=19
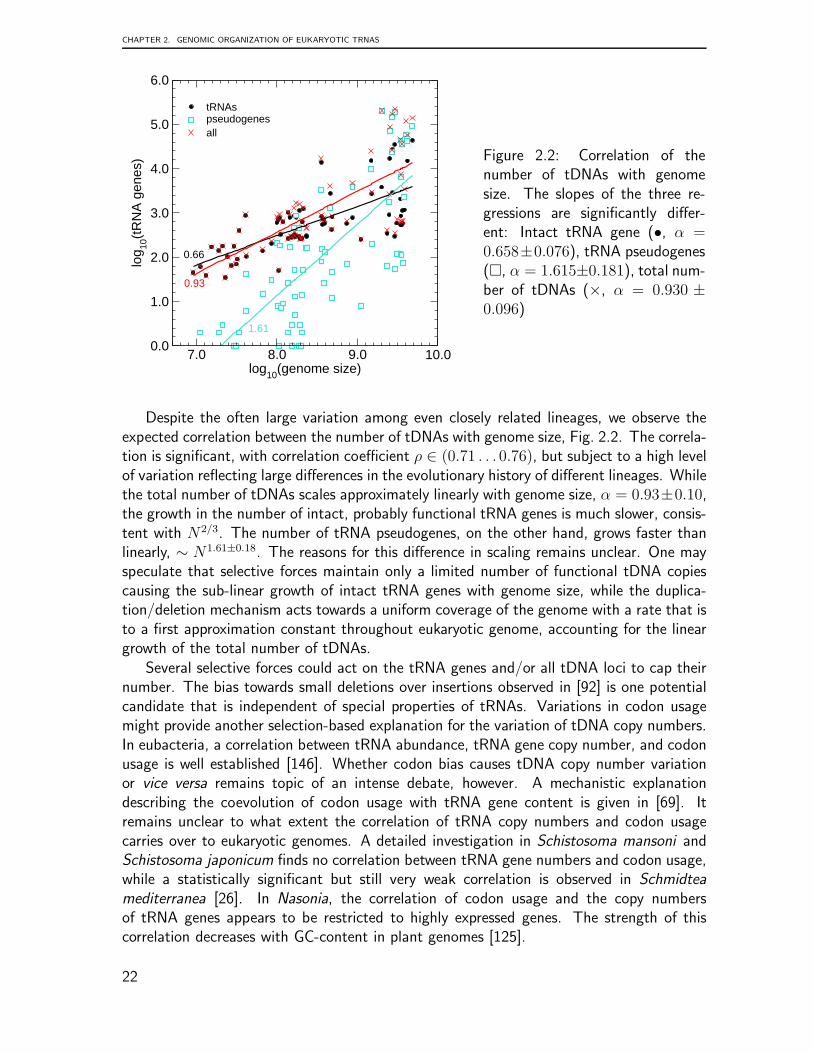
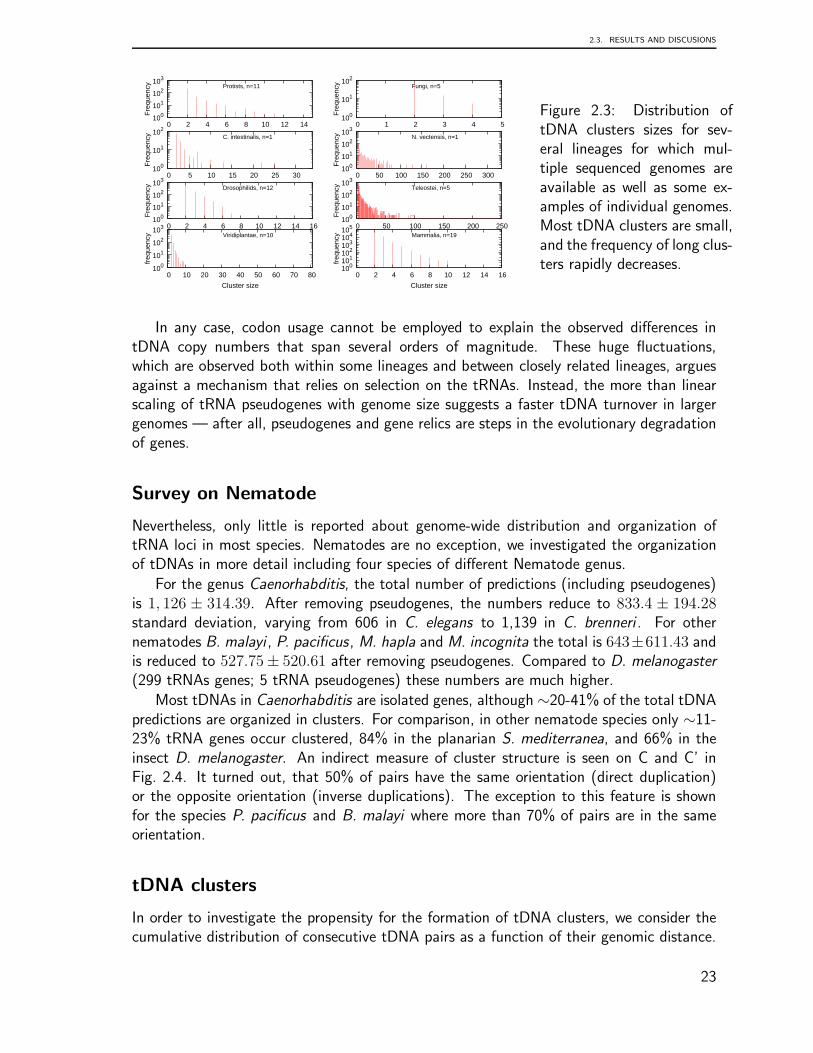
Figure 2.3: Distribution oftDNA clusters sizes for sev-eral lineages for which mul-tiple sequenced genomes areavailable as well as some ex-amples of individual genomes.Most tDNA clusters are small,and the frequency of long clus-ters rapidly decreases.
In any case, codon usage cannot be employed to explain the observed differences intDNA copy numbers that span several orders of magnitude. These huge fluctuations,which are observed both within some lineages and between closely related lineages, arguesagainst a mechanism that relies on selection on the tRNAs. Instead, the more than linearscaling of tRNA pseudogenes with genome size suggests a faster tDNA turnover in largergenomes — after all, pseudogenes and gene relics are steps in the evolutionary degradationof genes.
Survey on Nematode
Nevertheless, only little is reported about genome-wide distribution and organization oftRNA loci in most species. Nematodes are no exception, we investigated the organizationof tDNAs in more detail including four species of different Nematode genus.
For the genus Caenorhabditis, the total number of predictions (including pseudogenes)is 1, 126 ± 314.39. After removing pseudogenes, the numbers reduce to 833.4 ± 194.28standard deviation, varying from 606 in C. elegans to 1,139 in C. brenneri . For othernematodes B. malayi , P. pacificus, M. hapla and M. incognita the total is 643±611.43 andis reduced to 527.75± 520.61 after removing pseudogenes. Compared to D. melanogaster
(299 tRNAs genes; 5 tRNA pseudogenes) these numbers are much higher.
Most tDNAs in Caenorhabditis are isolated genes, although ∼20-41% of the total tDNApredictions are organized in clusters. For comparison, in other nematode species only ∼11-23% tRNA genes occur clustered, 84% in the planarian S. mediterranea, and 66% in theinsect D. melanogaster. An indirect measure of cluster structure is seen on C and C’ inFig. 2.4. It turned out, that 50% of pairs have the same orientation (direct duplication)or the opposite orientation (inverse duplications). The exception to this feature is shownfor the species P. pacificus and B. malayi where more than 70% of pairs are in the sameorientation.
tDNA clusters
In order to investigate the propensity for the formation of tDNA clusters, we consider thecumulative distribution of consecutive tDNA pairs as a function of their genomic distance.
23
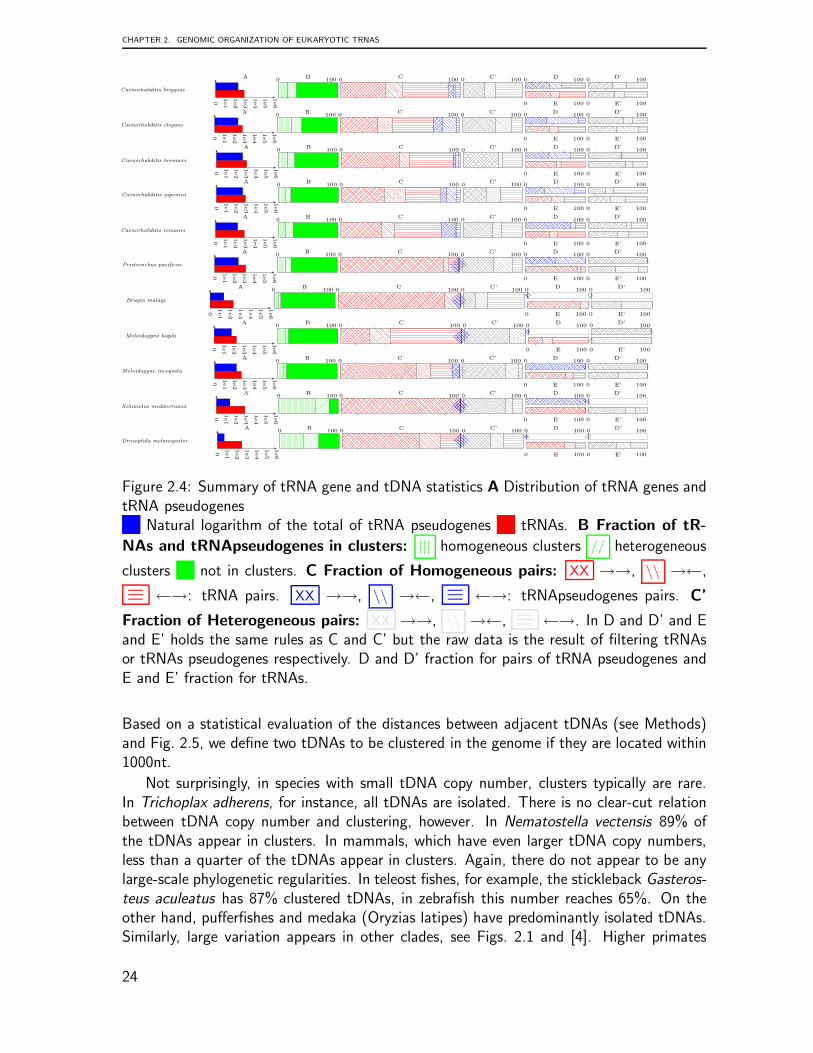
CHAPTER 2. GENOMIC ORGANIZATION OF EUKARYOTIC TRNAS
Caenorhabditis briggsae
A
0
1e1
1e2
1e3
1e4
1e5
1e6
B0 100
C0 100
C’0 100
E0 100
D0 100
E’0 100
D’0 100
Caenorhabditis elegans
A
0
1e1
1e2
1e3
1e4
1e5
1e6
B0 100
C0 100
C’0 100
E0 100
D0 100
E’0 100
D’0 100
Caenorhabditis brenneri
A
0
1e1
1e2
1e3
1e4
1e5
1e6
B0 100
C0 100
C’0 100
E0 100
D0 100
E’0 100
D’0 100
Caenorhabditis japonica
A
0
1e1
1e2
1e3
1e4
1e5
1e6
B0 100
C0 100
C’0 100
E0 100
D0 100
E’0 100
D’0 100
Caenorhabditis remanei
A
0
1e1
1e2
1e3
1e4
1e5
1e6
B0 100
C0 100
C’0 100
E0 100
D0 100
E’0 100
D’0 100
Pristionchus pacificus
A
0
1e1
1e2
1e3
1e4
1e5
1e6
B0 100
C0 100
C’0 100
E0 100
D0 100
E’0 100
D’0 100
Brugia malayi
A
0
1e1
1e2
1e3
1e4
1e5
1e6
B0 100
C0 100
C’0 100
E0 100
D0 100
E’0 100
D’0 100
Meloidogyne hapla
A
0
1e1
1e2
1e3
1e4
1e5
1e6
B0 100
C0 100
C’0 100
E0 100
D0 100
E’0 100
D’0 100
Meloidogyne incognita
A
0
1e1
1e2
1e3
1e4
1e5
1e6
B0 100
C0 100
C’0 100
E0 100
D0 100
E’0 100
D’0 100
Schimetea mediterranea
A
0
1e1
1e2
1e3
1e4
1e5
1e6
B0 100
C0 100
C’0 100
E0 100
D0 100
E’0 100
D’0 100
Drosophila melanogaster
A
0
1e1
1e2
1e3
1e4
1e5
1e6
B0 100
C0 100
C’0 100
E0 100
D0 100
E’0 100
D’0 100
Figure 2.4: Summary of tRNA gene and tDNA statistics A Distribution of tRNA genes andtRNA pseudogenesX Natural logarithm of the total of tRNA pseudogenes X tRNAs. B Fraction of tR-
NAs and tRNApseudogenes in clusters: ||| homogeneous clusters // heterogeneous
clusters X not in clusters. C Fraction of Homogeneous pairs: XX →→, \\ →←,
≡ ←→: tRNA pairs. XX →→, \\ →←, ≡ ←→: tRNApseudogenes pairs. C’
Fraction of Heterogeneous pairs: XX →→, \\ →←, ≡ ←→. In D and D’ and Eand E’ holds the same rules as C and C’ but the raw data is the result of filtering tRNAsor tRNAs pseudogenes respectively. D and D’ fraction for pairs of tRNA pseudogenes andE and E’ fraction for tRNAs.
Based on a statistical evaluation of the distances between adjacent tDNAs (see Methods)and Fig. 2.5, we define two tDNAs to be clustered in the genome if they are located within1000nt.
Not surprisingly, in species with small tDNA copy number, clusters typically are rare.In Trichoplax adherens, for instance, all tDNAs are isolated. There is no clear-cut relationbetween tDNA copy number and clustering, however. In Nematostella vectensis 89% ofthe tDNAs appear in clusters. In mammals, which have even larger tDNA copy numbers,less than a quarter of the tDNAs appear in clusters. Again, there do not appear to be anylarge-scale phylogenetic regularities. In teleost fishes, for example, the stickleback Gasteros-
teus aculeatus has 87% clustered tDNAs, in zebrafish this number reaches 65%. On theother hand, pufferfishes and medaka (Oryzias latipes) have predominantly isolated tDNAs.Similarly, large variation appears in other clades, see Figs. 2.1 and [4]. Higher primates
24
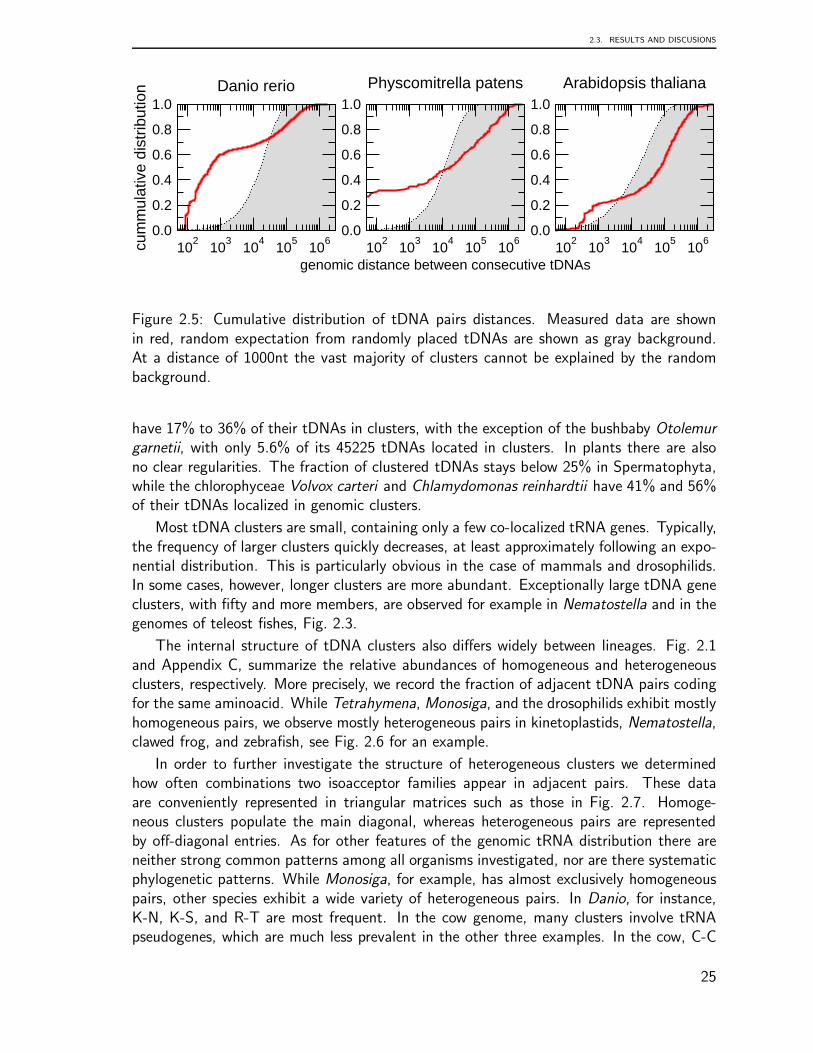
2.3. RESULTS AND DISCUSIONS
102
103
104
105
106
0.0
0.2
0.4
0.6
0.8
1.0
cum
mul
ativ
e di
strib
utio
n Danio rerio
102
103
104
105
106
genomic distance between consecutive tDNAs
0.0
0.2
0.4
0.6
0.8
1.0
Physcomitrella patens
102
103
104
105
106
0.0
0.2
0.4
0.6
0.8
1.0
Arabidopsis thaliana
Figure 2.5: Cumulative distribution of tDNA pairs distances. Measured data are shownin red, random expectation from randomly placed tDNAs are shown as gray background.At a distance of 1000nt the vast majority of clusters cannot be explained by the randombackground.
have 17% to 36% of their tDNAs in clusters, with the exception of the bushbaby Otolemur
garnetii, with only 5.6% of its 45225 tDNAs located in clusters. In plants there are alsono clear regularities. The fraction of clustered tDNAs stays below 25% in Spermatophyta,while the chlorophyceae Volvox carteri and Chlamydomonas reinhardtii have 41% and 56%of their tDNAs localized in genomic clusters.
Most tDNA clusters are small, containing only a few co-localized tRNA genes. Typically,the frequency of larger clusters quickly decreases, at least approximately following an expo-nential distribution. This is particularly obvious in the case of mammals and drosophilids.In some cases, however, longer clusters are more abundant. Exceptionally large tDNA geneclusters, with fifty and more members, are observed for example in Nematostella and in thegenomes of teleost fishes, Fig. 2.3.
The internal structure of tDNA clusters also differs widely between lineages. Fig. 2.1and Appendix C, summarize the relative abundances of homogeneous and heterogeneousclusters, respectively. More precisely, we record the fraction of adjacent tDNA pairs codingfor the same aminoacid. While Tetrahymena, Monosiga, and the drosophilids exhibit mostlyhomogeneous pairs, we observe mostly heterogeneous pairs in kinetoplastids, Nematostella,clawed frog, and zebrafish, see Fig. 2.6 for an example.
In order to further investigate the structure of heterogeneous clusters we determinedhow often combinations two isoacceptor families appear in adjacent pairs. These dataare conveniently represented in triangular matrices such as those in Fig. 2.7. Homoge-neous clusters populate the main diagonal, whereas heterogeneous pairs are representedby off-diagonal entries. As for other features of the genomic tRNA distribution there areneither strong common patterns among all organisms investigated, nor are there systematicphylogenetic patterns. While Monosiga, for example, has almost exclusively homogeneouspairs, other species exhibit a wide variety of heterogeneous pairs. In Danio, for instance,K-N, K-S, and R-T are most frequent. In the cow genome, many clusters involve tRNApseudogenes, which are much less prevalent in the other three examples. In the cow, C-C
25
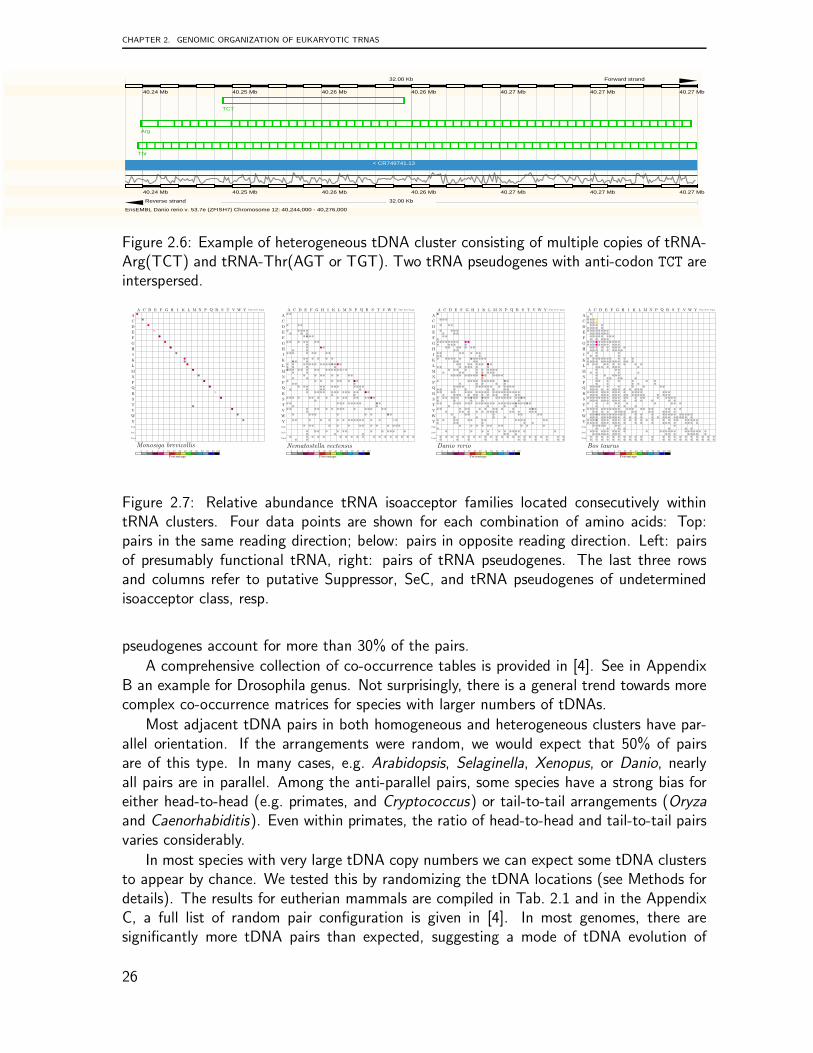
CHAPTER 2. GENOMIC ORGANIZATION OF EUKARYOTIC TRNAS
40.24 Mb 40.25 Mb 40.26 Mb 40.26 Mb 40.27 Mb 40.27 Mb 40.27 Mb
Thr
Arg
TCT
< CR749741.13
40.24 Mb 40.25 Mb 40.26 Mb 40.26 Mb 40.27 Mb 40.27 Mb 40.27 Mb
EnsEMBL Danio rerio v. 53.7e (ZFISH7) Chromosome 12: 40,244,000 - 40,276,000
32.00 Kb Forward strand
Reverse strand 32.00 Kb
Figure 2.6: Example of heterogeneous tDNA cluster consisting of multiple copies of tRNA-Arg(TCT) and tRNA-Thr(AGT or TGT). Two tRNA pseudogenes with anti-codon TCT areinterspersed.
A C D E F G H I K L M N P Q R S T V W Y Sup SeC Und
A
C
D
E
F
G
H
I
K
L
M
N
P
Q
R
S
T
V
W
Y
Sup
SeC
Und
bbbb
bbbb
bbbb
bbbb
bbbb
bbbb
bbbb
bbbb
bbbb
bbbb
bbbb
bbbb
bbbb
bbbb
bbbb
bbbb
bbbb
bbbb
bbbb
bbbb
bbbb
bbbb
bbbb
bbbb
bbbb
bbbb
bbbb
bbbb
bbbb
bbbb
bbbb
bbbb
bbbb
bbbb
bbbb
bbbb
bbbb
bbbb
bbbb
bbbb
bbbb
bbbb
bbbb
bbbb
bbbb
bbbb
bbbb
bbbb
bbbb
bbbb
bbbb
bbbb
bbbb
bbbb
bbbb
bbbb
bbbb
bbbb
bbbb
bbbb
bbbb
bbbb
bbbb
bbbb
bbbb
bbbb
bbbb
bbbb
bbbb
bbbb
bbbb
bbbb
bbbb
bbbb
bbbb
bbbb
bbbb
bbbb
bbbb
bbbb
bbbb
bbbb
bbbb
bbbb
bbbb
bbbb
bbbb
bbbb
bbbb
bbbb
bbbb
bbbb
bbbb
bbbb
bbbb
bbbb
bbbb
bbbb
bbbb
bbbb
bbbb
bbbb
bbbb
bbbb
bbbb
bbbb
bbbb
bbbb
bbbb
bbbb
bbbb
bbbb
bbbb
bbbb
bbbb
bbbb
bbbb
bbbb
bbbb
bbbb
bbbb
bbbb
bbbb
bbbb
bbbb
bbbb
bbbb
bbbb
bbbb
bbbb
bbbb
bbbb
bbbb
bbbb
bbbb
bbbb
bbbb
bbbb
bbbb
bbbb
bbbb
bbbb
bbbb
bbbb
bbbb
bbbb
bbbb
bbbb
bbbb
bbbb
bbbb
bbbb
bbbb
bbbb
bbbb
bbbb
bbbb
bbbb
bbbb
bbbb
bbbb
bbbb
bbbb
bbbb
bbbb
bbbb
bbbb
bbbb
bbbb
bbbb
bbbb
bbbb
bbbb
bbbb
bbbb
bbbb
bbbb
bbbb
bbbb
bbbb
bbbb
bbbb
bbbb
bbbb
bbbb
bbbb
bbbb
bbbb
bbbb
bbbb
bbbb
bbbb
bbbb
bbbb
bbbb
bbbb
bbbb
bbbb
bbbb
bbbb
bbbb
bbbb
bbbb
bbbb
bbbb
bbbb
bbbb
bbbb
bbbb
bbbb
bbbb
bbbb
bbbb
bbbb
bbbb
bbbb
bbbb
bbbb
bbbb
bbbb
bbbb
bbbb
bbbb
bbbb
bbbb
bbbb
bbbb
bbbb
bbbb
bbbb
bbbb
bbbb
bbbb
bbbb
bbbb
bbbb
bbbb
bbbb
bbbb
bbbb
bbbb
bbbb
bbbb
bbbb
bbbb
bbbb
bbbb
bbbb
bbbb
bbbb
bbbb
bbbb
bbbb
bbbb
bbbb
bbbb
bbbb
bbbb
bbbb
bbbb
bbbb
bbbb
bbbb
bbbb
bbbb
bbbb
bbbb
bbbb
bbbb
bbbb
bbbb
bbbb
bbbb
bbbb
bbbb
bbbb
bbbb
bbbb
bbbb
bbbb
bbbb
bbbb
bbbb
bbbb
bbbb
bbbb
bbbb
bbbb
bbbb
bbbb
bbbb
bbbb
bbbb
bbbb
bbbb
bbbb
bbbb
bbbb
bbbb
bbbb
bbbb
bbbb
bbbb
bbbb
bbbb
bbbb
bbbb
bbbb
bbbb
bbbb
bbbb
bbbb
bbbb
bbbb
bbbb
bbbb
bbbb
bbbb
bbbb
bbbb
bbbb
bbbb
bbbb
bbbb
bbbb
bbbb
bbbb
bbbb
bbbb
bbbb
bbbb
bbbb
bbbb
bbbb
bbbb
bbbb
bbbb
bbbb
bbbb
bbbb
bbbb
bbbb
bbbb
bbbb
bbbb
bbbb
bbbb
bbbb
bbbb
bbbb
bbbb
bbbb
bbbb
bbbb
bbbb
bbbb
bbbb
bbbb
bbbb
bbbb
bbbb
bbbb
bbbb
bbbb
bbbb
bbbb
bbbb
bbbb
bbbb
bbbb
bbbb
bbbb
bbbb
bbbb
bbbb
bbbb
bbbb
bbbb
bbbb
bbbb
bbbb
bbbb
bbbb
bbbb
bbbb
bbbb
bbbb
bbbb
bbbb
bbbb
bbbb
bbbb
bbbb
bbbb
bbbb
bbbb
bbbb
bbbb
bbbb
bbbb
bbbb
bbbb
bbbb
bbbb
bbbb
bbbb
bbbb
bbbb
bbbb
bbbb
bbbb
bbbb
bbbb
bbbb
bbbb
bbbb
bbbb
bbbb
bbbb
bbbb
bbbb
bbbb
bbbb
bbbb
bbbb
bbbb
bbbb
bbbb
bbbb
bbbb
bbbb
bbbb
bbbb
bbbb
bbbb
bbbb
bbbb
bbbb
bbbb
bbbb
bbbb
bbbb
bbbb
bbbb
bbbb
bbbb
bbbb
bbbb
bbbb
bbbb
bbbb
bbbb
bbbb
bbbb
bbbb
bbbb
bbbb
bbbb
bbbb
bbbb
bbbb
bbbb
bbbb
bbbb
bbbb
bbbb
bbbb
bbbb
bbbb
bbbb
bbbb
bbbb
bbbb
bbbb
bbbb
bbbb
bbbb
bbbb
bbbb
bbbb
bbbb
bbbb
bbbb
bbbb
bbbb
bbbb
bbbb
bbbb
bbbb
bbbb
bbbb
bbbb
bbbb
bbbb
bbbb
bbbb
bbbb
bbbb
bbbb
bbbb
bbbb
bbbb
bbbb
bbbb
bbbb
bbbb
bbbb
bbbb
bbbb
bbbb
bbbb
bbbb
bbbb
bbbb
bbbb
bbbb
bbbb
bbbb
bbbb
bbbb
bbbb
bbbb
bbbb
bbbb
bbbb
bbbb
bbbb
bbbb
bbbb
Monosiga brevicollis0 2 4 6 8 10 20 30 40 50 60 70 80 90 100
Percentage
A C D E F G H I K L M N P Q R S T V W Y Sup SeC Und
A
C
D
E
F
G
H
I
K
L
M
N
P
Q
R
S
T
V
W
Y
Sup
SeC
Und
bbbb
bbbb
bbbb
bbbb
bbbb
bbbb
bbbb
bbbb
bbbb
bbbb
bbbb
bbbb
bbbb
bbbb
bbbb
bbbb
bbbb
bbbb
bbbb
bbbb
bbbb
bbbb
bbbb
bbbb
bbbb
bbbb
bbbb
bbbb
bbbb
bbbb
bbbb
bbbb
bbbb
bbbb
bbbb
bbbb
bbbb
bbbb
bbbb
bbbb
bbbb
bbbb
bbbb
bbbb
bbbb
bbbb
bbbb
bbbb
bbbb
bbbb
bbbb
bbbb
bbbb
bbbb
bbbb
bbbb
bbbb
bbbb
bbbb
bbbb
bbbb
bbbb
bbbb
bbbb
bbbb
bbbb
bbbb
bbbb
bbbb
bbbb
bbbb
bbbb
bbbb
bbbb
bbbb
bbbb
bbbb
bbbb
bbbb
bbbb
bbbb
bbbb
bbbb
bbbb
bbbb
bbbb
bbbb
bbbb
bbbb
bbbb
bbbb
bbbb
bbbb
bbbb
bbbb
bbbb
bbbb
bbbb
bbbb
bbbb
bbbb
bbbb
bbbb
bbbb
bbbb
bbbb
bbbb
bbbb
bbbb
bbbb
bbbb
bbbb
bbbb
bbbb
bbbb
bbbb
bbbb
bbbb
bbbb
bbbb
bbbb
bbbb
bbbb
bbbb
bbbb
bbbb
bbbb
bbbb
bbbb
bbbb
bbbb
bbbb
bbbb
bbbb
bbbb
bbbb
bbbb
bbbb
bbbb
bbbb
bbbb
bbbb
bbbb
bbbb
bbbb
bbbb
bbbb
bbbb
bbbb
bbbb
bbbb
bbbb
bbbb
bbbb
bbbb
bbbb
bbbb
bbbb
bbbb
bbbb
bbbb
bbbb
bbbb
bbbb
bbbb
bbbb
bbbb
bbbb
bbbb
bbbb
bbbb
bbbb
bbbb
bbbb
bbbb
bbbb
bbbb
bbbb
bbbb
bbbb
bbbb
bbbb
bbbb
bbbb
bbbb
bbbb
bbbb
bbbb
bbbb
bbbb
bbbb
bbbb
bbbb
bbbb
bbbb
bbbb
bbbb
bbbb
bbbb
bbbb
bbbb
bbbb
bbbb
bbbb
bbbb
bbbb
bbbb
bbbb
bbbb
bbbb
bbbb
bbbb
bbbb
bbbb
bbbb
bbbb
bbbb
bbbb
bbbb
bbbb
bbbb
bbbb
bbbb
bbbb
bbbb
bbbb
bbbb
bbbb
bbbb
bbbb
bbbb
bbbb
bbbb
bbbb
bbbb
bbbb
bbbb
bbbb
bbbb
bbbb
bbbb
bbbb
bbbb
bbbb
bbbb
bbbb
bbbb
bbbb
bbbb
bbbb
bbbb
bbbb
bbbb
bbbb
bbbb
bbbb
bbbb
bbbb
bbbb
bbbb
bbbb
bbbb
bbbb
bbbb
bbbb
bbbb
bbbb
bbbb
bbbb
bbbb
bbbb
bbbb
bbbb
bbbb
bbbb
bbbb
bbbb
bbbb
bbbb
bbbb
bbbb
bbbb
bbbb
bbbb
bbbb
bbbb
bbbb
bbbb
bbbb
bbbb
bbbb
bbbb
bbbb
bbbb
bbbb
bbbb
bbbb
bbbb
bbbb
bbbb
bbbb
bbbb
bbbb
bbbb
bbbb
bbbb
bbbb
bbbb
bbbb
bbbb
bbbb
bbbb
bbbb
bbbb
bbbb
bbbb
bbbb
bbbb
bbbb
bbbb
bbbb
bbbb
bbbb
bbbb
bbbb
bbbb
bbbb
bbbb
bbbb
bbbb
bbbb
bbbb
bbbb
bbbb
bbbb
bbbb
bbbb
bbbb
bbbb
bbbb
bbbb
bbbb
bbbb
bbbb
bbbb
bbbb
bbbb
bbbb
bbbb
bbbb
bbbb
bbbb
bbbb
bbbb
bbbb
bbbb
bbbb
bbbb
bbbb
bbbb
bbbb
bbbb
bbbb
bbbb
bbbb
bbbb
bbbb
bbbb
bbbb
bbbb
bbbb
bbbb
bbbb
bbbb
bbbb
bbbb
bbbb
bbbb
bbbb
bbbb
bbbb
bbbb
bbbb
bbbb
bbbb
bbbb
bbbb
bbbb
bbbb
bbbb
bbbb
bbbb
bbbb
bbbb
bbbb
bbbb
bbbb
bbbb
bbbb
bbbb
bbbb
bbbb
bbbb
bbbb
bbbb
bbbb
bbbb
bbbb
bbbb
bbbb
bbbb
bbbb
bbbb
bbbb
bbbb
bbbb
bbbb
bbbb
bbbb
bbbb
bbbb
bbbb
bbbb
bbbb
bbbb
bbbb
bbbb
bbbb
bbbb
bbbb
bbbb
bbbb
bbbb
bbbb
bbbb
bbbb
bbbb
bbbb
bbbb
bbbb
bbbb
bbbb
bbbb
bbbb
bbbb
bbbb
bbbb
bbbb
bbbb
bbbb
bbbb
bbbb
bbbb
bbbb
bbbb
bbbb
bbbb
bbbb
bbbb
bbbb
bbbb
bbbb
bbbb
bbbb
bbbb
bbbb
bbbb
bbbb
bbbb
bbbb
bbbb
bbbb
bbbb
bbbb
bbbb
bbbb
bbbb
bbbb
bbbb
bbbb
bbbb
bbbb
bbbb
bbbb
bbbb
bbbb
bbbb
bbbb
bbbb
bbbb
bbbb
bbbb
bbbb
bbbb
bbbb
bbbb
bbbb
bbbb
bbbb
bbbb
bbbb
bbbb
bbbb
bbbb
bbbb
bbbb
bbbb
bbbb
bbbb
bbbb
bbbb
bbbb
bbbb
bbbb
bbbb
bbbb
bbbb
bbbb
bbbb
bbbb
bbbb
bbbb
bbbb
bbbb
bbbb
bbbb
bbbb
bbbb
bbbb
Nematostella vectensis0 2 4 6 8 10 20 30 40 50 60 70 80 90 100
Percentage
A C D E F G H I K L M N P Q R S T V W Y Sup SeC Und
A
C
D
E
F
G
H
I
K
L
M
N
P
Q
R
S
T
V
W
Y
Sup
SeC
Und
bbbb
bbbb
bbbb
bbbb
bbbb
bbbb
bbbb
bbbb
bbbb
bbbb
bbbb
bbbb
bbbb
bbbb
bbbb
bbbb
bbbb
bbbb
bbbb
bbbb
bbbb
bbbb
bbbb
bbbb
bbbb
bbbb
bbbb
bbbb
bbbb
bbbb
bbbb
bbbb
bbbb
bbbb
bbbb
bbbb
bbbb
bbbb
bbbb
bbbb
bbbb
bbbb
bbbb
bbbb
bbbb
bbbb
bbbb
bbbb
bbbb
bbbb
bbbb
bbbb
bbbb
bbbb
bbbb
bbbb
bbbb
bbbb
bbbb
bbbb
bbbb
bbbb
bbbb
bbbb
bbbb
bbbb
bbbb
bbbb
bbbb
bbbb
bbbb
bbbb
bbbb
bbbb
bbbb
bbbb
bbbb
bbbb
bbbb
bbbb
bbbb
bbbb
bbbb
bbbb
bbbb
bbbb
bbbb
bbbb
bbbb
bbbb
bbbb
bbbb
bbbb
bbbb
bbbb
bbbb
bbbb
bbbb
bbbb
bbbb
bbbb
bbbb
bbbb
bbbb
bbbb
bbbb
bbbb
bbbb
bbbb
bbbb
bbbb
bbbb
bbbb
bbbb
bbbb
bbbb
bbbb
bbbb
bbbb
bbbb
bbbb
bbbb
bbbb
bbbb
bbbb
bbbb
bbbb
bbbb
bbbb
bbbb
bbbb
bbbb
bbbb
bbbb
bbbb
bbbb
bbbb
bbbb
bbbb
bbbb
bbbb
bbbb
bbbb
bbbb
bbbb
bbbb
bbbb
bbbb
bbbb
bbbb
bbbb
bbbb
bbbb
bbbb
bbbb
bbbb
bbbb
bbbb
bbbb
bbbb
bbbb
bbbb
bbbb
bbbb
bbbb
bbbb
bbbb
bbbb
bbbb
bbbb
bbbb
bbbb
bbbb
bbbb
bbbb
bbbb
bbbb
bbbb
bbbb
bbbb
bbbb
bbbb
bbbb
bbbb
bbbb
bbbb
bbbb
bbbb
bbbb
bbbb
bbbb
bbbb
bbbb
bbbb
bbbb
bbbb
bbbb
bbbb
bbbb
bbbb
bbbb
bbbb
bbbb
bbbb
bbbb
bbbb
bbbb
bbbb
bbbb
bbbb
bbbb
bbbb
bbbb
bbbb
bbbb
bbbb
bbbb
bbbb
bbbb
bbbb
bbbb
bbbb
bbbb
bbbb
bbbb
bbbb
bbbb
bbbb
bbbb
bbbb
bbbb
bbbb
bbbb
bbbb
bbbb
bbbb
bbbb
bbbb
bbbb
bbbb
bbbb
bbbb
bbbb
bbbb
bbbb
bbbb
bbbb
bbbb
bbbb
bbbb
bbbb
bbbb
bbbb
bbbb
bbbb
bbbb
bbbb
bbbb
bbbb
bbbb
bbbb
bbbb
bbbb
bbbb
bbbb
bbbb
bbbb
bbbb
bbbb
bbbb
bbbb
bbbb
bbbb
bbbb
bbbb
bbbb
bbbb
bbbb
bbbb
bbbb
bbbb
bbbb
bbbb
bbbb
bbbb
bbbb
bbbb
bbbb
bbbb
bbbb
bbbb
bbbb
bbbb
bbbb
bbbb
bbbb
bbbb
bbbb
bbbb
bbbb
bbbb
bbbb
bbbb
bbbb
bbbb
bbbb
bbbb
bbbb
bbbb
bbbb
bbbb
bbbb
bbbb
bbbb
bbbb
bbbb
bbbb
bbbb
bbbb
bbbb
bbbb
bbbb
bbbb
bbbb
bbbb
bbbb
bbbb
bbbb
bbbb
bbbb
bbbb
bbbb
bbbb
bbbb
bbbb
bbbb
bbbb
bbbb
bbbb
bbbb
bbbb
bbbb
bbbb
bbbb
bbbb
bbbb
bbbb
bbbb
bbbb
bbbb
bbbb
bbbb
bbbb
bbbb
bbbb
bbbb
bbbb
bbbb
bbbb
bbbb
bbbb
bbbb
bbbb
bbbb
bbbb
bbbb
bbbb
bbbb
bbbb
bbbb
bbbb
bbbb
bbbb
bbbb
bbbb
bbbb
bbbb
bbbb
bbbb
bbbb
bbbb
bbbb
bbbb
bbbb
bbbb
bbbb
bbbb
bbbb
bbbb
bbbb
bbbb
bbbb
bbbb
bbbb
bbbb
bbbb
bbbb
bbbb
bbbb
bbbb
bbbb
bbbb
bbbb
bbbb
bbbb
bbbb
bbbb
bbbb
bbbb
bbbb
bbbb
bbbb
bbbb
bbbb
bbbb
bbbb
bbbb
bbbb
bbbb
bbbb
bbbb
bbbb
bbbb
bbbb
bbbb
bbbb
bbbb
bbbb
bbbb
bbbb
bbbb
bbbb
bbbb
bbbb
bbbb
bbbb
bbbb
bbbb
bbbb
bbbb
bbbb
bbbb
bbbb
bbbb
bbbb
bbbb
bbbb
bbbb
bbbb
bbbb
bbbb
bbbb
bbbb
bbbb
bbbb
bbbb
bbbb
bbbb
bbbb
bbbb
bbbb
bbbb
bbbb
bbbb
bbbb
bbbb
bbbb
bbbb
bbbb
bbbb
bbbb
bbbb
bbbb
bbbb
bbbb
bbbb
bbbb
bbbb
bbbb
bbbb
bbbb
bbbb
bbbb
bbbb
bbbb
bbbb
bbbb
bbbb
bbbb
bbbb
bbbb
bbbb
bbbb
bbbb
bbbb
bbbb
bbbb
bbbb
bbbb
bbbb
bbbb
bbbb
bbbb
bbbb
bbbb
bbbb
bbbb
bbbb
bbbb
bbbb
bbbb
bbbb
bbbb
bbbb
bbbb
bbbb
bbbb
bbbb
bbbb
bbbb
bbbb
bbbb
bbbb
bbbb
bbbb
bbbb
bbbb
bbbb
bbbb
Danio rerio0 2 4 6 8 10 20 30 40 50 60 70 80 90 100
Percentage
A C D E F G H I K L M N P Q R S T V W Y Sup SeC Und
A
C
D
E
F
G
H
I
K
L
M
N
P
Q
R
S
T
V
W
Y
Sup
SeC
Und
bbbb
bbbb
bbbb
bbbb
bbbb
bbbb
bbbb
bbbb
bbbb
bbbb
bbbb
bbbb
bbbb
bbbb
bbbb
bbbb
bbbb
bbbb
bbbb
bbbb
bbbb
bbbb
bbbb
bbbb
bbbb
bbbb
bbbb
bbbb
bbbb
bbbb
bbbb
bbbb
bbbb
bbbb
bbbb
bbbb
bbbb
bbbb
bbbb
bbbb
bbbb
bbbb
bbbb
bbbb
bbbb
bbbb
bbbb
bbbb
bbbb
bbbb
bbbb
bbbb
bbbb
bbbb
bbbb
bbbb
bbbb
bbbb
bbbb
bbbb
bbbb
bbbb
bbbb
bbbb
bbbb
bbbb
bbbb
bbbb
bbbb
bbbb
bbbb
bbbb
bbbb
bbbb
bbbb
bbbb
bbbb
bbbb
bbbb
bbbb
bbbb
bbbb
bbbb
bbbb
bbbb
bbbb
bbbb
bbbb
bbbb
bbbb
bbbb
bbbb
bbbb
bbbb
bbbb
bbbb
bbbb
bbbb
bbbb
bbbb
bbbb
bbbb
bbbb
bbbb
bbbb
bbbb
bbbb
bbbb
bbbb
bbbb
bbbb
bbbb
bbbb
bbbb
bbbb
bbbb
bbbb
bbbb
bbbb
bbbb
bbbb
bbbb
bbbb
bbbb
bbbb
bbbb
bbbb
bbbb
bbbb
bbbb
bbbb
bbbb
bbbb
bbbb
bbbb
bbbb
bbbb
bbbb
bbbb
bbbb
bbbb
bbbb
bbbb
bbbb
bbbb
bbbb
bbbb
bbbb
bbbb
bbbb
bbbb
bbbb
bbbb
bbbb
bbbb
bbbb
bbbb
bbbb
bbbb
bbbb
bbbb
bbbb
bbbb
bbbb
bbbb
bbbb
bbbb
bbbb
bbbb
bbbb
bbbb
bbbb
bbbb
bbbb
bbbb
bbbb
bbbb
bbbb
bbbb
bbbb
bbbb
bbbb
bbbb
bbbb
bbbb
bbbb
bbbb
bbbb
bbbb
bbbb
bbbb
bbbb
bbbb
bbbb
bbbb
bbbb
bbbb
bbbb
bbbb
bbbb
bbbb
bbbb
bbbb
bbbb
bbbb
bbbb
bbbb
bbbb
bbbb
bbbb
bbbb
bbbb
bbbb
bbbb
bbbb
bbbb
bbbb
bbbb
bbbb
bbbb
bbbb
bbbb
bbbb
bbbb
bbbb
bbbb
bbbb
bbbb
bbbb
bbbb
bbbb
bbbb
bbbb
bbbb
bbbb
bbbb
bbbb
bbbb
bbbb
bbbb
bbbb
bbbb
bbbb
bbbb
bbbb
bbbb
bbbb
bbbb
bbbb
bbbb
bbbb
bbbb
bbbb
bbbb
bbbb
bbbb
bbbb
bbbb
bbbb
bbbb
bbbb
bbbb
bbbb
bbbb
bbbb
bbbb
bbbb
bbbb
bbbb
bbbb
bbbb
bbbb
bbbb
bbbb
bbbb
bbbb
bbbb
bbbb
bbbb
bbbb
bbbb
bbbb
bbbb
bbbb
bbbb
bbbb
bbbb
bbbb
bbbb
bbbb
bbbb
bbbb
bbbb
bbbb
bbbb
bbbb
bbbb
bbbb
bbbb
bbbb
bbbb
bbbb
bbbb
bbbb
bbbb
bbbb
bbbb
bbbb
bbbb
bbbb
bbbb
bbbb
bbbb
bbbb
bbbb
bbbb
bbbb
bbbb
bbbb
bbbb
bbbb
bbbb
bbbb
bbbb
bbbb
bbbb
bbbb
bbbb
bbbb
bbbb
bbbb
bbbb
bbbb
bbbb
bbbb
bbbb
bbbb
bbbb
bbbb
bbbb
bbbb
bbbb
bbbb
bbbb
bbbb
bbbb
bbbb
bbbb
bbbb
bbbb
bbbb
bbbb
bbbb
bbbb
bbbb
bbbb
bbbb
bbbb
bbbb
bbbb
bbbb
bbbb
bbbb
bbbb
bbbb
bbbb
bbbb
bbbb
bbbb
bbbb
bbbb
bbbb
bbbb
bbbb
bbbb
bbbb
bbbb
bbbb
bbbb
bbbb
bbbb
bbbb
bbbb
bbbb
bbbb
bbbb
bbbb
bbbb
bbbb
bbbb
bbbb
bbbb
bbbb
bbbb
bbbb
bbbb
bbbb
bbbb
bbbb
bbbb
bbbb
bbbb
bbbb
bbbb
bbbb
bbbb
bbbb
bbbb
bbbb
bbbb
bbbb
bbbb
bbbb
bbbb
bbbb
bbbb
bbbb
bbbb
bbbb
bbbb
bbbb
bbbb
bbbb
bbbb
bbbb
bbbb
bbbb
bbbb
bbbb
bbbb
bbbb
bbbb
bbbb
bbbb
bbbb
bbbb
bbbb
bbbb
bbbb
bbbb
bbbb
bbbb
bbbb
bbbb
bbbb
bbbb
bbbb
bbbb
bbbb
bbbb
bbbb
bbbb
bbbb
bbbb
bbbb
bbbb
bbbb
bbbb
bbbb
bbbb
bbbb
bbbb
bbbb
bbbb
bbbb
bbbb
bbbb
bbbb
bbbb
bbbb
bbbb
bbbb
bbbb
bbbb
bbbb
bbbb
bbbb
bbbb
bbbb
bbbb
bbbb
bbbb
bbbb
bbbb
bbbb
bbbb
bbbb
bbbb
bbbb
bbbb
bbbb
bbbb
bbbb
bbbb
bbbb
bbbb
bbbb
bbbb
bbbb
bbbb
bbbb
bbbb
bbbb
bbbb
bbbb
bbbb
bbbb
bbbb
bbbb
bbbb
bbbb
bbbb
bbbb
bbbb
bbbb
bbbb
bbbb
bbbb
bbbb
bbbb
bbbb
bbbb
bbbb
bbbb
bbbb
bbbb
bbbb
bbbb
bbbb
Bos taurus0 2 4 6 8 10 20 30 40 50 60 70 80 90 100
Percentage
Figure 2.7: Relative abundance tRNA isoacceptor families located consecutively withintRNA clusters. Four data points are shown for each combination of amino acids: Top:pairs in the same reading direction; below: pairs in opposite reading direction. Left: pairsof presumably functional tRNA, right: pairs of tRNA pseudogenes. The last three rowsand columns refer to putative Suppressor, SeC, and tRNA pseudogenes of undeterminedisoacceptor class, resp.
pseudogenes account for more than 30% of the pairs.
A comprehensive collection of co-occurrence tables is provided in [4]. See in AppendixB an example for Drosophila genus. Not surprisingly, there is a general trend towards morecomplex co-occurrence matrices for species with larger numbers of tDNAs.
Most adjacent tDNA pairs in both homogeneous and heterogeneous clusters have par-allel orientation. If the arrangements were random, we would expect that 50% of pairsare of this type. In many cases, e.g. Arabidopsis, Selaginella, Xenopus, or Danio, nearlyall pairs are in parallel. Among the anti-parallel pairs, some species have a strong bias foreither head-to-head (e.g. primates, and Cryptococcus) or tail-to-tail arrangements (Oryza
and Caenorhabiditis). Even within primates, the ratio of head-to-head and tail-to-tail pairsvaries considerably.
In most species with very large tDNA copy numbers we can expect some tDNA clustersto appear by chance. We tested this by randomizing the tDNA locations (see Methods fordetails). The results for eutherian mammals are compiled in Tab. 2.1 and in the AppendixC, a full list of random pair configuration is given in [4]. In most genomes, there aresignificantly more tDNA pairs than expected, suggesting a mode of tDNA evolution of
26
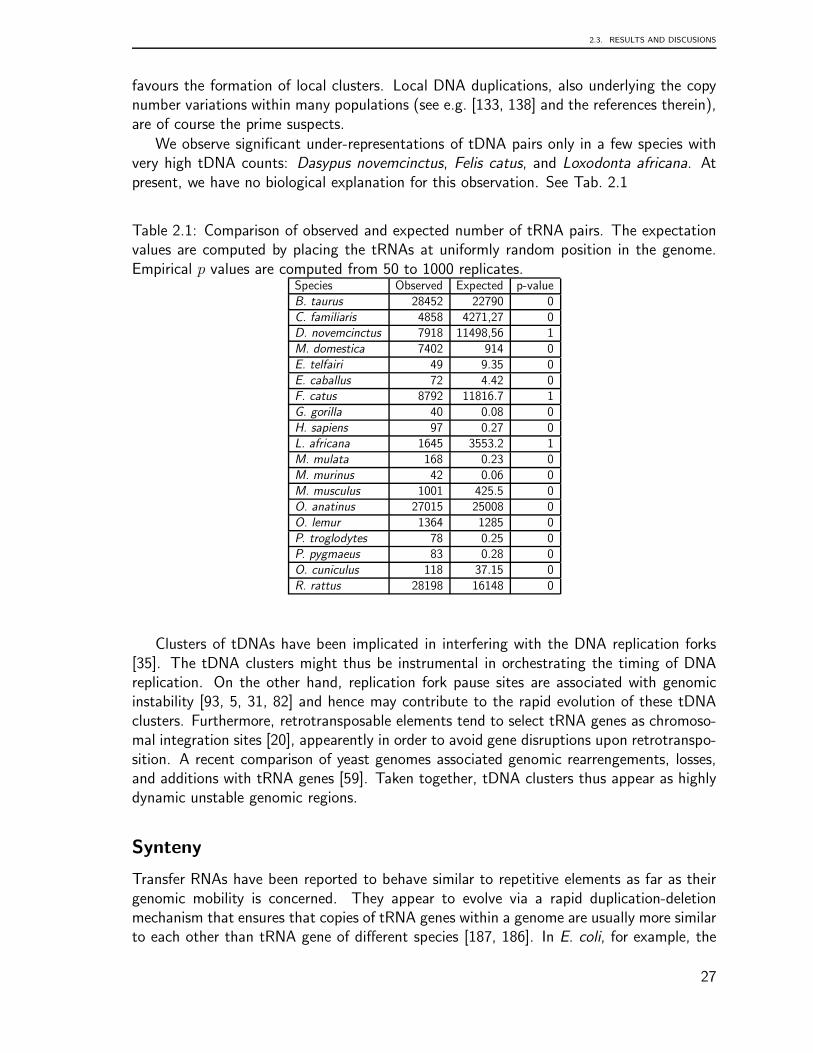
2.3. RESULTS AND DISCUSIONS
favours the formation of local clusters. Local DNA duplications, also underlying the copynumber variations within many populations (see e.g. [133, 138] and the references therein),are of course the prime suspects.
We observe significant under-representations of tDNA pairs only in a few species withvery high tDNA counts: Dasypus novemcinctus, Felis catus, and Loxodonta africana. Atpresent, we have no biological explanation for this observation. See Tab. 2.1
Table 2.1: Comparison of observed and expected number of tRNA pairs. The expectationvalues are computed by placing the tRNAs at uniformly random position in the genome.Empirical p values are computed from 50 to 1000 replicates.
Species Observed Expected p-valueB. taurus 28452 22790 0C. familiaris 4858 4271,27 0D. novemcinctus 7918 11498,56 1M. domestica 7402 914 0E. telfairi 49 9.35 0E. caballus 72 4.42 0F. catus 8792 11816.7 1G. gorilla 40 0.08 0H. sapiens 97 0.27 0L. africana 1645 3553.2 1M. mulata 168 0.23 0M. murinus 42 0.06 0M. musculus 1001 425.5 0O. anatinus 27015 25008 0O. lemur 1364 1285 0P. troglodytes 78 0.25 0P. pygmaeus 83 0.28 0O. cuniculus 118 37.15 0R. rattus 28198 16148 0
Clusters of tDNAs have been implicated in interfering with the DNA replication forks[35]. The tDNA clusters might thus be instrumental in orchestrating the timing of DNAreplication. On the other hand, replication fork pause sites are associated with genomicinstability [93, 5, 31, 82] and hence may contribute to the rapid evolution of these tDNAclusters. Furthermore, retrotransposable elements tend to select tRNA genes as chromoso-mal integration sites [20], appearently in order to avoid gene disruptions upon retrotranspo-sition. A recent comparison of yeast genomes associated genomic rearrengements, losses,and additions with tRNA genes [59]. Taken together, tDNA clusters thus appear as highlydynamic unstable genomic regions.
Synteny
Transfer RNAs have been reported to behave similar to repetitive elements as far as theirgenomic mobility is concerned. They appear to evolve via a rapid duplication-deletionmechanism that ensures that copies of tRNA genes within a genome are usually more similarto each other than tRNA gene of different species [187, 186]. In E. coli, for example, the
27
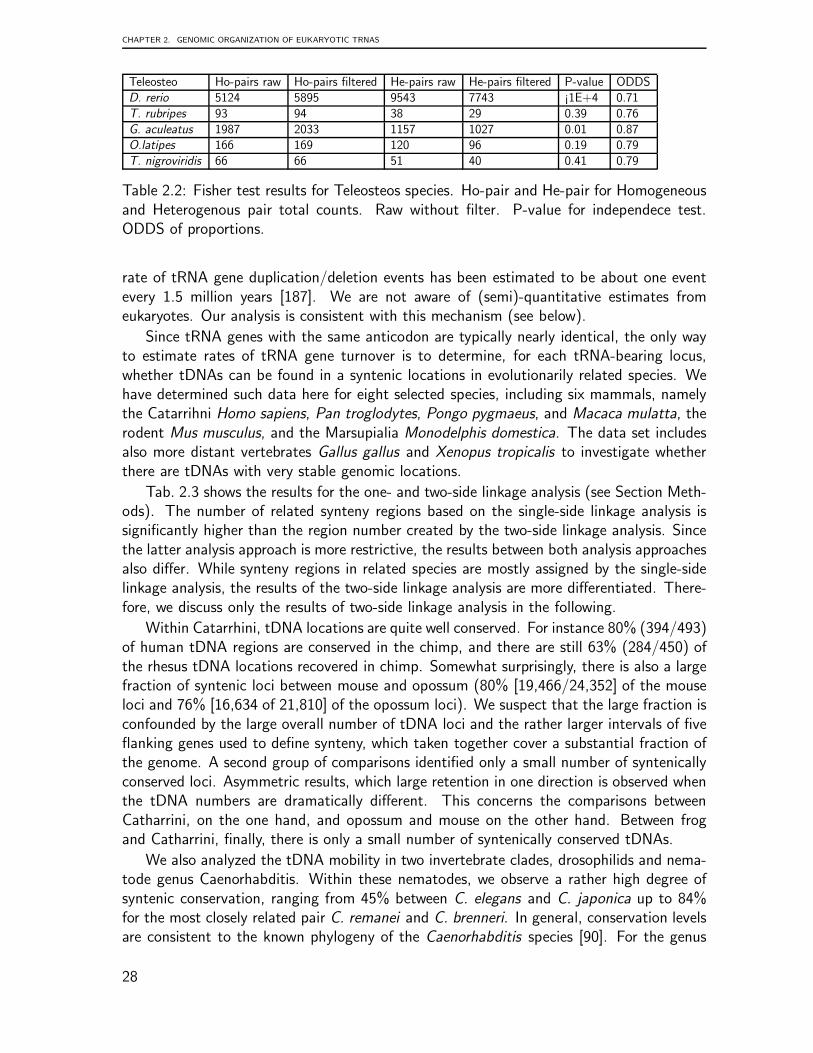
CHAPTER 2. GENOMIC ORGANIZATION OF EUKARYOTIC TRNAS
Teleosteo Ho-pairs raw Ho-pairs filtered He-pairs raw He-pairs filtered P-value ODDSD. rerio 5124 5895 9543 7743 ¡1E+4 0.71T. rubripes 93 94 38 29 0.39 0.76G. aculeatus 1987 2033 1157 1027 0.01 0.87O.latipes 166 169 120 96 0.19 0.79T. nigroviridis 66 66 51 40 0.41 0.79
Table 2.2: Fisher test results for Teleosteos species. Ho-pair and He-pair for Homogeneousand Heterogenous pair total counts. Raw without filter. P-value for independece test.ODDS of proportions.
rate of tRNA gene duplication/deletion events has been estimated to be about one eventevery 1.5 million years [187]. We are not aware of (semi)-quantitative estimates fromeukaryotes. Our analysis is consistent with this mechanism (see below).
Since tRNA genes with the same anticodon are typically nearly identical, the only wayto estimate rates of tRNA gene turnover is to determine, for each tRNA-bearing locus,whether tDNAs can be found in a syntenic locations in evolutionarily related species. Wehave determined such data here for eight selected species, including six mammals, namelythe Catarrihni Homo sapiens, Pan troglodytes, Pongo pygmaeus, and Macaca mulatta, therodent Mus musculus, and the Marsupialia Monodelphis domestica. The data set includesalso more distant vertebrates Gallus gallus and Xenopus tropicalis to investigate whetherthere are tDNAs with very stable genomic locations.
Tab. 2.3 shows the results for the one- and two-side linkage analysis (see Section Meth-ods). The number of related synteny regions based on the single-side linkage analysis issignificantly higher than the region number created by the two-side linkage analysis. Sincethe latter analysis approach is more restrictive, the results between both analysis approachesalso differ. While synteny regions in related species are mostly assigned by the single-sidelinkage analysis, the results of the two-side linkage analysis are more differentiated. There-fore, we discuss only the results of two-side linkage analysis in the following.
Within Catarrhini, tDNA locations are quite well conserved. For instance 80% (394/493)of human tDNA regions are conserved in the chimp, and there are still 63% (284/450) ofthe rhesus tDNA locations recovered in chimp. Somewhat surprisingly, there is also a largefraction of syntenic loci between mouse and opossum (80% [19,466/24,352] of the mouseloci and 76% [16,634 of 21,810] of the opossum loci). We suspect that the large fraction isconfounded by the large overall number of tDNA loci and the rather larger intervals of fiveflanking genes used to define synteny, which taken together cover a substantial fraction ofthe genome. A second group of comparisons identified only a small number of syntenicallyconserved loci. Asymmetric results, which large retention in one direction is observed whenthe tDNA numbers are dramatically different. This concerns the comparisons betweenCatharrini, on the one hand, and opossum and mouse on the other hand. Between frogand Catharrini, finally, there is only a small number of syntenically conserved tDNAs.
We also analyzed the tDNA mobility in two invertebrate clades, drosophilids and nema-tode genus Caenorhabditis. Within these nematodes, we observe a rather high degree ofsyntenic conservation, ranging from 45% between C. elegans and C. japonica up to 84%for the most closely related pair C. remanei and C. brenneri. In general, conservation levelsare consistent to the known phylogeny of the Caenorhabditis species [90]. For the genus
28
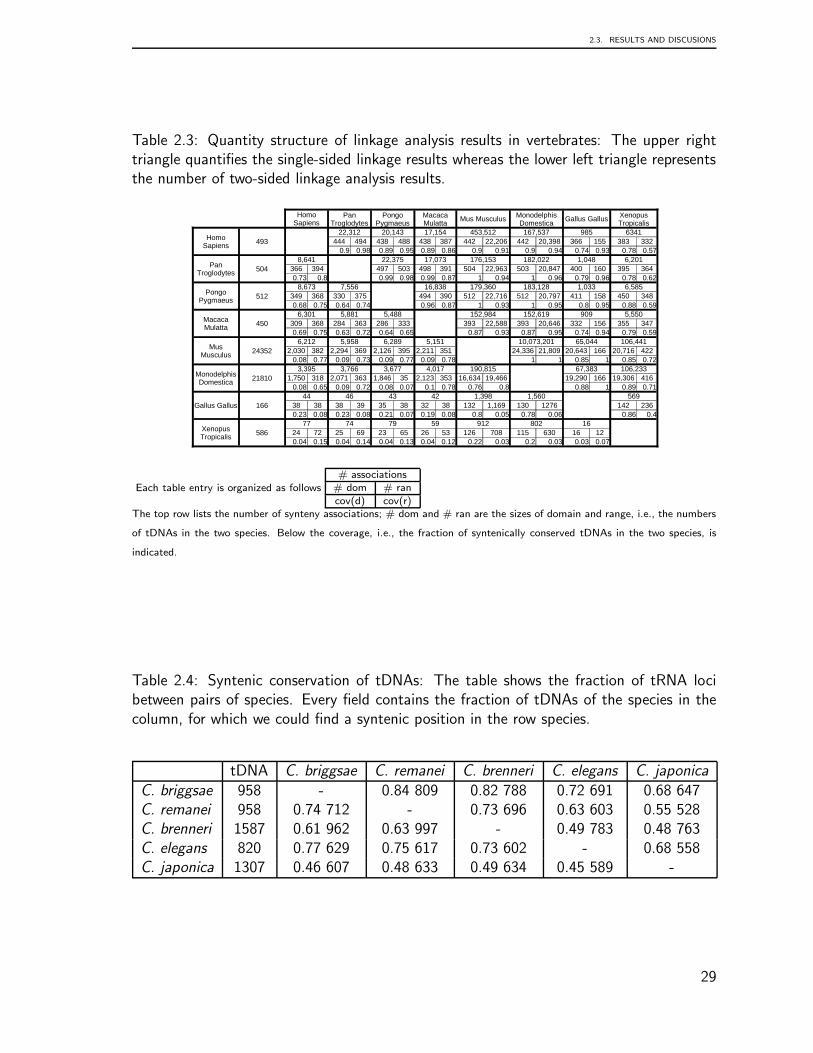
2.3. RESULTS AND DISCUSIONS
Table 2.3: Quantity structure of linkage analysis results in vertebrates: The upper righttriangle quantifies the single-sided linkage results whereas the lower left triangle representsthe number of two-sided linkage analysis results.
���
������ ������ ����� ����� ����� �� ���
��� ��� ��� ��� ��� ��� ��� ����� ��� ������ � � ��� ���
��� ���� ���� ��� ���� ��� ��� ���� ��� ���� ���� ���� ���� ���
��
���� ����� ������ ����� ������� ����� ����
� ��� ��� �� ��� ��� �� ����� �� ������ ��� �� �� ��
���� ��� ���� ���� ���� ���� � ���� � ��� ���� ��� ���� ���
��
���� �� ����� ������ ������� ����� ��
��� �� ��� �� ��� ��� �� ����� �� ������ ��� �� �� ���
��� ��� ��� ���� ��� ���� � ���� � ��� ��� ��� ���� ���
��
���� ���� ���� ������ ����� ��� ��
��� �� ��� �� �� ��� ��� ����� ��� ���� ��� � � ���
��� ��� ��� ���� ��� �� ���� ���� ���� ��� ���� ���� ���� ���
����
���� ��� ���� ��� ���������� ���� ������
����� ��� ����� �� ���� �� ����� �� ����� ������ ����� � ����� ���
���� ���� ���� ���� ���� ���� ���� ���� � � ��� � ��� ����
�����
���� ��� ���� ����� ������ ����� ������
���� ��� ����� �� ���� � ����� �� ���� ���� ������ � ����� ��
���� �� ���� ���� ���� ���� ��� ���� ��� ��� ���� � ���� ����
�
�� � �� �� ����� ��� �
�� �� �� �� � �� �� �� ��� ���� ��� ��� ��� ��
���� ���� ���� ���� ���� ���� ���� ���� ��� ��� ���� ��� ��� ���
�
�� �� �� � ��� ��� �
�� �� � � �� � � �� ��� �� �� � ��
���� ��� ���� ���� ���� ���� ���� ���� ���� ���� ��� ���� ���� ����
�����������
���������������
������������ �
!�"�"��! �����
! ��! �" � �!�������#���$������"�
%��� ��%��� �&���� �������"����
�����������
���������������
������������ �
!�"�"��! �����
! ��! �" � �
!�������#���$������"�
%��� ��%��� �
&���� �������"����
Each table entry is organized as follows# associations
# dom # rancov(d) cov(r)
The top row lists the number of synteny associations; # dom and # ran are the sizes of domain and range, i.e., the numbers
of tDNAs in the two species. Below the coverage, i.e., the fraction of syntenically conserved tDNAs in the two species, is
indicated.
Table 2.4: Syntenic conservation of tDNAs: The table shows the fraction of tRNA locibetween pairs of species. Every field contains the fraction of tDNAs of the species in thecolumn, for which we could find a syntenic position in the row species.
tDNA C. briggsae C. remanei C. brenneri C. elegans C. japonica
C. briggsae 958 - 0.84 809 0.82 788 0.72 691 0.68 647C. remanei 958 0.74 712 - 0.73 696 0.63 603 0.55 528C. brenneri 1587 0.61 962 0.63 997 - 0.49 783 0.48 763C. elegans 820 0.77 629 0.75 617 0.73 602 - 0.68 558C. japonica 1307 0.46 607 0.48 633 0.49 634 0.45 589 -
29
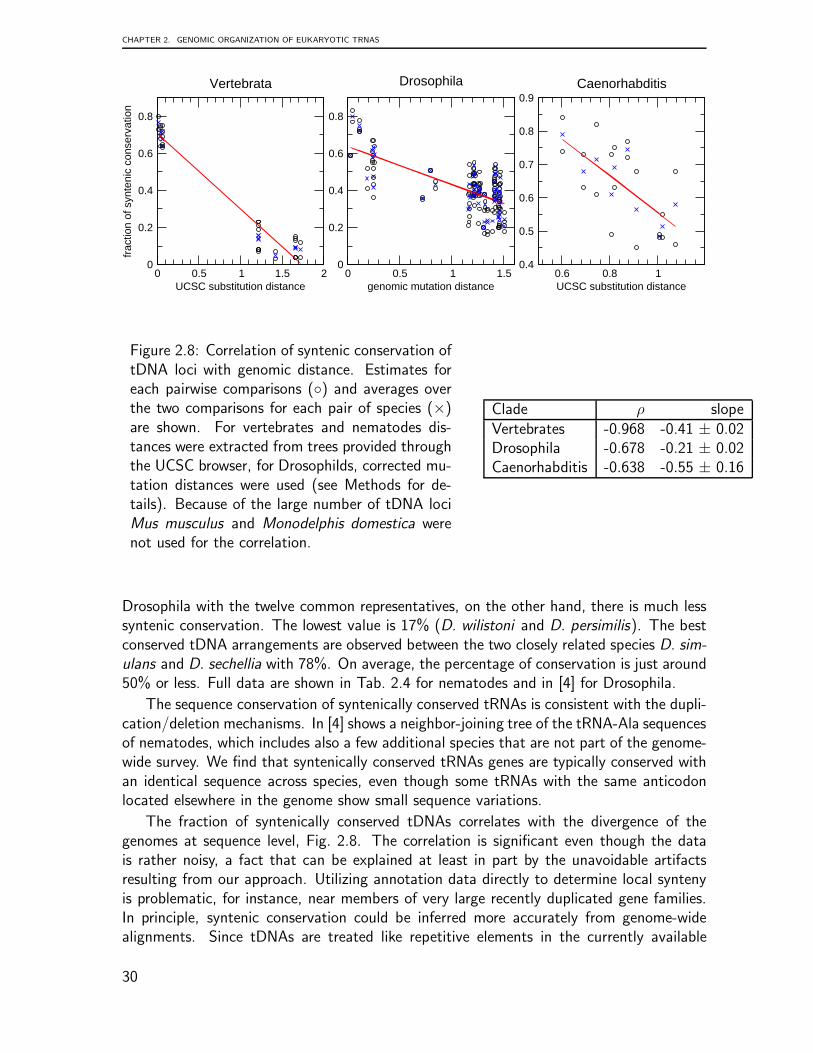
CHAPTER 2. GENOMIC ORGANIZATION OF EUKARYOTIC TRNAS
0 0.5 1 1.5 2UCSC substitution distance
0
0.2
0.4
0.6
0.8fr
actio
n of
syn
teni
c co
nser
vatio
n
Vertebrata
0 0.5 1 1.5genomic mutation distance
0
0.2
0.4
0.6
0.8
Drosophila
0.6 0.8 1UCSC substitution distance
0.4
0.5
0.6
0.7
0.8
0.9Caenorhabditis
Figure 2.8: Correlation of syntenic conservation oftDNA loci with genomic distance. Estimates foreach pairwise comparisons (◦) and averages overthe two comparisons for each pair of species (×)are shown. For vertebrates and nematodes dis-tances were extracted from trees provided throughthe UCSC browser, for Drosophilds, corrected mu-tation distances were used (see Methods for de-tails). Because of the large number of tDNA lociMus musculus and Monodelphis domestica werenot used for the correlation.
Clade ρ slopeVertebrates -0.968 -0.41 ± 0.02Drosophila -0.678 -0.21 ± 0.02Caenorhabditis -0.638 -0.55 ± 0.16
Drosophila with the twelve common representatives, on the other hand, there is much lesssyntenic conservation. The lowest value is 17% (D. wilistoni and D. persimilis). The bestconserved tDNA arrangements are observed between the two closely related species D. sim-
ulans and D. sechellia with 78%. On average, the percentage of conservation is just around50% or less. Full data are shown in Tab. 2.4 for nematodes and in [4] for Drosophila.
The sequence conservation of syntenically conserved tRNAs is consistent with the dupli-cation/deletion mechanisms. In [4] shows a neighbor-joining tree of the tRNA-Ala sequencesof nematodes, which includes also a few additional species that are not part of the genome-wide survey. We find that syntenically conserved tRNAs genes are typically conserved withan identical sequence across species, even though some tRNAs with the same anticodonlocated elsewhere in the genome show small sequence variations.
The fraction of syntenically conserved tDNAs correlates with the divergence of thegenomes at sequence level, Fig. 2.8. The correlation is significant even though the datais rather noisy, a fact that can be explained at least in part by the unavoidable artifactsresulting from our approach. Utilizing annotation data directly to determine local syntenyis problematic, for instance, near members of very large recently duplicated gene families.In principle, syntenic conservation could be inferred more accurately from genome-widealignments. Since tDNAs are treated like repetitive elements in the currently available
30
2.3. RESULTS AND DISCUSIONS
pipelines, this strategy cannot be employed in practice. Nevertheless, the method providesat least a crude estimate of the tDNA turnover rate, indicating the tDNAs are relocated attime-scales only 2-5 times slower than background mutation rate, i.e., at an evolutionarydistance of 1 mutation per site, 20% to 60% of the tDNAs have been deleted or relocatedin one lineage.
These values should be regarded as upper bounds of syntenic conservation, i.e., tDNAturnover is probably even faster. For example, the identity of the tDNA (i.e., its anticodon)was not used in the analysis. Despite of the high mobility of tDNAs there are someancient conserved loci. We further investigated two of the 77 syntenic loci conservedbetween Xenopus and Human in which tDNAs with the same anticodon were retained.Manual inspection of the flanking protein coding genes confirmed synteny. Neither locus issyntenically conserved in stickleback, lamprey or lancet, however.
Codon bias usage in Platyhelminth
The variation of tRNA gene numbers might also be explained by the codon usage-tRNAoptimization that has been fiercely debated. However, it is not clear whether codon usagedrives tRNA evolution or vice versa and the codon bias specie-specific is still widely debated.A survey in bacterial genomes [69] has established a theory that describes the coevolutionof codon usage with tRNA gene content however still remains to be evaluated whether thistheory could explain the variations observed across Eukaryotic genomes. In this order ofideas we have used for comparison three free-living platyhelminth to search for codon usagebias.
Candidate tDNAs were predicted with tRNAscan-SE in the genomes of Schistosoma
mansoni, Schistosoma japonicum and Schmidtea mediterranea. After removal of trans-posable element sequences (see below), tRNAscan predicted a total of 713 tRNAs for S.
mansoni and 739 for S. mediterranea, while 154 tRNAs were found in the S. japonicum
sequences. These included tRNAs encoding the standard 20 amino acids of the traditionalgenetic code, selenocysteine encoding tRNAs (tRNAsec) [156] and possible suppressor tR-NAs [8] in all three genomes. The tRNAsec from schistosomes has been characterized, andis similar in both size and structure to tRNAsec from other eukaryotes [78].
The tRNA complements of the three platyhelminth genomes are compared in detail inFig. 2.9. The amino acids are represented in approximately equal numbers in S. mansoni andSchmidtea. Nevertheless, there are several notable deviations. S. mansoni contains manymore leucine (86 vs. 46) and histidine (27 vs. 8) tRNAs, while serine (51 vs. 94), cysteine (21vs. 44), methionine (21 vs. 44), and isoleucine (17 vs. 42) are underrepresented. In addition,there are several substantial differences in codon usage. In most cases, S. mansoni has amore diverse repertoire of tRNAs: tRNA-Asn-ATT, tRNA-Arg-CGC, tRNA-His-ATG, tRNA-Ile-GAT, tRNA-Pro-GGG, tRNA-Tyr-ATA, tRNA-Val-GAC are missing in Schmidtea. OnlytRNA-Ser-ACT is present in Schmidtea but absent in Schistosoma. The tRNA complementof S. japonicum, on the other hand, differs strongly from its two relatives. Not only isthe number of tRNAs decreased by more than a factor of four, S. japonicum also prefersanticodons that are absent or rare in its relatives, such as tRNA-Ala-GGC, tRNA-Cys-ACA,and Lys-CTT. On the other hand, no tRNA-Trp was found. Since the UGG codon is presentin many open reading frames we interpret this a problem with the incompleteness of the
31
CHAPTER 2. GENOMIC ORGANIZATION OF EUKARYOTIC TRNAS
genome assembly rather than a genuine gene loss. The reduction in the number of tRNAsis also evident by comparing the number of tRNAs with introns: 27 in S. mansoni versus 5in S. japonicum.
It has been shown recently that changes in codon usage, even while coding the sameprotein sequences, can severely attenuate the virulence of viral pathogens [24] by “de-optimizing” translational efficiency. This observation leads us to speculate that the greaterdiversity of the tRNA repertoire could be related to the selection pressures of the parasiticlife-style of S. mansoni. The effect is not straight forward, however, because there isno significant correlation of tRNA copy numbers with the overall codon usage in bothS. mansoni and S. japonicum, Fig. 2.9C. In contrast, a weak but statistically significantcorrelation can be observed in Schmidtea mediterranea. It would be interesting, therefore,to investigate in detail whether there are differences in codon usage of proteins that arehighly expressed in different stages of S. mansoni ’s life cycle, and whether the relativeexpression levels of tRNAs are under stage-specific regulation.
The most striking result of the tRNAscan-SE analysis was the initial finding of 1,135glutamine tRNAs (Gln-tRNAs) in S. mansoni in contrast to the 8 Gln-tRNAs in S. japonicum
and 65 in S. mediterranea. Nearly all of these (1,098 in S. mansoni) were tRNA-Gln-TTG.In addition, an extreme number of 1,824 tRNA-pseudogenes in S. mansoni (vs. 951 in S.
japonicum and 19 in S. mediterranea) was predicted. Of these, 1,270 were also homologousto tRNA-Gln-TTG. These two groups of tRNA-Gln-TTG-derived genes (those predicted tobe pseudogenes and those predicted to be functional tRNAs) totaled 2,368. These highnumbers suggest a tRNA-derived mobile genetic element. We therefore ran the 2,368 S.
mansoni tRNA-Gln-TTG genes through the RepeatMasker program [159]. Almost all ofthem (2,342) were classified as SINE elements. Further BLAST analysis revealed that theseelements are similar to members of the Sm-α family of S. mansoni SINE elements [161].Removal of these SINE-like elements yielded a total of 63 predicted glutamine-encodingtRNAs in S. mansoni. About 650 of 951 pseudogenes in S. japonicum derived from tRNA-Pro-CGG.
Homology-based analysis yielded similar, though somewhat less sensitive, results to thoseof tRNAscan-SE. For instance, a BLAST search in S. mansoni with Rfam’s tRNA consensusyielded 617 predicted tRNAs compared to the 663 predictions made by tRNAscan.
2.4 Conclusions
We have developed a pipeline based on tRNAscan-SE [111] to extract and analyze thelocations of tRNA genes and pseudogenes of eukaryotic genomes. In our analysis, wefocus not only on the number of tRNA genes, but also on their relative genomic locations,and in particular on the formation of tDNA clusters. Surprisingly, we found no distinctiveclade-specific features or large scale trends, with the exception of the rather straightforwardobservation that the larger metazoan genomes typically tend to harbour large numbers oftDNAs.
In some species, large clusters of tDNAs occur. This effect has first been reported inEntamoeba histolytica. The origin of this gene organization in the genus Entamoeba clearlypredates the common ancestor of the species investigated to date. Their function of the
32
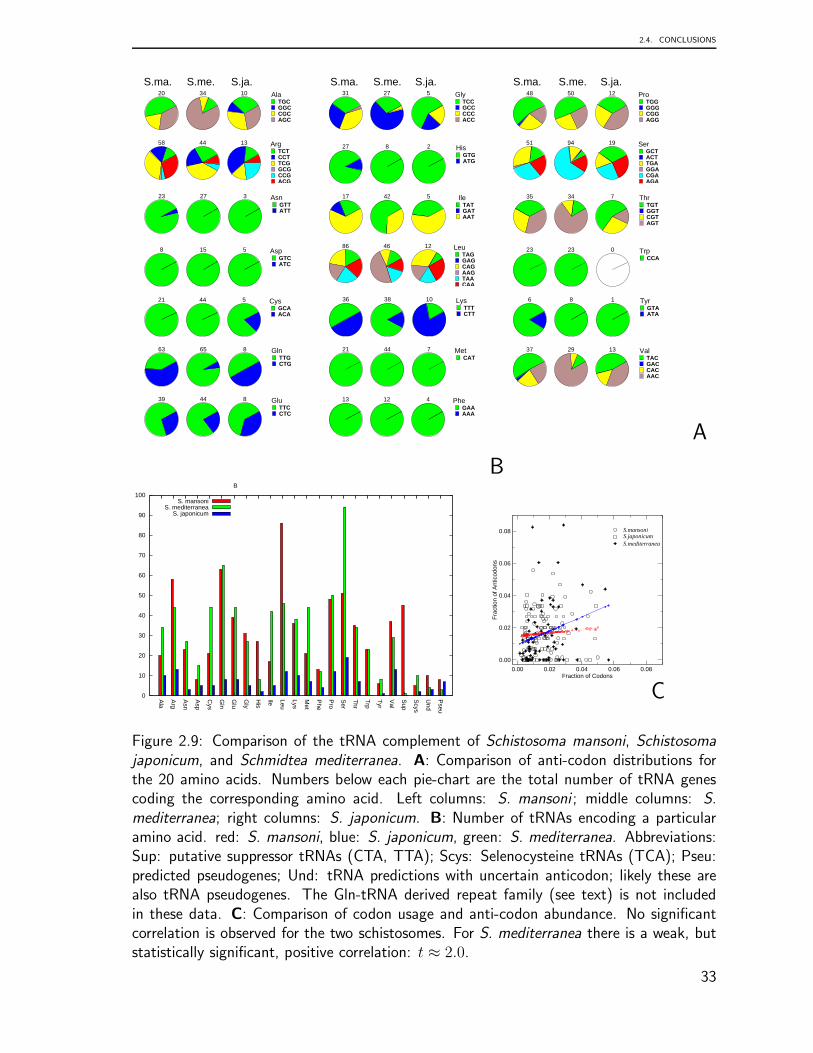
2.4. CONCLUSIONS
TGCGGCCGCAGC
20 34 10 AlaTCCGCCCCCACC
31 27 5 GlyTGGGGGCGGAGG
48 50 12 Pro
TCTCCTTCGGCGCCGACG
58 44 13 Arg
GTGATG
27 8 2 His GCTACTTGAGGACGAAGA
51 94 19 Ser
GTTATT
23 27 3 AsnTATGATAAT
17 42 5 IleTGTGGTCGTAGT
35 34 7 Thr
GTCATC
8 15 5 Asp TAGGAGCAGAAGTAACAA
86 46 12 Leu
CCA23 23 0 Trp
GCAACA
21 44 5 CysTTTCTT
36 38 10 LysGTAATA
6 8 1 Tyr
TTGCTG
63 65 8 GlnCAT
21 44 7 MetTACGACCACAAC
37 29 13 Val
TTCCTC
39 44 8 GluGAAAAA
13 12 4 Phe
S.ma. S.me. S.ja. S.ma. S.me. S.ja. S.ma. S.me. S.ja.
A
0
10
20
30
40
50
60
70
80
90
100
Ala
Arg
Asn
Asp
Cys
Gln
Glu
Gly
His
Ile Leu
Lys
Met
Phe
Pro
Ser
Thr
Trp
Tyr
Val
Sup
Scys
Und
Pseu
B
S. mansoniS. mediterranea
S. japonicum
B
0.00 0.02 0.04 0.06 0.08Fraction of Codons
0.00
0.02
0.04
0.06
0.08
Fra
ctio
n of
Ant
icod
ons
S.mansoniS.japonicumS.mediterranea
C
Figure 2.9: Comparison of the tRNA complement of Schistosoma mansoni, Schistosoma
japonicum, and Schmidtea mediterranea. A: Comparison of anti-codon distributions forthe 20 amino acids. Numbers below each pie-chart are the total number of tRNA genescoding the corresponding amino acid. Left columns: S. mansoni ; middle columns: S.
mediterranea; right columns: S. japonicum. B: Number of tRNAs encoding a particularamino acid. red: S. mansoni, blue: S. japonicum, green: S. mediterranea. Abbreviations:Sup: putative suppressor tRNAs (CTA, TTA); Scys: Selenocysteine tRNAs (TCA); Pseu:predicted pseudogenes; Und: tRNA predictions with uncertain anticodon; likely these arealso tRNA pseudogenes. The Gln-tRNA derived repeat family (see text) is not includedin these data. C: Comparison of codon usage and anti-codon abundance. No significantcorrelation is observed for the two schistosomes. For S. mediterranea there is a weak, butstatistically significant, positive correlation: t ≈ 2.0.
33
CHAPTER 2. GENOMIC ORGANIZATION OF EUKARYOTIC TRNAS
array-like structure remains unclear [177]. We report here that this phenomenon is notrestricted to a particular clade of protists but rather appears independently in many timesthroughout eukaryotes.
In most eukaryotes, tRNAs are multi-copy genes with little or no distinction betweenparalogs so that orthology is hard to establish, in particular in the presence of tRNA geneclusters. As a consequence, the evolution of genomic tRNA arrangements is non-trivial tostudy over larger time-scales. Upper bounds on syntenic conservation can be estimated,however, by considering small sets of flanking protein coding genes for which homologyinformation can be retrieved from existing annotation. We found that tRNAs changetheir genomic location at time-scales comparable to mutation rates: syntenic conservationfades at roughly the same evolutionary distances as sequence conservation in unconstrainedregions.
The absence of large numbers of partially degraded tRNA copies in many of the in-vestigated genomes provides a hint at the mechanisms of tRNA mobility: At least in partthe relocation events appear to be linked to chromosomal rearrangements rather than mereduplication-deletion of the tRNA genes themselves. The latter mechanism, which appearsto be prevalent e.g. in mitochondrial genomes [144], certainly also plays a role, since tRNApseudogenes are readily observed in many species, as do tRNA retrogenes [183]. A linkbetween tRNA loci, and in particular tRNA clusters, and chromosomal instability has beenpointed out repeatedly in the literature, showing that tRNA genes can interfere with thereplication forks [35, 93, 5, 31, 82]. The data collected here provide a basis to investigatethis connection more systematically in the future.
Overall, the tRNA complement of Eukaryotes is highly dynamic part of the genomeswhose organization evolves rapidly and in a highly lineage specific manner — a behaviorthat is in striking contrast to the extreme conservation of sequence and function of thetRNAs themselves.
34
Chapter 3
non-coding RNA identification fromtranscriptome data
3.1 Introduction
In recent years, several classes of small RNAs with a length of about 20 nt have beendiscovered. The most prominent of these are microRNAs (miRNAs), Piwi-interacting RNAs(piRNAs), and variants of endogenous small interfering RNAs (siRNAs) [122, 176]. Inaddition, small RNAs have been found to be associated with mRNA transcription startand stop sites [86, 169, 171]. Several studies have reported that well-known ncRNA lociare also processed to give rise to small RNAs. MicroRNA precursor hairpins, for instance,are frequently processed to produce additional “off-set RNAs” (moRNAs) that appear tofunction like mature miRNAs. These moRNAs were discovered in Ciona intestinalis [157],where they form an abundant class of processing products. At much lower expression levels,they can also be found in the human transcriptome [94]. Specific cleavage and processingof tRNAs has been observed in the fungus Aspergillus fumigatus [19] and later also found inhuman short read sequencing data [87]. Small nucleolar RNAs (snoRNAs) are also widelyused as a source for specific miRNA-like short RNAs [44, 151, 170]. The same holds truefor vault RNAs [162, 139].
The ENCODE project, focusing on high resolution on the analysis of 1% has also shownthat RNA transcripts serve as a high source of new regulatory ncRNAs [14]. This focus bythe ENCODE project should lead to future efforts to conduct studies to identify new ncRNAsin a variety of organisms and to elucidate their regulatory functions in the cell. Increasingattention directed to miRNAs as regulatory factors shaping cellular and organismal life,along with the discovery of many new miRNAs from deep sequencing data, has spurred thestudy of complete small ncRNA transcriptomes. These complete transcriptome studies havedated from those of kinetoplast mitochondria of Leishmania tarentolae and Caenorhabditis
elegans, from which genomic features and new ncRNAs were reported as stem-bulge RNAs(sbRNAs) and snRNA-like RNAs (snlRNAs). These initial reports found that the majorityof the C. elegans ncRNAs showed developmentally variable expression [30]. The same holdsfor Aspergillus fumigatus; an experimental screening of ncRNAs found that the majoritywere expressed under various growth conditions or during specific developmental stages [19].In recent years, studies of this kind have extended to the investigation of small ncRNAs
35
CHAPTER 3. NON-CODING RNA IDENTIFICATION FROM TRANSCRIPTOME DATA
associated with ribonucleoprotein particles (RNPs) from two different cellular systems andorganisms: brain and HeLa cells from mouse and human, respectively [145]. Several currentstudies have focused on the detailed analysis of tRNA derived from transcriptome data. Thistopic will be addressed in the next chapter.
RNA quality control in Eukaryotes: source from which comes the transcriptomeEukaryotic cells have numerous RNA quality controls that are important for shaping theirtranscriptomes [36]. The complexity of these systems implies a diversity of mechanisms in-volving nuclear and cytoplasmic RNAs that safeguard cells from abnormal mRNA function[81]. One example is messenger RNA surveillance systems, which monitor proper transla-tion termination [6]. Another includes the many mechanisms that have evolved to degradeaberrant and nonfunctional RNAs. For instance, the exosome is a highly organized and reg-ulated macromolecular machine that has only a few enzymatically active components and ispresent in both the nucleus and cytoplasm,. The exosome continuously works to ensure ad-equate quantities and quality of RNAs by facilitating normal RNA processing and turnover,as well as by participating in more complex RNA quality-control mechanisms [112]. Thus,mRNA surveillance mechanisms play important roles both in depleting aberrant transcriptsfrom cells and in maintaining the proper level of normal transcripts [6]. Ribosomes play acentral role in some mRNA surveillance systems, but, for the production of the vast majorityof ncRNAs in eukaryotes, ribosomes are not involved in quality control. One example ofnuclear RNA surveillance for ncRNA is the tRNA surveillance pathway in Saccharomyces
cerevisiae. This pathway utilizes polyadenylation to degrade hypomethylated tRNAiMetthrough the function of a new poly(A) polymerase, Trf4p, along with the nuclear exosome[85]. The TRAMP (Trf4/Air2/Mtr4p Polyadenylation) pathway has recently also beenshown to be associated with the degradation of rRNA and small nuclear/small nucleolarRNAs as well as the regulation of transcription from unannotated and/or silenced regionsof the genome [17]. The topic of tRNA-associated degradation will be addressed further inthe next chapter.
Mechanisms for stable RNA degradation under starvation conditions have been reportedfor bacteria [32] and some consequences of RNA quality control suggest that “normal”RNAs are subjected to degradation by quality control mechanisms. One key aspect ofthese pathways is that they could be seen as kinetic competitions between the normalrate of reaction in the life of an RNA and the quality-control event targeting the RNA fordegradation. In short, the RNA processing creates a diverse pool of transcripts and onlythose that survive quality control accumulate to substantial levels [36].
The next section will summarize our efforts to define new features for use in the char-acterization and classification of three main classes of ncRNA (microRNA, snoRNA andtRNA) from a brain-tissue transcriptome library, based on deep-sequencing methods.
3.2 Methodology
Non-coding RNA identification and classification methods from transcriptomedata Since next-generation sequencing technology is the current choice to determinecontent and class of ncRNA in the cell, several new methods have been developed that
36
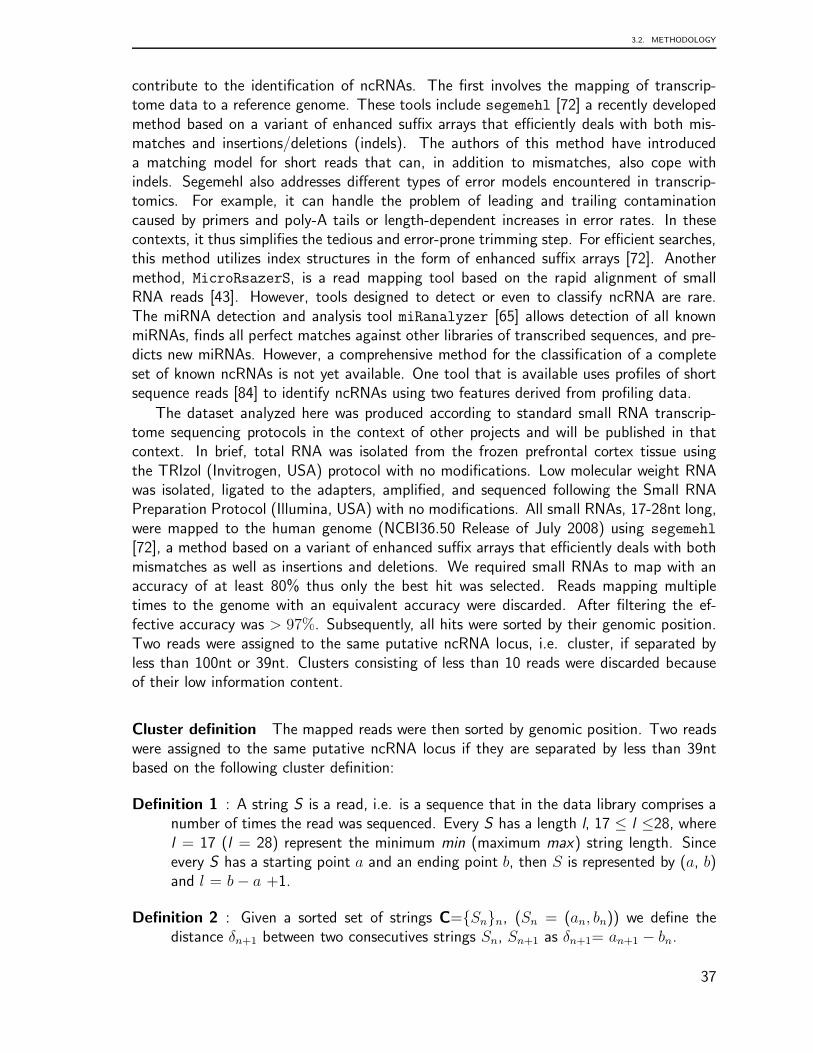
3.2. METHODOLOGY
contribute to the identification of ncRNAs. The first involves the mapping of transcrip-tome data to a reference genome. These tools include segemehl [72] a recently developedmethod based on a variant of enhanced suffix arrays that efficiently deals with both mis-matches and insertions/deletions (indels). The authors of this method have introduceda matching model for short reads that can, in addition to mismatches, also cope withindels. Segemehl also addresses different types of error models encountered in transcrip-tomics. For example, it can handle the problem of leading and trailing contaminationcaused by primers and poly-A tails or length-dependent increases in error rates. In thesecontexts, it thus simplifies the tedious and error-prone trimming step. For efficient searches,this method utilizes index structures in the form of enhanced suffix arrays [72]. Anothermethod, MicroRsazerS, is a read mapping tool based on the rapid alignment of smallRNA reads [43]. However, tools designed to detect or even to classify ncRNA are rare.The miRNA detection and analysis tool miRanalyzer [65] allows detection of all knownmiRNAs, finds all perfect matches against other libraries of transcribed sequences, and pre-dicts new miRNAs. However, a comprehensive method for the classification of a completeset of known ncRNAs is not yet available. One tool that is available uses profiles of shortsequence reads [84] to identify ncRNAs using two features derived from profiling data.
The dataset analyzed here was produced according to standard small RNA transcrip-tome sequencing protocols in the context of other projects and will be published in thatcontext. In brief, total RNA was isolated from the frozen prefrontal cortex tissue usingthe TRIzol (Invitrogen, USA) protocol with no modifications. Low molecular weight RNAwas isolated, ligated to the adapters, amplified, and sequenced following the Small RNAPreparation Protocol (Illumina, USA) with no modifications. All small RNAs, 17-28nt long,were mapped to the human genome (NCBI36.50 Release of July 2008) using segemehl
[72], a method based on a variant of enhanced suffix arrays that efficiently deals with bothmismatches as well as insertions and deletions. We required small RNAs to map with anaccuracy of at least 80% thus only the best hit was selected. Reads mapping multipletimes to the genome with an equivalent accuracy were discarded. After filtering the ef-fective accuracy was > 97%. Subsequently, all hits were sorted by their genomic position.Two reads were assigned to the same putative ncRNA locus, i.e. cluster, if separated byless than 100nt or 39nt. Clusters consisting of less than 10 reads were discarded becauseof their low information content.
Cluster definition The mapped reads were then sorted by genomic position. Two readswere assigned to the same putative ncRNA locus if they are separated by less than 39ntbased on the following cluster definition:
Definition 1 : A string S is a read, i.e. is a sequence that in the data library comprises anumber of times the read was sequenced. Every S has a length l, 17 ≤ l ≤28, wherel = 17 (l = 28) represent the minimum min (maximum max) string length. Sinceevery S has a starting point a and an ending point b, then S is represented by (a, b)and l = b− a +1.
Definition 2 : Given a sorted set of strings C={Sn}n, (Sn = (an, bn)) we define thedistance δn+1 between two consecutives strings Sn, Sn+1 as δn+1= an+1 − bn.
37
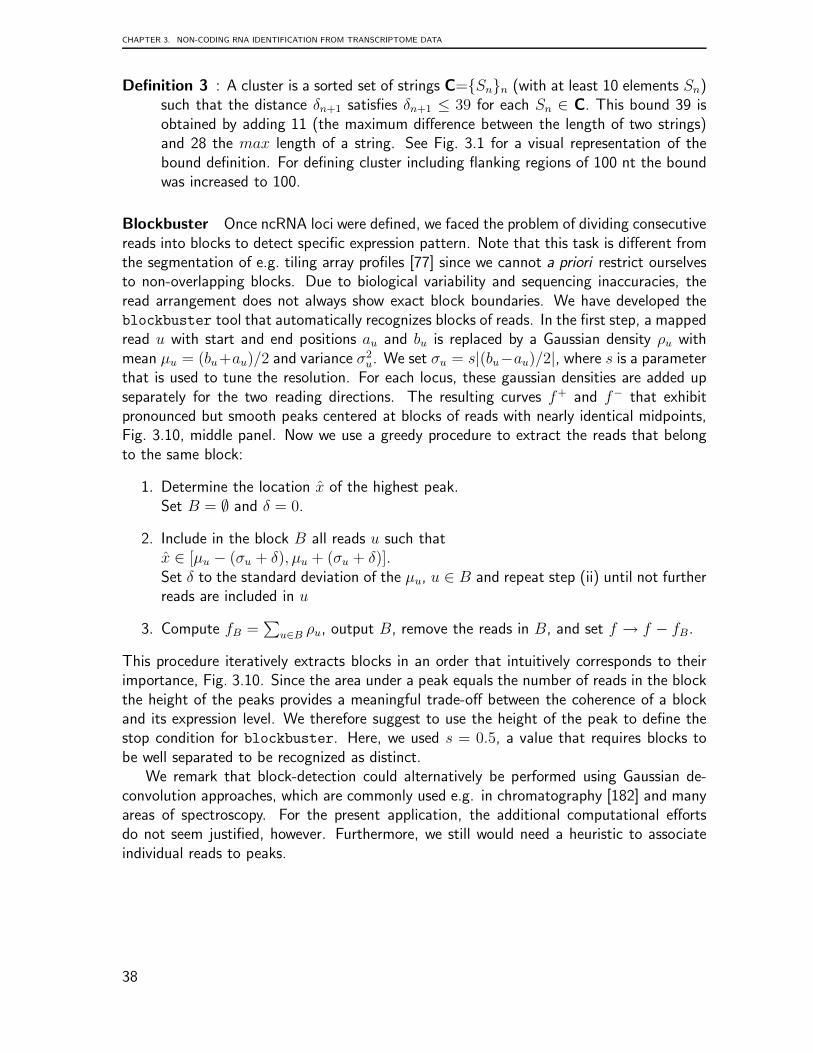
CHAPTER 3. NON-CODING RNA IDENTIFICATION FROM TRANSCRIPTOME DATA
Definition 3 : A cluster is a sorted set of strings C={Sn}n (with at least 10 elements Sn)such that the distance δn+1 satisfies δn+1 ≤ 39 for each Sn ∈ C. This bound 39 isobtained by adding 11 (the maximum difference between the length of two strings)and 28 the max length of a string. See Fig. 3.1 for a visual representation of thebound definition. For defining cluster including flanking regions of 100 nt the boundwas increased to 100.
Blockbuster Once ncRNA loci were defined, we faced the problem of dividing consecutivereads into blocks to detect specific expression pattern. Note that this task is different fromthe segmentation of e.g. tiling array profiles [77] since we cannot a priori restrict ourselvesto non-overlapping blocks. Due to biological variability and sequencing inaccuracies, theread arrangement does not always show exact block boundaries. We have developed theblockbuster tool that automatically recognizes blocks of reads. In the first step, a mappedread u with start and end positions au and bu is replaced by a Gaussian density ρu withmean µu = (bu+au)/2 and variance σ2
u. We set σu = s|(bu−au)/2|, where s is a parameterthat is used to tune the resolution. For each locus, these gaussian densities are added upseparately for the two reading directions. The resulting curves f+ and f− that exhibitpronounced but smooth peaks centered at blocks of reads with nearly identical midpoints,Fig. 3.10, middle panel. Now we use a greedy procedure to extract the reads that belongto the same block:
1. Determine the location x of the highest peak.Set B = ∅ and δ = 0.
2. Include in the block B all reads u such thatx ∈ [µu − (σu + δ), µu + (σu + δ)].Set δ to the standard deviation of the µu, u ∈ B and repeat step (ii) until not furtherreads are included in u
3. Compute fB =∑
u∈B ρu, output B, remove the reads in B, and set f → f − fB.
This procedure iteratively extracts blocks in an order that intuitively corresponds to theirimportance, Fig. 3.10. Since the area under a peak equals the number of reads in the blockthe height of the peaks provides a meaningful trade-off between the coherence of a blockand its expression level. We therefore suggest to use the height of the peak to define thestop condition for blockbuster. Here, we used s = 0.5, a value that requires blocks tobe well separated to be recognized as distinct.
We remark that block-detection could alternatively be performed using Gaussian de-convolution approaches, which are commonly used e.g. in chromatography [182] and manyareas of spectroscopy. For the present application, the additional computational effortsdo not seem justified, however. Furthermore, we still would need a heuristic to associateindividual reads to peaks.
38
3.2. METHODOLOGY
Classification and description based on Random Forests approach The RandomForest approach is a machine learning approach developed by Leo Breiman [15] and AdeleCutler. Random Forests R©is the original implementation of the algorithm. The RandomForest approach has also been implemented in WEKA [3]. Random Forests, a meta-learnercomprised of many individual trees, was designed to operate quickly over large datasetsand, more importantly, to be diverse, by using random samples to build each tree in theforest [136]. In short, Random Forests is a combination of tree predictors such that eachtree depends on the values of a random vector sampled independently and with the samedistribution as the other trees in the forest. Generalization errors depend on how largethe forests become, the strength of the individual trees in the forest, and the correlationbetween them [15]. Random Forests grows many classification trees. To classify a newobject from an input vector, the input vector is added to each of the trees in the forest.Each tree presents a classification, and we say that the tree ”votes” for that class. Theforest chooses the classification having the most votes (out of all the trees in the forest).Each tree grows as follow: if N is the number of cases in the training set, sample N casesat random - but with replacement, from the original data. This sample will be the trainingset for growing the tree. Then, if there are M input variables, a number m << M isspecified such that at each node, m variables are selected at random out of the M and thebest split on these m is used to split the node. The value of m is held constant during theforest growing, then each tree is grown to the largest extent possible. There is no pruning[2].
Two data objects generated by random forests are important for the classification, oob(out-of-bag) and proximities. When the training set for the current tree is drawn by samplingwith replacement, about one-third of the cases are left out of the sample. This oob datais used to get a running unbiased estimate of the classification error as trees are added tothe forest [15, 2]. It is also used to get estimates of variable importance. After each treeis built, all of the data are run down the tree, and proximities are computed for each pairof cases. If two cases occupy the same terminal node, their proximity is increased by one.At the end of the run, the proximities are normalized by dividing by the number of trees.Proximities are used in replacing missing data, locating outliers, and producing illuminatinglow-dimensional views of the data. Prototypes are a way of getting a picture of how thevariables relate to the classification. The final output of prototypes showed at the screen,for continuous variables are the result of standarize by subtracting the 5th percentile anddividing by the difference between the 95th and 5th percentiles. In words of Breiman [2]“For the jth class, the model find the case that has the largest number of class j casesamong its k nearest neighbors, determined using the proximities. Among these k cases themedian, 25th percentile, and 75th percentile for each variable is predicted. The mediansare the prototype for class j and the quartiles give an estimate of is stability. For the secondprototype, we repeat the procedure but only consider cases that are not among the originalk, and so on”.
In order to investigate whether the short reads patterns carry information on the par-ticular ncRNA class from which they originate, we selected three distinct ncRNA classestRNAs (n = 87), miRNAs (n = 218) and snoRNAs (n = 129) and set up a machine learn-ing approach based on the WEKA [188] implementation of the Random Forest learningscheme[188, 15] with the number trees set to 100.
39
CHAPTER 3. NON-CODING RNA IDENTIFICATION FROM TRANSCRIPTOME DATA
To define input data we have defined descriptors that represent features from the tran-scriptome profile. Based on a visual inspection of the mapped reads, ten features wereselected to train the random forest model:
• Number of blocks within a cluster (blocks),
• Length of a cluster (length).
• Number of nucleotides covered by at least two blocks (nt overlap),
• Number of overlapping blocks (block overlap).
• Maximum and minimum block height in a cluster (max and min block height).
• Mean block height in a cluster (mean block height).
• Maximum and minimum distance between consecutive blocks (max and min dis-
tance).
• Mean distance between consecutive blocks (mean distance).
Two different training sets were built by randomly sampled of the original data set. TheRandom Forest was training with training sets of size 250 and 150.
3.3 Results
Cluster detection By cluster definition, two consecutive reads were assigned to the sameputative cluster if they are separated by less than 39nt. See in methods cluster definition.This bound was defined based on the maximum max and minimum min read length. SeeFig. 3.1 for schematic representations. In order to further investigate the hidden structureof the brain-tissue transcriptome library we determined how often clusters appear into somespecific range of height (number of reads), distances of adjacent clusters and Cluster length.
For our purpose, we have explored the robustness of the mapping of segemehl [72]. thistool uses a variant of enhanced suffix arrays that efficiently deals with both mismatches aswell as insertions and deletions. Thus it is expected that the structure of the mapped libraryvaries when the number of allowed operations increased, when allowing more deletionsand/or mismatches and/or insertions. Therefore we explore the library structure for K0, K1and K4 segemehl operations i.e. 0 (for not operations), 1 (at least one operation) and 4(four operations).
We observe that the number of clusters increased as the segemehl operations increaseK0 < K1 < K4. See Tab. 3.1 and Fig. 3.2. The more abundant height is 2 to 10 readscorresponding to ≈90% of clusters. Only the 6% of the clusters gather reads that canbe comparable with some intensity signal of experimental RNA expression and one smallfraction (≈ 0.25%) of clusters comprise more that 50 reads. Then about ≈7240 clustersmight correspond to annotated loci and to new loci candidates.
We also counted how often two consecutive clusters are located to some thresholdsof distance, see Tab. 3.2 and Fig. 3.2. Some clusters are overlapping in opposite sense
40
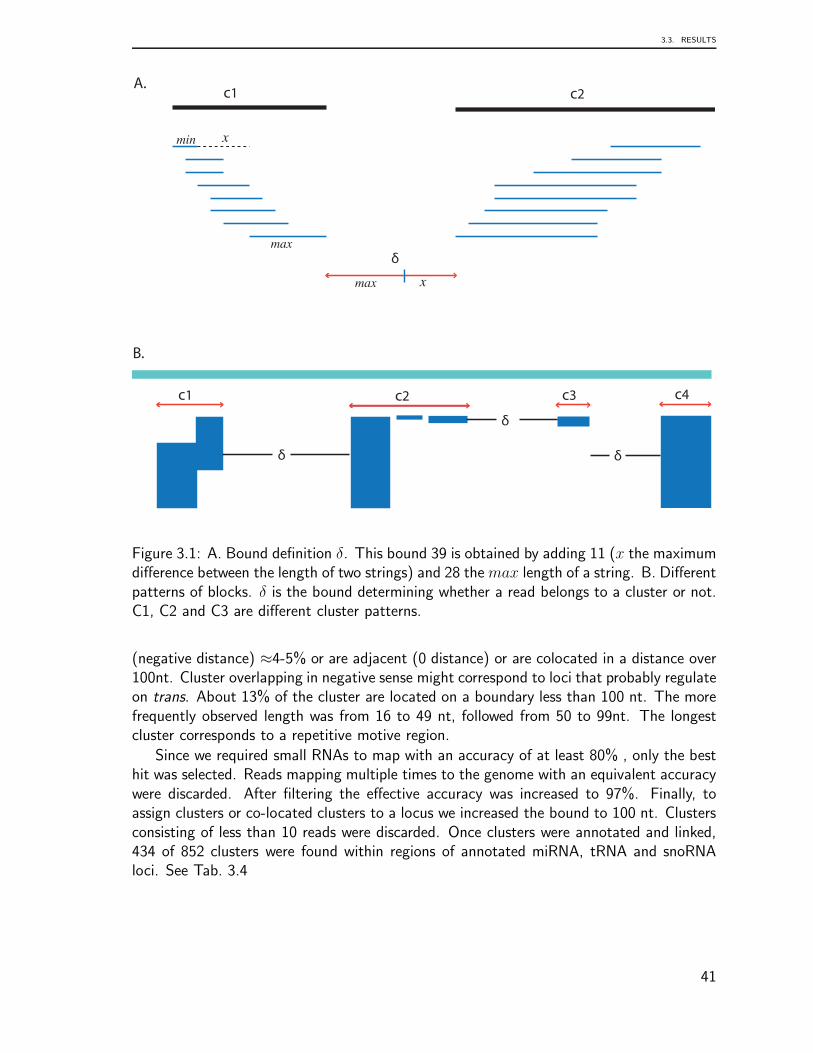
3.3. RESULTS
δ
δ
δ
c1 c2 c3 c4
B.
A.
δ
max
max
x
x
min
c1 c2
Figure 3.1: A. Bound definition δ. This bound 39 is obtained by adding 11 (x the maximumdifference between the length of two strings) and 28 themax length of a string. B. Differentpatterns of blocks. δ is the bound determining whether a read belongs to a cluster or not.C1, C2 and C3 are different cluster patterns.
(negative distance) ≈4-5% or are adjacent (0 distance) or are colocated in a distance over100nt. Cluster overlapping in negative sense might correspond to loci that probably regulateon trans. About 13% of the cluster are located on a boundary less than 100 nt. The morefrequently observed length was from 16 to 49 nt, followed from 50 to 99nt. The longestcluster corresponds to a repetitive motive region.
Since we required small RNAs to map with an accuracy of at least 80% , only the besthit was selected. Reads mapping multiple times to the genome with an equivalent accuracywere discarded. After filtering the effective accuracy was increased to 97%. Finally, toassign clusters or co-located clusters to a locus we increased the bound to 100 nt. Clustersconsisting of less than 10 reads were discarded. Once clusters were annotated and linked,434 of 852 clusters were found within regions of annotated miRNA, tRNA and snoRNAloci. See Tab. 3.4
41
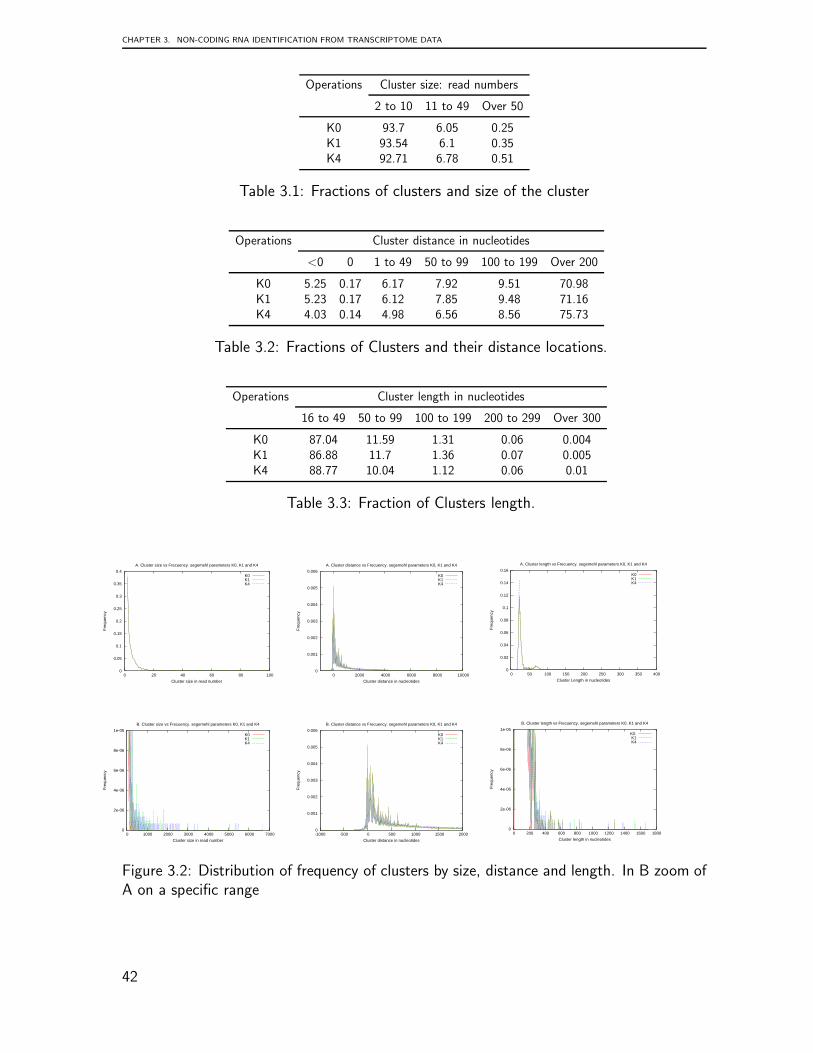
CHAPTER 3. NON-CODING RNA IDENTIFICATION FROM TRANSCRIPTOME DATA
Operations Cluster size: read numbers
2 to 10 11 to 49 Over 50
K0 93.7 6.05 0.25K1 93.54 6.1 0.35K4 92.71 6.78 0.51
Table 3.1: Fractions of clusters and size of the cluster
Operations Cluster distance in nucleotides
<0 0 1 to 49 50 to 99 100 to 199 Over 200
K0 5.25 0.17 6.17 7.92 9.51 70.98K1 5.23 0.17 6.12 7.85 9.48 71.16K4 4.03 0.14 4.98 6.56 8.56 75.73
Table 3.2: Fractions of Clusters and their distance locations.
Operations Cluster length in nucleotides
16 to 49 50 to 99 100 to 199 200 to 299 Over 300
K0 87.04 11.59 1.31 0.06 0.004K1 86.88 11.7 1.36 0.07 0.005K4 88.77 10.04 1.12 0.06 0.01
Table 3.3: Fraction of Clusters length.
0
0.05
0.1
0.15
0.2
0.25
0.3
0.35
0.4
0 20 40 60 80 100
Fre
quen
cy
Cluster size in read number
A. Cluster size vs Frecuency. segemehl parameters K0, K1 and K4
K0K1K4
0
0.001
0.002
0.003
0.004
0.005
0.006
0 2000 4000 6000 8000 10000
Fre
quen
cy
Cluster distance in nucleotides
A. Cluster distance vs Frecuency. segemehl parameters K0, K1 and K4
K0K1K4
0
0.02
0.04
0.06
0.08
0.1
0.12
0.14
0.16
0 50 100 150 200 250 300 350 400
Fre
quen
cy
Cluster Length in nucleotides
A. Cluster length vs Frecuency. segemehl parameters K0, K1 and K4
K0K1K4
0
2e-06
4e-06
6e-06
8e-06
1e-05
0 1000 2000 3000 4000 5000 6000 7000
Fre
quen
cy
Cluster size in read number
B. Cluster size vs Frecuency. segemehl parameters K0, K1 and K4
K0K1K4
0
0.001
0.002
0.003
0.004
0.005
0.006
-1000 -500 0 500 1000 1500 2000
Fre
quen
cy
Cluster distance in nucleotides
B. Cluster distance vs Frecuency. segemehl parameters K0, K1 and K4
K0K1K4
0
2e-06
4e-06
6e-06
8e-06
1e-05
0 200 400 600 800 1000 1200 1400 1600 1800
Fre
quen
cy
Cluster length in nucleotides
B. Cluster length vs Frecuency. segemehl parameters K0, K1 and K4
K0 K1K4
Figure 3.2: Distribution of frequency of clusters by size, distance and length. In B zoom ofA on a specific range
42
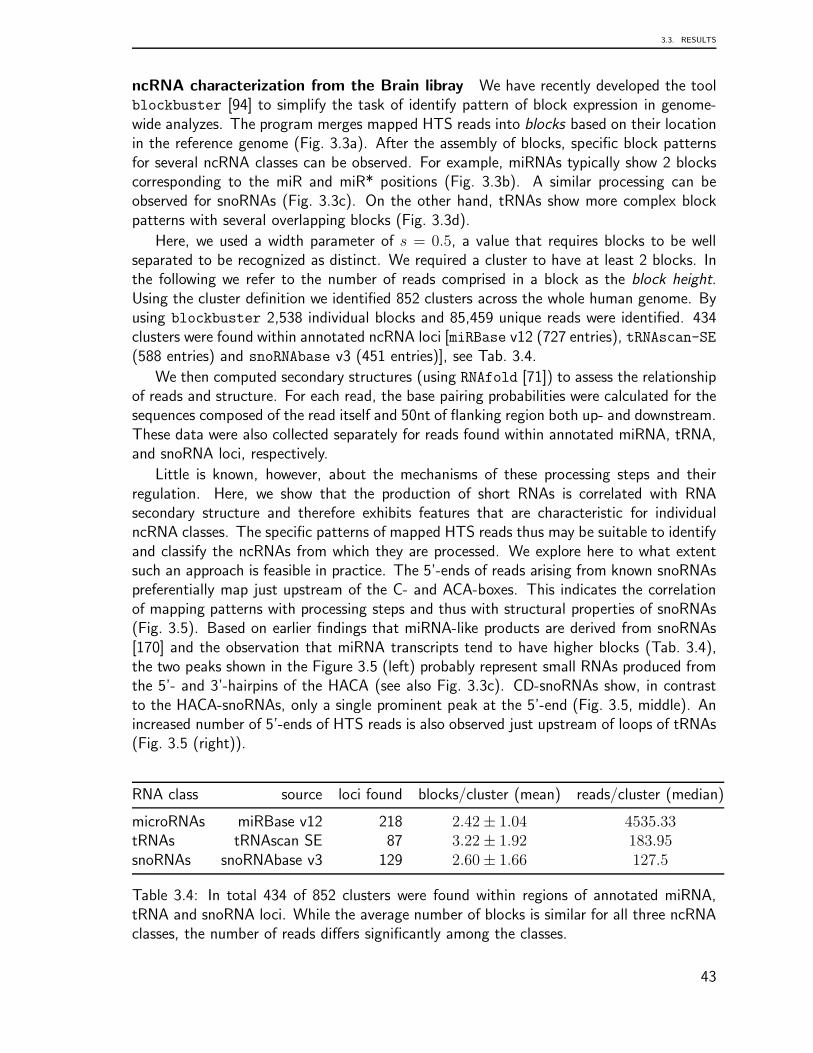
3.3. RESULTS
ncRNA characterization from the Brain libray We have recently developed the toolblockbuster [94] to simplify the task of identify pattern of block expression in genome-wide analyzes. The program merges mapped HTS reads into blocks based on their locationin the reference genome (Fig. 3.3a). After the assembly of blocks, specific block patternsfor several ncRNA classes can be observed. For example, miRNAs typically show 2 blockscorresponding to the miR and miR* positions (Fig. 3.3b). A similar processing can beobserved for snoRNAs (Fig. 3.3c). On the other hand, tRNAs show more complex blockpatterns with several overlapping blocks (Fig. 3.3d).
Here, we used a width parameter of s = 0.5, a value that requires blocks to be wellseparated to be recognized as distinct. We required a cluster to have at least 2 blocks. Inthe following we refer to the number of reads comprised in a block as the block height.Using the cluster definition we identified 852 clusters across the whole human genome. Byusing blockbuster 2,538 individual blocks and 85,459 unique reads were identified. 434clusters were found within annotated ncRNA loci [miRBase v12 (727 entries), tRNAscan-SE(588 entries) and snoRNAbase v3 (451 entries)], see Tab. 3.4.
We then computed secondary structures (using RNAfold [71]) to assess the relationshipof reads and structure. For each read, the base pairing probabilities were calculated for thesequences composed of the read itself and 50nt of flanking region both up- and downstream.These data were also collected separately for reads found within annotated miRNA, tRNA,and snoRNA loci, respectively.
Little is known, however, about the mechanisms of these processing steps and theirregulation. Here, we show that the production of short RNAs is correlated with RNAsecondary structure and therefore exhibits features that are characteristic for individualncRNA classes. The specific patterns of mapped HTS reads thus may be suitable to identifyand classify the ncRNAs from which they are processed. We explore here to what extentsuch an approach is feasible in practice. The 5’-ends of reads arising from known snoRNAspreferentially map just upstream of the C- and ACA-boxes. This indicates the correlationof mapping patterns with processing steps and thus with structural properties of snoRNAs(Fig. 3.5). Based on earlier findings that miRNA-like products are derived from snoRNAs[170] and the observation that miRNA transcripts tend to have higher blocks (Tab. 3.4),the two peaks shown in the Figure 3.5 (left) probably represent small RNAs produced fromthe 5’- and 3’-hairpins of the HACA (see also Fig. 3.3c). CD-snoRNAs show, in contrastto the HACA-snoRNAs, only a single prominent peak at the 5’-end (Fig. 3.5, middle). Anincreased number of 5’-ends of HTS reads is also observed just upstream of loops of tRNAs(Fig. 3.5 (right)).
RNA class source loci found blocks/cluster (mean) reads/cluster (median)
microRNAs miRBase v12 218 2.42± 1.04 4535.33tRNAs tRNAscan SE 87 3.22± 1.92 183.95snoRNAs snoRNAbase v3 129 2.60± 1.66 127.5
Table 3.4: In total 434 of 852 clusters were found within regions of annotated miRNA,tRNA and snoRNA loci. While the average number of blocks is similar for all three ncRNAclasses, the number of reads differs significantly among the classes.
43
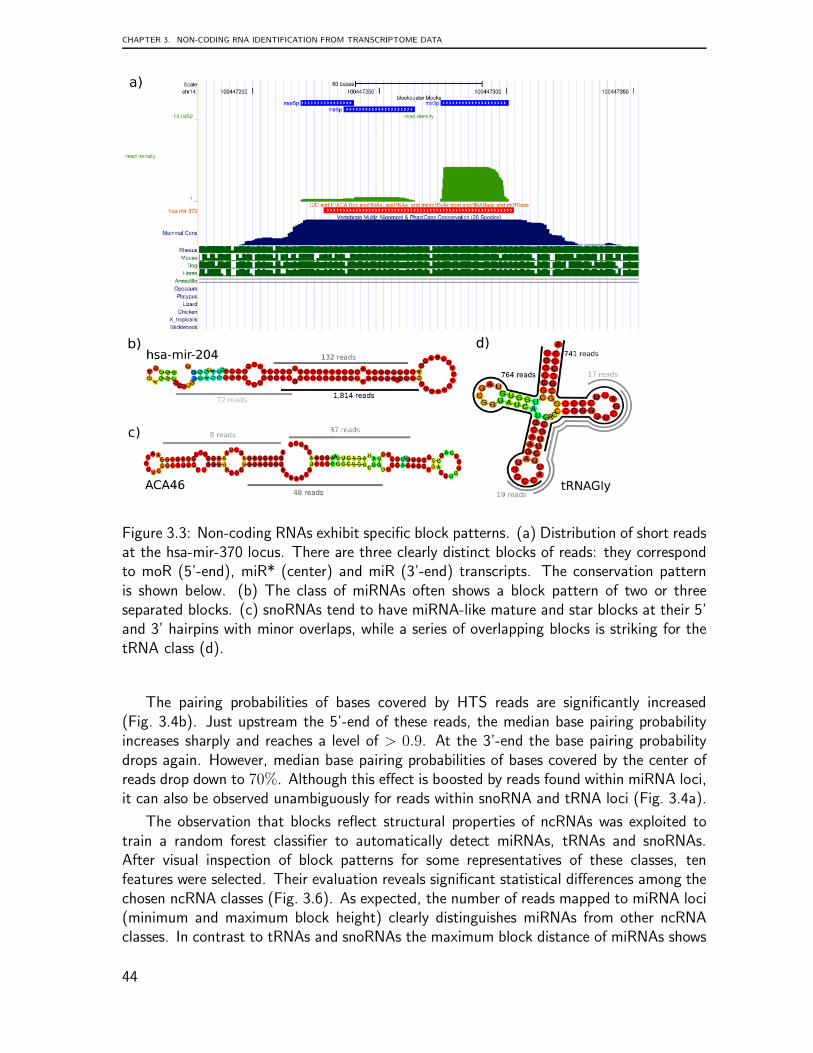
CHAPTER 3. NON-CODING RNA IDENTIFICATION FROM TRANSCRIPTOME DATA
Figure 3.3: Non-coding RNAs exhibit specific block patterns. (a) Distribution of short readsat the hsa-mir-370 locus. There are three clearly distinct blocks of reads: they correspondto moR (5’-end), miR* (center) and miR (3’-end) transcripts. The conservation patternis shown below. (b) The class of miRNAs often shows a block pattern of two or threeseparated blocks. (c) snoRNAs tend to have miRNA-like mature and star blocks at their 5’and 3’ hairpins with minor overlaps, while a series of overlapping blocks is striking for thetRNA class (d).
The pairing probabilities of bases covered by HTS reads are significantly increased(Fig. 3.4b). Just upstream the 5’-end of these reads, the median base pairing probabilityincreases sharply and reaches a level of > 0.9. At the 3’-end the base pairing probabilitydrops again. However, median base pairing probabilities of bases covered by the center ofreads drop down to 70%. Although this effect is boosted by reads found within miRNA loci,it can also be observed unambiguously for reads within snoRNA and tRNA loci (Fig. 3.4a).
The observation that blocks reflect structural properties of ncRNAs was exploited totrain a random forest classifier to automatically detect miRNAs, tRNAs and snoRNAs.After visual inspection of block patterns for some representatives of these classes, tenfeatures were selected. Their evaluation reveals significant statistical differences among thechosen ncRNA classes (Fig. 3.6). As expected, the number of reads mapped to miRNA loci(minimum and maximum block height) clearly distinguishes miRNAs from other ncRNAclasses. In contrast to tRNAs and snoRNAs the maximum block distance of miRNAs shows
44
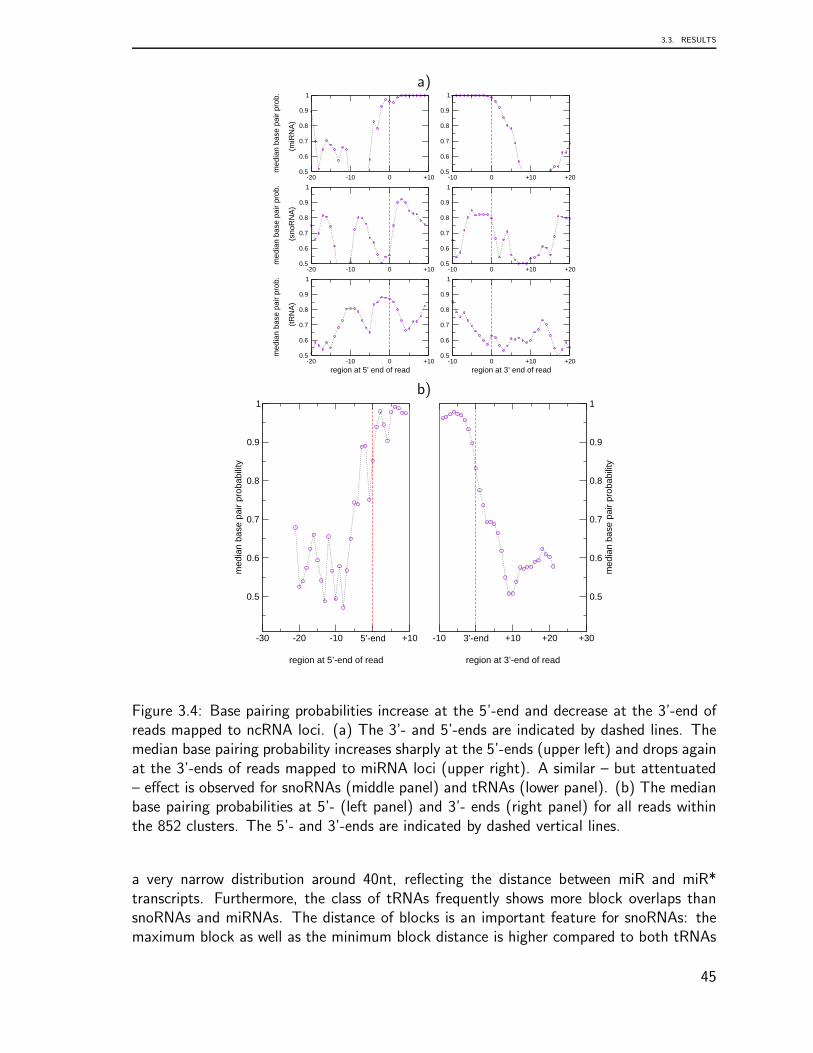
3.3. RESULTS
a)
-20 -10 0 +100.5
0.6
0.7
0.8
0.9
1
med
ian
base
pai
r pr
ob.
(
miR
NA
)
-10 0 +10 +200.5
0.6
0.7
0.8
0.9
1
-20 -10 0 +100.5
0.6
0.7
0.8
0.9
1
med
ian
base
pai
r pr
ob.
(
snoR
NA
)
-10 0 +10 +200.5
0.6
0.7
0.8
0.9
1
-20 -10 0 +10region at 5’ end of read
0.5
0.6
0.7
0.8
0.9
1m
edia
n ba
se p
air
prob
.
(tR
NA
)
-10 0 +10 +20region at 3’ end of read
0.5
0.6
0.7
0.8
0.9
1
b)
-30 -20 -10 5’-end +10
region at 5’-end of read
0.5
0.6
0.7
0.8
0.9
1
med
ian
base
pai
r pr
obab
ility
-10 3’-end +10 +20 +30
region at 3’-end of read
0.5
0.6
0.7
0.8
0.9
1
med
ian
base
pai
r pr
obab
ility
Figure 3.4: Base pairing probabilities increase at the 5’-end and decrease at the 3’-end ofreads mapped to ncRNA loci. (a) The 3’- and 5’-ends are indicated by dashed lines. Themedian base pairing probability increases sharply at the 5’-ends (upper left) and drops againat the 3’-ends of reads mapped to miRNA loci (upper right). A similar – but attentuated– effect is observed for snoRNAs (middle panel) and tRNAs (lower panel). (b) The medianbase pairing probabilities at 5’- (left panel) and 3’- ends (right panel) for all reads withinthe 852 clusters. The 5’- and 3’-ends are indicated by dashed vertical lines.
a very narrow distribution around 40nt, reflecting the distance between miR and miR*transcripts. Furthermore, the class of tRNAs frequently shows more block overlaps thansnoRNAs and miRNAs. The distance of blocks is an important feature for snoRNAs: themaximum block as well as the minimum block distance is higher compared to both tRNAs
45
CHAPTER 3. NON-CODING RNA IDENTIFICATION FROM TRANSCRIPTOME DATA
10
100
1000
num
ber
of r
eads
(lo
g)
snoRNA ACA-Box
100
1000
10000
snoRNA C-Box
100
1000
10000
tRNA
-200 -150 -100 -50 0distance (nt)
0 50 100distance (nt)
0 50 100distance (nt)
Figure 3.5: HTS data reflects structural properties of ncRNAs. Upper panels show thenumber of 5’-ends of mapped HTS reads (bars) relative to aligned the 5’-ends (dashedvertical lines) of 27 ACA boxes (left), 81 CD boxes (middle) and 87 tRNAs (right). Thearea in the lower panel represents the number of boxes and tRNAs present at the distancerelative to their aligned start sites. In accordance with Taft et al. [170] a sudden andsharp increase of 5’-ends is seen just upstream of the snoRNAs’ ACA and C boxes, resp.,indicating that read blocks reflect structural properties of snoRNAs. Similarily, the numberof 5’-ends increases just upstream of the tRNA and the relative start sites of its three loopregions (dotted lines). Downstream the start sites there is a sudden drop in the number ofreads.
and miRNAs.
The random forest model was repeatedly trained with randomly chosen annotated lociand different training set sizes in order to determine predictive values (PPV) and recallrates. For the training sets comprising 150 clusters the random forest model shows apositive predictive value > 0.7 for all three ncRNA classes. The recall rate for miRNAsis well above 80%. However, with a rate of ≈ 0.55 the recall of snoRNAs and tRNAsis relatively poor (Tab. 3.5). For larger training sets containing 250 clusters, the positivepredictive value (PPV) is > 0.8 for all classes. For miRNAs the classification achievesrecall rates and PPVs of > 0.9. Likewise, the recall rates for snoRNAs and tRNAs rise to0.7-level. In summary, for both training set sizes and all classes the random forest modelachieves PPVs and recall rates of ≈ 0.8.
We applied the classifier to unannotated ncRNA loci. A list of miRNA, snoRNA, andtRNA candidates predicted is available from the supplementary page [95]). This resourceincludes the original reads, their mapping accuracy and their mapping location in machine-readable formats. Furthermore, the page provides links to the UCSC genome browser tovisualize the block patterns. For microRNAs and snoRNAs, we also indicate whether thecandidates are supported by independent ncRNA prediction tools.
The 29 miRNA predictions contained 3 miRNAs (hsa-mir1978, hsa-mir-2110, hsa-mir-1974) which have already been annotated in the most recent miRBase release (v.14), aswell as a novel member of the mir-548 family, and another locus is the human orthologof the bovine mir-2355. In addition, we found two clusters antisense to annotated miRNA
46
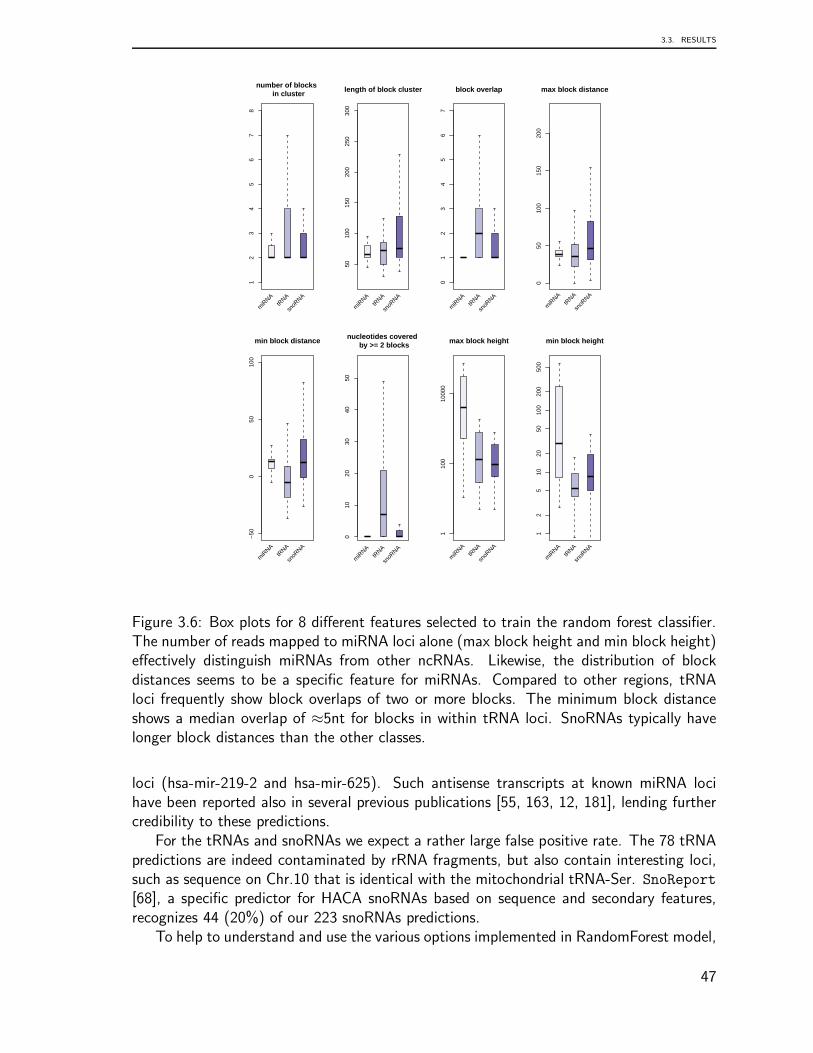
3.3. RESULTS
12
34
56
78
number of blocks in cluster
miR
NAtR
NA
snoR
NA
5010
015
020
025
030
0
length of block cluster
miR
NAtR
NA
snoR
NA
01
23
45
67
block overlap
miR
NAtR
NA
snoR
NA
050
100
150
200
max block distance
miR
NAtR
NA
snoR
NA
−50
050
100
min block distance
miR
NAtR
NA
snoR
NA
010
2030
4050
nucleotides covered by >= 2 blocks
miR
NAtR
NA
snoR
NA
110
010
000
max block height
miR
NAtR
NA
snoR
NA
12
510
2050
100
200
500
min block height
miR
NAtR
NA
snoR
NA
Figure 3.6: Box plots for 8 different features selected to train the random forest classifier.The number of reads mapped to miRNA loci alone (max block height and min block height)effectively distinguish miRNAs from other ncRNAs. Likewise, the distribution of blockdistances seems to be a specific feature for miRNAs. Compared to other regions, tRNAloci frequently show block overlaps of two or more blocks. The minimum block distanceshows a median overlap of ≈5nt for blocks in within tRNA loci. SnoRNAs typically havelonger block distances than the other classes.
loci (hsa-mir-219-2 and hsa-mir-625). Such antisense transcripts at known miRNA locihave been reported also in several previous publications [55, 163, 12, 181], lending furthercredibility to these predictions.
For the tRNAs and snoRNAs we expect a rather large false positive rate. The 78 tRNApredictions are indeed contaminated by rRNA fragments, but also contain interesting loci,such as sequence on Chr.10 that is identical with the mitochondrial tRNA-Ser. SnoReport[68], a specific predictor for HACA snoRNAs based on sequence and secondary features,recognizes 44 (20%) of our 223 snoRNAs predictions.
To help to understand and use the various options implemented in RandomForest model,
47
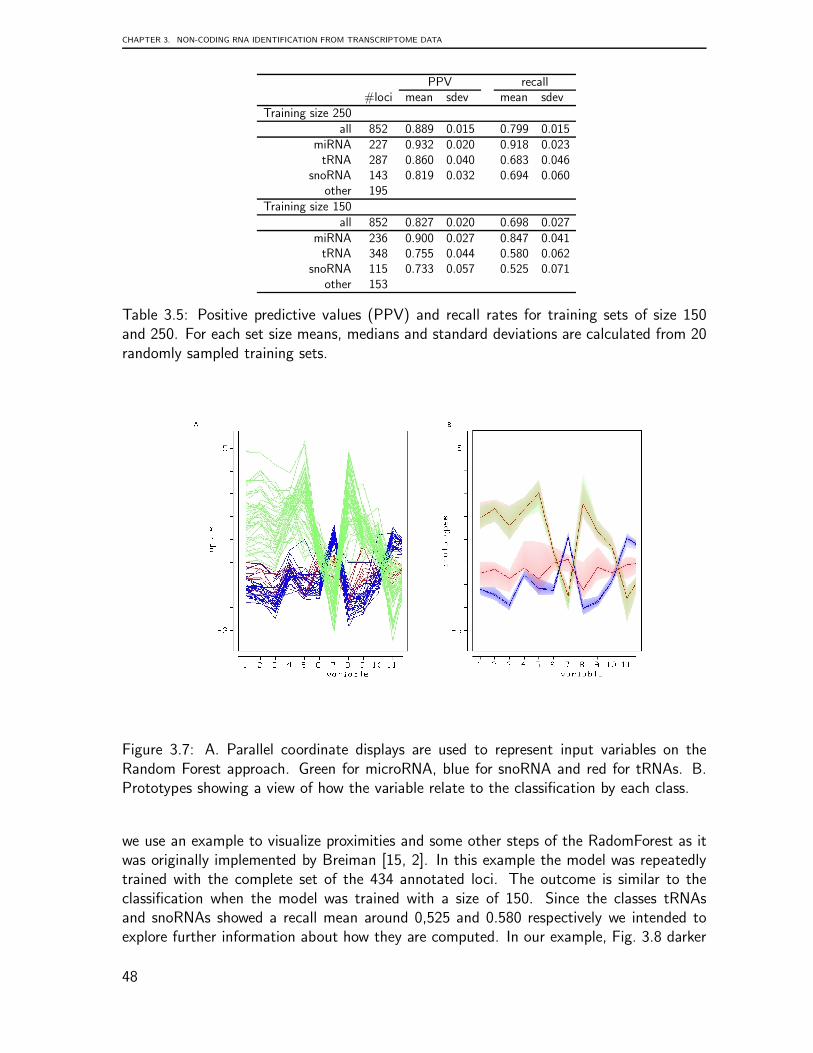
CHAPTER 3. NON-CODING RNA IDENTIFICATION FROM TRANSCRIPTOME DATA
PPV recall#loci mean sdev mean sdev
Training size 250all 852 0.889 0.015 0.799 0.015
miRNA 227 0.932 0.020 0.918 0.023tRNA 287 0.860 0.040 0.683 0.046
snoRNA 143 0.819 0.032 0.694 0.060other 195
Training size 150all 852 0.827 0.020 0.698 0.027
miRNA 236 0.900 0.027 0.847 0.041tRNA 348 0.755 0.044 0.580 0.062
snoRNA 115 0.733 0.057 0.525 0.071other 153
Table 3.5: Positive predictive values (PPV) and recall rates for training sets of size 150and 250. For each set size means, medians and standard deviations are calculated from 20randomly sampled training sets.
Figure 3.7: A. Parallel coordinate displays are used to represent input variables on theRandom Forest approach. Green for microRNA, blue for snoRNA and red for tRNAs. B.Prototypes showing a view of how the variable relate to the classification by each class.
we use an example to visualize proximities and some other steps of the RadomForest as itwas originally implemented by Breiman [15, 2]. In this example the model was repeatedlytrained with the complete set of the 434 annotated loci. The outcome is similar to theclassification when the model was trained with a size of 150. Since the classes tRNAsand snoRNAs showed a recall mean around 0,525 and 0.580 respectively we intended toexplore further information about how they are computed. In our example, Fig. 3.8 darker
48
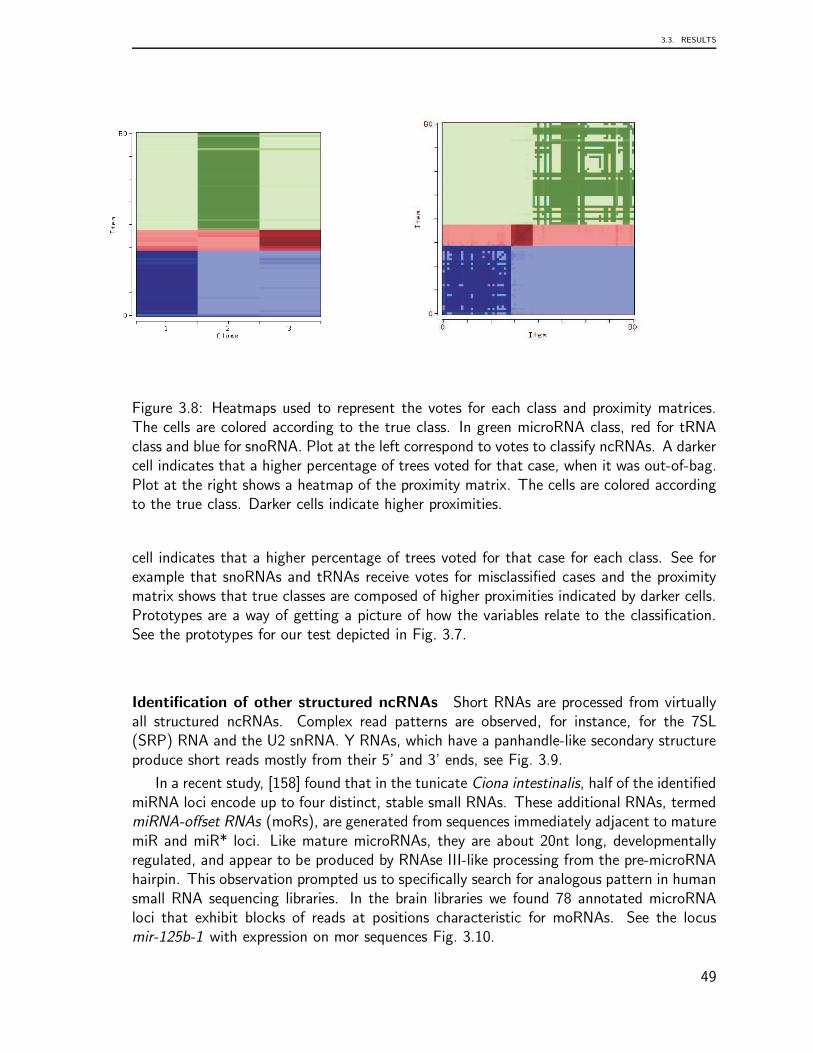
3.3. RESULTS
Figure 3.8: Heatmaps used to represent the votes for each class and proximity matrices.The cells are colored according to the true class. In green microRNA class, red for tRNAclass and blue for snoRNA. Plot at the left correspond to votes to classify ncRNAs. A darkercell indicates that a higher percentage of trees voted for that case, when it was out-of-bag.Plot at the right shows a heatmap of the proximity matrix. The cells are colored accordingto the true class. Darker cells indicate higher proximities.
cell indicates that a higher percentage of trees voted for that case for each class. See forexample that snoRNAs and tRNAs receive votes for misclassified cases and the proximitymatrix shows that true classes are composed of higher proximities indicated by darker cells.Prototypes are a way of getting a picture of how the variables relate to the classification.See the prototypes for our test depicted in Fig. 3.7.
Identification of other structured ncRNAs Short RNAs are processed from virtuallyall structured ncRNAs. Complex read patterns are observed, for instance, for the 7SL(SRP) RNA and the U2 snRNA. Y RNAs, which have a panhandle-like secondary structureproduce short reads mostly from their 5’ and 3’ ends, see Fig. 3.9.
In a recent study, [158] found that in the tunicate Ciona intestinalis, half of the identifiedmiRNA loci encode up to four distinct, stable small RNAs. These additional RNAs, termedmiRNA-offset RNAs (moRs), are generated from sequences immediately adjacent to maturemiR and miR* loci. Like mature microRNAs, they are about 20nt long, developmentallyregulated, and appear to be produced by RNAse III-like processing from the pre-microRNAhairpin. This observation prompted us to specifically search for analogous pattern in humansmall RNA sequencing libraries. In the brain libraries we found 78 annotated microRNAloci that exhibit blocks of reads at positions characteristic for moRNAs. See the locusmir-125b-1 with expression on mor sequences Fig. 3.10.
49
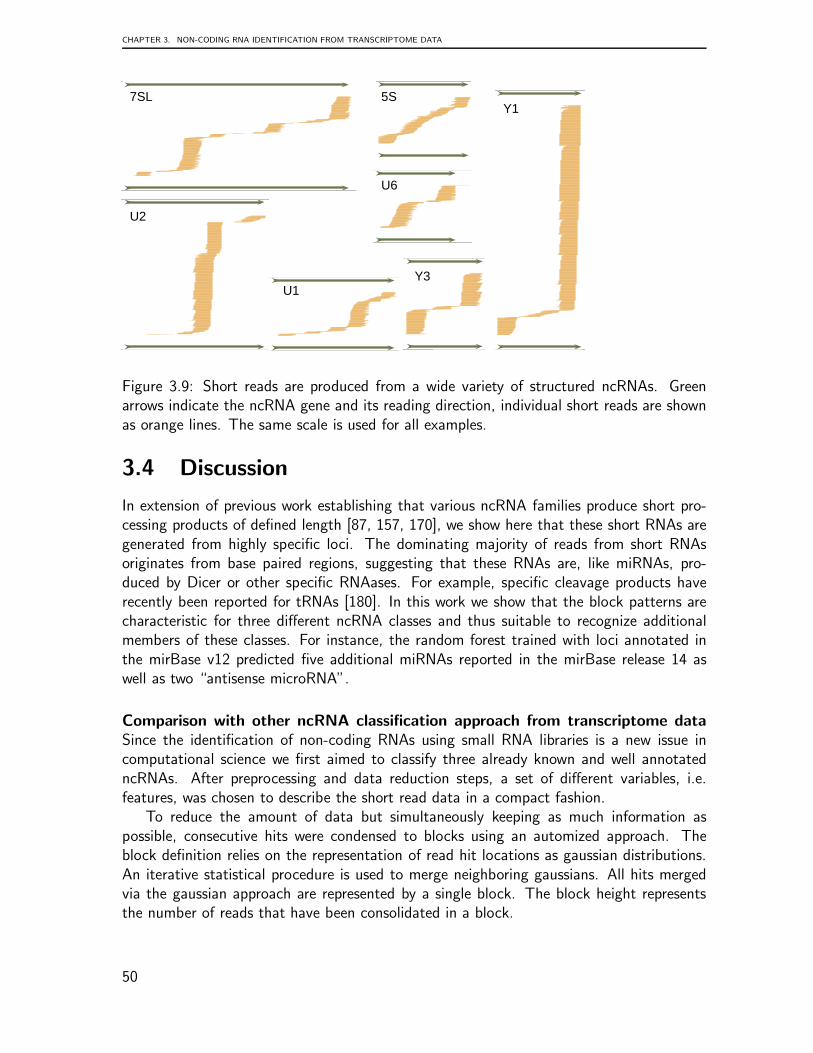
CHAPTER 3. NON-CODING RNA IDENTIFICATION FROM TRANSCRIPTOME DATA
3 7SL
105S
snRNAU2
snRNA U1
scRNA hY3
scRNAhY1
snRNA U6
U6
5S7SL
U2
U1Y3
Y1
Figure 3.9: Short reads are produced from a wide variety of structured ncRNAs. Greenarrows indicate the ncRNA gene and its reading direction, individual short reads are shownas orange lines. The same scale is used for all examples.
3.4 Discussion
In extension of previous work establishing that various ncRNA families produce short pro-cessing products of defined length [87, 157, 170], we show here that these short RNAs aregenerated from highly specific loci. The dominating majority of reads from short RNAsoriginates from base paired regions, suggesting that these RNAs are, like miRNAs, pro-duced by Dicer or other specific RNAases. For example, specific cleavage products haverecently been reported for tRNAs [180]. In this work we show that the block patterns arecharacteristic for three different ncRNA classes and thus suitable to recognize additionalmembers of these classes. For instance, the random forest trained with loci annotated inthe mirBase v12 predicted five additional miRNAs reported in the mirBase release 14 aswell as two “antisense microRNA”.
Comparison with other ncRNA classification approach from transcriptome dataSince the identification of non-coding RNAs using small RNA libraries is a new issue incomputational science we first aimed to classify three already known and well annotatedncRNAs. After preprocessing and data reduction steps, a set of different variables, i.e.features, was chosen to describe the short read data in a compact fashion.
To reduce the amount of data but simultaneously keeping as much information aspossible, consecutive hits were condensed to blocks using an automized approach. Theblock definition relies on the representation of read hit locations as gaussian distributions.An iterative statistical procedure is used to merge neighboring gaussians. All hits mergedvia the gaussian approach are represented by a single block. The block height representsthe number of reads that have been consolidated in a block.
50
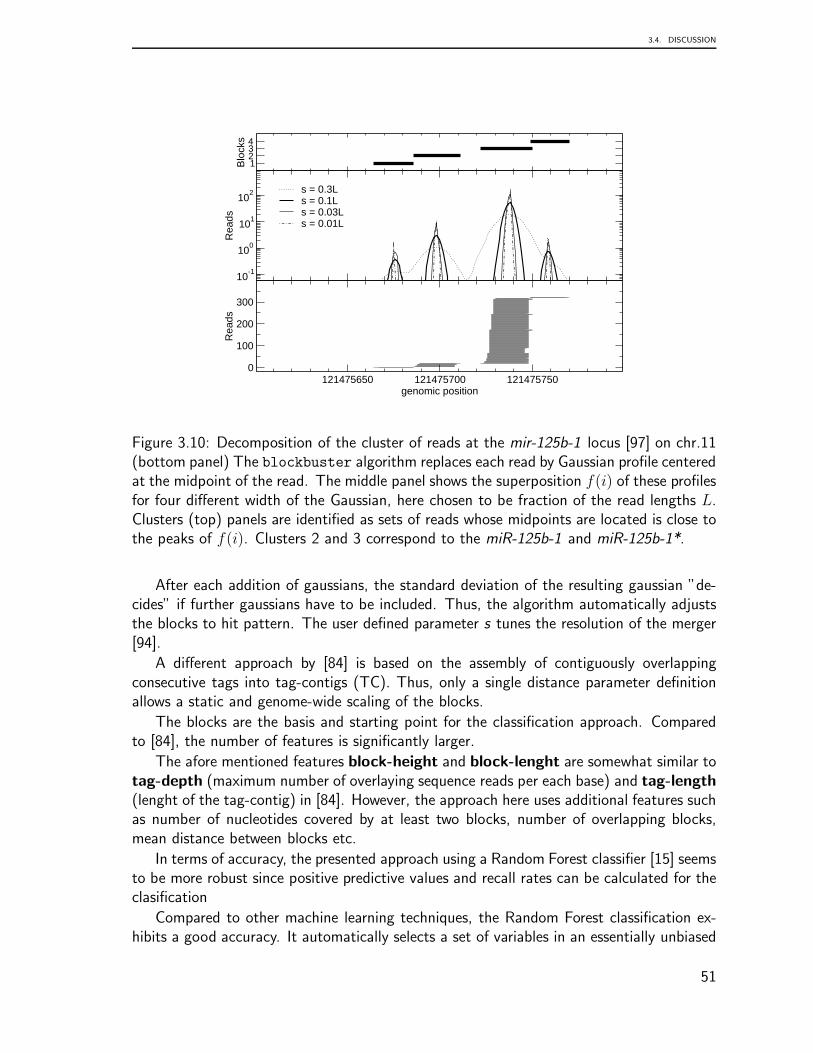
3.4. DISCUSSION
10-1
100
101
102
Rea
ds
s = 0.3Ls = 0.1Ls = 0.03Ls = 0.01L
121475650 121475700 121475750genomic position
0
100
200
300
Rea
ds
1234
Blo
cks
Figure 3.10: Decomposition of the cluster of reads at the mir-125b-1 locus [97] on chr.11(bottom panel) The blockbuster algorithm replaces each read by Gaussian profile centeredat the midpoint of the read. The middle panel shows the superposition f(i) of these profilesfor four different width of the Gaussian, here chosen to be fraction of the read lengths L.Clusters (top) panels are identified as sets of reads whose midpoints are located is close tothe peaks of f(i). Clusters 2 and 3 correspond to the miR-125b-1 and miR-125b-1*.
After each addition of gaussians, the standard deviation of the resulting gaussian ”de-cides” if further gaussians have to be included. Thus, the algorithm automatically adjuststhe blocks to hit pattern. The user defined parameter s tunes the resolution of the merger[94].
A different approach by [84] is based on the assembly of contiguously overlappingconsecutive tags into tag-contigs (TC). Thus, only a single distance parameter definitionallows a static and genome-wide scaling of the blocks.
The blocks are the basis and starting point for the classification approach. Comparedto [84], the number of features is significantly larger.
The afore mentioned features block-height and block-lenght are somewhat similar totag-depth (maximum number of overlaying sequence reads per each base) and tag-length(lenght of the tag-contig) in [84]. However, the approach here uses additional features suchas number of nucleotides covered by at least two blocks, number of overlapping blocks,mean distance between blocks etc.
In terms of accuracy, the presented approach using a Random Forest classifier [15] seemsto be more robust since positive predictive values and recall rates can be calculated for theclasification
Compared to other machine learning techniques, the Random Forest classification ex-hibits a good accuracy. It automatically selects a set of variables in an essentially unbiased
51
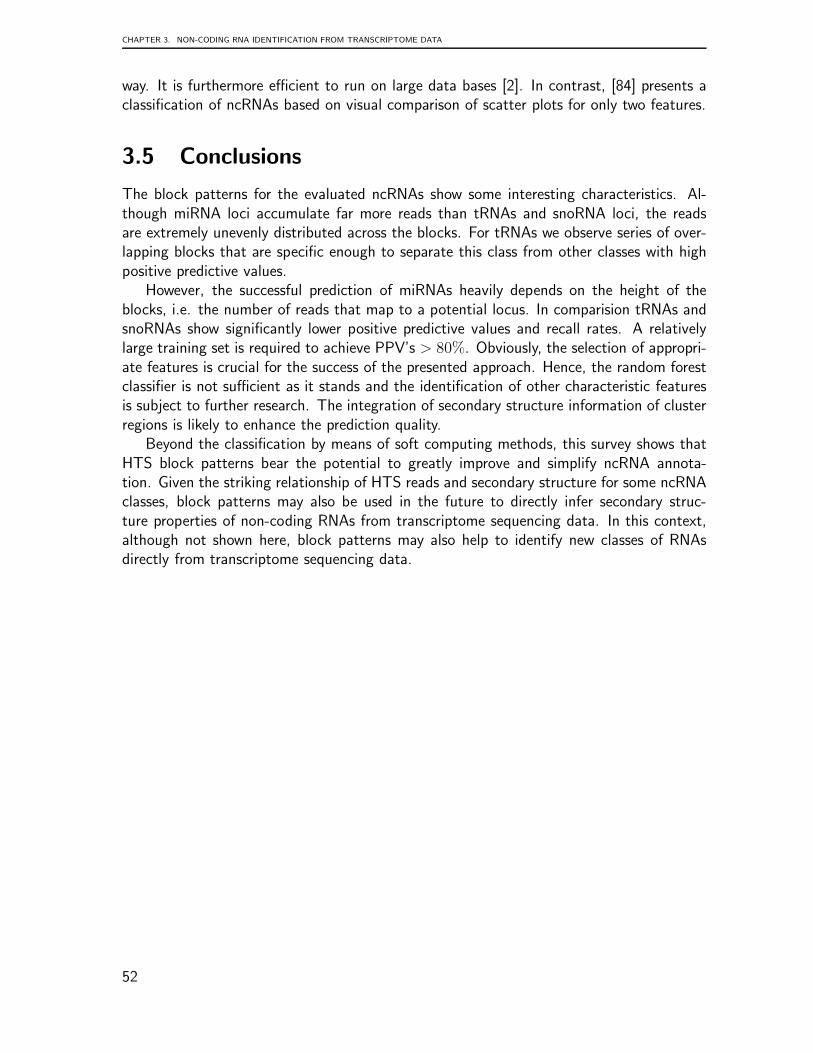
CHAPTER 3. NON-CODING RNA IDENTIFICATION FROM TRANSCRIPTOME DATA
way. It is furthermore efficient to run on large data bases [2]. In contrast, [84] presents aclassification of ncRNAs based on visual comparison of scatter plots for only two features.
3.5 Conclusions
The block patterns for the evaluated ncRNAs show some interesting characteristics. Al-though miRNA loci accumulate far more reads than tRNAs and snoRNA loci, the readsare extremely unevenly distributed across the blocks. For tRNAs we observe series of over-lapping blocks that are specific enough to separate this class from other classes with highpositive predictive values.
However, the successful prediction of miRNAs heavily depends on the height of theblocks, i.e. the number of reads that map to a potential locus. In comparision tRNAs andsnoRNAs show significantly lower positive predictive values and recall rates. A relativelylarge training set is required to achieve PPV’s > 80%. Obviously, the selection of appropri-ate features is crucial for the success of the presented approach. Hence, the random forestclassifier is not sufficient as it stands and the identification of other characteristic featuresis subject to further research. The integration of secondary structure information of clusterregions is likely to enhance the prediction quality.
Beyond the classification by means of soft computing methods, this survey shows thatHTS block patterns bear the potential to greatly improve and simplify ncRNA annota-tion. Given the striking relationship of HTS reads and secondary structure for some ncRNAclasses, block patterns may also be used in the future to directly infer secondary struc-ture properties of non-coding RNAs from transcriptome sequencing data. In this context,although not shown here, block patterns may also help to identify new classes of RNAsdirectly from transcriptome sequencing data.
52
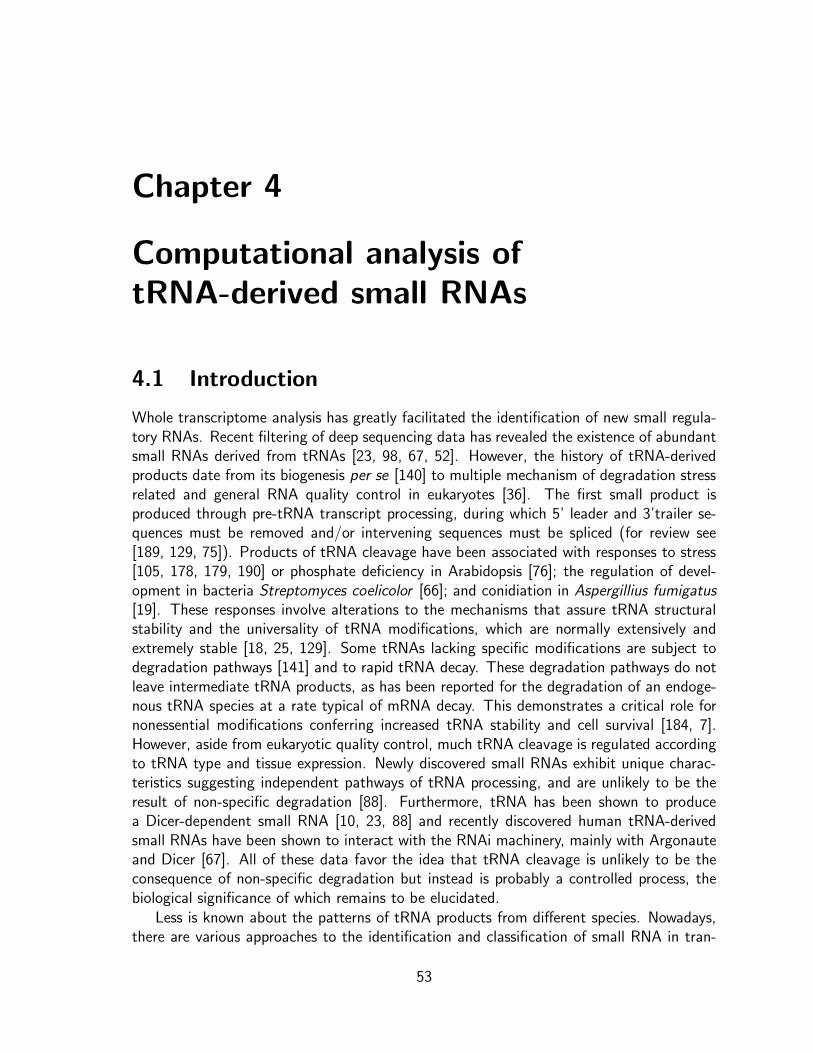
Chapter 4
Computational analysis oftRNA-derived small RNAs
4.1 Introduction
Whole transcriptome analysis has greatly facilitated the identification of new small regula-tory RNAs. Recent filtering of deep sequencing data has revealed the existence of abundantsmall RNAs derived from tRNAs [23, 98, 67, 52]. However, the history of tRNA-derivedproducts date from its biogenesis per se [140] to multiple mechanism of degradation stressrelated and general RNA quality control in eukaryotes [36]. The first small product isproduced through pre-tRNA transcript processing, during which 5’ leader and 3’trailer se-quences must be removed and/or intervening sequences must be spliced (for review see[189, 129, 75]). Products of tRNA cleavage have been associated with responses to stress[105, 178, 179, 190] or phosphate deficiency in Arabidopsis [76]; the regulation of devel-opment in bacteria Streptomyces coelicolor [66]; and conidiation in Aspergillius fumigatus
[19]. These responses involve alterations to the mechanisms that assure tRNA structuralstability and the universality of tRNA modifications, which are normally extensively andextremely stable [18, 25, 129]. Some tRNAs lacking specific modifications are subject todegradation pathways [141] and to rapid tRNA decay. These degradation pathways do notleave intermediate tRNA products, as has been reported for the degradation of an endoge-nous tRNA species at a rate typical of mRNA decay. This demonstrates a critical role fornonessential modifications conferring increased tRNA stability and cell survival [184, 7].However, aside from eukaryotic quality control, much tRNA cleavage is regulated accordingto tRNA type and tissue expression. Newly discovered small RNAs exhibit unique charac-teristics suggesting independent pathways of tRNA processing, and are unlikely to be theresult of non-specific degradation [88]. Furthermore, tRNA has been shown to producea Dicer-dependent small RNA [10, 23, 88] and recently discovered human tRNA-derivedsmall RNAs have been shown to interact with the RNAi machinery, mainly with Argonauteand Dicer [67]. All of these data favor the idea that tRNA cleavage is unlikely to be theconsequence of non-specific degradation but instead is probably a controlled process, thebiological significance of which remains to be elucidated.
Less is known about the patterns of tRNA products from different species. Nowadays,there are various approaches to the identification and classification of small RNA in tran-
53
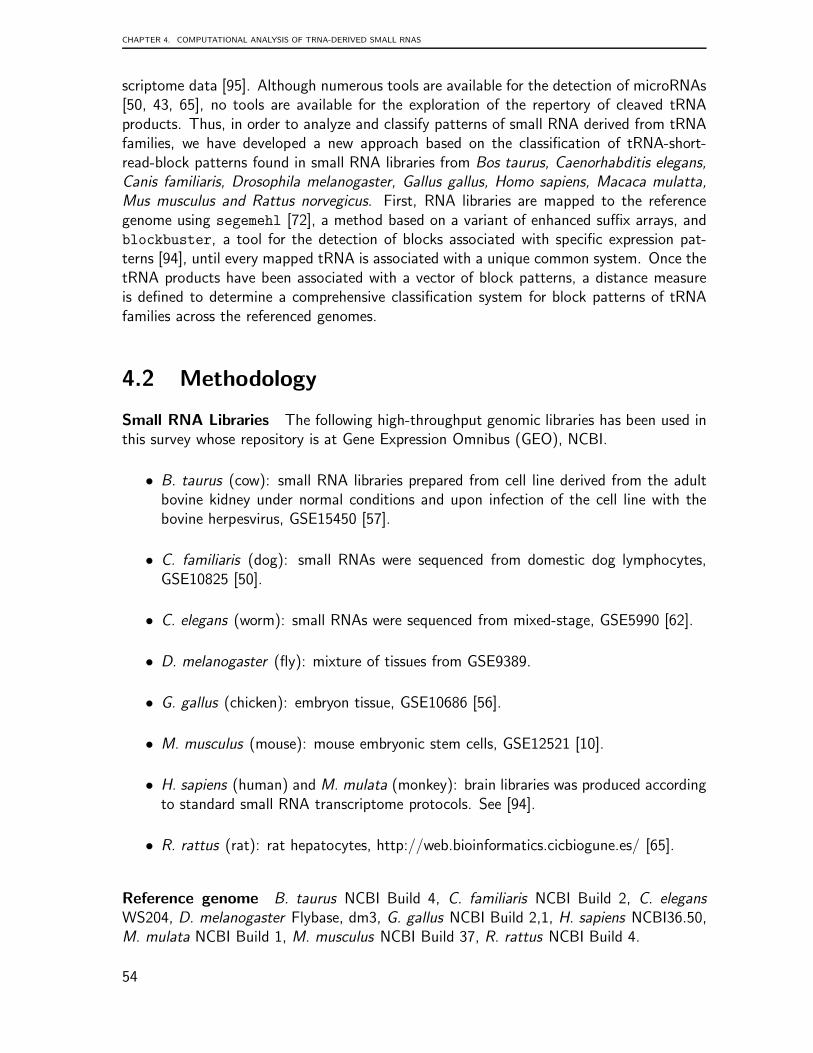
CHAPTER 4. COMPUTATIONAL ANALYSIS OF TRNA-DERIVED SMALL RNAS
scriptome data [95]. Although numerous tools are available for the detection of microRNAs[50, 43, 65], no tools are available for the exploration of the repertory of cleaved tRNAproducts. Thus, in order to analyze and classify patterns of small RNA derived from tRNAfamilies, we have developed a new approach based on the classification of tRNA-short-read-block patterns found in small RNA libraries from Bos taurus, Caenorhabditis elegans,
Canis familiaris, Drosophila melanogaster, Gallus gallus, Homo sapiens, Macaca mulatta,
Mus musculus and Rattus norvegicus. First, RNA libraries are mapped to the referencegenome using segemehl [72], a method based on a variant of enhanced suffix arrays, andblockbuster, a tool for the detection of blocks associated with specific expression pat-terns [94], until every mapped tRNA is associated with a unique common system. Once thetRNA products have been associated with a vector of block patterns, a distance measureis defined to determine a comprehensive classification system for block patterns of tRNAfamilies across the referenced genomes.
4.2 Methodology
Small RNA Libraries The following high-throughput genomic libraries has been used inthis survey whose repository is at Gene Expression Omnibus (GEO), NCBI.
• B. taurus (cow): small RNA libraries prepared from cell line derived from the adultbovine kidney under normal conditions and upon infection of the cell line with thebovine herpesvirus, GSE15450 [57].
• C. familiaris (dog): small RNAs were sequenced from domestic dog lymphocytes,GSE10825 [50].
• C. elegans (worm): small RNAs were sequenced from mixed-stage, GSE5990 [62].
• D. melanogaster (fly): mixture of tissues from GSE9389.
• G. gallus (chicken): embryon tissue, GSE10686 [56].
• M. musculus (mouse): mouse embryonic stem cells, GSE12521 [10].
• H. sapiens (human) and M. mulata (monkey): brain libraries was produced accordingto standard small RNA transcriptome protocols. See [94].
• R. rattus (rat): rat hepatocytes, http://web.bioinformatics.cicbiogune.es/ [65].
Reference genome B. taurus NCBI Build 4, C. familiaris NCBI Build 2, C. elegans
WS204, D. melanogaster Flybase, dm3, G. gallus NCBI Build 2,1, H. sapiens NCBI36.50,M. mulata NCBI Build 1, M. musculus NCBI Build 37, R. rattus NCBI Build 4.
54
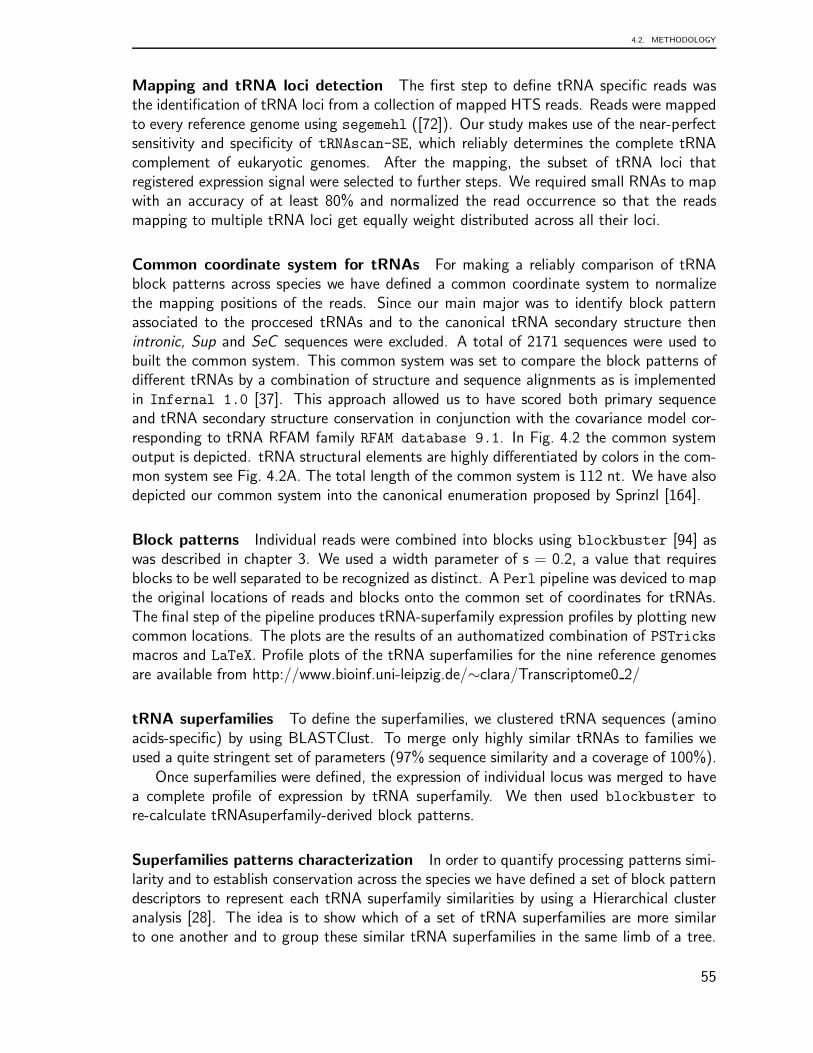
4.2. METHODOLOGY
Mapping and tRNA loci detection The first step to define tRNA specific reads wasthe identification of tRNA loci from a collection of mapped HTS reads. Reads were mappedto every reference genome using segemehl ([72]). Our study makes use of the near-perfectsensitivity and specificity of tRNAscan-SE, which reliably determines the complete tRNAcomplement of eukaryotic genomes. After the mapping, the subset of tRNA loci thatregistered expression signal were selected to further steps. We required small RNAs to mapwith an accuracy of at least 80% and normalized the read occurrence so that the readsmapping to multiple tRNA loci get equally weight distributed across all their loci.
Common coordinate system for tRNAs For making a reliably comparison of tRNAblock patterns across species we have defined a common coordinate system to normalizethe mapping positions of the reads. Since our main major was to identify block patternassociated to the proccesed tRNAs and to the canonical tRNA secondary structure thenintronic, Sup and SeC sequences were excluded. A total of 2171 sequences were used tobuilt the common system. This common system was set to compare the block patterns ofdifferent tRNAs by a combination of structure and sequence alignments as is implementedin Infernal 1.0 [37]. This approach allowed us to have scored both primary sequenceand tRNA secondary structure conservation in conjunction with the covariance model cor-responding to tRNA RFAM family RFAM database 9.1. In Fig. 4.2 the common systemoutput is depicted. tRNA structural elements are highly differentiated by colors in the com-mon system see Fig. 4.2A. The total length of the common system is 112 nt. We have alsodepicted our common system into the canonical enumeration proposed by Sprinzl [164].
Block patterns Individual reads were combined into blocks using blockbuster [94] aswas described in chapter 3. We used a width parameter of s = 0.2, a value that requiresblocks to be well separated to be recognized as distinct. A Perl pipeline was deviced to mapthe original locations of reads and blocks onto the common set of coordinates for tRNAs.The final step of the pipeline produces tRNA-superfamily expression profiles by plotting newcommon locations. The plots are the results of an authomatized combination of PSTricksmacros and LaTeX. Profile plots of the tRNA superfamilies for the nine reference genomesare available from http://www.bioinf.uni-leipzig.de/∼clara/Transcriptome0 2/
tRNA superfamilies To define the superfamilies, we clustered tRNA sequences (aminoacids-specific) by using BLASTClust. To merge only highly similar tRNAs to families weused a quite stringent set of parameters (97% sequence similarity and a coverage of 100%).
Once superfamilies were defined, the expression of individual locus was merged to havea complete profile of expression by tRNA superfamily. We then used blockbuster tore-calculate tRNAsuperfamily-derived block patterns.
Superfamilies patterns characterization In order to quantify processing patterns simi-larity and to establish conservation across the species we have defined a set of block patterndescriptors to represent each tRNA superfamily similarities by using a Hierarchical clusteranalysis [28]. The idea is to show which of a set of tRNA superfamilies are more similarto one another and to group these similar tRNA superfamilies in the same limb of a tree.
55
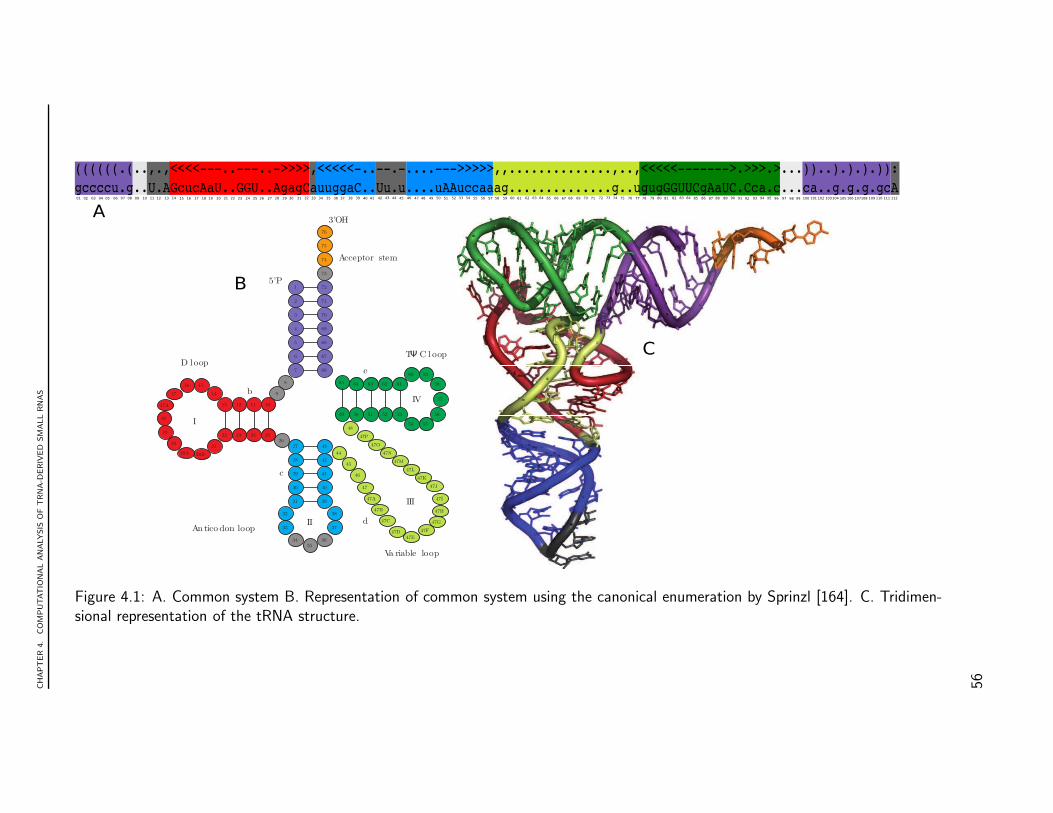
CH
APT
ER
4.
CO
MPU
TAT
ION
AL
AN
ALYSIS
OF
TRN
A-D
ERIV
ED
SM
ALL
RN
AS
01 02 03 04 05 06 07 08 09 10 11 12 13 14 15 16 17 18 19 20 21 22 23 24 25 26 27 28 29 30 31 32 33 34 35 36 37 38 39 40 41 42 43 44 45 46 47 48 49 50 51 52 53 54 55 56 57 58 59 60 61 62 63 64 65 66 67 68 69 70 71 72 73 74 75 76 77 78 79 80 81 82 83 84 85 86 87 88 89 90 91 92 93 94 95 96 97 98 99 100 101 102 103104 105106 107108 109 110 111 112
((((((.(..,.,<<<<---..---..->>>>,<<<<<-..--.-....--->>>>>,,..............,..,<<<<<------->.>>>.>...))..).).).)):
gccccu.g..U.AGcucAaU..GGU..AgagCauuggaC..Uu.u....uAAuccaaag..............g..ugugGGUUCgAaUC.Cca.c...ca..g.g.g.gcA
7
6
5
4
3
2
1
66
67
68
69
70
71
72
73
74
75
76
65 64 63 62 61
49 50 51 52 53
60 59
58
54 55
56
57
8
9
10111213
25242322
14
1516
17
17A
18
21
20B20A
20
19
2627
28
29
30
31
43
42
41
40
39
32
33
3435
36
37
38
44
45
46
47
47A
47B
47C
47D47E
47F
47G
47H
47I
47J
47K
47L
47M
47N
47O
47P
48
D loop
I
An tico don loop
b
c
5’P
II
3’OH
Acceptor stem
d
e
III
Va riable loop
IV
TΨ C l oop
A
B
C
Figure 4.1: A. Common system B. Representation of common system using the canonical enumeration by Sprinzl [164]. C. Tridimen-sional representation of the tRNA structure.
56
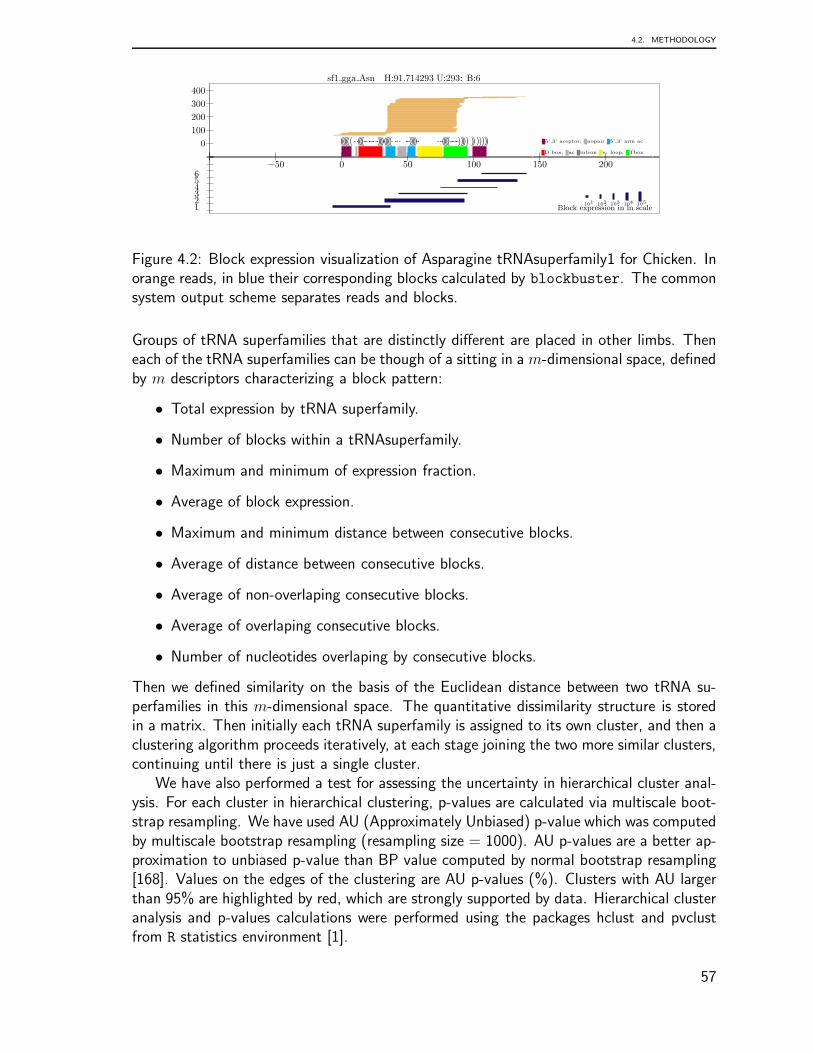
4.2. METHODOLOGY
sf1 gga Asn H:91.714293 U:293: B:6
0
100
200
300
400
−50 0 50 100 150 200
(((((((..((((.........)))).(((((. ... ...))))).. ...(((((.......))))) ))))))) 5’,3’ aceptor, nopair 5’,3’ arm ac
D box, ac intron v. loop, Tbox
123456
Block expression in ln scale101 102 103 104 105
Figure 4.2: Block expression visualization of Asparagine tRNAsuperfamily1 for Chicken. Inorange reads, in blue their corresponding blocks calculated by blockbuster. The commonsystem output scheme separates reads and blocks.
Groups of tRNA superfamilies that are distinctly different are placed in other limbs. Theneach of the tRNA superfamilies can be though of a sitting in a m-dimensional space, definedby m descriptors characterizing a block pattern:
• Total expression by tRNA superfamily.
• Number of blocks within a tRNAsuperfamily.
• Maximum and minimum of expression fraction.
• Average of block expression.
• Maximum and minimum distance between consecutive blocks.
• Average of distance between consecutive blocks.
• Average of non-overlaping consecutive blocks.
• Average of overlaping consecutive blocks.
• Number of nucleotides overlaping by consecutive blocks.
Then we defined similarity on the basis of the Euclidean distance between two tRNA su-perfamilies in this m-dimensional space. The quantitative dissimilarity structure is storedin a matrix. Then initially each tRNA superfamily is assigned to its own cluster, and then aclustering algorithm proceeds iteratively, at each stage joining the two more similar clusters,continuing until there is just a single cluster.
We have also performed a test for assessing the uncertainty in hierarchical cluster anal-ysis. For each cluster in hierarchical clustering, p-values are calculated via multiscale boot-strap resampling. We have used AU (Approximately Unbiased) p-value which was computedby multiscale bootstrap resampling (resampling size = 1000). AU p-values are a better ap-proximation to unbiased p-value than BP value computed by normal bootstrap resampling[168]. Values on the edges of the clustering are AU p-values (%). Clusters with AU largerthan 95% are highlighted by red, which are strongly supported by data. Hierarchical clusteranalysis and p-values calculations were performed using the packages hclust and pvclustfrom R statistics environment [1].
57
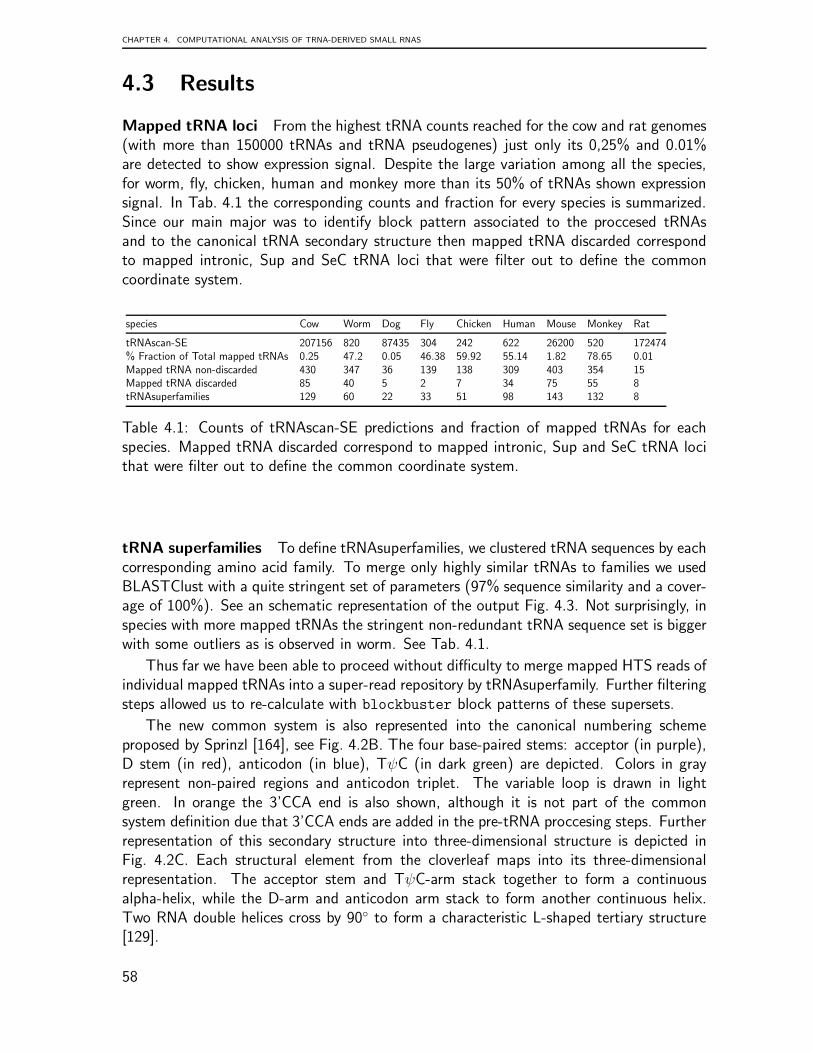
CHAPTER 4. COMPUTATIONAL ANALYSIS OF TRNA-DERIVED SMALL RNAS
4.3 Results
Mapped tRNA loci From the highest tRNA counts reached for the cow and rat genomes(with more than 150000 tRNAs and tRNA pseudogenes) just only its 0,25% and 0.01%are detected to show expression signal. Despite the large variation among all the species,for worm, fly, chicken, human and monkey more than its 50% of tRNAs shown expressionsignal. In Tab. 4.1 the corresponding counts and fraction for every species is summarized.Since our main major was to identify block pattern associated to the proccesed tRNAsand to the canonical tRNA secondary structure then mapped tRNA discarded correspondto mapped intronic, Sup and SeC tRNA loci that were filter out to define the commoncoordinate system.
species Cow Worm Dog Fly Chicken Human Mouse Monkey Rat
tRNAscan-SE 207156 820 87435 304 242 622 26200 520 172474% Fraction of Total mapped tRNAs 0.25 47.2 0.05 46.38 59.92 55.14 1.82 78.65 0.01Mapped tRNA non-discarded 430 347 36 139 138 309 403 354 15Mapped tRNA discarded 85 40 5 2 7 34 75 55 8tRNAsuperfamilies 129 60 22 33 51 98 143 132 8
Table 4.1: Counts of tRNAscan-SE predictions and fraction of mapped tRNAs for eachspecies. Mapped tRNA discarded correspond to mapped intronic, Sup and SeC tRNA locithat were filter out to define the common coordinate system.
tRNA superfamilies To define tRNAsuperfamilies, we clustered tRNA sequences by eachcorresponding amino acid family. To merge only highly similar tRNAs to families we usedBLASTClust with a quite stringent set of parameters (97% sequence similarity and a cover-age of 100%). See an schematic representation of the output Fig. 4.3. Not surprisingly, inspecies with more mapped tRNAs the stringent non-redundant tRNA sequence set is biggerwith some outliers as is observed in worm. See Tab. 4.1.
Thus far we have been able to proceed without difficulty to merge mapped HTS reads ofindividual mapped tRNAs into a super-read repository by tRNAsuperfamily. Further filteringsteps allowed us to re-calculate with blockbuster block patterns of these supersets.
The new common system is also represented into the canonical numbering schemeproposed by Sprinzl [164], see Fig. 4.2B. The four base-paired stems: acceptor (in purple),D stem (in red), anticodon (in blue), TψC (in dark green) are depicted. Colors in grayrepresent non-paired regions and anticodon triplet. The variable loop is drawn in lightgreen. In orange the 3’CCA end is also shown, although it is not part of the commonsystem definition due that 3’CCA ends are added in the pre-tRNA proccesing steps. Furtherrepresentation of this secondary structure into three-dimensional structure is depicted inFig. 4.2C. Each structural element from the cloverleaf maps into its three-dimensionalrepresentation. The acceptor stem and TψC-arm stack together to form a continuousalpha-helix, while the D-arm and anticodon arm stack to form another continuous helix.Two RNA double helices cross by 90◦ to form a characteristic L-shaped tertiary structure[129].
58
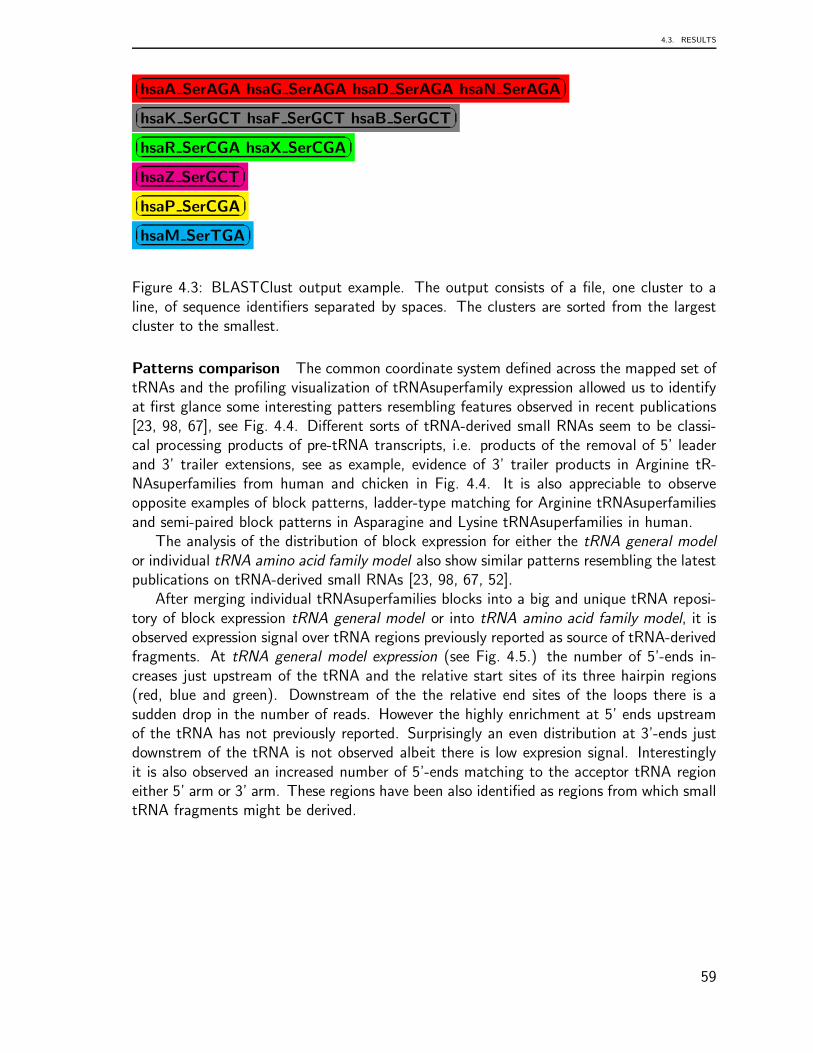
4.3. RESULTS
�
�
�
�hsaA SerAGA hsaG SerAGA hsaD SerAGA hsaN SerAGA�
�
�
�hsaK SerGCT hsaF SerGCT hsaB SerGCT�
�
�
�hsaR SerCGA hsaX SerCGA�
�
�
�hsaZ SerGCT�
�
�
�hsaP SerCGA�
�
�
�hsaM SerTGA
Figure 4.3: BLASTClust output example. The output consists of a file, one cluster to aline, of sequence identifiers separated by spaces. The clusters are sorted from the largestcluster to the smallest.
Patterns comparison The common coordinate system defined across the mapped set oftRNAs and the profiling visualization of tRNAsuperfamily expression allowed us to identifyat first glance some interesting patters resembling features observed in recent publications[23, 98, 67], see Fig. 4.4. Different sorts of tRNA-derived small RNAs seem to be classi-cal processing products of pre-tRNA transcripts, i.e. products of the removal of 5’ leaderand 3’ trailer extensions, see as example, evidence of 3’ trailer products in Arginine tR-NAsuperfamilies from human and chicken in Fig. 4.4. It is also appreciable to observeopposite examples of block patterns, ladder-type matching for Arginine tRNAsuperfamiliesand semi-paired block patterns in Asparagine and Lysine tRNAsuperfamilies in human.
The analysis of the distribution of block expression for either the tRNA general model
or individual tRNA amino acid family model also show similar patterns resembling the latestpublications on tRNA-derived small RNAs [23, 98, 67, 52].
After merging individual tRNAsuperfamilies blocks into a big and unique tRNA reposi-tory of block expression tRNA general model or into tRNA amino acid family model, it isobserved expression signal over tRNA regions previously reported as source of tRNA-derivedfragments. At tRNA general model expression (see Fig. 4.5.) the number of 5’-ends in-creases just upstream of the tRNA and the relative start sites of its three hairpin regions(red, blue and green). Downstream of the the relative end sites of the loops there is asudden drop in the number of reads. However the highly enrichment at 5’ ends upstreamof the tRNA has not previously reported. Surprisingly an even distribution at 3’-ends justdownstrem of the tRNA is not observed albeit there is low expresion signal. Interestinglyit is also observed an increased number of 5’-ends matching to the acceptor tRNA regioneither 5’ arm or 3’ arm. These regions have been also identified as regions from which smalltRNA fragments might be derived.
59
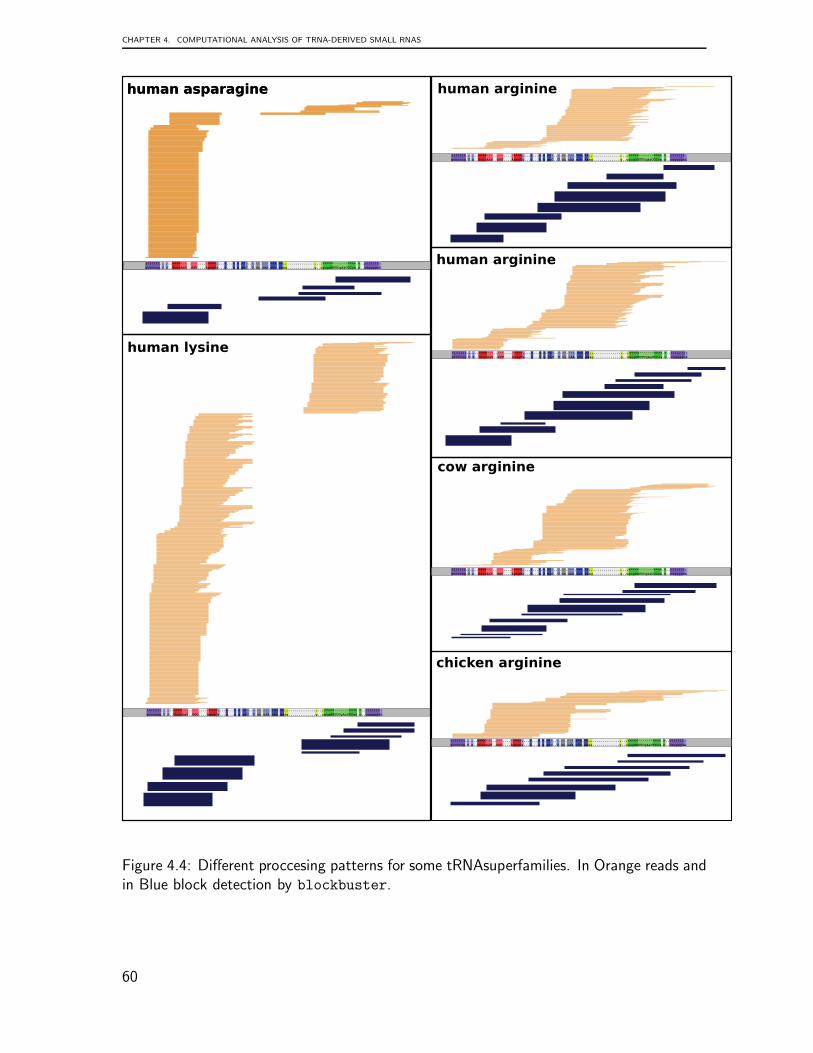
CHAPTER 4. COMPUTATIONAL ANALYSIS OF TRNA-DERIVED SMALL RNAS
(((((((.,.,..<<<<---..---....->>>>,...<...<.<.<<-..-.--.---.>>>.>>,,.............,..,<<<<<------->>>>.>..))))))):
gccccug.U.A..GcucAaU..GGU....AgagCa...u...u.g.gaC..U.uu.uAA.ucc.aaag.............g..ugugGGUUCgAaUCCca.c..caggggcA
(((((((.,.,..<<<<---..---....->>>>,...<...<.<.<<-..-.--.---.>>>.>>,,.............,..,<<<<<------->>>>.>..))))))):
gccccug.U.A..GcucAaU..GGU....AgagCa...u...u.g.gaC..U.uu.uAA.ucc.aaag.............g..ugugGGUUCgAaUCCca.c..caggggcA
human lysine
(((((((.,.,..<<<<---..---....->>>>,...<...<.<.<<-..-.--.---.>>>.>>,,.............,..,<<<<<------->>>>.>..))))))):
gccccug.U.A..GcucAaU..GGU....AgagCa...u...u.g.gaC..U.uu.uAA.ucc.aaag.............g..ugugGGUUCgAaUCCca.c..caggggcA
human asparagine human arginine
(((((((.,.,..<<<<---..---....->>>>,...<...<.<.<<-..-.--.---.>>>.>>,,.............,..,<<<<<------->>>>.>..))))))):
gccccug.U.A..GcucAaU..GGU....AgagCa...u...u.g.gaC..U.uu.uAA.ucc.aaag.............g..ugugGGUUCgAaUCCca.c..caggggcA
human arginine
(((((((.,.,..<<<<---..---....->>>>,...<...<.<.<<-..-.--.---.>>>.>>,,.............,..,<<<<<------->>>>.>..))))))):
gccccug.U.A..GcucAaU..GGU....AgagCa...u...u.g.gaC..U.uu.uAA.ucc.aaag.............g..ugugGGUUCgAaUCCca.c..caggggcA
cow arginine
(((((((.,.,..<<<<---..---....->>>>,...<...<.<.<<-..-.--.---.>>>.>>,,.............,..,<<<<<------->>>>.>..))))))):
gccccug.U.A..GcucAaU..GGU....AgagCa...u...u.g.gaC..U.uu.uAA.ucc.aaag.............g..ugugGGUUCgAaUCCca.c..caggggcA
chicken arginine
(((((((.,.,..<<<<---..---....->>>>,...<...<.<.<<-..-.--.---.>>>.>>,,.............,..,<<<<<------->>>>.>..))))))):
gccccug.U.A..GcucAaU..GGU....AgagCa...u...u.g.gaC..U.uu.uAA.ucc.aaag.............g..ugugGGUUCgAaUCCca.c..caggggcA
human asparagine
Figure 4.4: Different proccesing patterns for some tRNAsuperfamilies. In Orange reads andin Blue block detection by blockbuster.
60
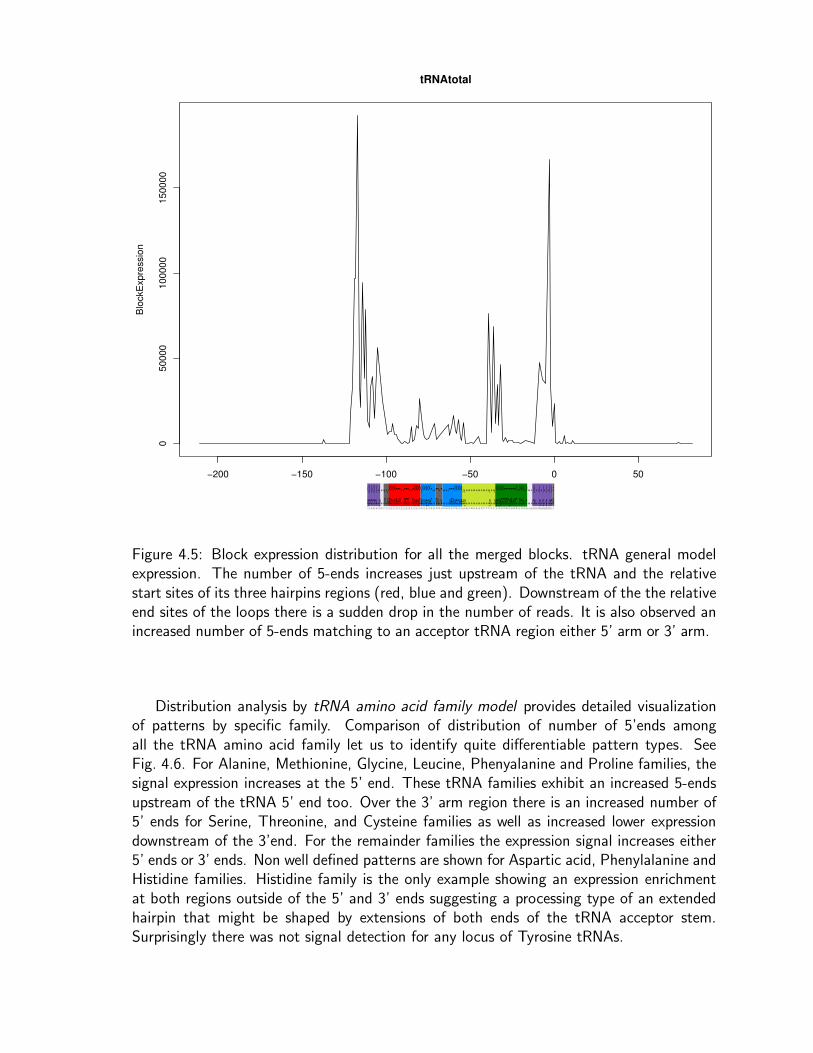
−200 −150 −100 −50 0 50
05
00
00
10
00
00
15
00
00
tRNAtotal
distance (nt)
Blo
ckE
xp
ressio
n
01 02 03 04 05 06 07 08 09 10 11 12 13 14 15 16 17 18 19 20 21 22 23 24 25 26 27 28 29 30 31 32 33 34 35 36 37 38 39 40 41 42 43 44 45 46 47 48 49 50 51 52 53 54 55 56 57 58 59 60 61 62 63 64 65 66 67 68 69 70 71 72 73 74 75 76 77 78 79 80 81 82 83 84 85 86 87 88 89 90 91 92 93 94 95 96 97 98 99 100 101 102 103104 105106 107108 109 110 111 112
((((((.(..,.,<<<<---..---..->>>>,<<<<<-..--.-....--->>>>>,,..............,..,<<<<<------->.>>>.>...))..).).).)):
gccccu.g..U.AGcucAaU..GGU..AgagCauuggaC..Uu.u....uAAuccaaag..............g..ugugGGUUCgAaUC.Cca.c...ca..g.g.g.gcA
Figure 4.5: Block expression distribution for all the merged blocks. tRNA general modelexpression. The number of 5-ends increases just upstream of the tRNA and the relativestart sites of its three hairpins regions (red, blue and green). Downstream of the the relativeend sites of the loops there is a sudden drop in the number of reads. It is also observed anincreased number of 5-ends matching to an acceptor tRNA region either 5’ arm or 3’ arm.
Distribution analysis by tRNA amino acid family model provides detailed visualizationof patterns by specific family. Comparison of distribution of number of 5’ends amongall the tRNA amino acid family let us to identify quite differentiable pattern types. SeeFig. 4.6. For Alanine, Methionine, Glycine, Leucine, Phenyalanine and Proline families, thesignal expression increases at the 5’ end. These tRNA families exhibit an increased 5-endsupstream of the tRNA 5’ end too. Over the 3’ arm region there is an increased number of5’ ends for Serine, Threonine, and Cysteine families as well as increased lower expressiondownstream of the 3’end. For the remainder families the expression signal increases either5’ ends or 3’ ends. Non well defined patterns are shown for Aspartic acid, Phenylalanine andHistidine families. Histidine family is the only example showing an expression enrichmentat both regions outside of the 5’ and 3’ ends suggesting a processing type of an extendedhairpin that might be shaped by extensions of both ends of the tRNA acceptor stem.Surprisingly there was not signal detection for any locus of Tyrosine tRNAs.
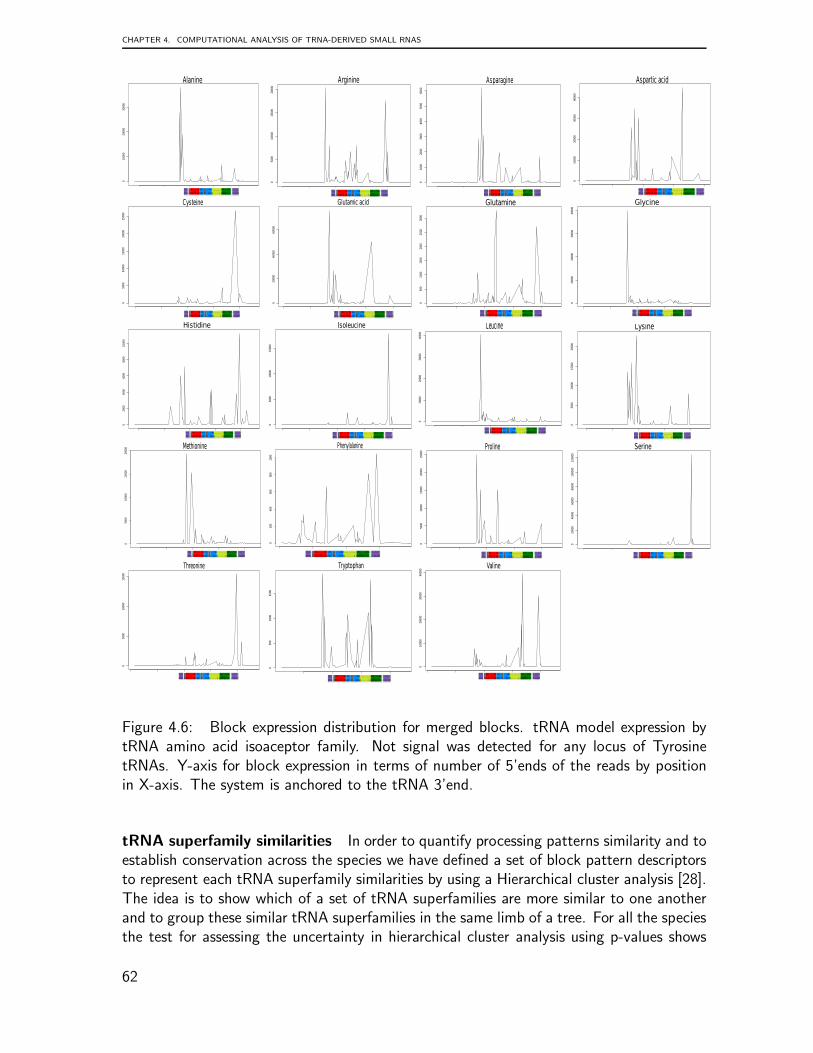
CHAPTER 4. COMPUTATIONAL ANALYSIS OF TRNA-DERIVED SMALL RNAS
010000
20000
30000
01 02 03 04 05 06 07 08 09 10 11 12 13 14 15 16 17 18 19 20 21 22 23 24 25 26 27 28 29 30 31 32 33 34 35 36 37 38 39 40 41 42 43 44 45 46 47 48 49 50 51 52 53 54 55 56 57 58 59 60 61 62 63 64 65 66 67 68 69 70 71 72 73 74 75 76 77 78 79 80 81 82 83 84 85 86 87 88 89 90 91 92 93 94 95 96 97 98 99 100 101 102 103104 105 106 107108 109 110 111 112
( ( ( ( ( ( . ( . . , . , <<<<- - - . . - - - . . - >>>>, <<<<<- . . - - . - . . . . - - - >>>>>, , . . . . . . . . . . . . . . , . . , <<<<<- - - - - - - >. >>>. >. . . ) ) . . ) . ) . ) . ) ) :
gccccu. g. . U. AGcucAaU. . GGU. . AgagCauuggaC. . Uu. u. . . . uAAuccaaag. . . . . . . . . . . . . . g. . ugugGGUUCgAaUC. Cca. c. . . ca. . g. g. g. gcA
05000
10000
15000
20000
Arginine
01 02 03 04 05 06 07 08 09 10 11 12 13 14 15 16 17 18 19 20 21 22 23 24 25 26 27 28 29 30 31 32 33 34 35 36 37 38 39 40 41 42 43 44 45 46 47 48 49 50 51 52 53 54 55 56 57 58 59 60 61 62 63 64 65 66 67 68 69 70 71 72 73 74 75 76 77 78 79 80 81 82 83 84 85 86 87 88 89 90 91 92 93 94 95 96 97 98 99 100 101 102 103104 105 106 107108 109 110 111 112
( ( ( ( ( ( . ( . . , . , <<<<- - - . . - - - . . - >>>>, <<<<<- . . - - . - . . . . - - - >>>>>, , . . . . . . . . . . . . . . , . . , <<<<<- - - - - - - >. >>>. >. . . ) ) . . ) . ) . ) . ) ) :
gccccu. g. . U. AGcucAaU. . GGU. . AgagCauuggaC. . Uu. u. . . . uAAuccaaag. . . . . . . . . . . . . . g. . ugugGGUUCgAaUC. Cca. c. . . ca. . g. g. g. gcA
Alanine
01000
2000
3000
4000
5000
6000
Asparagine
01 02 03 04 05 06 07 08 09 10 11 12 13 14 15 16 17 18 19 20 21 22 23 24 25 26 27 28 29 30 31 32 33 34 35 36 37 38 39 40 41 42 43 44 45 46 47 48 49 50 51 52 53 54 55 56 57 58 59 60 61 62 63 64 65 66 67 68 69 70 71 72 73 74 75 76 77 78 79 80 81 82 83 84 85 86 87 88 89 90 91 92 93 94 95 96 97 98 99 100 101 102 103104 105 106 107108 109 110 111 112
( ( ( ( ( ( . ( . . , . , <<<<- - - . . - - - . . - >>>>, <<<<<- . . - - . - . . . . - - - >>>>>, , . . . . . . . . . . . . . . , . . , <<<<<- - - - - - - >. >>>. >. . . ) ) . . ) . ) . ) . ) ) :
gccccu. g. . U. AGcucAaU. . GGU. . AgagCauuggaC. . Uu. u. . . . uAAuccaaag. . . . . . . . . . . . . . g. . ugugGGUUCgAaUC. Cca. c. . . ca. . g. g. g. gcA
010000
20000
30000
40000
Aspartic acid
01 02 03 04 05 06 07 08 09 10 11 12 13 14 15 16 17 18 19 20 21 22 23 24 25 26 27 28 29 30 31 32 33 34 35 36 37 38 39 40 41 42 43 44 45 46 47 48 49 50 51 52 53 54 55 56 57 58 59 60 61 62 63 64 65 66 67 68 69 70 71 72 73 74 75 76 77 78 79 80 81 82 83 84 85 86 87 88 89 90 91 92 93 94 95 96 97 98 99 100 101 102 103104 105 106 107108 109 110 111 112
( ( ( ( ( ( . ( . . , . , <<<<- - - . . - - - . . - >>>>, <<<<<- . . - - . - . . . . - - - >>>>>, , . . . . . . . . . . . . . . , . . , <<<<<- - - - - - - >. >>>. >. . . ) ) . . ) . ) . ) . ) ) :
gccccu. g. . U. AGcucAaU. . GGU. . AgagCauuggaC. . Uu. u. . . . uAAuccaaag. . . . . . . . . . . . . . g. . ugugGGUUCgAaUC. Cca. c. . . ca. . g. g. g. gcA
05000
10000
15000
20000
25000
Cysteine
01 02 03 04 05 06 07 08 09 10 11 12 13 14 15 16 17 18 19 20 21 22 23 24 25 26 27 28 29 30 31 32 33 34 35 36 37 38 39 40 41 42 43 44 45 46 47 48 49 50 51 52 53 54 55 56 57 58 59 60 61 62 63 64 65 66 67 68 69 70 71 72 73 74 75 76 77 78 79 80 81 82 83 84 85 86 87 88 89 90 91 92 93 94 95 96 97 98 99 100 101 102 103104 105 106 107108 109 110 111 112
( ( ( ( ( ( . ( . . , . , <<<<- - - . . - - - . . - >>>>, <<<<<- . . - - . - . . . . - - - >>>>>, , . . . . . . . . . . . . . . , . . , <<<<<- - - - - - - >. >>>. >. . . ) ) . . ) . ) . ) . ) ) :
gccccu. g. . U. AGcucAaU. . GGU. . AgagCauuggaC. . Uu. u. . . . uAAuccaaag. . . . . . . . . . . . . . g. . ugugGGUUCgAaUC. Cca. c. . . ca. . g. g. g. gcA
020000
40000
60000
Glutamic acid
01 02 03 04 05 06 07 08 09 10 11 12 13 14 15 16 17 18 19 20 21 22 23 24 25 26 27 28 29 30 31 32 33 34 35 36 37 38 39 40 41 42 43 44 45 46 47 48 49 50 51 52 53 54 55 56 57 58 59 60 61 62 63 64 65 66 67 68 69 70 71 72 73 74 75 76 77 78 79 80 81 82 83 84 85 86 87 88 89 90 91 92 93 94 95 96 97 98 99 100 101 102 103104 105 106 107108 109 110 111 112
( ( ( ( ( ( . ( . . , . , <<<<- - - . . - - - . . - >>>>, <<<<<- . . - - . - . . . . - - - >>>>>, , . . . . . . . . . . . . . . , . . , <<<<<- - - - - - - >. >>>. >. . . ) ) . . ) . ) . ) . ) ) :
gccccu. g. . U. AGcucAaU. . GGU. . AgagCauuggaC. . Uu. u. . . . uAAuccaaag. . . . . . . . . . . . . . g. . ugugGGUUCgAaUC. Cca. c. . . ca. . g. g. g. gcA
0500
1000
1500
2000
2500
3000
Glutamine
01 02 03 04 05 06 07 08 09 10 11 12 13 14 15 16 17 18 19 20 21 22 23 24 25 26 27 28 29 30 31 32 33 34 35 36 37 38 39 40 41 42 43 44 45 46 47 48 49 50 51 52 53 54 55 56 57 58 59 60 61 62 63 64 65 66 67 68 69 70 71 72 73 74 75 76 77 78 79 80 81 82 83 84 85 86 87 88 89 90 91 92 93 94 95 96 97 98 99 100 101 102 103104 105 106 107108 109 110 111 112
( ( ( ( ( ( . ( . . , . , <<<<- - - . . - - - . . - >>>>, <<<<<- . . - - . - . . . . - - - >>>>>, , . . . . . . . . . . . . . . , . . , <<<<<- - - - - - - >. >>>. >. . . ) ) . . ) . ) . ) . ) ) :
gccccu. g. . U. AGcucAaU. . GGU. . AgagCauuggaC. . Uu. u. . . . uAAuccaaag. . . . . . . . . . . . . . g. . ugugGGUUCgAaUC. Cca. c. . . ca. . g. g. g. gcA
010000
20000
30000
40000
Glycine
01 02 03 04 05 06 07 08 09 10 11 12 13 14 15 16 17 18 19 20 21 22 23 24 25 26 27 28 29 30 31 32 33 34 35 36 37 38 39 40 41 42 43 44 45 46 47 48 49 50 51 52 53 54 55 56 57 58 59 60 61 62 63 64 65 66 67 68 69 70 71 72 73 74 75 76 77 78 79 80 81 82 83 84 85 86 87 88 89 90 91 92 93 94 95 96 97 98 99 100 101 102 103104 105 106 107108 109 110 111 112
( ( ( ( ( ( . ( . . , . , <<<<- - - . . - - - . . - >>>>, <<<<<- . . - - . - . . . . - - - >>>>>, , . . . . . . . . . . . . . . , . . , <<<<<- - - - - - - >. >>>. >. . . ) ) . . ) . ) . ) . ) ) :
gccccu. g. . U. AGcucAaU. . GGU. . AgagCauuggaC. . Uu. u. . . . uAAuccaaag. . . . . . . . . . . . . . g. . ugugGGUUCgAaUC. Cca. c. . . ca. . g. g. g. gcA
02000
4000
6000
8000
10000
Histidine
01 02 03 04 05 06 07 08 09 10 11 12 13 14 15 16 17 18 19 20 21 22 23 24 25 26 27 28 29 30 31 32 33 34 35 36 37 38 39 40 41 42 43 44 45 46 47 48 49 50 51 52 53 54 55 56 57 58 59 60 61 62 63 64 65 66 67 68 69 70 71 72 73 74 75 76 77 78 79 80 81 82 83 84 85 86 87 88 89 90 91 92 93 94 95 96 97 98 99 100 101 102 103104 105 106 107108 109 110 111 112
( ( ( ( ( ( . ( . . , . , <<<<- - - . . - - - . . - >>>>, <<<<<- . . - - . - . . . . - - - >>>>>, , . . . . . . . . . . . . . . , . . , <<<<<- - - - - - - >. >>>. >. . . ) ) . . ) . ) . ) . ) ) :
gccccu. g. . U. AGcucAaU. . GGU. . AgagCauuggaC. . Uu. u. . . . uAAuccaaag. . . . . . . . . . . . . . g. . ugugGGUUCgAaUC. Cca. c. . . ca. . g. g. g. gcA
05000
10000
15000
Isoleucine
01 02 03 04 05 06 07 08 09 10 11 12 13 14 15 16 17 18 19 20 21 22 23 24 25 26 27 28 29 30 31 32 33 34 35 36 37 38 39 40 41 42 43 44 45 46 47 48 49 50 51 52 53 54 55 56 57 58 59 60 61 62 63 64 65 66 67 68 69 70 71 72 73 74 75 76 77 78 79 80 81 82 83 84 85 86 87 88 89 90 91 92 93 94 95 96 97 98 99 100 101 102 103104 105 106 107108 109 110 111 112
( ( ( ( ( ( . ( . . , . , <<<<- - - . . - - - . . - >>>>, <<<<<- . . - - . - . . . . - - - >>>>>, , . . . . . . . . . . . . . . , . . , <<<<<- - - - - - - >. >>>. >. . . ) ) . . ) . ) . ) . ) ) :
gccccu. g. . U. AGcucAaU. . GGU. . AgagCauuggaC. . Uu. u. . . . uAAuccaaag. . . . . . . . . . . . . . g. . ugugGGUUCgAaUC. Cca. c. . . ca. . g. g. g. gcA
010
000
2000
030
000
4000
0
Leucine
01 02 03 04 05 06 07 08 09 10 11 12 13 14 15 16 17 18 19 20 21 22 23 24 25 26 27 28 29 30 31 32 33 34 35 36 37 38 39 40 41 42 43 44 45 46 47 48 49 50 51 52 53 54 55 56 57 58 59 60 61 62 63 64 65 66 67 68 69 70 71 72 73 74 75 76 77 78 79 80 81 82 83 84 85 86 87 88 89 90 91 92 93 94 95 96 97 98 99 100 101 102 103104 105 106 107108 109 110 111 112
( ( ( ( ( ( . ( . . , . , <<<<- - - . . - - - . . - >>>>, <<<<<- . . - - . - . . . . - - - >>>>>, , . . . . . . . . . . . . . . , . . , <<<<<- - - - - - - >. >>>. >. . . ) ) . . ) . ) . ) . ) ) :
gccccu. g. . U. AGcucAaU. . GGU. . AgagCauuggaC. . Uu. u. . . . uAAuccaaag. . . . . . . . . . . . . . g. . ugugGGUUCgAaUC. Cca. c. . . ca. . g. g. g. gcA
05000
10000
15000
20000
Lysine
01 02 03 04 05 06 07 08 09 10 11 12 13 14 15 16 17 18 19 20 21 22 23 24 25 26 27 28 29 30 31 32 33 34 35 36 37 38 39 40 41 42 43 44 45 46 47 48 49 50 51 52 53 54 55 56 57 58 59 60 61 62 63 64 65 66 67 68 69 70 71 72 73 74 75 76 77 78 79 80 81 82 83 84 85 86 87 88 89 90 91 92 93 94 95 96 97 98 99 100 101 102 103104 105 106 107108 109 110 111 112
( ( ( ( ( ( . ( . . , . , <<<<- - - . . - - - . . - >>>>, <<<<<- . . - - . - . . . . - - - >>>>>, , . . . . . . . . . . . . . . , . . , <<<<<- - - - - - - >. >>>. >. . . ) ) . . ) . ) . ) . ) ) :
gccccu. g. . U. AGcucAaU. . GGU. . AgagCauuggaC. . Uu. u. . . . uAAuccaaag. . . . . . . . . . . . . . g. . ugugGGUUCgAaUC. Cca. c. . . ca. . g. g. g. gcA
05000
10000
15000
20000 Methionine
01 02 03 04 05 06 07 08 09 10 11 12 13 14 15 16 17 18 19 20 21 22 23 24 25 26 27 28 29 30 31 32 33 34 35 36 37 38 39 40 41 42 43 44 45 46 47 48 49 50 51 52 53 54 55 56 57 58 59 60 61 62 63 64 65 66 67 68 69 70 71 72 73 74 75 76 77 78 79 80 81 82 83 84 85 86 87 88 89 90 91 92 93 94 95 96 97 98 99 100 101 102 103104 105 106 107108 109 110 111 112
( ( ( ( ( ( . ( . . , . , <<<<- - - . . - - - . . - >>>>, <<<<<- . . - - . - . . . . - - - >>>>>, , . . . . . . . . . . . . . . , . . , <<<<<- - - - - - - >. >>>. >. . . ) ) . . ) . ) . ) . ) ) :
gccccu. g. . U. AGcucAaU. . GGU. . AgagCauuggaC. . Uu. u. . . . uAAuccaaag. . . . . . . . . . . . . . g. . ugugGGUUCgAaUC. Cca. c. . . ca. . g. g. g. gcA
0200
400
600
800
1000
Phenylalanine
01 02 03 04 05 06 07 08 09 10 11 12 13 14 15 16 17 18 19 20 21 22 23 24 25 26 27 28 29 30 31 32 33 34 35 36 37 38 39 40 41 42 43 44 45 46 47 48 49 50 51 52 53 54 55 56 57 58 59 60 61 62 63 64 65 66 67 68 69 70 71 72 73 74 75 76 77 78 79 80 81 82 83 84 85 86 87 88 89 90 91 92 93 94 95 96 97 98 99 100 101 102 103104 105 106 107108 109 110 111 112
( ( ( ( ( ( . ( . . , . , <<<<- - - . . - - - . . - >>>>, <<<<<- . . - - . - . . . . - - - >>>>>, , . . . . . . . . . . . . . . , . . , <<<<<- - - - - - - >. >>>. >. . . ) ) . . ) . ) . ) . ) ) :
gccccu. g. . U. AGcucAaU. . GGU. . AgagCauuggaC. . Uu. u. . . . uAAuccaaag. . . . . . . . . . . . . . g. . ugugGGUUCgAaUC. Cca. c. . . ca. . g. g. g. gcA
05000
10000
15000
20000
25000
Proline
01 02 03 04 05 06 07 08 09 10 11 12 13 14 15 16 17 18 19 20 21 22 23 24 25 26 27 28 29 30 31 32 33 34 35 36 37 38 39 40 41 42 43 44 45 46 47 48 49 50 51 52 53 54 55 56 57 58 59 60 61 62 63 64 65 66 67 68 69 70 71 72 73 74 75 76 77 78 79 80 81 82 83 84 85 86 87 88 89 90 91 92 93 94 95 96 97 98 99 100 101 102 103104 105 106 107108 109 110 111 112
( ( ( ( ( ( . ( . . , . , <<<<- - - . . - - - . . - >>>>, <<<<<- . . - - . - . . . . - - - >>>>>, , . . . . . . . . . . . . . . , . . , <<<<<- - - - - - - >. >>>. >. . . ) ) . . ) . ) . ) . ) ) :
gccccu. g. . U. AGcucAaU. . GGU. . AgagCauuggaC. . Uu. u. . . . uAAuccaaag. . . . . . . . . . . . . . g. . ugugGGUUCgAaUC. Cca. c. . . ca. . g. g. g. gcA
020000
40000
60000
80000
100000
120000
Serine
01 02 03 04 05 06 07 08 09 10 11 12 13 14 15 16 17 18 19 20 21 22 23 24 25 26 27 28 29 30 31 32 33 34 35 36 37 38 39 40 41 42 43 44 45 46 47 48 49 50 51 52 53 54 55 56 57 58 59 60 61 62 63 64 65 66 67 68 69 70 71 72 73 74 75 76 77 78 79 80 81 82 83 84 85 86 87 88 89 90 91 92 93 94 95 96 97 98 99 100 101 102 103104 105 106 107108 109 110 111 112
( ( ( ( ( ( . ( . . , . , <<<<- - - . . - - - . . - >>>>, <<<<<- . . - - . - . . . . - - - >>>>>, , . . . . . . . . . . . . . . , . . , <<<<<- - - - - - - >. >>>. >. . . ) ) . . ) . ) . ) . ) ) :
gccccu. g. . U. AGcucAaU. . GGU. . AgagCauuggaC. . Uu. u. . . . uAAuccaaag. . . . . . . . . . . . . . g. . ugugGGUUCgAaUC. Cca. c. . . ca. . g. g. g. gcA
05000
10000
15000
Threonine
01 02 03 04 05 06 07 08 09 10 11 12 13 14 15 16 17 18 19 20 21 22 23 24 25 26 27 28 29 30 31 32 33 34 35 36 37 38 39 40 41 42 43 44 45 46 47 48 49 50 51 52 53 54 55 56 57 58 59 60 61 62 63 64 65 66 67 68 69 70 71 72 73 74 75 76 77 78 79 80 81 82 83 84 85 86 87 88 89 90 91 92 93 94 95 96 97 98 99 100 101 102 103104 105 106 107108 109 110 111 112
( ( ( ( ( ( . ( . . , . , <<<<- - - . . - - - . . - >>>>, <<<<<- . . - - . - . . . . - - - >>>>>, , . . . . . . . . . . . . . . , . . , <<<<<- - - - - - - >. >>>. >. . . ) ) . . ) . ) . ) . ) ) :
gccccu. g. . U. AGcucAaU. . GGU. . AgagCauuggaC. . Uu. u. . . . uAAuccaaag. . . . . . . . . . . . . . g. . ugugGGUUCgAaUC. Cca. c. . . ca. . g. g. g. gcA
0500
1000
1500
Tryptophan
01 02 03 04 05 06 07 08 09 10 11 12 13 14 15 16 17 18 19 20 21 22 23 24 25 26 27 28 29 30 31 32 33 34 35 36 37 38 39 40 41 42 43 44 45 46 47 48 49 50 51 52 53 54 55 56 57 58 59 60 61 62 63 64 65 66 67 68 69 70 71 72 73 74 75 76 77 78 79 80 81 82 83 84 85 86 87 88 89 90 91 92 93 94 95 96 97 98 99 100 101 102 103104 105 106 107108 109 110 111 112
( ( ( ( ( ( . ( . . , . , <<<<- - - . . - - - . . - >>>>, <<<<<- . . - - . - . . . . - - - >>>>>, , . . . . . . . . . . . . . . , . . , <<<<<- - - - - - - >. >>>. >. . . ) ) . . ) . ) . ) . ) ) :
gccccu. g. . U. AGcucAaU. . GGU. . AgagCauuggaC. . Uu. u. . . . uAAuccaaag. . . . . . . . . . . . . . g. . ugugGGUUCgAaUC. Cca. c. . . ca. . g. g. g. gcA
010000
20000
30000
40000
Valine
01 02 03 04 05 06 07 08 09 10 11 12 13 14 15 16 17 18 19 20 21 22 23 24 25 26 27 28 29 30 31 32 33 34 35 36 37 38 39 40 41 42 43 44 45 46 47 48 49 50 51 52 53 54 55 56 57 58 59 60 61 62 63 64 65 66 67 68 69 70 71 72 73 74 75 76 77 78 79 80 81 82 83 84 85 86 87 88 89 90 91 92 93 94 95 96 97 98 99 100 101 102 103104 105 106 107108 109 110 111 112
( ( ( ( ( ( . ( . . , . , <<<<- - - . . - - - . . - >>>>, <<<<<- . . - - . - . . . . - - - >>>>>, , . . . . . . . . . . . . . . , . . , <<<<<- - - - - - - >. >>>. >. . . ) ) . . ) . ) . ) . ) ) :
gccccu. g. . U. AGcucAaU. . GGU. . AgagCauuggaC. . Uu. u. . . . uAAuccaaag. . . . . . . . . . . . . . g. . ugugGGUUCgAaUC. Cca. c. . . ca. . g. g. g. gcA
Figure 4.6: Block expression distribution for merged blocks. tRNA model expression bytRNA amino acid isoaceptor family. Not signal was detected for any locus of TyrosinetRNAs. Y-axis for block expression in terms of number of 5’ends of the reads by positionin X-axis. The system is anchored to the tRNA 3’end.
tRNA superfamily similarities In order to quantify processing patterns similarity and toestablish conservation across the species we have defined a set of block pattern descriptorsto represent each tRNA superfamily similarities by using a Hierarchical cluster analysis [28].The idea is to show which of a set of tRNA superfamilies are more similar to one anotherand to group these similar tRNA superfamilies in the same limb of a tree. For all the speciesthe test for assessing the uncertainty in hierarchical cluster analysis using p-values shows
62
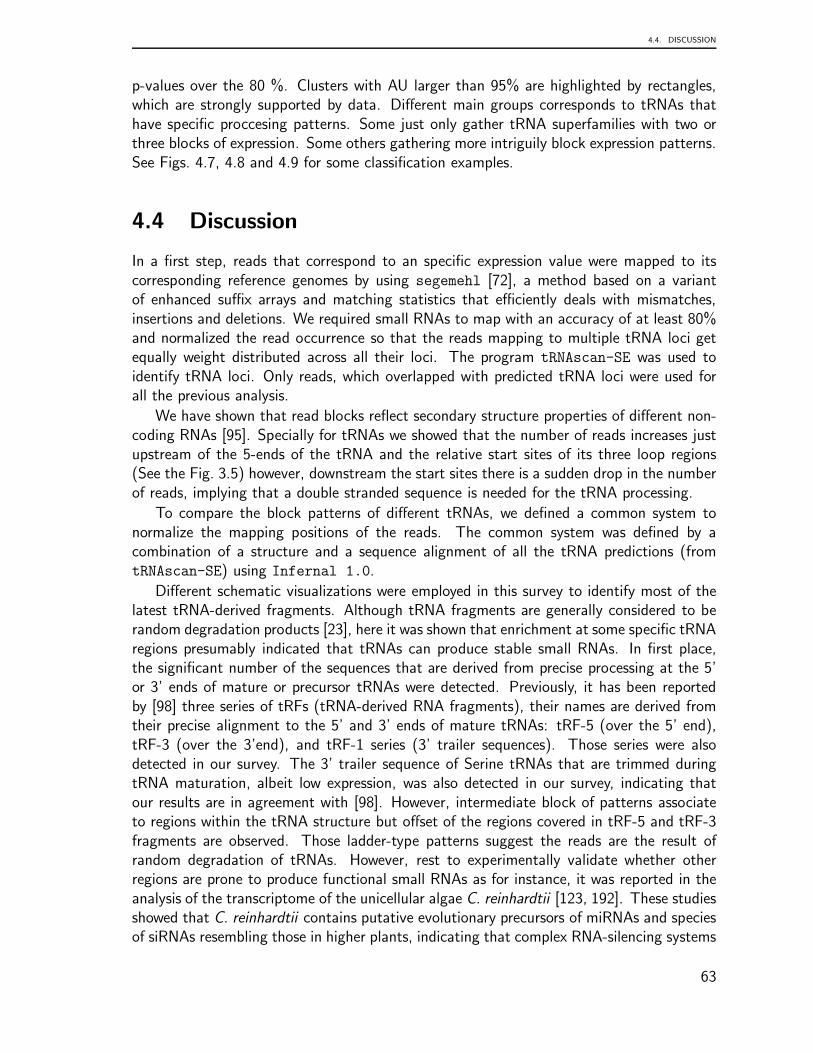
4.4. DISCUSSION
p-values over the 80 %. Clusters with AU larger than 95% are highlighted by rectangles,which are strongly supported by data. Different main groups corresponds to tRNAs thathave specific proccesing patterns. Some just only gather tRNA superfamilies with two orthree blocks of expression. Some others gathering more intriguily block expression patterns.See Figs. 4.7, 4.8 and 4.9 for some classification examples.
4.4 Discussion
In a first step, reads that correspond to an specific expression value were mapped to itscorresponding reference genomes by using segemehl [72], a method based on a variantof enhanced suffix arrays and matching statistics that efficiently deals with mismatches,insertions and deletions. We required small RNAs to map with an accuracy of at least 80%and normalized the read occurrence so that the reads mapping to multiple tRNA loci getequally weight distributed across all their loci. The program tRNAscan-SE was used toidentify tRNA loci. Only reads, which overlapped with predicted tRNA loci were used forall the previous analysis.
We have shown that read blocks reflect secondary structure properties of different non-coding RNAs [95]. Specially for tRNAs we showed that the number of reads increases justupstream of the 5-ends of the tRNA and the relative start sites of its three loop regions(See the Fig. 3.5) however, downstream the start sites there is a sudden drop in the numberof reads, implying that a double stranded sequence is needed for the tRNA processing.
To compare the block patterns of different tRNAs, we defined a common system tonormalize the mapping positions of the reads. The common system was defined by acombination of a structure and a sequence alignment of all the tRNA predictions (fromtRNAscan-SE) using Infernal 1.0.
Different schematic visualizations were employed in this survey to identify most of thelatest tRNA-derived fragments. Although tRNA fragments are generally considered to berandom degradation products [23], here it was shown that enrichment at some specific tRNAregions presumably indicated that tRNAs can produce stable small RNAs. In first place,the significant number of the sequences that are derived from precise processing at the 5’or 3’ ends of mature or precursor tRNAs were detected. Previously, it has been reportedby [98] three series of tRFs (tRNA-derived RNA fragments), their names are derived fromtheir precise alignment to the 5’ and 3’ ends of mature tRNAs: tRF-5 (over the 5’ end),tRF-3 (over the 3’end), and tRF-1 series (3’ trailer sequences). Those series were alsodetected in our survey. The 3’ trailer sequence of Serine tRNAs that are trimmed duringtRNA maturation, albeit low expression, was also detected in our survey, indicating thatour results are in agreement with [98]. However, intermediate block of patterns associateto regions within the tRNA structure but offset of the regions covered in tRF-5 and tRF-3fragments are observed. Those ladder-type patterns suggest the reads are the result ofrandom degradation of tRNAs. However, rest to experimentally validate whether otherregions are prone to produce functional small RNAs as for instance, it was reported in theanalysis of the transcriptome of the unicellular algae C. reinhardtii [123, 192]. These studiesshowed that C. reinhardtii contains putative evolutionary precursors of miRNAs and speciesof siRNAs resembling those in higher plants, indicating that complex RNA-silencing systems
63
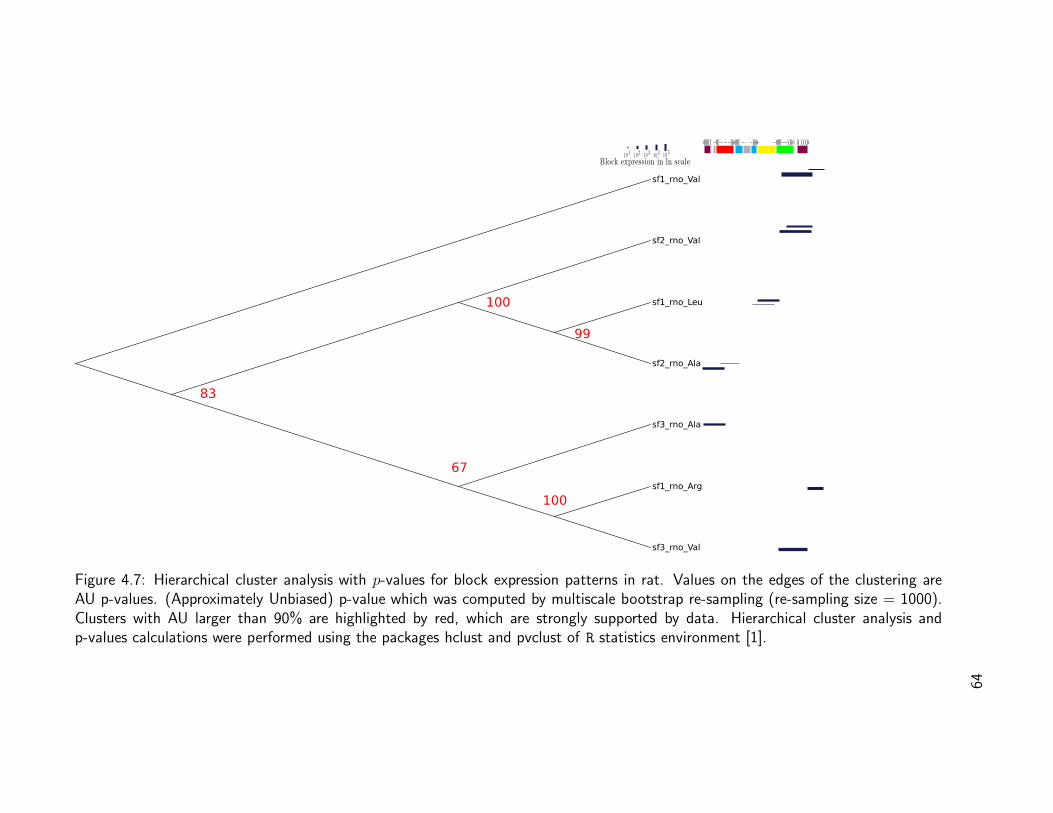
CH
APT
ER
4.
CO
MPU
TAT
ION
AL
AN
ALYSIS
OF
TRN
A-D
ERIV
ED
SM
ALL
RN
AS
sf1_rno_Val
sf2_rno_Val
sf1_rno_Leu
sf2_rno_Ala
sf3_rno_Ala
sf1_rno_Arg
sf3_rno_Val
(((((((..(((.... ......))).(((((. ... ...))))).. ...(((((.......))))) )))))))
83
100
67
100
99
Block expression in ln scale1 0 1 1 0 2 1 0 3 1 0 4 1 0 5
Figure 4.7: Hierarchical cluster analysis with p-values for block expression patterns in rat. Values on the edges of the clustering areAU p-values. (Approximately Unbiased) p-value which was computed by multiscale bootstrap re-sampling (re-sampling size = 1000).Clusters with AU larger than 90% are highlighted by red, which are strongly supported by data. Hierarchical cluster analysis andp-values calculations were performed using the packages hclust and pvclust of R statistics environment [1].
64
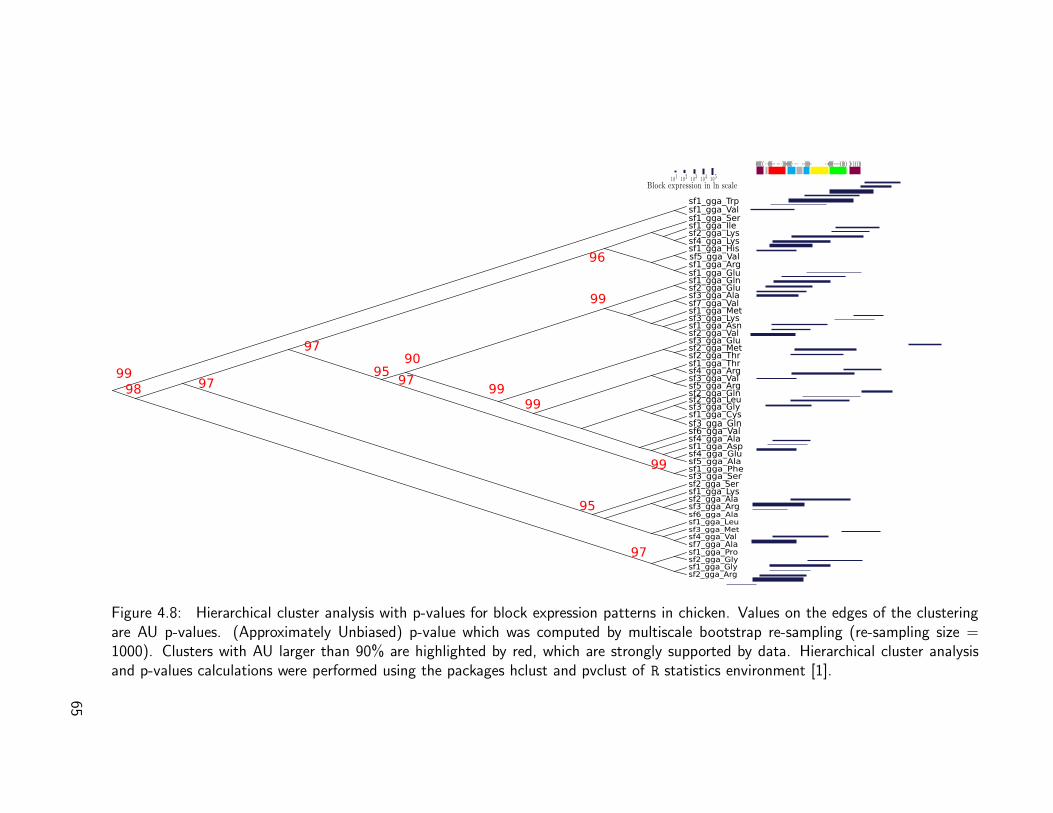
4.4
.D
ISCU
SSIO
N
sf1_gga_Trpsf1_gga_Valsf1_gga_Sersf1_gga_Ilesf2_gga_Lyssf4_gga_Lyssf1_gga_Hissf5_gga_Valsf1_gga_Argsf1_gga_Glusf1_gga_Glnsf2_gga_Glusf3_gga_Alasf7_gga_Valsf1_gga_Metsf3_gga_Lyssf1_gga_Asnsf2_gga_Valsf3_gga_Glusf2_gga_Metsf2_gga_Thrsf1_gga_Thrsf4_gga_Argsf3_gga_Valsf5_gga_Argsf2_gga_Glnsf2_gga_Leusf3_gga_Glysf1_gga_Cyssf3_gga_Glnsf6_gga_Valsf4_gga_Alasf1_gga_Aspsf4_gga_Glusf5_gga_Alasf1_gga_Phesf3_gga_Sersf2_gga_Sersf1_gga_Lyssf2_gga_Alasf3_gga_Argsf6_gga_Alasf1_gga_Leusf3_gga_Metsf4_gga_Valsf7_gga_Alasf1_gga_Prosf2_gga_Glysf1_gga_Glysf2_gga_Arg
(((((((..((((... ... .)))).(((((. ... ...))))).. ...(((((.......))))) )))))))
99
98
97
97
97
95
95
99
97
90
99
96
99
99
Block expression in ln scale1 0 1 1 0 2 1 0 3 1 0 4 1 0 5
Figure 4.8: Hierarchical cluster analysis with p-values for block expression patterns in chicken. Values on the edges of the clusteringare AU p-values. (Approximately Unbiased) p-value which was computed by multiscale bootstrap re-sampling (re-sampling size =1000). Clusters with AU larger than 90% are highlighted by red, which are strongly supported by data. Hierarchical cluster analysisand p-values calculations were performed using the packages hclust and pvclust of R statistics environment [1].
65
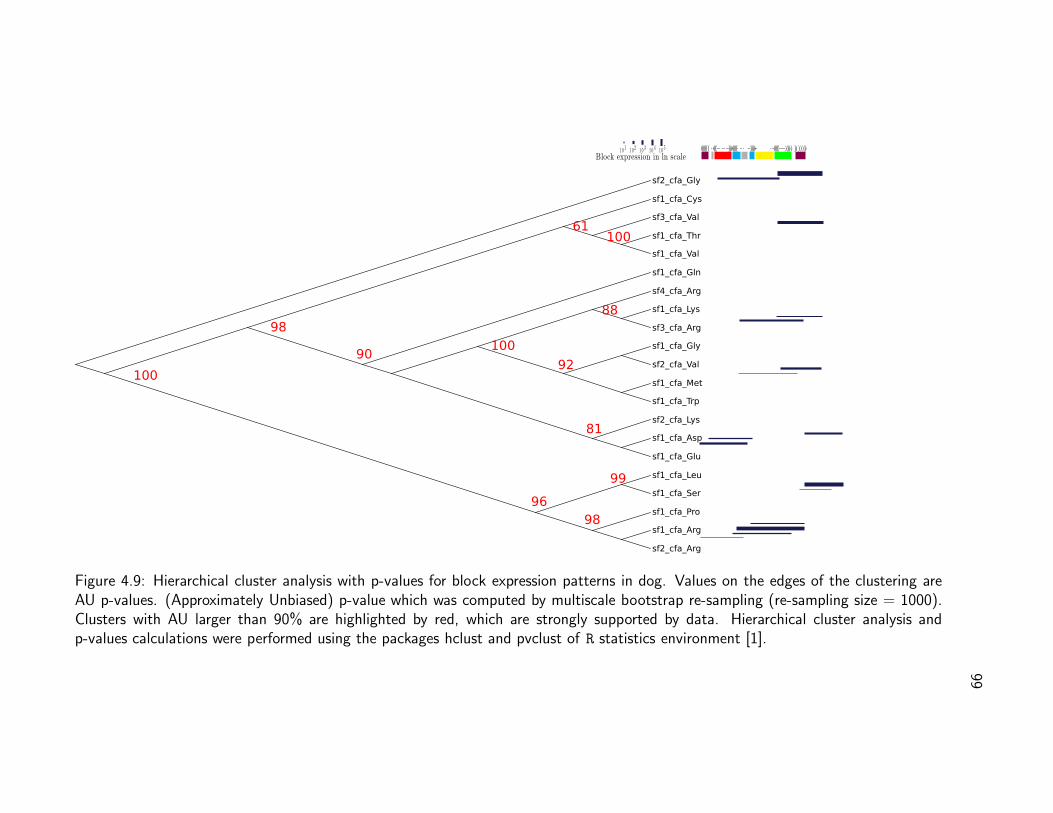
CH
APT
ER
4.
CO
MPU
TAT
ION
AL
AN
ALYSIS
OF
TRN
A-D
ERIV
ED
SM
ALL
RN
AS
sf2_cfa_Gly
sf1_cfa_Cys
sf3_cfa_Val
sf1_cfa_Thr
sf1_cfa_Val
sf1_cfa_Gln
sf4_cfa_Arg
sf1_cfa_Lys
sf3_cfa_Arg
sf1_cfa_Gly
sf2_cfa_Val
sf1_cfa_Met
sf1_cfa_Trp
sf2_cfa_Lys
sf1_cfa_Asp
sf1_cfa_Glu
sf1_cfa_Leu
sf1_cfa_Ser
sf1_cfa_Pro
sf1_cfa_Arg
sf2_cfa_Arg
(((((((..(((.... ......))).(((((. ... ...))))).. ...(((((.......))))) )))))))
98
99
96
92
81
100
88
90
10061
98
100
Block expression in ln scale1 0 1 1 0 2 1 0 3 1 0 4 1 0 5
Figure 4.9: Hierarchical cluster analysis with p-values for block expression patterns in dog. Values on the edges of the clustering areAU p-values. (Approximately Unbiased) p-value which was computed by multiscale bootstrap re-sampling (re-sampling size = 1000).Clusters with AU larger than 90% are highlighted by red, which are strongly supported by data. Hierarchical cluster analysis andp-values calculations were performed using the packages hclust and pvclust of R statistics environment [1].
66
4.5. CONCLUSIONS
evolved before multicellularity and were a feature of primitive eukaryotic cells [123, 192].In a pilot study, we previously identified a set of microRNAs derived from pre-miRNAs inwhich an imperfectly matched tRNA inverted repeat forms a partly double-stranded region,as observed in Chlamydomonas. The location of the processed region correspond to apartial end of the TψC loop, the variable loop and the 3’ end arm of the anticodon stem.A detailed location is shown in Tab. 1.1 and Fig. 1.3.
However, there is also some interesting patterns showed here, suggesting that manytRNA-derived reads do not correspond to random degradation products as has been sug-gested by [98, 65]. Not all the tRNA families are processed to produce small RNAs evenlydistributed. The fact that some specific loci are able to produce small RNA in an specificfashion suggest to us that previous tRNA-derived small RNAs are more diversified thatpreviously though.
We has been also able to identify new sets of tRNA isoacceptors able to produce tRF1besides Serine tRNA families. For example, Cysteine or Threonine tRNA families. Thesetype of tRF-1 has been associated to cell proliferation in mammals as a different pathwayof pre-tRNA transcript processing by the tRNA 3’endonuclease ELAC2 in the cytoplam [98]or cytosolic RNase Z [67]. Some remarkable is that function of 3’ trailers sequences hasbeen previously reported in Bacteria [107] thus it is expected that other tRNA loci mightbe prone to produce functional tRF-1. A population of small RNAs is actively producedin Trypanosoma cruzi [52], and their production was found to increase under conditions ofnutritional stress. This population is preferentially restricted to specific isoacceptors and tothe 5’ halves of mature tRNAs. We also have identified intermediate products of cleavagetRNA as previously reported for stress conditions or/and some other biological pathway[105, 178, 179, 190, 76, 66, 19, 10]. These products have been reported as stable productsopposite to the rapid degradation of preexisting Valine tRNA reported by [7]. However stillrest to identify many pathways related to both tRNA processing and degradation functionsas was mentioned above.
4.5 Conclusions
After mapping short read data to tRNAs, merging consecutive reads to blocks, normalizingthese blocks based on a common system for tRNAs, we were able to show that our blockpatterns are characteristic for some tRNA families within one species and even conservedbetween species. Furthermore we present an classification approach based on block patternsdescriptors, in order to build a tree that shows which tRNA families are similar.
In agreement with previous classification system [95] our survey shows that HTS blockpatterns bear the potential to greatly improve the identification of tRNA-derived smallRNAs from whole transcriptome data. From the analysis of the global expression profilethree series of tRFs (tRNA-derived RNA fragments) have been detected: tRF-5, tRF-3and tRF-1 in agreement with previous results. These small RNAs were reported as thesecond most abundant small RNAs (second only to miRNAs). The importance of tRNA-derived small RNA to the global regulation of RNA silencing through differential Argonauteassociation suggests that small RNA-mediated gene regulation may be even more finelyregulated than previously realized [67].
67
Chapter 5
Conclusions and outlook
5.1 Conclusions
In this thesis are discussed new findings of three novel aspects of tRNA biology: genomeorganization, preliminary transcriptome data analysis, and the classification of a novel classof tRNA-derived small RNAs from transcriptome data.
New aspect about the tRNA genomic organization were widely dicussed. In our anal-ysis, we focus not only on the number of tRNA genes, but also on their relative genomiclocations, and in particular on the formation of tDNA clusters. Surprisingly, we found nodistinctive clade-specific features or large scale trends, with the exception of the ratherstraightforward observation that the larger metazoan genomes typically tend to harbourlarge numbers of tDNAs. In some species, large clusters of tDNAs occur and we discussedhere that this phenomenon is not restricted to a particular clade of protists but ratherappears independently in many times throughout eukaryotes.
In most eukaryotes, tRNAs are multi-copy genes with little or no distinction betweenparalogs so that orthology is hard to establish, in particular in the presence of tRNA geneclusters. As a consequence, the evolution of genomic tRNA arrangements is non-trivial tostudy over larger time-scales. Upper bounds on syntenic conservation can be estimated,however, by considering small sets of flanking protein coding genes for which homologyinformation can be retrieved from existing annotation. We found that tRNAs changetheir genomic location at time-scales comparable to mutation rates: syntenic conservationfades at roughly the same evolutionary distances as sequence conservation in unconstrainedregions.
The absence of large numbers of partially degraded tRNA copies in many of the investi-gated genomes provides a hint at the mechanisms of tRNA mobility. The data collected hereprovide a basis to investigate the connection of of tRNA gene arrangements and genomeorganization in general.
Recent development of deep sequencing technologies allows to identify small regulatoryRNAs. Here, we focus on the identification of small ncRNAs. Our transcriptome surveyresults also discribe new insights of ncRNAs. The block patterns for the evaluated ncRNAsshow some interesting characteristics. Although miRNA loci accumulate far more reads thantRNAs and snoRNA loci, the reads are extremely unevenly distributed across the blocks.For tRNAs we observe series of overlapping blocks that are specific enough to separate this
68
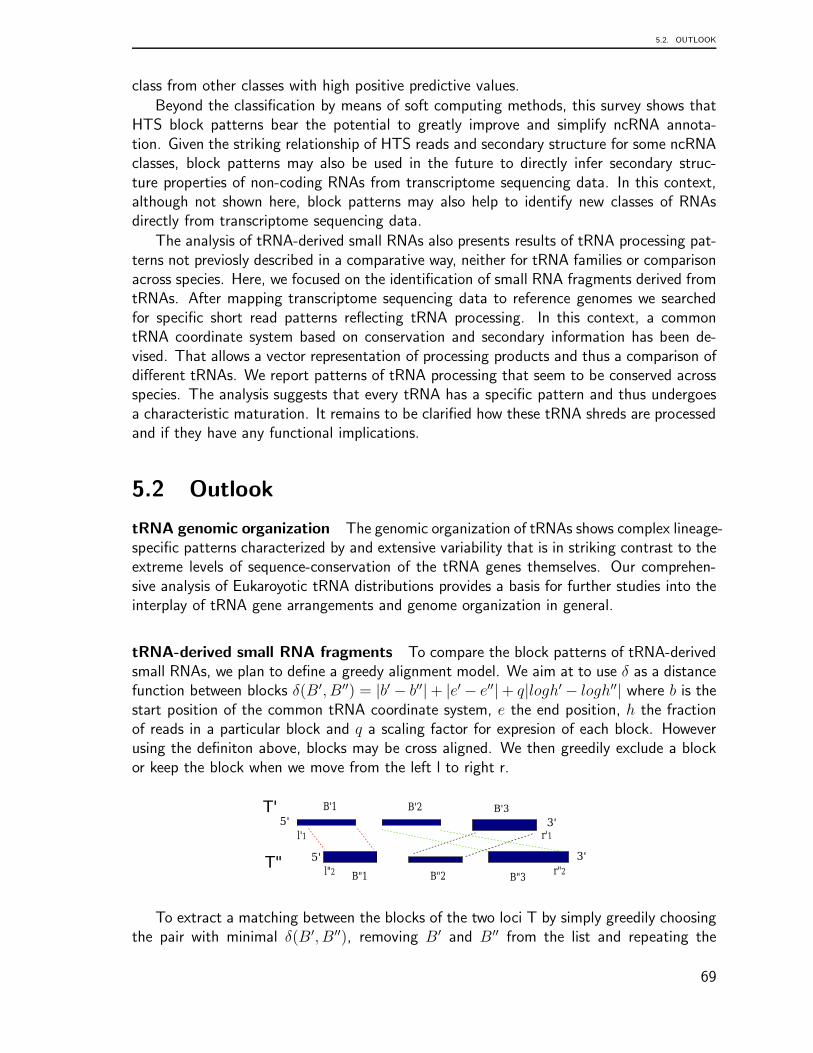
5.2. OUTLOOK
class from other classes with high positive predictive values.
Beyond the classification by means of soft computing methods, this survey shows thatHTS block patterns bear the potential to greatly improve and simplify ncRNA annota-tion. Given the striking relationship of HTS reads and secondary structure for some ncRNAclasses, block patterns may also be used in the future to directly infer secondary struc-ture properties of non-coding RNAs from transcriptome sequencing data. In this context,although not shown here, block patterns may also help to identify new classes of RNAsdirectly from transcriptome sequencing data.
The analysis of tRNA-derived small RNAs also presents results of tRNA processing pat-terns not previosly described in a comparative way, neither for tRNA families or comparisonacross species. Here, we focused on the identification of small RNA fragments derived fromtRNAs. After mapping transcriptome sequencing data to reference genomes we searchedfor specific short read patterns reflecting tRNA processing. In this context, a commontRNA coordinate system based on conservation and secondary information has been de-vised. That allows a vector representation of processing products and thus a comparison ofdifferent tRNAs. We report patterns of tRNA processing that seem to be conserved acrossspecies. The analysis suggests that every tRNA has a specific pattern and thus undergoesa characteristic maturation. It remains to be clarified how these tRNA shreds are processedand if they have any functional implications.
5.2 Outlook
tRNA genomic organization The genomic organization of tRNAs shows complex lineage-specific patterns characterized by and extensive variability that is in striking contrast to theextreme levels of sequence-conservation of the tRNA genes themselves. Our comprehen-sive analysis of Eukaroyotic tRNA distributions provides a basis for further studies into theinterplay of tRNA gene arrangements and genome organization in general.
tRNA-derived small RNA fragments To compare the block patterns of tRNA-derivedsmall RNAs, we plan to define a greedy alignment model. We aim at to use δ as a distancefunction between blocks δ(B′, B′′) = |b′ − b′′|+ |e′ − e′′|+ q|logh′ − logh′′| where b is thestart position of the common tRNA coordinate system, e the end position, h the fractionof reads in a particular block and q a scaling factor for expresion of each block. Howeverusing the definiton above, blocks may be cross aligned. We then greedily exclude a blockor keep the block when we move from the left l to right r.
To extract a matching between the blocks of the two loci T by simply greedily choosingthe pair with minimal δ(B′, B′′), removing B′ and B′′ from the list and repeating the
69
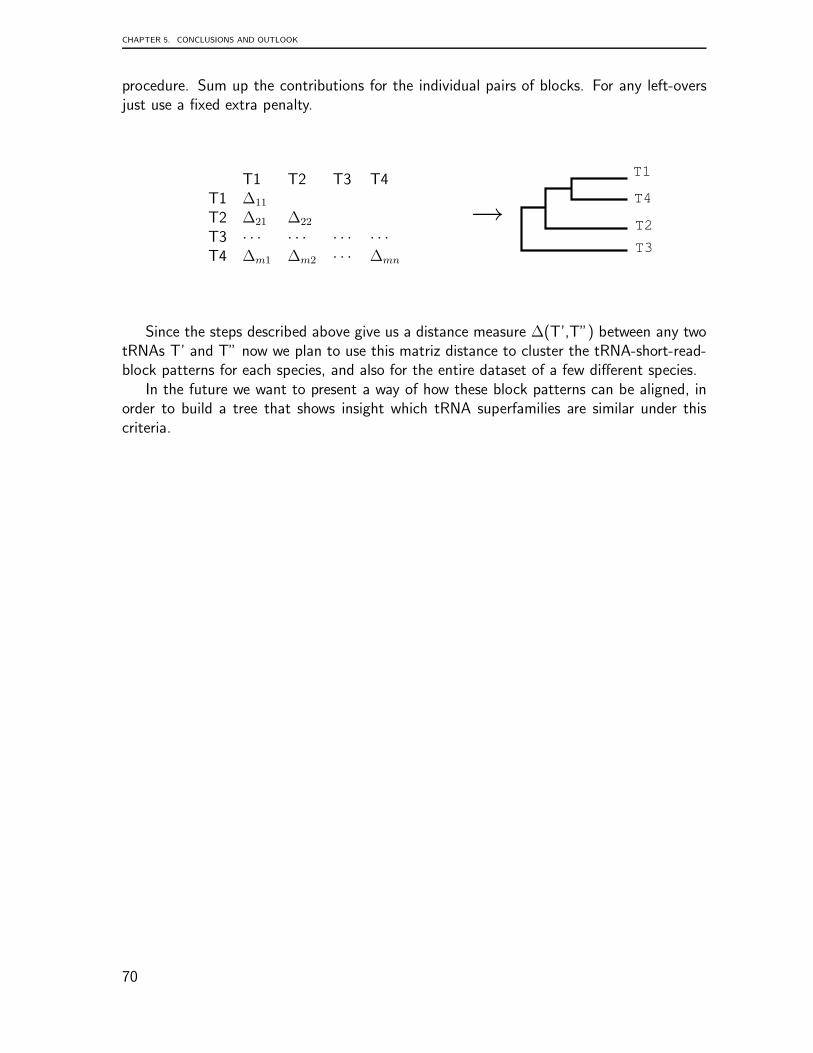
CHAPTER 5. CONCLUSIONS AND OUTLOOK
procedure. Sum up the contributions for the individual pairs of blocks. For any left-oversjust use a fixed extra penalty.
T1 T2 T3 T4T1 ∆11
T2 ∆21 ∆22
T3 · · · · · · · · · · · ·T4 ∆m1 ∆m2 · · · ∆mn
→
Since the steps described above give us a distance measure ∆(T’,T”) between any twotRNAs T’ and T” now we plan to use this matriz distance to cluster the tRNA-short-read-block patterns for each species, and also for the entire dataset of a few different species.
In the future we want to present a way of how these block patterns can be aligned, inorder to build a tree that shows insight which tRNA superfamilies are similar under thiscriteria.
70
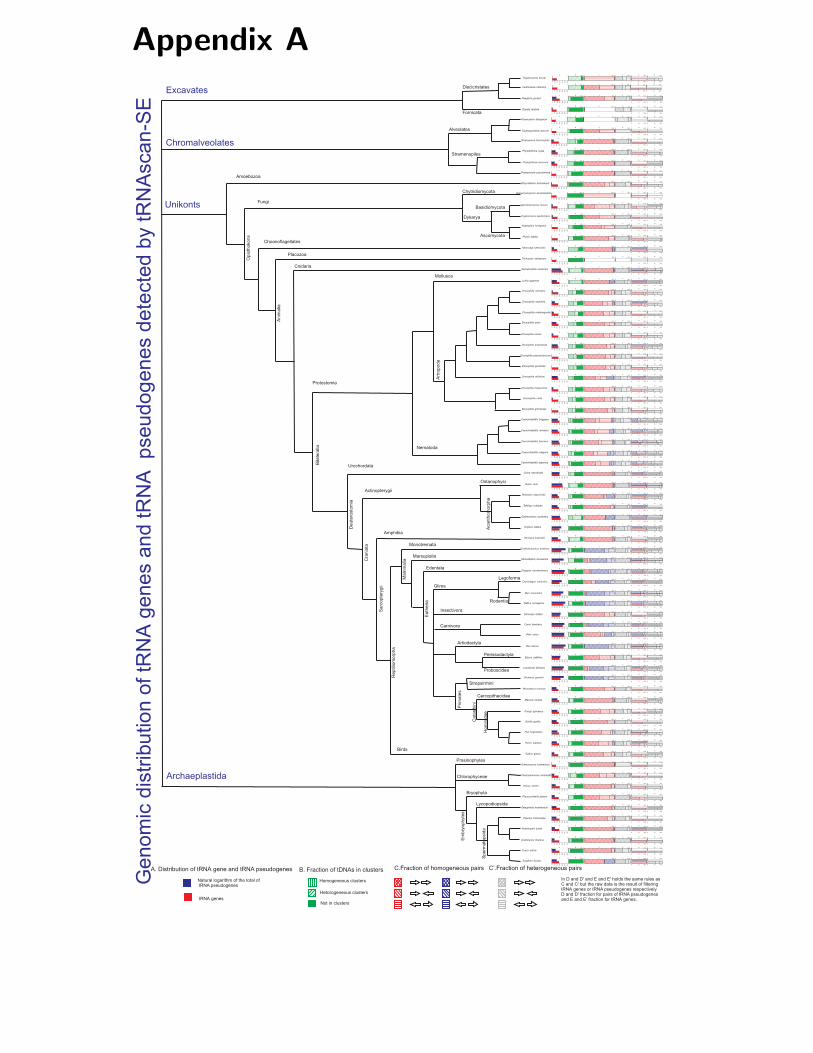
Appendix ATrypanosoma brucei
A
0
1e1
1e2
1e3
1e4
1e5
1e6
B0 100
C0 100
C'0 100
E0 100
D0 100
E'0 100
D'0 100
Leishmania infantum
A
0
1e
1
1e
2
1e
3
1e
4
1e
5
1e
6
B0 100
C0 100
C'0 100
E0 100
D0 100
E'0 100
D'0 100
Naegleria gruberi
A
0
1e1
1e2
1e3
1e4
1e5
1e6
B0 100
C0 100
C'0 100
E0 100
D0 100
E'0 100
D'0 100
Giardia lamblia
A
0
1e1
1e2
1e3
1e4
1e5
1e6
B0 100
C0 100
C'0 100
E0 100
D0 100
E'0 100
D'0 100
Plasmodium falciparum
A
0
1e1
1e2
1e3
1e4
1e5
1e6
B0 100
C0 100
C'0 100
E0 100
D0 100
E'0 100
D'0 100
Cryptosporidium parvum
A
0
1e1
1e2
1e3
1e4
1e5
1e6
B0 100
C0 100
C'0 100
E0 100
D0 100
E'0 100
D'0 100
Tetrahymena thermophilaA
0
1e1
1e2
1e3
1e4
1e5
1e6
B0 100
C0 100
C'0 100
E0 100
D0 100
E'0 100
D'0 100
Phytophthora sojaeA
0
1e1
1e2
1e3
1e4
1e5
1e6
B0 100
C0 100
C'0 100
E0 100
D0 100
E'0 100
D'0 100
Phytophthora ramorumA
0
1e1
1e2
1e3
1e4
1e5
1e6
B0 100
C0 100
C'0 100
E0 100
D0 100
E'0 100
D'0 100
Thalassiosira pseudonanaA
0
1e1
1e2
1e3
1e4
1e5
1e6
B0 100
C0 100
C'0 100
E0 100
D0 100
E'0 100
D'0 100
Dictyostelium discoideumA
0
1e1
1e2
1e3
1e4
1e5
1e6
B0 100
C0 100
C'0 100
E0 100
D0 100
E'0 100
D'0 100
Batrachochytrium dendrobatidisA
0
1e1
1e2
1e3
1e4
1e5
1e6
B0 100
C0 100
C'0 100
E0 100
D0 100
E'0 100
D'0 100
Sporobolomyces roseusA
0
1e1
1e2
1e3
1e4
1e5
1e6
B0 100
C0 100
C'0 100
E0 100
D0 100
E'0 100
D'0 100
Cryptococcus neoformansA
0
1e1
1e2
1e3
1e4
1e5
1e6
B0 100
C0 100
C'0 100
E0 100
D0 100
E'0 100
D'0 100
Aspergillus fumigatusA
0
1e1
1e2
1e3
1e4
1e5
1e6
B0 100
C0 100
C'0 100
E0 100
D0 100
E'0 100
D'0 100
Pichia stipitisA
0
1e1
1e2
1e3
1e4
1e5
1e6
B0 100
C0 100
C'0 100
E0 100
D0 100
E'0 100
D'0 100
Monosiga brevicollisA
0
1e1
1e2
1e3
1e4
1e5
1e6
B0 100
C0 100
C'0 100
E0 100
D0 100
E'0 100
D'0 100
Trichoplax adhaeransA
0
1e1
1e2
1e3
1e4
1e5
1e6
B0 100
C0 100
C'0 100
E0 100
D0 100
E'0 100
D'0 100
Nematostella vectensisA
0
1e1
1e2
1e3
1e4
1e5
1e6
B0 100
C0 100
C'0 100
E0 100
D0 100
E'0 100
D'0 100
Lottia giganteaA
0
1e1
1e2
1e3
1e4
1e5
1e6
B0 100
C0 100
C'0 100
E0 100
D0 100
E'0 100
D'0 100
Drosophila simulansA
0
1e1
1e2
1e3
1e4
1e5
1e6
B0 100
C0 100
C'0 100
E0 100
D0 100
E'0 100
D'0 100
Drosophila sechelliaA
0
1e1
1e2
1e3
1e4
1e5
1e6
B0 100
C0 100
C'0 100
E0 100
D0 100
E'0 100
D'0 100
Drosophila melanogasterA
0
1e1
1e2
1e3
1e4
1e5
1e6
B0 100
C0 100
C'0 100
E0 100
D0 100
E'0 100
D'0 100
Drosophila yakuA
0
1e1
1e2
1e3
1e4
1e5
1e6
B0 100
C0 100
C'0 100
E0 100
D0 100
E'0 100
D'0 100
Drosophila erectaA
0
1e1
1e2
1e3
1e4
1e5
1e6
B0 100
C0 100
C'0 100
E0 100
D0 100
E'0 100
D'0 100
Drosophila ananassaeA
0
1e1
1e2
1e3
1e4
1e5
1e6
B0 100
C0 100
C'0 100
E0 100
D0 100
E'0 100
D'0 100
Drosophila pseudoobscuraA
0
1e1
1e2
1e3
1e4
1e5
1e6
B0 100
C0 100
C'0 100
E0 100
D0 100
E'0 100
D'0 100
Drosophila persimilisA
0
1e1
1e2
1e3
1e4
1e5
1e6
B0 100
C0 100
C'0 100
E0 100
D0 100
E'0 100
D'0 100
Drosophila willistoniA
0
1e1
1e2
1e3
1e4
1e5
1e6
B0 100
C0 100
C'0 100
E0 100
D0 100
E'0 100
D'0 100
Drosophila mojavensisA
0
1e1
1e2
1e3
1e4
1e5
1e6
B0 100
C0 100
C'0 100
E0 100
D0 100
E'0 100
D'0 100
Drosophila virilisA
0
1e
1
1e
2
1e
3
1e
4
1e
5
1e
6
B0 100
C0 100
C'0 100
E0 100
D0 100
E'0 100
D'0 100
Drosophila grimshawiA
0
1e1
1e2
1e3
1e4
1e5
1e6
B0 100
C0 100
C'0 100
E0 100
D0 100
E'0 100
D'0 100
Caenorhabditis briggsaeA
0
1e1
1e2
1e3
1e4
1e5
1e6
B0 100
C0 100
C'0 100
E0 100
D0 100
E'0 100
D'0 100
Caenorhabditis remaneiA
0
1e1
1e2
1e3
1e4
1e5
1e6
B0 100
C0 100
C'0 100
E0 100
D0 100
E'0 100
D'0 100
Caenorhabditis brenneriA
0
1e1
1e2
1e3
1e4
1e5
1e6
B0 100
C0 100
C'0 100
E0 100
D0 100
E'0 100
D'0 100
Caenorhabditis elegansA
0
1e1
1e2
1e3
1e4
1e5
1e6
B0 100
C0 100
C'0 100
E0 100
D0 100
E'0 100
D'0 100
Caenorhabditis japonicaA
0
1e1
1e2
1e3
1e4
1e5
1e6
B0 100
C0 100
C'0 100
E0 100
D0 100
E'0 100
D'0 100
Ciona intestinalisA
0
1e1
1e2
1e3
1e4
1e5
1e6
B0 100
C0 100
C'0 100
E0 100
D0 100
E'0 100
D'0 100
Danio rerioA
0
1e1
1e2
1e3
1e4
1e5
1e6
B0 100
C0 100
C'0 100
E0 100
D0 100
E'0 100
D'0 100
Tetraodon nigroviridisA
0
1e1
1e2
1e3
1e4
1e5
1e6
B0 100
C0 100
C'0 100
E0 100
D0 100
E'0 100
D'0 100
Takifugu rubripesA
0
1e1
1e2
1e3
1e4
1e5
1e6
B0 100
C0 100
C'0 100
E0 100
D0 100
E'0 100
D'0 100
Gasterosteus aculeatusA
0
1e1
1e2
1e3
1e4
1e5
1e6
B0 100
C0 100
C'0 100
E0 100
D0 100
E'0 100
D'0 100
Oryzias latipesA
0
1e1
1e2
1e3
1e4
1e5
1e6
B0 100
C0 100
C'0 100
E0 100
D0 100
E'0 100
D'0 100
Xenopus tropicalisA
0
1e1
1e2
1e3
1e4
1e5
1e6
B0 100
C0 100
C'0 100
E0 100
D0 100
E'0 100
D'0 100
Ornithorhynchus anatinusA
0
1e1
1e2
1e3
1e4
1e5
1e6
B0 100
C0 100
C'0 100
E0 100
D0 100
E'0 100
D'0 100
Monodelphis domesticaA
0
1e1
1e2
1e3
1e4
1e5
1e6
B0 100
C0 100
C'0 100
E0 100
D0 100
E'0 100
D'0 100
Dasypus novemcinctusA
0
1e1
1e2
1e3
1e4
1e5
1e6
B0 100
C0 100
C'0 100
E0 100
D0 100
E'0 100
D'0 100
Oryctolagus cuniculus
A
0
1e1
1e2
1e3
1e4
1e5
1e6
B0 100
C0 100
C'0 100
E0 100
D0 100
E'0 100
D'0 100
Mus muscullus
A
0
1e1
1e2
1e3
1e4
1e5
1e6
B0 100
C0 100
C'0 100
E0 100
D0 100
E'0 100
D'0 100
Rattus norvegicus
A
0
1e1
1e2
1e3
1e4
1e5
1e6
B0 100
C0 100
C'0 100
E0 100
D0 100
E'0 100
D'0 100
Echinops telfairi
A
0
1e1
1e2
1e3
1e4
1e5
1e6
B0 100
C0 100
C'0 100
E0 100
D0 100
E'0 100
D'0 100
Canis familiaris
A
0
1e1
1e2
1e3
1e4
1e5
1e6
B0 100
C0 100
C'0 100
E0 100
D0 100
E'0 100
D'0 100
Felis catus
A
0
1e1
1e2
1e3
1e4
1e5
1e6
B0 100
C0 100
C'0 100
E0 100
D0 100
E'0 100
D'0 100
Bos taurus
A
0
1e1
1e2
1e3
1e4
1e5
1e6
B0 100
C0 100
C'0 100
E0 100
D0 100
E'0 100
D'0 100
Equus caballus
A
0
1e1
1e2
1e3
1e4
1e5
1e6
B0 100
C0 100
C'0 100
E0 100
D0 100
E'0 100
D'0 100
Loxodonta africana
A
0
1e1
1e2
1e3
1e4
1e5
1e6
B0 100
C0 100
C'0 100
E0 100
D0 100
E'0 100
D'0 100
Otolemur garnetii
A
0
1e1
1e2
1e3
1e4
1e5
1e6
B0 100
C0 100
C'0 100
E0 100
D0 100
E'0 100
D'0 100
Microcebus murinus
A
0
1e1
1e2
1e3
1e4
1e5
1e6
B0 100
C0 100
C'0 100
E0 100
D0 100
E'0 100
D'0 100
Macaca mulata
A
0
1e1
1e2
1e3
1e4
1e5
1e6
B0 100
C0 100
C'0 100
E0 100
D0 100
E'0 100
D'0 100
Pongo pymaeus
A
0
1e1
1e2
1e3
1e4
1e5
1e6
B0 100
C0 100
C'0 100
E0 100
D0 100
E'0 100
D'0 100
Gorilla gorilla
A
0
1e1
1e2
1e3
1e4
1e5
1e6
B0 100
C0 100
C'0 100
E0 100
D0 100
E'0 100
D'0 100
Pan troglodytes
A
0
1e1
1e2
1e3
1e4
1e5
1e6
B0 100
C0 100
C'0 100
E0 100
D0 100
E'0 100
D'0 100
Homo sapiens
A
0
1e1
1e2
1e3
1e4
1e5
1e6
B0 100
C0 100
C'0 100
E0 100
D0 100
E'0 100
D'0 100
Gallus gallus
A
0
1e1
1e2
1e3
1e4
1e5
1e6
B0 100
C0 100
C'0 100
E0 100
D0 100
E'0 100
D'0 100
Ostreococcus lucimarinus
A
0
1e1
1e2
1e3
1e4
1e5
1e6
B0 100
C0 100
C'0 100
E0 100
D0 100
E'0 100
D'0 100
Chlamydomonas reinhardtii
A
0
1e1
1e2
1e3
1e4
1e5
1e6
B0 100
C0 100
C'0 100
E0 100
D0 100
E'0 100
D'0 100
Volvox carteri
A
0
1e1
1e2
1e3
1e4
1e5
1e6
B0 100
C0 100
C'0 100
E0 100
D0 100
E'0 100
D'0 100
Physcomitrella patens
A
0
1e1
1e2
1e3
1e4
1e5
1e6
B0 100
C0 100
C'0 100
E0 100
D0 100
E'0 100
D'0 100
Selaginella moellendori
A
0
1e1
1e2
1e3
1e4
1e5
1e6
B0 100
C0 100
C'0 100
E0 100
D0 100
E'0 100
D'0 100
Popolus trichocarpa
A
0
1e1
1e2
1e3
1e4
1e5
1e6
B0 100
C0 100
C'0 100
E0 100
D0 100
E'0 100
D'0 100
Arabidopsis lyrata
A
0
1e1
1e2
1e3
1e4
1e5
1e6
B0 100
C0 100
C'0 100
E0 100
D0 100
E'0 100
D'0 100
Arabidopsis thaliana
A
0
1e1
1e2
1e3
1e4
1e5
1e6
B0 100
C0 100
C'0 100
E0 100
D0 100
E'0 100
D'0 100
Oryza sativa
A
0
1e1
1e2
1e3
1e4
1e5
1e6
B0 100
C0 100
C'0 100
E0 100
D0 100
E'0 100
D'0 100
Sorghum bicolor
A
0
1e1
1e2
1e3
1e4
1e5
1e6
B0 100
C0 100
C'0 100
E0 100
D0 100
E'0 100
D'0 100
Excavates
Chromalveolates
Unikonts
Archaeplastida
Amoebozoa
Op
isth
oko
ns
Fungi
Choanoflagellates
An
ima
lia
Placozoa
Cnidaria
Bila
tera
lia
Protostomia
De
ute
rosto
mia
Mollusca
Art
rop
od
a
Nematoda
Urochordata
Cra
nia
ta
Actinopterygii
Sa
rco
pte
ryg
ii
Amphibia
Re
ptilio
mo
rph
a
Ma
mm
alia
Birds
Monotremata
Marsupialia
Eu
the
ria
Edentata
Glires
Lagoforma
Rodentia
Insectivora
Carnivora
Artiodactyla
Perissodactyla
Proboscidea
Prim
ate
s
Strepsirrhini
Ca
tarr
hin
i
Cercopithecidae
Ho
min
ida
e
Discicristates
Fornicata
Alveolates
Stramenopiles
Chytridiomycota
Dykarya
Basidiomycota
Ascomycota
Ostariophysi
Aca
nth
om
orp
ha
Prasinophytes
Chlorophyceae
Em
bry
op
hyte
s
Bryophyta
Lycopodiopsida
Sp
erm
ato
psid
a
Ge
no
mic
dis
trib
utio
n o
f tR
NA
ge
ne
s a
nd
tR
NA
p
se
ud
og
en
es d
ete
cte
d b
y t
RN
Asca
n-S
E
B. Fraction of tDNAs in clustersA. Distribution of tRNA gene and tRNA pseudogenes
Natural logarithm of the total oftRNA pseudogenes
tRNA genes
Homogeneous clusters
Hetorogeneous clusters
Not in clusters
C.Fraction of homogeneous pairs C’.Fraction of heterogeneous pairs
In D and D' and E and E' holds the same rules asC and C' but the raw data is the result of filteringtRNA genes or tRNA pseudogenes respectivelyD and D' fraction for pairs of tRNA pseudogenesand E and E' fraction for tRNA genes.
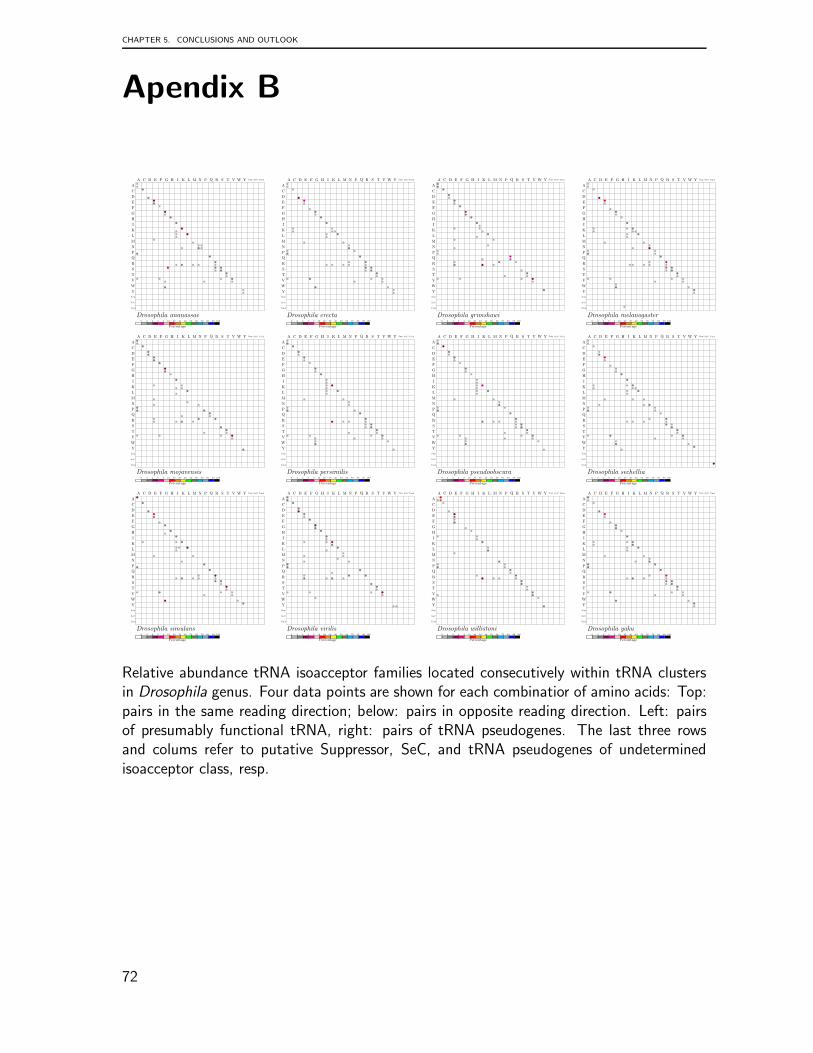
CHAPTER 5. CONCLUSIONS AND OUTLOOK
Apendix B
A C D E F G H I K L M N P Q R S T V W Y Sup SeC Und
A
C
D
E
F
G
H
I
K
L
M
N
P
Q
R
S
T
V
W
Y
Sup
SeC
Und
bbbb
bbbb
bbbb
bbbb
bbbb
bbbb
bbbb
bbbb
bbbb
bbbb
bbbb
bbbb
bbbb
bbbb
bbbb
bbbb
bbbb
bbbb
bbbb
bbbb
bbbb
bbbb
bbbb
bbbb
bbbb
bbbb
bbbb
bbbb
bbbb
bbbb
bbbb
bbbb
bbbb
bbbb
bbbb
bbbb
bbbb
bbbb
bbbb
bbbb
bbbb
bbbb
bbbb
bbbb
bbbb
bbbb
bbbb
bbbb
bbbb
bbbb
bbbb
bbbb
bbbb
bbbb
bbbb
bbbb
bbbb
bbbb
bbbb
bbbb
bbbb
bbbb
bbbb
bbbb
bbbb
bbbb
bbbb
bbbb
bbbb
bbbb
bbbb
bbbb
bbbb
bbbb
bbbb
bbbb
bbbb
bbbb
bbbb
bbbb
bbbb
bbbb
bbbb
bbbb
bbbb
bbbb
bbbb
bbbb
bbbb
bbbb
bbbb
bbbb
bbbb
bbbb
bbbb
bbbb
bbbb
bbbb
bbbb
bbbb
bbbb
bbbb
bbbb
bbbb
bbbb
bbbb
bbbb
bbbb
bbbb
bbbb
bbbb
bbbb
bbbb
bbbb
bbbb
bbbb
bbbb
bbbb
bbbb
bbbb
bbbb
bbbb
bbbb
bbbb
bbbb
bbbb
bbbb
bbbb
bbbb
bbbb
bbbb
bbbb
bbbb
bbbb
bbbb
bbbb
bbbb
bbbb
bbbb
bbbb
bbbb
bbbb
bbbb
bbbb
bbbb
bbbb
bbbb
bbbb
bbbb
bbbb
bbbb
bbbb
bbbb
bbbb
bbbb
bbbb
bbbb
bbbb
bbbb
bbbb
bbbb
bbbb
bbbb
bbbb
bbbb
bbbb
bbbb
bbbb
bbbb
bbbb
bbbb
bbbb
bbbb
bbbb
bbbb
bbbb
bbbb
bbbb
bbbb
bbbb
bbbb
bbbb
bbbb
bbbb
bbbb
bbbb
bbbb
bbbb
bbbb
bbbb
bbbb
bbbb
bbbb
bbbb
bbbb
bbbb
bbbb
bbbb
bbbb
bbbb
bbbb
bbbb
bbbb
bbbb
bbbb
bbbb
bbbb
bbbb
bbbb
bbbb
bbbb
bbbb
bbbb
bbbb
bbbb
bbbb
bbbb
bbbb
bbbb
bbbb
bbbb
bbbb
bbbb
bbbb
bbbb
bbbb
bbbb
bbbb
bbbb
bbbb
bbbb
bbbb
bbbb
bbbb
bbbb
bbbb
bbbb
bbbb
bbbb
bbbb
bbbb
bbbb
bbbb
bbbb
bbbb
bbbb
bbbb
bbbb
bbbb
bbbb
bbbb
bbbb
bbbb
bbbb
bbbb
bbbb
bbbb
bbbb
bbbb
bbbb
bbbb
bbbb
bbbb
bbbb
bbbb
bbbb
bbbb
bbbb
bbbb
bbbb
bbbb
bbbb
bbbb
bbbb
bbbb
bbbb
bbbb
bbbb
bbbb
bbbb
bbbb
bbbb
bbbb
bbbb
bbbb
bbbb
bbbb
bbbb
bbbb
bbbb
bbbb
bbbb
bbbb
bbbb
bbbb
bbbb
bbbb
bbbb
bbbb
bbbb
bbbb
bbbb
bbbb
bbbb
bbbb
bbbb
bbbb
bbbb
bbbb
bbbb
bbbb
bbbb
bbbb
bbbb
bbbb
bbbb
bbbb
bbbb
bbbb
bbbb
bbbb
bbbb
bbbb
bbbb
bbbb
bbbb
bbbb
bbbb
bbbb
bbbb
bbbb
bbbb
bbbb
bbbb
bbbb
bbbb
bbbb
bbbb
bbbb
bbbb
bbbb
bbbb
bbbb
bbbb
bbbb
bbbb
bbbb
bbbb
bbbb
bbbb
bbbb
bbbb
bbbb
bbbb
bbbb
bbbb
bbbb
bbbb
bbbb
bbbb
bbbb
bbbb
bbbb
bbbb
bbbb
bbbb
bbbb
bbbb
bbbb
bbbb
bbbb
bbbb
bbbb
bbbb
bbbb
bbbb
bbbb
bbbb
bbbb
bbbb
bbbb
bbbb
bbbb
bbbb
bbbb
bbbb
bbbb
bbbb
bbbb
bbbb
bbbb
bbbb
bbbb
bbbb
bbbb
bbbb
bbbb
bbbb
bbbb
bbbb
bbbb
bbbb
bbbb
bbbb
bbbb
bbbb
bbbb
bbbb
bbbb
bbbb
bbbb
bbbb
bbbb
bbbb
bbbb
bbbb
bbbb
bbbb
bbbb
bbbb
bbbb
bbbb
bbbb
bbbb
bbbb
bbbb
bbbb
bbbb
bbbb
bbbb
bbbb
bbbb
bbbb
bbbb
bbbb
bbbb
bbbb
bbbb
bbbb
bbbb
bbbb
bbbb
bbbb
bbbb
bbbb
bbbb
bbbb
bbbb
bbbb
bbbb
bbbb
bbbb
bbbb
bbbb
bbbb
bbbb
bbbb
bbbb
bbbb
bbbb
bbbb
bbbb
bbbb
bbbb
bbbb
bbbb
bbbb
bbbb
bbbb
bbbb
bbbb
bbbb
bbbb
bbbb
bbbb
bbbb
bbbb
bbbb
bbbb
bbbb
bbbb
bbbb
bbbb
bbbb
bbbb
bbbb
bbbb
bbbb
bbbb
bbbb
bbbb
bbbb
bbbb
bbbb
bbbb
bbbb
bbbb
bbbb
bbbb
bbbb
bbbb
bbbb
bbbb
bbbb
bbbb
bbbb
bbbb
bbbb
bbbb
bbbb
bbbb
bbbb
bbbb
bbbb
bbbb
bbbb
bbbb
bbbb
bbbb
bbbb
bbbb
bbbb
bbbb
bbbb
bbbb
bbbb
bbbb
bbbb
bbbb
Drosophila ananassae0 2 4 6 8 10 20 30 40 50 60 70 80 90 100
Percentage
A C D E F G H I K L M N P Q R S T V W Y Sup SeC Und
A
C
D
E
F
G
H
I
K
L
M
N
P
Q
R
S
T
V
W
Y
Sup
SeC
Und
bbbb
bbbb
bbbb
bbbb
bbbb
bbbb
bbbb
bbbb
bbbb
bbbb
bbbb
bbbb
bbbb
bbbb
bbbb
bbbb
bbbb
bbbb
bbbb
bbbb
bbbb
bbbb
bbbb
bbbb
bbbb
bbbb
bbbb
bbbb
bbbb
bbbb
bbbb
bbbb
bbbb
bbbb
bbbb
bbbb
bbbb
bbbb
bbbb
bbbb
bbbb
bbbb
bbbb
bbbb
bbbb
bbbb
bbbb
bbbb
bbbb
bbbb
bbbb
bbbb
bbbb
bbbb
bbbb
bbbb
bbbb
bbbb
bbbb
bbbb
bbbb
bbbb
bbbb
bbbb
bbbb
bbbb
bbbb
bbbb
bbbb
bbbb
bbbb
bbbb
bbbb
bbbb
bbbb
bbbb
bbbb
bbbb
bbbb
bbbb
bbbb
bbbb
bbbb
bbbb
bbbb
bbbb
bbbb
bbbb
bbbb
bbbb
bbbb
bbbb
bbbb
bbbb
bbbb
bbbb
bbbb
bbbb
bbbb
bbbb
bbbb
bbbb
bbbb
bbbb
bbbb
bbbb
bbbb
bbbb
bbbb
bbbb
bbbb
bbbb
bbbb
bbbb
bbbb
bbbb
bbbb
bbbb
bbbb
bbbb
bbbb
bbbb
bbbb
bbbb
bbbb
bbbb
bbbb
bbbb
bbbb
bbbb
bbbb
bbbb
bbbb
bbbb
bbbb
bbbb
bbbb
bbbb
bbbb
bbbb
bbbb
bbbb
bbbb
bbbb
bbbb
bbbb
bbbb
bbbb
bbbb
bbbb
bbbb
bbbb
bbbb
bbbb
bbbb
bbbb
bbbb
bbbb
bbbb
bbbb
bbbb
bbbb
bbbb
bbbb
bbbb
bbbb
bbbb
bbbb
bbbb
bbbb
bbbb
bbbb
bbbb
bbbb
bbbb
bbbb
bbbb
bbbb
bbbb
bbbb
bbbb
bbbb
bbbb
bbbb
bbbb
bbbb
bbbb
bbbb
bbbb
bbbb
bbbb
bbbb
bbbb
bbbb
bbbb
bbbb
bbbb
bbbb
bbbb
bbbb
bbbb
bbbb
bbbb
bbbb
bbbb
bbbb
bbbb
bbbb
bbbb
bbbb
bbbb
bbbb
bbbb
bbbb
bbbb
bbbb
bbbb
bbbb
bbbb
bbbb
bbbb
bbbb
bbbb
bbbb
bbbb
bbbb
bbbb
bbbb
bbbb
bbbb
bbbb
bbbb
bbbb
bbbb
bbbb
bbbb
bbbb
bbbb
bbbb
bbbb
bbbb
bbbb
bbbb
bbbb
bbbb
bbbb
bbbb
bbbb
bbbb
bbbb
bbbb
bbbb
bbbb
bbbb
bbbb
bbbb
bbbb
bbbb
bbbb
bbbb
bbbb
bbbb
bbbb
bbbb
bbbb
bbbb
bbbb
bbbb
bbbb
bbbb
bbbb
bbbb
bbbb
bbbb
bbbb
bbbb
bbbb
bbbb
bbbb
bbbb
bbbb
bbbb
bbbb
bbbb
bbbb
bbbb
bbbb
bbbb
bbbb
bbbb
bbbb
bbbb
bbbb
bbbb
bbbb
bbbb
bbbb
bbbb
bbbb
bbbb
bbbb
bbbb
bbbb
bbbb
bbbb
bbbb
bbbb
bbbb
bbbb
bbbb
bbbb
bbbb
bbbb
bbbb
bbbb
bbbb
bbbb
bbbb
bbbb
bbbb
bbbb
bbbb
bbbb
bbbb
bbbb
bbbb
bbbb
bbbb
bbbb
bbbb
bbbb
bbbb
bbbb
bbbb
bbbb
bbbb
bbbb
bbbb
bbbb
bbbb
bbbb
bbbb
bbbb
bbbb
bbbb
bbbb
bbbb
bbbb
bbbb
bbbb
bbbb
bbbb
bbbb
bbbb
bbbb
bbbb
bbbb
bbbb
bbbb
bbbb
bbbb
bbbb
bbbb
bbbb
bbbb
bbbb
bbbb
bbbb
bbbb
bbbb
bbbb
bbbb
bbbb
bbbb
bbbb
bbbb
bbbb
bbbb
bbbb
bbbb
bbbb
bbbb
bbbb
bbbb
bbbb
bbbb
bbbb
bbbb
bbbb
bbbb
bbbb
bbbb
bbbb
bbbb
bbbb
bbbb
bbbb
bbbb
bbbb
bbbb
bbbb
bbbb
bbbb
bbbb
bbbb
bbbb
bbbb
bbbb
bbbb
bbbb
bbbb
bbbb
bbbb
bbbb
bbbb
bbbb
bbbb
bbbb
bbbb
bbbb
bbbb
bbbb
bbbb
bbbb
bbbb
bbbb
bbbb
bbbb
bbbb
bbbb
bbbb
bbbb
bbbb
bbbb
bbbb
bbbb
bbbb
bbbb
bbbb
bbbb
bbbb
bbbb
bbbb
bbbb
bbbb
bbbb
bbbb
bbbb
bbbb
bbbb
bbbb
bbbb
bbbb
bbbb
bbbb
bbbb
bbbb
bbbb
bbbb
bbbb
bbbb
bbbb
bbbb
bbbb
bbbb
bbbb
bbbb
bbbb
bbbb
bbbb
bbbb
bbbb
bbbb
bbbb
bbbb
bbbb
bbbb
bbbb
bbbb
bbbb
bbbb
bbbb
bbbb
bbbb
bbbb
bbbb
bbbb
bbbb
bbbb
bbbb
bbbb
bbbb
bbbb
bbbb
bbbb
bbbb
bbbb
bbbb
bbbb
bbbb
bbbb
bbbb
bbbb
bbbb
bbbb
bbbb
bbbb
bbbb
bbbb
bbbb
bbbb
bbbb
bbbb
bbbb
bbbb
bbbb
bbbb
bbbb
bbbb
bbbb
bbbb
bbbb
bbbb
bbbb
bbbb
bbbb
bbbb
bbbb
bbbb
Drosophila erecta0 2 4 6 8 10 20 30 40 50 60 70 80 90 100
Percentage
A C D E F G H I K L M N P Q R S T V W Y Sup SeC Und
A
C
D
E
F
G
H
I
K
L
M
N
P
Q
R
S
T
V
W
Y
Sup
SeC
Und
bbbb
bbbb
bbbb
bbbb
bbbb
bbbb
bbbb
bbbb
bbbb
bbbb
bbbb
bbbb
bbbb
bbbb
bbbb
bbbb
bbbb
bbbb
bbbb
bbbb
bbbb
bbbb
bbbb
bbbb
bbbb
bbbb
bbbb
bbbb
bbbb
bbbb
bbbb
bbbb
bbbb
bbbb
bbbb
bbbb
bbbb
bbbb
bbbb
bbbb
bbbb
bbbb
bbbb
bbbb
bbbb
bbbb
bbbb
bbbb
bbbb
bbbb
bbbb
bbbb
bbbb
bbbb
bbbb
bbbb
bbbb
bbbb
bbbb
bbbb
bbbb
bbbb
bbbb
bbbb
bbbb
bbbb
bbbb
bbbb
bbbb
bbbb
bbbb
bbbb
bbbb
bbbb
bbbb
bbbb
bbbb
bbbb
bbbb
bbbb
bbbb
bbbb
bbbb
bbbb
bbbb
bbbb
bbbb
bbbb
bbbb
bbbb
bbbb
bbbb
bbbb
bbbb
bbbb
bbbb
bbbb
bbbb
bbbb
bbbb
bbbb
bbbb
bbbb
bbbb
bbbb
bbbb
bbbb
bbbb
bbbb
bbbb
bbbb
bbbb
bbbb
bbbb
bbbb
bbbb
bbbb
bbbb
bbbb
bbbb
bbbb
bbbb
bbbb
bbbb
bbbb
bbbb
bbbb
bbbb
bbbb
bbbb
bbbb
bbbb
bbbb
bbbb
bbbb
bbbb
bbbb
bbbb
bbbb
bbbb
bbbb
bbbb
bbbb
bbbb
bbbb
bbbb
bbbb
bbbb
bbbb
bbbb
bbbb
bbbb
bbbb
bbbb
bbbb
bbbb
bbbb
bbbb
bbbb
bbbb
bbbb
bbbb
bbbb
bbbb
bbbb
bbbb
bbbb
bbbb
bbbb
bbbb
bbbb
bbbb
bbbb
bbbb
bbbb
bbbb
bbbb
bbbb
bbbb
bbbb
bbbb
bbbb
bbbb
bbbb
bbbb
bbbb
bbbb
bbbb
bbbb
bbbb
bbbb
bbbb
bbbb
bbbb
bbbb
bbbb
bbbb
bbbb
bbbb
bbbb
bbbb
bbbb
bbbb
bbbb
bbbb
bbbb
bbbb
bbbb
bbbb
bbbb
bbbb
bbbb
bbbb
bbbb
bbbb
bbbb
bbbb
bbbb
bbbb
bbbb
bbbb
bbbb
bbbb
bbbb
bbbb
bbbb
bbbb
bbbb
bbbb
bbbb
bbbb
bbbb
bbbb
bbbb
bbbb
bbbb
bbbb
bbbb
bbbb
bbbb
bbbb
bbbb
bbbb
bbbb
bbbb
bbbb
bbbb
bbbb
bbbb
bbbb
bbbb
bbbb
bbbb
bbbb
bbbb
bbbb
bbbb
bbbb
bbbb
bbbb
bbbb
bbbb
bbbb
bbbb
bbbb
bbbb
bbbb
bbbb
bbbb
bbbb
bbbb
bbbb
bbbb
bbbb
bbbb
bbbb
bbbb
bbbb
bbbb
bbbb
bbbb
bbbb
bbbb
bbbb
bbbb
bbbb
bbbb
bbbb
bbbb
bbbb
bbbb
bbbb
bbbb
bbbb
bbbb
bbbb
bbbb
bbbb
bbbb
bbbb
bbbb
bbbb
bbbb
bbbb
bbbb
bbbb
bbbb
bbbb
bbbb
bbbb
bbbb
bbbb
bbbb
bbbb
bbbb
bbbb
bbbb
bbbb
bbbb
bbbb
bbbb
bbbb
bbbb
bbbb
bbbb
bbbb
bbbb
bbbb
bbbb
bbbb
bbbb
bbbb
bbbb
bbbb
bbbb
bbbb
bbbb
bbbb
bbbb
bbbb
bbbb
bbbb
bbbb
bbbb
bbbb
bbbb
bbbb
bbbb
bbbb
bbbb
bbbb
bbbb
bbbb
bbbb
bbbb
bbbb
bbbb
bbbb
bbbb
bbbb
bbbb
bbbb
bbbb
bbbb
bbbb
bbbb
bbbb
bbbb
bbbb
bbbb
bbbb
bbbb
bbbb
bbbb
bbbb
bbbb
bbbb
bbbb
bbbb
bbbb
bbbb
bbbb
bbbb
bbbb
bbbb
bbbb
bbbb
bbbb
bbbb
bbbb
bbbb
bbbb
bbbb
bbbb
bbbb
bbbb
bbbb
bbbb
bbbb
bbbb
bbbb
bbbb
bbbb
bbbb
bbbb
bbbb
bbbb
bbbb
bbbb
bbbb
bbbb
bbbb
bbbb
bbbb
bbbb
bbbb
bbbb
bbbb
bbbb
bbbb
bbbb
bbbb
bbbb
bbbb
bbbb
bbbb
bbbb
bbbb
bbbb
bbbb
bbbb
bbbb
bbbb
bbbb
bbbb
bbbb
bbbb
bbbb
bbbb
bbbb
bbbb
bbbb
bbbb
bbbb
bbbb
bbbb
bbbb
bbbb
bbbb
bbbb
bbbb
bbbb
bbbb
bbbb
bbbb
bbbb
bbbb
bbbb
bbbb
bbbb
bbbb
bbbb
bbbb
bbbb
bbbb
bbbb
bbbb
bbbb
bbbb
bbbb
bbbb
bbbb
bbbb
bbbb
bbbb
bbbb
bbbb
bbbb
bbbb
bbbb
bbbb
bbbb
bbbb
bbbb
bbbb
bbbb
bbbb
bbbb
bbbb
bbbb
bbbb
bbbb
bbbb
bbbb
bbbb
bbbb
bbbb
bbbb
bbbb
bbbb
bbbb
bbbb
bbbb
bbbb
bbbb
bbbb
bbbb
bbbb
bbbb
bbbb
bbbb
bbbb
bbbb
bbbb
bbbb
bbbb
bbbb
bbbb
bbbb
bbbb
bbbb
bbbb
bbbb
bbbb
bbbb
bbbb
bbbb
bbbb
bbbb
Drosophila grimshawi0 2 4 6 8 10 20 30 40 50 60 70 80 90 100
Percentage
A C D E F G H I K L M N P Q R S T V W Y Sup SeC Und
A
C
D
E
F
G
H
I
K
L
M
N
P
Q
R
S
T
V
W
Y
Sup
SeC
Und
bbbb
bbbb
bbbb
bbbb
bbbb
bbbb
bbbb
bbbb
bbbb
bbbb
bbbb
bbbb
bbbb
bbbb
bbbb
bbbb
bbbb
bbbb
bbbb
bbbb
bbbb
bbbb
bbbb
bbbb
bbbb
bbbb
bbbb
bbbb
bbbb
bbbb
bbbb
bbbb
bbbb
bbbb
bbbb
bbbb
bbbb
bbbb
bbbb
bbbb
bbbb
bbbb
bbbb
bbbb
bbbb
bbbb
bbbb
bbbb
bbbb
bbbb
bbbb
bbbb
bbbb
bbbb
bbbb
bbbb
bbbb
bbbb
bbbb
bbbb
bbbb
bbbb
bbbb
bbbb
bbbb
bbbb
bbbb
bbbb
bbbb
bbbb
bbbb
bbbb
bbbb
bbbb
bbbb
bbbb
bbbb
bbbb
bbbb
bbbb
bbbb
bbbb
bbbb
bbbb
bbbb
bbbb
bbbb
bbbb
bbbb
bbbb
bbbb
bbbb
bbbb
bbbb
bbbb
bbbb
bbbb
bbbb
bbbb
bbbb
bbbb
bbbb
bbbb
bbbb
bbbb
bbbb
bbbb
bbbb
bbbb
bbbb
bbbb
bbbb
bbbb
bbbb
bbbb
bbbb
bbbb
bbbb
bbbb
bbbb
bbbb
bbbb
bbbb
bbbb
bbbb
bbbb
bbbb
bbbb
bbbb
bbbb
bbbb
bbbb
bbbb
bbbb
bbbb
bbbb
bbbb
bbbb
bbbb
bbbb
bbbb
bbbb
bbbb
bbbb
bbbb
bbbb
bbbb
bbbb
bbbb
bbbb
bbbb
bbbb
bbbb
bbbb
bbbb
bbbb
bbbb
bbbb
bbbb
bbbb
bbbb
bbbb
bbbb
bbbb
bbbb
bbbb
bbbb
bbbb
bbbb
bbbb
bbbb
bbbb
bbbb
bbbb
bbbb
bbbb
bbbb
bbbb
bbbb
bbbb
bbbb
bbbb
bbbb
bbbb
bbbb
bbbb
bbbb
bbbb
bbbb
bbbb
bbbb
bbbb
bbbb
bbbb
bbbb
bbbb
bbbb
bbbb
bbbb
bbbb
bbbb
bbbb
bbbb
bbbb
bbbb
bbbb
bbbb
bbbb
bbbb
bbbb
bbbb
bbbb
bbbb
bbbb
bbbb
bbbb
bbbb
bbbb
bbbb
bbbb
bbbb
bbbb
bbbb
bbbb
bbbb
bbbb
bbbb
bbbb
bbbb
bbbb
bbbb
bbbb
bbbb
bbbb
bbbb
bbbb
bbbb
bbbb
bbbb
bbbb
bbbb
bbbb
bbbb
bbbb
bbbb
bbbb
bbbb
bbbb
bbbb
bbbb
bbbb
bbbb
bbbb
bbbb
bbbb
bbbb
bbbb
bbbb
bbbb
bbbb
bbbb
bbbb
bbbb
bbbb
bbbb
bbbb
bbbb
bbbb
bbbb
bbbb
bbbb
bbbb
bbbb
bbbb
bbbb
bbbb
bbbb
bbbb
bbbb
bbbb
bbbb
bbbb
bbbb
bbbb
bbbb
bbbb
bbbb
bbbb
bbbb
bbbb
bbbb
bbbb
bbbb
bbbb
bbbb
bbbb
bbbb
bbbb
bbbb
bbbb
bbbb
bbbb
bbbb
bbbb
bbbb
bbbb
bbbb
bbbb
bbbb
bbbb
bbbb
bbbb
bbbb
bbbb
bbbb
bbbb
bbbb
bbbb
bbbb
bbbb
bbbb
bbbb
bbbb
bbbb
bbbb
bbbb
bbbb
bbbb
bbbb
bbbb
bbbb
bbbb
bbbb
bbbb
bbbb
bbbb
bbbb
bbbb
bbbb
bbbb
bbbb
bbbb
bbbb
bbbb
bbbb
bbbb
bbbb
bbbb
bbbb
bbbb
bbbb
bbbb
bbbb
bbbb
bbbb
bbbb
bbbb
bbbb
bbbb
bbbb
bbbb
bbbb
bbbb
bbbb
bbbb
bbbb
bbbb
bbbb
bbbb
bbbb
bbbb
bbbb
bbbb
bbbb
bbbb
bbbb
bbbb
bbbb
bbbb
bbbb
bbbb
bbbb
bbbb
bbbb
bbbb
bbbb
bbbb
bbbb
bbbb
bbbb
bbbb
bbbb
bbbb
bbbb
bbbb
bbbb
bbbb
bbbb
bbbb
bbbb
bbbb
bbbb
bbbb
bbbb
bbbb
bbbb
bbbb
bbbb
bbbb
bbbb
bbbb
bbbb
bbbb
bbbb
bbbb
bbbb
bbbb
bbbb
bbbb
bbbb
bbbb
bbbb
bbbb
bbbb
bbbb
bbbb
bbbb
bbbb
bbbb
bbbb
bbbb
bbbb
bbbb
bbbb
bbbb
bbbb
bbbb
bbbb
bbbb
bbbb
bbbb
bbbb
bbbb
bbbb
bbbb
bbbb
bbbb
bbbb
bbbb
bbbb
bbbb
bbbb
bbbb
bbbb
bbbb
bbbb
bbbb
bbbb
bbbb
bbbb
bbbb
bbbb
bbbb
bbbb
bbbb
bbbb
bbbb
bbbb
bbbb
bbbb
bbbb
bbbb
bbbb
bbbb
bbbb
bbbb
bbbb
bbbb
bbbb
bbbb
bbbb
bbbb
bbbb
bbbb
bbbb
bbbb
bbbb
bbbb
bbbb
bbbb
bbbb
bbbb
bbbb
bbbb
bbbb
bbbb
bbbb
bbbb
bbbb
bbbb
bbbb
bbbb
bbbb
bbbb
bbbb
bbbb
bbbb
bbbb
bbbb
bbbb
bbbb
bbbb
bbbb
bbbb
bbbb
bbbb
bbbb
bbbb
bbbb
bbbb
bbbb
bbbb
bbbb
bbbb
bbbb
bbbb
bbbb
bbbb
bbbb
Drosophila melanogaster0 2 4 6 8 10 20 30 40 50 60 70 80 90 100
Percentage
A C D E F G H I K L M N P Q R S T V W Y Sup SeC Und
A
C
D
E
F
G
H
I
K
L
M
N
P
Q
R
S
T
V
W
Y
Sup
SeC
Und
bbbb
bbbb
bbbb
bbbb
bbbb
bbbb
bbbb
bbbb
bbbb
bbbb
bbbb
bbbb
bbbb
bbbb
bbbb
bbbb
bbbb
bbbb
bbbb
bbbb
bbbb
bbbb
bbbb
bbbb
bbbb
bbbb
bbbb
bbbb
bbbb
bbbb
bbbb
bbbb
bbbb
bbbb
bbbb
bbbb
bbbb
bbbb
bbbb
bbbb
bbbb
bbbb
bbbb
bbbb
bbbb
bbbb
bbbb
bbbb
bbbb
bbbb
bbbb
bbbb
bbbb
bbbb
bbbb
bbbb
bbbb
bbbb
bbbb
bbbb
bbbb
bbbb
bbbb
bbbb
bbbb
bbbb
bbbb
bbbb
bbbb
bbbb
bbbb
bbbb
bbbb
bbbb
bbbb
bbbb
bbbb
bbbb
bbbb
bbbb
bbbb
bbbb
bbbb
bbbb
bbbb
bbbb
bbbb
bbbb
bbbb
bbbb
bbbb
bbbb
bbbb
bbbb
bbbb
bbbb
bbbb
bbbb
bbbb
bbbb
bbbb
bbbb
bbbb
bbbb
bbbb
bbbb
bbbb
bbbb
bbbb
bbbb
bbbb
bbbb
bbbb
bbbb
bbbb
bbbb
bbbb
bbbb
bbbb
bbbb
bbbb
bbbb
bbbb
bbbb
bbbb
bbbb
bbbb
bbbb
bbbb
bbbb
bbbb
bbbb
bbbb
bbbb
bbbb
bbbb
bbbb
bbbb
bbbb
bbbb
bbbb
bbbb
bbbb
bbbb
bbbb
bbbb
bbbb
bbbb
bbbb
bbbb
bbbb
bbbb
bbbb
bbbb
bbbb
bbbb
bbbb
bbbb
bbbb
bbbb
bbbb
bbbb
bbbb
bbbb
bbbb
bbbb
bbbb
bbbb
bbbb
bbbb
bbbb
bbbb
bbbb
bbbb
bbbb
bbbb
bbbb
bbbb
bbbb
bbbb
bbbb
bbbb
bbbb
bbbb
bbbb
bbbb
bbbb
bbbb
bbbb
bbbb
bbbb
bbbb
bbbb
bbbb
bbbb
bbbb
bbbb
bbbb
bbbb
bbbb
bbbb
bbbb
bbbb
bbbb
bbbb
bbbb
bbbb
bbbb
bbbb
bbbb
bbbb
bbbb
bbbb
bbbb
bbbb
bbbb
bbbb
bbbb
bbbb
bbbb
bbbb
bbbb
bbbb
bbbb
bbbb
bbbb
bbbb
bbbb
bbbb
bbbb
bbbb
bbbb
bbbb
bbbb
bbbb
bbbb
bbbb
bbbb
bbbb
bbbb
bbbb
bbbb
bbbb
bbbb
bbbb
bbbb
bbbb
bbbb
bbbb
bbbb
bbbb
bbbb
bbbb
bbbb
bbbb
bbbb
bbbb
bbbb
bbbb
bbbb
bbbb
bbbb
bbbb
bbbb
bbbb
bbbb
bbbb
bbbb
bbbb
bbbb
bbbb
bbbb
bbbb
bbbb
bbbb
bbbb
bbbb
bbbb
bbbb
bbbb
bbbb
bbbb
bbbb
bbbb
bbbb
bbbb
bbbb
bbbb
bbbb
bbbb
bbbb
bbbb
bbbb
bbbb
bbbb
bbbb
bbbb
bbbb
bbbb
bbbb
bbbb
bbbb
bbbb
bbbb
bbbb
bbbb
bbbb
bbbb
bbbb
bbbb
bbbb
bbbb
bbbb
bbbb
bbbb
bbbb
bbbb
bbbb
bbbb
bbbb
bbbb
bbbb
bbbb
bbbb
bbbb
bbbb
bbbb
bbbb
bbbb
bbbb
bbbb
bbbb
bbbb
bbbb
bbbb
bbbb
bbbb
bbbb
bbbb
bbbb
bbbb
bbbb
bbbb
bbbb
bbbb
bbbb
bbbb
bbbb
bbbb
bbbb
bbbb
bbbb
bbbb
bbbb
bbbb
bbbb
bbbb
bbbb
bbbb
bbbb
bbbb
bbbb
bbbb
bbbb
bbbb
bbbb
bbbb
bbbb
bbbb
bbbb
bbbb
bbbb
bbbb
bbbb
bbbb
bbbb
bbbb
bbbb
bbbb
bbbb
bbbb
bbbb
bbbb
bbbb
bbbb
bbbb
bbbb
bbbb
bbbb
bbbb
bbbb
bbbb
bbbb
bbbb
bbbb
bbbb
bbbb
bbbb
bbbb
bbbb
bbbb
bbbb
bbbb
bbbb
bbbb
bbbb
bbbb
bbbb
bbbb
bbbb
bbbb
bbbb
bbbb
bbbb
bbbb
bbbb
bbbb
bbbb
bbbb
bbbb
bbbb
bbbb
bbbb
bbbb
bbbb
bbbb
bbbb
bbbb
bbbb
bbbb
bbbb
bbbb
bbbb
bbbb
bbbb
bbbb
bbbb
bbbb
bbbb
bbbb
bbbb
bbbb
bbbb
bbbb
bbbb
bbbb
bbbb
bbbb
bbbb
bbbb
bbbb
bbbb
bbbb
bbbb
bbbb
bbbb
bbbb
bbbb
bbbb
bbbb
bbbb
bbbb
bbbb
bbbb
bbbb
bbbb
bbbb
bbbb
bbbb
bbbb
bbbb
bbbb
bbbb
bbbb
bbbb
bbbb
bbbb
bbbb
bbbb
bbbb
bbbb
bbbb
bbbb
bbbb
bbbb
bbbb
bbbb
bbbb
bbbb
bbbb
bbbb
bbbb
bbbb
bbbb
bbbb
bbbb
bbbb
bbbb
bbbb
bbbb
bbbb
bbbb
bbbb
bbbb
bbbb
bbbb
bbbb
bbbb
bbbb
bbbb
bbbb
bbbb
bbbb
bbbb
bbbb
bbbb
bbbb
bbbb
bbbb
bbbb
bbbb
bbbb
bbbb
bbbb
bbbb
bbbb
bbbb
bbbb
bbbb
Drosophila mojavensis0 2 4 6 8 10 20 30 40 50 60 70 80 90 100
Percentage
A C D E F G H I K L M N P Q R S T V W Y Sup SeC Und
A
C
D
E
F
G
H
I
K
L
M
N
P
Q
R
S
T
V
W
Y
Sup
SeC
Und
bbbb
bbbb
bbbb
bbbb
bbbb
bbbb
bbbb
bbbb
bbbb
bbbb
bbbb
bbbb
bbbb
bbbb
bbbb
bbbb
bbbb
bbbb
bbbb
bbbb
bbbb
bbbb
bbbb
bbbb
bbbb
bbbb
bbbb
bbbb
bbbb
bbbb
bbbb
bbbb
bbbb
bbbb
bbbb
bbbb
bbbb
bbbb
bbbb
bbbb
bbbb
bbbb
bbbb
bbbb
bbbb
bbbb
bbbb
bbbb
bbbb
bbbb
bbbb
bbbb
bbbb
bbbb
bbbb
bbbb
bbbb
bbbb
bbbb
bbbb
bbbb
bbbb
bbbb
bbbb
bbbb
bbbb
bbbb
bbbb
bbbb
bbbb
bbbb
bbbb
bbbb
bbbb
bbbb
bbbb
bbbb
bbbb
bbbb
bbbb
bbbb
bbbb
bbbb
bbbb
bbbb
bbbb
bbbb
bbbb
bbbb
bbbb
bbbb
bbbb
bbbb
bbbb
bbbb
bbbb
bbbb
bbbb
bbbb
bbbb
bbbb
bbbb
bbbb
bbbb
bbbb
bbbb
bbbb
bbbb
bbbb
bbbb
bbbb
bbbb
bbbb
bbbb
bbbb
bbbb
bbbb
bbbb
bbbb
bbbb
bbbb
bbbb
bbbb
bbbb
bbbb
bbbb
bbbb
bbbb
bbbb
bbbb
bbbb
bbbb
bbbb
bbbb
bbbb
bbbb
bbbb
bbbb
bbbb
bbbb
bbbb
bbbb
bbbb
bbbb
bbbb
bbbb
bbbb
bbbb
bbbb
bbbb
bbbb
bbbb
bbbb
bbbb
bbbb
bbbb
bbbb
bbbb
bbbb
bbbb
bbbb
bbbb
bbbb
bbbb
bbbb
bbbb
bbbb
bbbb
bbbb
bbbb
bbbb
bbbb
bbbb
bbbb
bbbb
bbbb
bbbb
bbbb
bbbb
bbbb
bbbb
bbbb
bbbb
bbbb
bbbb
bbbb
bbbb
bbbb
bbbb
bbbb
bbbb
bbbb
bbbb
bbbb
bbbb
bbbb
bbbb
bbbb
bbbb
bbbb
bbbb
bbbb
bbbb
bbbb
bbbb
bbbb
bbbb
bbbb
bbbb
bbbb
bbbb
bbbb
bbbb
bbbb
bbbb
bbbb
bbbb
bbbb
bbbb
bbbb
bbbb
bbbb
bbbb
bbbb
bbbb
bbbb
bbbb
bbbb
bbbb
bbbb
bbbb
bbbb
bbbb
bbbb
bbbb
bbbb
bbbb
bbbb
bbbb
bbbb
bbbb
bbbb
bbbb
bbbb
bbbb
bbbb
bbbb
bbbb
bbbb
bbbb
bbbb
bbbb
bbbb
bbbb
bbbb
bbbb
bbbb
bbbb
bbbb
bbbb
bbbb
bbbb
bbbb
bbbb
bbbb
bbbb
bbbb
bbbb
bbbb
bbbb
bbbb
bbbb
bbbb
bbbb
bbbb
bbbb
bbbb
bbbb
bbbb
bbbb
bbbb
bbbb
bbbb
bbbb
bbbb
bbbb
bbbb
bbbb
bbbb
bbbb
bbbb
bbbb
bbbb
bbbb
bbbb
bbbb
bbbb
bbbb
bbbb
bbbb
bbbb
bbbb
bbbb
bbbb
bbbb
bbbb
bbbb
bbbb
bbbb
bbbb
bbbb
bbbb
bbbb
bbbb
bbbb
bbbb
bbbb
bbbb
bbbb
bbbb
bbbb
bbbb
bbbb
bbbb
bbbb
bbbb
bbbb
bbbb
bbbb
bbbb
bbbb
bbbb
bbbb
bbbb
bbbb
bbbb
bbbb
bbbb
bbbb
bbbb
bbbb
bbbb
bbbb
bbbb
bbbb
bbbb
bbbb
bbbb
bbbb
bbbb
bbbb
bbbb
bbbb
bbbb
bbbb
bbbb
bbbb
bbbb
bbbb
bbbb
bbbb
bbbb
bbbb
bbbb
bbbb
bbbb
bbbb
bbbb
bbbb
bbbb
bbbb
bbbb
bbbb
bbbb
bbbb
bbbb
bbbb
bbbb
bbbb
bbbb
bbbb
bbbb
bbbb
bbbb
bbbb
bbbb
bbbb
bbbb
bbbb
bbbb
bbbb
bbbb
bbbb
bbbb
bbbb
bbbb
bbbb
bbbb
bbbb
bbbb
bbbb
bbbb
bbbb
bbbb
bbbb
bbbb
bbbb
bbbb
bbbb
bbbb
bbbb
bbbb
bbbb
bbbb
bbbb
bbbb
bbbb
bbbb
bbbb
bbbb
bbbb
bbbb
bbbb
bbbb
bbbb
bbbb
bbbb
bbbb
bbbb
bbbb
bbbb
bbbb
bbbb
bbbb
bbbb
bbbb
bbbb
bbbb
bbbb
bbbb
bbbb
bbbb
bbbb
bbbb
bbbb
bbbb
bbbb
bbbb
bbbb
bbbb
bbbb
bbbb
bbbb
bbbb
bbbb
bbbb
bbbb
bbbb
bbbb
bbbb
bbbb
bbbb
bbbb
bbbb
bbbb
bbbb
bbbb
bbbb
bbbb
bbbb
bbbb
bbbb
bbbb
bbbb
bbbb
bbbb
bbbb
bbbb
bbbb
bbbb
bbbb
bbbb
bbbb
bbbb
bbbb
bbbb
bbbb
bbbb
bbbb
bbbb
bbbb
bbbb
bbbb
bbbb
bbbb
bbbb
bbbb
bbbb
bbbb
bbbb
bbbb
bbbb
bbbb
bbbb
bbbb
bbbb
bbbb
bbbb
bbbb
bbbb
bbbb
bbbb
bbbb
bbbb
bbbb
bbbb
bbbb
bbbb
bbbb
bbbb
bbbb
bbbb
bbbb
bbbb
bbbb
bbbb
bbbb
bbbb
bbbb
Drosophila persimilis0 2 4 6 8 10 20 30 40 50 60 70 80 90 100
Percentage
A C D E F G H I K L M N P Q R S T V W Y Sup SeC Und
A
C
D
E
F
G
H
I
K
L
M
N
P
Q
R
S
T
V
W
Y
Sup
SeC
Und
bbbb
bbbb
bbbb
bbbb
bbbb
bbbb
bbbb
bbbb
bbbb
bbbb
bbbb
bbbb
bbbb
bbbb
bbbb
bbbb
bbbb
bbbb
bbbb
bbbb
bbbb
bbbb
bbbb
bbbb
bbbb
bbbb
bbbb
bbbb
bbbb
bbbb
bbbb
bbbb
bbbb
bbbb
bbbb
bbbb
bbbb
bbbb
bbbb
bbbb
bbbb
bbbb
bbbb
bbbb
bbbb
bbbb
bbbb
bbbb
bbbb
bbbb
bbbb
bbbb
bbbb
bbbb
bbbb
bbbb
bbbb
bbbb
bbbb
bbbb
bbbb
bbbb
bbbb
bbbb
bbbb
bbbb
bbbb
bbbb
bbbb
bbbb
bbbb
bbbb
bbbb
bbbb
bbbb
bbbb
bbbb
bbbb
bbbb
bbbb
bbbb
bbbb
bbbb
bbbb
bbbb
bbbb
bbbb
bbbb
bbbb
bbbb
bbbb
bbbb
bbbb
bbbb
bbbb
bbbb
bbbb
bbbb
bbbb
bbbb
bbbb
bbbb
bbbb
bbbb
bbbb
bbbb
bbbb
bbbb
bbbb
bbbb
bbbb
bbbb
bbbb
bbbb
bbbb
bbbb
bbbb
bbbb
bbbb
bbbb
bbbb
bbbb
bbbb
bbbb
bbbb
bbbb
bbbb
bbbb
bbbb
bbbb
bbbb
bbbb
bbbb
bbbb
bbbb
bbbb
bbbb
bbbb
bbbb
bbbb
bbbb
bbbb
bbbb
bbbb
bbbb
bbbb
bbbb
bbbb
bbbb
bbbb
bbbb
bbbb
bbbb
bbbb
bbbb
bbbb
bbbb
bbbb
bbbb
bbbb
bbbb
bbbb
bbbb
bbbb
bbbb
bbbb
bbbb
bbbb
bbbb
bbbb
bbbb
bbbb
bbbb
bbbb
bbbb
bbbb
bbbb
bbbb
bbbb
bbbb
bbbb
bbbb
bbbb
bbbb
bbbb
bbbb
bbbb
bbbb
bbbb
bbbb
bbbb
bbbb
bbbb
bbbb
bbbb
bbbb
bbbb
bbbb
bbbb
bbbb
bbbb
bbbb
bbbb
bbbb
bbbb
bbbb
bbbb
bbbb
bbbb
bbbb
bbbb
bbbb
bbbb
bbbb
bbbb
bbbb
bbbb
bbbb
bbbb
bbbb
bbbb
bbbb
bbbb
bbbb
bbbb
bbbb
bbbb
bbbb
bbbb
bbbb
bbbb
bbbb
bbbb
bbbb
bbbb
bbbb
bbbb
bbbb
bbbb
bbbb
bbbb
bbbb
bbbb
bbbb
bbbb
bbbb
bbbb
bbbb
bbbb
bbbb
bbbb
bbbb
bbbb
bbbb
bbbb
bbbb
bbbb
bbbb
bbbb
bbbb
bbbb
bbbb
bbbb
bbbb
bbbb
bbbb
bbbb
bbbb
bbbb
bbbb
bbbb
bbbb
bbbb
bbbb
bbbb
bbbb
bbbb
bbbb
bbbb
bbbb
bbbb
bbbb
bbbb
bbbb
bbbb
bbbb
bbbb
bbbb
bbbb
bbbb
bbbb
bbbb
bbbb
bbbb
bbbb
bbbb
bbbb
bbbb
bbbb
bbbb
bbbb
bbbb
bbbb
bbbb
bbbb
bbbb
bbbb
bbbb
bbbb
bbbb
bbbb
bbbb
bbbb
bbbb
bbbb
bbbb
bbbb
bbbb
bbbb
bbbb
bbbb
bbbb
bbbb
bbbb
bbbb
bbbb
bbbb
bbbb
bbbb
bbbb
bbbb
bbbb
bbbb
bbbb
bbbb
bbbb
bbbb
bbbb
bbbb
bbbb
bbbb
bbbb
bbbb
bbbb
bbbb
bbbb
bbbb
bbbb
bbbb
bbbb
bbbb
bbbb
bbbb
bbbb
bbbb
bbbb
bbbb
bbbb
bbbb
bbbb
bbbb
bbbb
bbbb
bbbb
bbbb
bbbb
bbbb
bbbb
bbbb
bbbb
bbbb
bbbb
bbbb
bbbb
bbbb
bbbb
bbbb
bbbb
bbbb
bbbb
bbbb
bbbb
bbbb
bbbb
bbbb
bbbb
bbbb
bbbb
bbbb
bbbb
bbbb
bbbb
bbbb
bbbb
bbbb
bbbb
bbbb
bbbb
bbbb
bbbb
bbbb
bbbb
bbbb
bbbb
bbbb
bbbb
bbbb
bbbb
bbbb
bbbb
bbbb
bbbb
bbbb
bbbb
bbbb
bbbb
bbbb
bbbb
bbbb
bbbb
bbbb
bbbb
bbbb
bbbb
bbbb
bbbb
bbbb
bbbb
bbbb
bbbb
bbbb
bbbb
bbbb
bbbb
bbbb
bbbb
bbbb
bbbb
bbbb
bbbb
bbbb
bbbb
bbbb
bbbb
bbbb
bbbb
bbbb
bbbb
bbbb
bbbb
bbbb
bbbb
bbbb
bbbb
bbbb
bbbb
bbbb
bbbb
bbbb
bbbb
bbbb
bbbb
bbbb
bbbb
bbbb
bbbb
bbbb
bbbb
bbbb
bbbb
bbbb
bbbb
bbbb
bbbb
bbbb
bbbb
bbbb
bbbb
bbbb
bbbb
bbbb
bbbb
bbbb
bbbb
bbbb
bbbb
bbbb
bbbb
bbbb
bbbb
bbbb
bbbb
bbbb
bbbb
bbbb
bbbb
bbbb
bbbb
bbbb
bbbb
bbbb
bbbb
bbbb
bbbb
bbbb
bbbb
bbbb
bbbb
bbbb
bbbb
bbbb
bbbb
bbbb
bbbb
bbbb
bbbb
bbbb
bbbb
bbbb
bbbb
bbbb
bbbb
bbbb
bbbb
bbbb
bbbb
bbbb
bbbb
bbbb
Drosophila pseudoobscura0 2 4 6 8 10 20 30 40 50 60 70 80 90 100
Percentage
A C D E F G H I K L M N P Q R S T V W Y Sup SeC Und
A
C
D
E
F
G
H
I
K
L
M
N
P
Q
R
S
T
V
W
Y
Sup
SeC
Und
bbbb
bbbb
bbbb
bbbb
bbbb
bbbb
bbbb
bbbb
bbbb
bbbb
bbbb
bbbb
bbbb
bbbb
bbbb
bbbb
bbbb
bbbb
bbbb
bbbb
bbbb
bbbb
bbbb
bbbb
bbbb
bbbb
bbbb
bbbb
bbbb
bbbb
bbbb
bbbb
bbbb
bbbb
bbbb
bbbb
bbbb
bbbb
bbbb
bbbb
bbbb
bbbb
bbbb
bbbb
bbbb
bbbb
bbbb
bbbb
bbbb
bbbb
bbbb
bbbb
bbbb
bbbb
bbbb
bbbb
bbbb
bbbb
bbbb
bbbb
bbbb
bbbb
bbbb
bbbb
bbbb
bbbb
bbbb
bbbb
bbbb
bbbb
bbbb
bbbb
bbbb
bbbb
bbbb
bbbb
bbbb
bbbb
bbbb
bbbb
bbbb
bbbb
bbbb
bbbb
bbbb
bbbb
bbbb
bbbb
bbbb
bbbb
bbbb
bbbb
bbbb
bbbb
bbbb
bbbb
bbbb
bbbb
bbbb
bbbb
bbbb
bbbb
bbbb
bbbb
bbbb
bbbb
bbbb
bbbb
bbbb
bbbb
bbbb
bbbb
bbbb
bbbb
bbbb
bbbb
bbbb
bbbb
bbbb
bbbb
bbbb
bbbb
bbbb
bbbb
bbbb
bbbb
bbbb
bbbb
bbbb
bbbb
bbbb
bbbb
bbbb
bbbb
bbbb
bbbb
bbbb
bbbb
bbbb
bbbb
bbbb
bbbb
bbbb
bbbb
bbbb
bbbb
bbbb
bbbb
bbbb
bbbb
bbbb
bbbb
bbbb
bbbb
bbbb
bbbb
bbbb
bbbb
bbbb
bbbb
bbbb
bbbb
bbbb
bbbb
bbbb
bbbb
bbbb
bbbb
bbbb
bbbb
bbbb
bbbb
bbbb
bbbb
bbbb
bbbb
bbbb
bbbb
bbbb
bbbb
bbbb
bbbb
bbbb
bbbb
bbbb
bbbb
bbbb
bbbb
bbbb
bbbb
bbbb
bbbb
bbbb
bbbb
bbbb
bbbb
bbbb
bbbb
bbbb
bbbb
bbbb
bbbb
bbbb
bbbb
bbbb
bbbb
bbbb
bbbb
bbbb
bbbb
bbbb
bbbb
bbbb
bbbb
bbbb
bbbb
bbbb
bbbb
bbbb
bbbb
bbbb
bbbb
bbbb
bbbb
bbbb
bbbb
bbbb
bbbb
bbbb
bbbb
bbbb
bbbb
bbbb
bbbb
bbbb
bbbb
bbbb
bbbb
bbbb
bbbb
bbbb
bbbb
bbbb
bbbb
bbbb
bbbb
bbbb
bbbb
bbbb
bbbb
bbbb
bbbb
bbbb
bbbb
bbbb
bbbb
bbbb
bbbb
bbbb
bbbb
bbbb
bbbb
bbbb
bbbb
bbbb
bbbb
bbbb
bbbb
bbbb
bbbb
bbbb
bbbb
bbbb
bbbb
bbbb
bbbb
bbbb
bbbb
bbbb
bbbb
bbbb
bbbb
bbbb
bbbb
bbbb
bbbb
bbbb
bbbb
bbbb
bbbb
bbbb
bbbb
bbbb
bbbb
bbbb
bbbb
bbbb
bbbb
bbbb
bbbb
bbbb
bbbb
bbbb
bbbb
bbbb
bbbb
bbbb
bbbb
bbbb
bbbb
bbbb
bbbb
bbbb
bbbb
bbbb
bbbb
bbbb
bbbb
bbbb
bbbb
bbbb
bbbb
bbbb
bbbb
bbbb
bbbb
bbbb
bbbb
bbbb
bbbb
bbbb
bbbb
bbbb
bbbb
bbbb
bbbb
bbbb
bbbb
bbbb
bbbb
bbbb
bbbb
bbbb
bbbb
bbbb
bbbb
bbbb
bbbb
bbbb
bbbb
bbbb
bbbb
bbbb
bbbb
bbbb
bbbb
bbbb
bbbb
bbbb
bbbb
bbbb
bbbb
bbbb
bbbb
bbbb
bbbb
bbbb
bbbb
bbbb
bbbb
bbbb
bbbb
bbbb
bbbb
bbbb
bbbb
bbbb
bbbb
bbbb
bbbb
bbbb
bbbb
bbbb
bbbb
bbbb
bbbb
bbbb
bbbb
bbbb
bbbb
bbbb
bbbb
bbbb
bbbb
bbbb
bbbb
bbbb
bbbb
bbbb
bbbb
bbbb
bbbb
bbbb
bbbb
bbbb
bbbb
bbbb
bbbb
bbbb
bbbb
bbbb
bbbb
bbbb
bbbb
bbbb
bbbb
bbbb
bbbb
bbbb
bbbb
bbbb
bbbb
bbbb
bbbb
bbbb
bbbb
bbbb
bbbb
bbbb
bbbb
bbbb
bbbb
bbbb
bbbb
bbbb
bbbb
bbbb
bbbb
bbbb
bbbb
bbbb
bbbb
bbbb
bbbb
bbbb
bbbb
bbbb
bbbb
bbbb
bbbb
bbbb
bbbb
bbbb
bbbb
bbbb
bbbb
bbbb
bbbb
bbbb
bbbb
bbbb
bbbb
bbbb
bbbb
bbbb
bbbb
bbbb
bbbb
bbbb
bbbb
bbbb
bbbb
bbbb
bbbb
bbbb
bbbb
bbbb
bbbb
bbbb
bbbb
bbbb
bbbb
bbbb
bbbb
bbbb
bbbb
bbbb
bbbb
bbbb
bbbb
bbbb
bbbb
bbbb
bbbb
bbbb
bbbb
bbbb
bbbb
bbbb
bbbb
bbbb
bbbb
bbbb
bbbb
bbbb
bbbb
bbbb
bbbb
bbbb
bbbb
bbbb
bbbb
bbbb
bbbb
bbbb
bbbb
bbbb
bbbb
bbbb
bbbb
bbbb
bbbb
bbbb
bbbb
bbbb
bbbb
bbbb
bbbb
bbbb
Drosophila sechellia0 2 4 6 8 10 20 30 40 50 60 70 80 90 100
Percentage
A C D E F G H I K L M N P Q R S T V W Y Sup SeC Und
A
C
D
E
F
G
H
I
K
L
M
N
P
Q
R
S
T
V
W
Y
Sup
SeC
Und
bbbb
bbbb
bbbb
bbbb
bbbb
bbbb
bbbb
bbbb
bbbb
bbbb
bbbb
bbbb
bbbb
bbbb
bbbb
bbbb
bbbb
bbbb
bbbb
bbbb
bbbb
bbbb
bbbb
bbbb
bbbb
bbbb
bbbb
bbbb
bbbb
bbbb
bbbb
bbbb
bbbb
bbbb
bbbb
bbbb
bbbb
bbbb
bbbb
bbbb
bbbb
bbbb
bbbb
bbbb
bbbb
bbbb
bbbb
bbbb
bbbb
bbbb
bbbb
bbbb
bbbb
bbbb
bbbb
bbbb
bbbb
bbbb
bbbb
bbbb
bbbb
bbbb
bbbb
bbbb
bbbb
bbbb
bbbb
bbbb
bbbb
bbbb
bbbb
bbbb
bbbb
bbbb
bbbb
bbbb
bbbb
bbbb
bbbb
bbbb
bbbb
bbbb
bbbb
bbbb
bbbb
bbbb
bbbb
bbbb
bbbb
bbbb
bbbb
bbbb
bbbb
bbbb
bbbb
bbbb
bbbb
bbbb
bbbb
bbbb
bbbb
bbbb
bbbb
bbbb
bbbb
bbbb
bbbb
bbbb
bbbb
bbbb
bbbb
bbbb
bbbb
bbbb
bbbb
bbbb
bbbb
bbbb
bbbb
bbbb
bbbb
bbbb
bbbb
bbbb
bbbb
bbbb
bbbb
bbbb
bbbb
bbbb
bbbb
bbbb
bbbb
bbbb
bbbb
bbbb
bbbb
bbbb
bbbb
bbbb
bbbb
bbbb
bbbb
bbbb
bbbb
bbbb
bbbb
bbbb
bbbb
bbbb
bbbb
bbbb
bbbb
bbbb
bbbb
bbbb
bbbb
bbbb
bbbb
bbbb
bbbb
bbbb
bbbb
bbbb
bbbb
bbbb
bbbb
bbbb
bbbb
bbbb
bbbb
bbbb
bbbb
bbbb
bbbb
bbbb
bbbb
bbbb
bbbb
bbbb
bbbb
bbbb
bbbb
bbbb
bbbb
bbbb
bbbb
bbbb
bbbb
bbbb
bbbb
bbbb
bbbb
bbbb
bbbb
bbbb
bbbb
bbbb
bbbb
bbbb
bbbb
bbbb
bbbb
bbbb
bbbb
bbbb
bbbb
bbbb
bbbb
bbbb
bbbb
bbbb
bbbb
bbbb
bbbb
bbbb
bbbb
bbbb
bbbb
bbbb
bbbb
bbbb
bbbb
bbbb
bbbb
bbbb
bbbb
bbbb
bbbb
bbbb
bbbb
bbbb
bbbb
bbbb
bbbb
bbbb
bbbb
bbbb
bbbb
bbbb
bbbb
bbbb
bbbb
bbbb
bbbb
bbbb
bbbb
bbbb
bbbb
bbbb
bbbb
bbbb
bbbb
bbbb
bbbb
bbbb
bbbb
bbbb
bbbb
bbbb
bbbb
bbbb
bbbb
bbbb
bbbb
bbbb
bbbb
bbbb
bbbb
bbbb
bbbb
bbbb
bbbb
bbbb
bbbb
bbbb
bbbb
bbbb
bbbb
bbbb
bbbb
bbbb
bbbb
bbbb
bbbb
bbbb
bbbb
bbbb
bbbb
bbbb
bbbb
bbbb
bbbb
bbbb
bbbb
bbbb
bbbb
bbbb
bbbb
bbbb
bbbb
bbbb
bbbb
bbbb
bbbb
bbbb
bbbb
bbbb
bbbb
bbbb
bbbb
bbbb
bbbb
bbbb
bbbb
bbbb
bbbb
bbbb
bbbb
bbbb
bbbb
bbbb
bbbb
bbbb
bbbb
bbbb
bbbb
bbbb
bbbb
bbbb
bbbb
bbbb
bbbb
bbbb
bbbb
bbbb
bbbb
bbbb
bbbb
bbbb
bbbb
bbbb
bbbb
bbbb
bbbb
bbbb
bbbb
bbbb
bbbb
bbbb
bbbb
bbbb
bbbb
bbbb
bbbb
bbbb
bbbb
bbbb
bbbb
bbbb
bbbb
bbbb
bbbb
bbbb
bbbb
bbbb
bbbb
bbbb
bbbb
bbbb
bbbb
bbbb
bbbb
bbbb
bbbb
bbbb
bbbb
bbbb
bbbb
bbbb
bbbb
bbbb
bbbb
bbbb
bbbb
bbbb
bbbb
bbbb
bbbb
bbbb
bbbb
bbbb
bbbb
bbbb
bbbb
bbbb
bbbb
bbbb
bbbb
bbbb
bbbb
bbbb
bbbb
bbbb
bbbb
bbbb
bbbb
bbbb
bbbb
bbbb
bbbb
bbbb
bbbb
bbbb
bbbb
bbbb
bbbb
bbbb
bbbb
bbbb
bbbb
bbbb
bbbb
bbbb
bbbb
bbbb
bbbb
bbbb
bbbb
bbbb
bbbb
bbbb
bbbb
bbbb
bbbb
bbbb
bbbb
bbbb
bbbb
bbbb
bbbb
bbbb
bbbb
bbbb
bbbb
bbbb
bbbb
bbbb
bbbb
bbbb
bbbb
bbbb
bbbb
bbbb
bbbb
bbbb
bbbb
bbbb
bbbb
bbbb
bbbb
bbbb
bbbb
bbbb
bbbb
bbbb
bbbb
bbbb
bbbb
bbbb
bbbb
bbbb
bbbb
bbbb
bbbb
bbbb
bbbb
bbbb
bbbb
bbbb
bbbb
bbbb
bbbb
bbbb
bbbb
bbbb
bbbb
bbbb
bbbb
bbbb
bbbb
bbbb
bbbb
bbbb
bbbb
bbbb
bbbb
bbbb
bbbb
bbbb
bbbb
bbbb
bbbb
bbbb
bbbb
bbbb
bbbb
bbbb
bbbb
bbbb
bbbb
bbbb
bbbb
bbbb
bbbb
bbbb
bbbb
bbbb
bbbb
bbbb
bbbb
bbbb
bbbb
bbbb
bbbb
bbbb
bbbb
bbbb
bbbb
Drosophila simulans0 2 4 6 8 10 20 30 40 50 60 70 80 90 100
Percentage
A C D E F G H I K L M N P Q R S T V W Y Sup SeC Und
A
C
D
E
F
G
H
I
K
L
M
N
P
Q
R
S
T
V
W
Y
Sup
SeC
Und
bbbb
bbbb
bbbb
bbbb
bbbb
bbbb
bbbb
bbbb
bbbb
bbbb
bbbb
bbbb
bbbb
bbbb
bbbb
bbbb
bbbb
bbbb
bbbb
bbbb
bbbb
bbbb
bbbb
bbbb
bbbb
bbbb
bbbb
bbbb
bbbb
bbbb
bbbb
bbbb
bbbb
bbbb
bbbb
bbbb
bbbb
bbbb
bbbb
bbbb
bbbb
bbbb
bbbb
bbbb
bbbb
bbbb
bbbb
bbbb
bbbb
bbbb
bbbb
bbbb
bbbb
bbbb
bbbb
bbbb
bbbb
bbbb
bbbb
bbbb
bbbb
bbbb
bbbb
bbbb
bbbb
bbbb
bbbb
bbbb
bbbb
bbbb
bbbb
bbbb
bbbb
bbbb
bbbb
bbbb
bbbb
bbbb
bbbb
bbbb
bbbb
bbbb
bbbb
bbbb
bbbb
bbbb
bbbb
bbbb
bbbb
bbbb
bbbb
bbbb
bbbb
bbbb
bbbb
bbbb
bbbb
bbbb
bbbb
bbbb
bbbb
bbbb
bbbb
bbbb
bbbb
bbbb
bbbb
bbbb
bbbb
bbbb
bbbb
bbbb
bbbb
bbbb
bbbb
bbbb
bbbb
bbbb
bbbb
bbbb
bbbb
bbbb
bbbb
bbbb
bbbb
bbbb
bbbb
bbbb
bbbb
bbbb
bbbb
bbbb
bbbb
bbbb
bbbb
bbbb
bbbb
bbbb
bbbb
bbbb
bbbb
bbbb
bbbb
bbbb
bbbb
bbbb
bbbb
bbbb
bbbb
bbbb
bbbb
bbbb
bbbb
bbbb
bbbb
bbbb
bbbb
bbbb
bbbb
bbbb
bbbb
bbbb
bbbb
bbbb
bbbb
bbbb
bbbb
bbbb
bbbb
bbbb
bbbb
bbbb
bbbb
bbbb
bbbb
bbbb
bbbb
bbbb
bbbb
bbbb
bbbb
bbbb
bbbb
bbbb
bbbb
bbbb
bbbb
bbbb
bbbb
bbbb
bbbb
bbbb
bbbb
bbbb
bbbb
bbbb
bbbb
bbbb
bbbb
bbbb
bbbb
bbbb
bbbb
bbbb
bbbb
bbbb
bbbb
bbbb
bbbb
bbbb
bbbb
bbbb
bbbb
bbbb
bbbb
bbbb
bbbb
bbbb
bbbb
bbbb
bbbb
bbbb
bbbb
bbbb
bbbb
bbbb
bbbb
bbbb
bbbb
bbbb
bbbb
bbbb
bbbb
bbbb
bbbb
bbbb
bbbb
bbbb
bbbb
bbbb
bbbb
bbbb
bbbb
bbbb
bbbb
bbbb
bbbb
bbbb
bbbb
bbbb
bbbb
bbbb
bbbb
bbbb
bbbb
bbbb
bbbb
bbbb
bbbb
bbbb
bbbb
bbbb
bbbb
bbbb
bbbb
bbbb
bbbb
bbbb
bbbb
bbbb
bbbb
bbbb
bbbb
bbbb
bbbb
bbbb
bbbb
bbbb
bbbb
bbbb
bbbb
bbbb
bbbb
bbbb
bbbb
bbbb
bbbb
bbbb
bbbb
bbbb
bbbb
bbbb
bbbb
bbbb
bbbb
bbbb
bbbb
bbbb
bbbb
bbbb
bbbb
bbbb
bbbb
bbbb
bbbb
bbbb
bbbb
bbbb
bbbb
bbbb
bbbb
bbbb
bbbb
bbbb
bbbb
bbbb
bbbb
bbbb
bbbb
bbbb
bbbb
bbbb
bbbb
bbbb
bbbb
bbbb
bbbb
bbbb
bbbb
bbbb
bbbb
bbbb
bbbb
bbbb
bbbb
bbbb
bbbb
bbbb
bbbb
bbbb
bbbb
bbbb
bbbb
bbbb
bbbb
bbbb
bbbb
bbbb
bbbb
bbbb
bbbb
bbbb
bbbb
bbbb
bbbb
bbbb
bbbb
bbbb
bbbb
bbbb
bbbb
bbbb
bbbb
bbbb
bbbb
bbbb
bbbb
bbbb
bbbb
bbbb
bbbb
bbbb
bbbb
bbbb
bbbb
bbbb
bbbb
bbbb
bbbb
bbbb
bbbb
bbbb
bbbb
bbbb
bbbb
bbbb
bbbb
bbbb
bbbb
bbbb
bbbb
bbbb
bbbb
bbbb
bbbb
bbbb
bbbb
bbbb
bbbb
bbbb
bbbb
bbbb
bbbb
bbbb
bbbb
bbbb
bbbb
bbbb
bbbb
bbbb
bbbb
bbbb
bbbb
bbbb
bbbb
bbbb
bbbb
bbbb
bbbb
bbbb
bbbb
bbbb
bbbb
bbbb
bbbb
bbbb
bbbb
bbbb
bbbb
bbbb
bbbb
bbbb
bbbb
bbbb
bbbb
bbbb
bbbb
bbbb
bbbb
bbbb
bbbb
bbbb
bbbb
bbbb
bbbb
bbbb
bbbb
bbbb
bbbb
bbbb
bbbb
bbbb
bbbb
bbbb
bbbb
bbbb
bbbb
bbbb
bbbb
bbbb
bbbb
bbbb
bbbb
bbbb
bbbb
bbbb
bbbb
bbbb
bbbb
bbbb
bbbb
bbbb
bbbb
bbbb
bbbb
bbbb
bbbb
bbbb
bbbb
bbbb
bbbb
bbbb
bbbb
bbbb
bbbb
bbbb
bbbb
bbbb
bbbb
bbbb
bbbb
bbbb
bbbb
bbbb
bbbb
bbbb
bbbb
bbbb
bbbb
bbbb
bbbb
bbbb
bbbb
bbbb
bbbb
bbbb
bbbb
bbbb
bbbb
bbbb
bbbb
bbbb
bbbb
bbbb
bbbb
bbbb
bbbb
bbbb
bbbb
bbbb
bbbb
bbbb
bbbb
bbbb
bbbb
bbbb
bbbb
bbbb
bbbb
Drosophila virilis0 2 4 6 8 10 20 30 40 50 60 70 80 90 100
Percentage
A C D E F G H I K L M N P Q R S T V W Y Sup SeC Und
A
C
D
E
F
G
H
I
K
L
M
N
P
Q
R
S
T
V
W
Y
Sup
SeC
Und
bbbb
bbbb
bbbb
bbbb
bbbb
bbbb
bbbb
bbbb
bbbb
bbbb
bbbb
bbbb
bbbb
bbbb
bbbb
bbbb
bbbb
bbbb
bbbb
bbbb
bbbb
bbbb
bbbb
bbbb
bbbb
bbbb
bbbb
bbbb
bbbb
bbbb
bbbb
bbbb
bbbb
bbbb
bbbb
bbbb
bbbb
bbbb
bbbb
bbbb
bbbb
bbbb
bbbb
bbbb
bbbb
bbbb
bbbb
bbbb
bbbb
bbbb
bbbb
bbbb
bbbb
bbbb
bbbb
bbbb
bbbb
bbbb
bbbb
bbbb
bbbb
bbbb
bbbb
bbbb
bbbb
bbbb
bbbb
bbbb
bbbb
bbbb
bbbb
bbbb
bbbb
bbbb
bbbb
bbbb
bbbb
bbbb
bbbb
bbbb
bbbb
bbbb
bbbb
bbbb
bbbb
bbbb
bbbb
bbbb
bbbb
bbbb
bbbb
bbbb
bbbb
bbbb
bbbb
bbbb
bbbb
bbbb
bbbb
bbbb
bbbb
bbbb
bbbb
bbbb
bbbb
bbbb
bbbb
bbbb
bbbb
bbbb
bbbb
bbbb
bbbb
bbbb
bbbb
bbbb
bbbb
bbbb
bbbb
bbbb
bbbb
bbbb
bbbb
bbbb
bbbb
bbbb
bbbb
bbbb
bbbb
bbbb
bbbb
bbbb
bbbb
bbbb
bbbb
bbbb
bbbb
bbbb
bbbb
bbbb
bbbb
bbbb
bbbb
bbbb
bbbb
bbbb
bbbb
bbbb
bbbb
bbbb
bbbb
bbbb
bbbb
bbbb
bbbb
bbbb
bbbb
bbbb
bbbb
bbbb
bbbb
bbbb
bbbb
bbbb
bbbb
bbbb
bbbb
bbbb
bbbb
bbbb
bbbb
bbbb
bbbb
bbbb
bbbb
bbbb
bbbb
bbbb
bbbb
bbbb
bbbb
bbbb
bbbb
bbbb
bbbb
bbbb
bbbb
bbbb
bbbb
bbbb
bbbb
bbbb
bbbb
bbbb
bbbb
bbbb
bbbb
bbbb
bbbb
bbbb
bbbb
bbbb
bbbb
bbbb
bbbb
bbbb
bbbb
bbbb
bbbb
bbbb
bbbb
bbbb
bbbb
bbbb
bbbb
bbbb
bbbb
bbbb
bbbb
bbbb
bbbb
bbbb
bbbb
bbbb
bbbb
bbbb
bbbb
bbbb
bbbb
bbbb
bbbb
bbbb
bbbb
bbbb
bbbb
bbbb
bbbb
bbbb
bbbb
bbbb
bbbb
bbbb
bbbb
bbbb
bbbb
bbbb
bbbb
bbbb
bbbb
bbbb
bbbb
bbbb
bbbb
bbbb
bbbb
bbbb
bbbb
bbbb
bbbb
bbbb
bbbb
bbbb
bbbb
bbbb
bbbb
bbbb
bbbb
bbbb
bbbb
bbbb
bbbb
bbbb
bbbb
bbbb
bbbb
bbbb
bbbb
bbbb
bbbb
bbbb
bbbb
bbbb
bbbb
bbbb
bbbb
bbbb
bbbb
bbbb
bbbb
bbbb
bbbb
bbbb
bbbb
bbbb
bbbb
bbbb
bbbb
bbbb
bbbb
bbbb
bbbb
bbbb
bbbb
bbbb
bbbb
bbbb
bbbb
bbbb
bbbb
bbbb
bbbb
bbbb
bbbb
bbbb
bbbb
bbbb
bbbb
bbbb
bbbb
bbbb
bbbb
bbbb
bbbb
bbbb
bbbb
bbbb
bbbb
bbbb
bbbb
bbbb
bbbb
bbbb
bbbb
bbbb
bbbb
bbbb
bbbb
bbbb
bbbb
bbbb
bbbb
bbbb
bbbb
bbbb
bbbb
bbbb
bbbb
bbbb
bbbb
bbbb
bbbb
bbbb
bbbb
bbbb
bbbb
bbbb
bbbb
bbbb
bbbb
bbbb
bbbb
bbbb
bbbb
bbbb
bbbb
bbbb
bbbb
bbbb
bbbb
bbbb
bbbb
bbbb
bbbb
bbbb
bbbb
bbbb
bbbb
bbbb
bbbb
bbbb
bbbb
bbbb
bbbb
bbbb
bbbb
bbbb
bbbb
bbbb
bbbb
bbbb
bbbb
bbbb
bbbb
bbbb
bbbb
bbbb
bbbb
bbbb
bbbb
bbbb
bbbb
bbbb
bbbb
bbbb
bbbb
bbbb
bbbb
bbbb
bbbb
bbbb
bbbb
bbbb
bbbb
bbbb
bbbb
bbbb
bbbb
bbbb
bbbb
bbbb
bbbb
bbbb
bbbb
bbbb
bbbb
bbbb
bbbb
bbbb
bbbb
bbbb
bbbb
bbbb
bbbb
bbbb
bbbb
bbbb
bbbb
bbbb
bbbb
bbbb
bbbb
bbbb
bbbb
bbbb
bbbb
bbbb
bbbb
bbbb
bbbb
bbbb
bbbb
bbbb
bbbb
bbbb
bbbb
bbbb
bbbb
bbbb
bbbb
bbbb
bbbb
bbbb
bbbb
bbbb
bbbb
bbbb
bbbb
bbbb
bbbb
bbbb
bbbb
bbbb
bbbb
bbbb
bbbb
bbbb
bbbb
bbbb
bbbb
bbbb
bbbb
bbbb
bbbb
bbbb
bbbb
bbbb
bbbb
bbbb
bbbb
bbbb
bbbb
bbbb
bbbb
bbbb
bbbb
bbbb
bbbb
bbbb
bbbb
bbbb
bbbb
bbbb
bbbb
bbbb
bbbb
bbbb
bbbb
bbbb
bbbb
bbbb
bbbb
bbbb
bbbb
bbbb
bbbb
bbbb
bbbb
bbbb
bbbb
bbbb
bbbb
bbbb
bbbb
bbbb
bbbb
bbbb
bbbb
bbbb
bbbb
Drosophila willistoni0 2 4 6 8 10 20 30 40 50 60 70 80 90 100
Percentage
A C D E F G H I K L M N P Q R S T V W Y Sup SeC Und
A
C
D
E
F
G
H
I
K
L
M
N
P
Q
R
S
T
V
W
Y
Sup
SeC
Und
bbbb
bbbb
bbbb
bbbb
bbbb
bbbb
bbbb
bbbb
bbbb
bbbb
bbbb
bbbb
bbbb
bbbb
bbbb
bbbb
bbbb
bbbb
bbbb
bbbb
bbbb
bbbb
bbbb
bbbb
bbbb
bbbb
bbbb
bbbb
bbbb
bbbb
bbbb
bbbb
bbbb
bbbb
bbbb
bbbb
bbbb
bbbb
bbbb
bbbb
bbbb
bbbb
bbbb
bbbb
bbbb
bbbb
bbbb
bbbb
bbbb
bbbb
bbbb
bbbb
bbbb
bbbb
bbbb
bbbb
bbbb
bbbb
bbbb
bbbb
bbbb
bbbb
bbbb
bbbb
bbbb
bbbb
bbbb
bbbb
bbbb
bbbb
bbbb
bbbb
bbbb
bbbb
bbbb
bbbb
bbbb
bbbb
bbbb
bbbb
bbbb
bbbb
bbbb
bbbb
bbbb
bbbb
bbbb
bbbb
bbbb
bbbb
bbbb
bbbb
bbbb
bbbb
bbbb
bbbb
bbbb
bbbb
bbbb
bbbb
bbbb
bbbb
bbbb
bbbb
bbbb
bbbb
bbbb
bbbb
bbbb
bbbb
bbbb
bbbb
bbbb
bbbb
bbbb
bbbb
bbbb
bbbb
bbbb
bbbb
bbbb
bbbb
bbbb
bbbb
bbbb
bbbb
bbbb
bbbb
bbbb
bbbb
bbbb
bbbb
bbbb
bbbb
bbbb
bbbb
bbbb
bbbb
bbbb
bbbb
bbbb
bbbb
bbbb
bbbb
bbbb
bbbb
bbbb
bbbb
bbbb
bbbb
bbbb
bbbb
bbbb
bbbb
bbbb
bbbb
bbbb
bbbb
bbbb
bbbb
bbbb
bbbb
bbbb
bbbb
bbbb
bbbb
bbbb
bbbb
bbbb
bbbb
bbbb
bbbb
bbbb
bbbb
bbbb
bbbb
bbbb
bbbb
bbbb
bbbb
bbbb
bbbb
bbbb
bbbb
bbbb
bbbb
bbbb
bbbb
bbbb
bbbb
bbbb
bbbb
bbbb
bbbb
bbbb
bbbb
bbbb
bbbb
bbbb
bbbb
bbbb
bbbb
bbbb
bbbb
bbbb
bbbb
bbbb
bbbb
bbbb
bbbb
bbbb
bbbb
bbbb
bbbb
bbbb
bbbb
bbbb
bbbb
bbbb
bbbb
bbbb
bbbb
bbbb
bbbb
bbbb
bbbb
bbbb
bbbb
bbbb
bbbb
bbbb
bbbb
bbbb
bbbb
bbbb
bbbb
bbbb
bbbb
bbbb
bbbb
bbbb
bbbb
bbbb
bbbb
bbbb
bbbb
bbbb
bbbb
bbbb
bbbb
bbbb
bbbb
bbbb
bbbb
bbbb
bbbb
bbbb
bbbb
bbbb
bbbb
bbbb
bbbb
bbbb
bbbb
bbbb
bbbb
bbbb
bbbb
bbbb
bbbb
bbbb
bbbb
bbbb
bbbb
bbbb
bbbb
bbbb
bbbb
bbbb
bbbb
bbbb
bbbb
bbbb
bbbb
bbbb
bbbb
bbbb
bbbb
bbbb
bbbb
bbbb
bbbb
bbbb
bbbb
bbbb
bbbb
bbbb
bbbb
bbbb
bbbb
bbbb
bbbb
bbbb
bbbb
bbbb
bbbb
bbbb
bbbb
bbbb
bbbb
bbbb
bbbb
bbbb
bbbb
bbbb
bbbb
bbbb
bbbb
bbbb
bbbb
bbbb
bbbb
bbbb
bbbb
bbbb
bbbb
bbbb
bbbb
bbbb
bbbb
bbbb
bbbb
bbbb
bbbb
bbbb
bbbb
bbbb
bbbb
bbbb
bbbb
bbbb
bbbb
bbbb
bbbb
bbbb
bbbb
bbbb
bbbb
bbbb
bbbb
bbbb
bbbb
bbbb
bbbb
bbbb
bbbb
bbbb
bbbb
bbbb
bbbb
bbbb
bbbb
bbbb
bbbb
bbbb
bbbb
bbbb
bbbb
bbbb
bbbb
bbbb
bbbb
bbbb
bbbb
bbbb
bbbb
bbbb
bbbb
bbbb
bbbb
bbbb
bbbb
bbbb
bbbb
bbbb
bbbb
bbbb
bbbb
bbbb
bbbb
bbbb
bbbb
bbbb
bbbb
bbbb
bbbb
bbbb
bbbb
bbbb
bbbb
bbbb
bbbb
bbbb
bbbb
bbbb
bbbb
bbbb
bbbb
bbbb
bbbb
bbbb
bbbb
bbbb
bbbb
bbbb
bbbb
bbbb
bbbb
bbbb
bbbb
bbbb
bbbb
bbbb
bbbb
bbbb
bbbb
bbbb
bbbb
bbbb
bbbb
bbbb
bbbb
bbbb
bbbb
bbbb
bbbb
bbbb
bbbb
bbbb
bbbb
bbbb
bbbb
bbbb
bbbb
bbbb
bbbb
bbbb
bbbb
bbbb
bbbb
bbbb
bbbb
bbbb
bbbb
bbbb
bbbb
bbbb
bbbb
bbbb
bbbb
bbbb
bbbb
bbbb
bbbb
bbbb
bbbb
bbbb
bbbb
bbbb
bbbb
bbbb
bbbb
bbbb
bbbb
bbbb
bbbb
bbbb
bbbb
bbbb
bbbb
bbbb
bbbb
bbbb
bbbb
bbbb
bbbb
bbbb
bbbb
bbbb
bbbb
bbbb
bbbb
bbbb
bbbb
bbbb
bbbb
bbbb
bbbb
bbbb
bbbb
bbbb
bbbb
bbbb
bbbb
bbbb
bbbb
bbbb
bbbb
bbbb
bbbb
bbbb
bbbb
bbbb
bbbb
bbbb
bbbb
bbbb
bbbb
bbbb
bbbb
bbbb
bbbb
bbbb
bbbb
bbbb
bbbb
bbbb
bbbb
bbbb
Drosophila yaku0 2 4 6 8 10 20 30 40 50 60 70 80 90 100
Percentage
Relative abundance tRNA isoacceptor families located consecutively within tRNA clustersin Drosophila genus. Four data points are shown for each combinatior of amino acids: Top:pairs in the same reading direction; below: pairs in opposite reading direction. Left: pairsof presumably functional tRNA, right: pairs of tRNA pseudogenes. The last three rowsand colums refer to putative Suppressor, SeC, and tRNA pseudogenes of undeterminedisoacceptor class, resp.
72
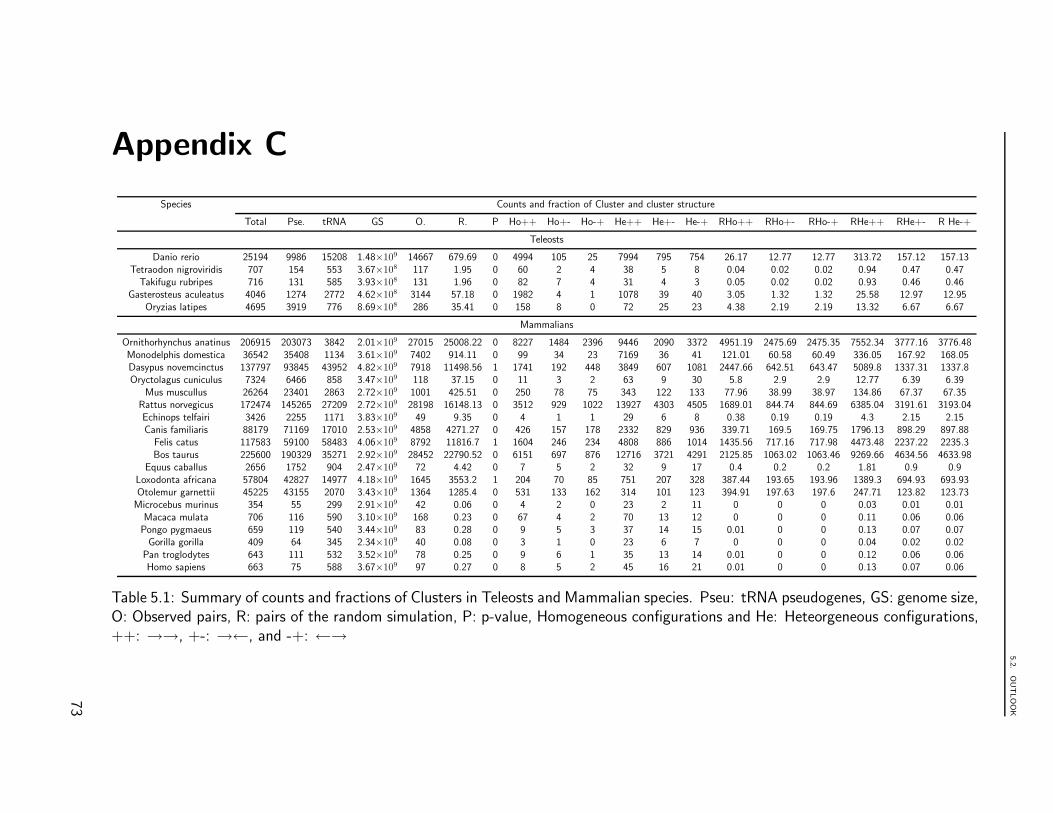
5.2
.O
UT
LO
OK
Appendix C
Species Counts and fraction of Cluster and cluster structure
Total Pse. tRNA GS O. R. P Ho++ Ho+- Ho-+ He++ He+- He-+ RHo++ RHo+- RHo-+ RHe++ RHe+- R He-+
Teleosts
Danio rerio 25194 9986 15208 1.48×10⁹ 14667 679.69 0 4994 105 25 7994 795 754 26.17 12.77 12.77 313.72 157.12 157.13Tetraodon nigroviridis 707 154 553 3.67×10⁸ 117 1.95 0 60 2 4 38 5 8 0.04 0.02 0.02 0.94 0.47 0.47
Takifugu rubripes 716 131 585 3.93×10⁸ 131 1.96 0 82 7 4 31 4 3 0.05 0.02 0.02 0.93 0.46 0.46Gasterosteus aculeatus 4046 1274 2772 4.62×10⁸ 3144 57.18 0 1982 4 1 1078 39 40 3.05 1.32 1.32 25.58 12.97 12.95
Oryzias latipes 4695 3919 776 8.69×10⁸ 286 35.41 0 158 8 0 72 25 23 4.38 2.19 2.19 13.32 6.67 6.67
Mammalians
Ornithorhynchus anatinus 206915 203073 3842 2.01×10⁹ 27015 25008.22 0 8227 1484 2396 9446 2090 3372 4951.19 2475.69 2475.35 7552.34 3777.16 3776.48Monodelphis domestica 36542 35408 1134 3.61×10⁹ 7402 914.11 0 99 34 23 7169 36 41 121.01 60.58 60.49 336.05 167.92 168.05Dasypus novemcinctus 137797 93845 43952 4.82×10⁹ 7918 11498.56 1 1741 192 448 3849 607 1081 2447.66 642.51 643.47 5089.8 1337.31 1337.8Oryctolagus cuniculus 7324 6466 858 3.47×10⁹ 118 37.15 0 11 3 2 63 9 30 5.8 2.9 2.9 12.77 6.39 6.39
Mus muscullus 26264 23401 2863 2.72×10⁹ 1001 425.51 0 250 78 75 343 122 133 77.96 38.99 38.97 134.86 67.37 67.35Rattus norvegicus 172474 145265 27209 2.72×10⁹ 28198 16148.13 0 3512 929 1022 13927 4303 4505 1689.01 844.74 844.69 6385.04 3191.61 3193.04Echinops telfairi 3426 2255 1171 3.83×10⁹ 49 9.35 0 4 1 1 29 6 8 0.38 0.19 0.19 4.3 2.15 2.15Canis familiaris 88179 71169 17010 2.53×10⁹ 4858 4271.27 0 426 157 178 2332 829 936 339.71 169.5 169.75 1796.13 898.29 897.88
Felis catus 117583 59100 58483 4.06×10⁹ 8792 11816.7 1 1604 246 234 4808 886 1014 1435.56 717.16 717.98 4473.48 2237.22 2235.3Bos taurus 225600 190329 35271 2.92×10⁹ 28452 22790.52 0 6151 697 876 12716 3721 4291 2125.85 1063.02 1063.46 9269.66 4634.56 4633.98
Equus caballus 2656 1752 904 2.47×10⁹ 72 4.42 0 7 5 2 32 9 17 0.4 0.2 0.2 1.81 0.9 0.9Loxodonta africana 57804 42827 14977 4.18×10⁹ 1645 3553.2 1 204 70 85 751 207 328 387.44 193.65 193.96 1389.3 694.93 693.93Otolemur garnettii 45225 43155 2070 3.43×10⁹ 1364 1285.4 0 531 133 162 314 101 123 394.91 197.63 197.6 247.71 123.82 123.73Microcebus murinus 354 55 299 2.91×10⁹ 42 0.06 0 4 2 0 23 2 11 0 0 0 0.03 0.01 0.01
Macaca mulata 706 116 590 3.10×10⁹ 168 0.23 0 67 4 2 70 13 12 0 0 0 0.11 0.06 0.06Pongo pygmaeus 659 119 540 3.44×10⁹ 83 0.28 0 9 5 3 37 14 15 0.01 0 0 0.13 0.07 0.07
Gorilla gorilla 409 64 345 2.34×10⁹ 40 0.08 0 3 1 0 23 6 7 0 0 0 0.04 0.02 0.02Pan troglodytes 643 111 532 3.52×10⁹ 78 0.25 0 9 6 1 35 13 14 0.01 0 0 0.12 0.06 0.06Homo sapiens 663 75 588 3.67×10⁹ 97 0.27 0 8 5 2 45 16 21 0.01 0 0 0.13 0.07 0.06
Table 5.1: Summary of counts and fractions of Clusters in Teleosts and Mammalian species. Pseu: tRNA pseudogenes, GS: genome size,O: Observed pairs, R: pairs of the random simulation, P: p-value, Homogeneous configurations and He: Heteorgeneous configurations,++: →→, +-: →←, and -+: ←→
73
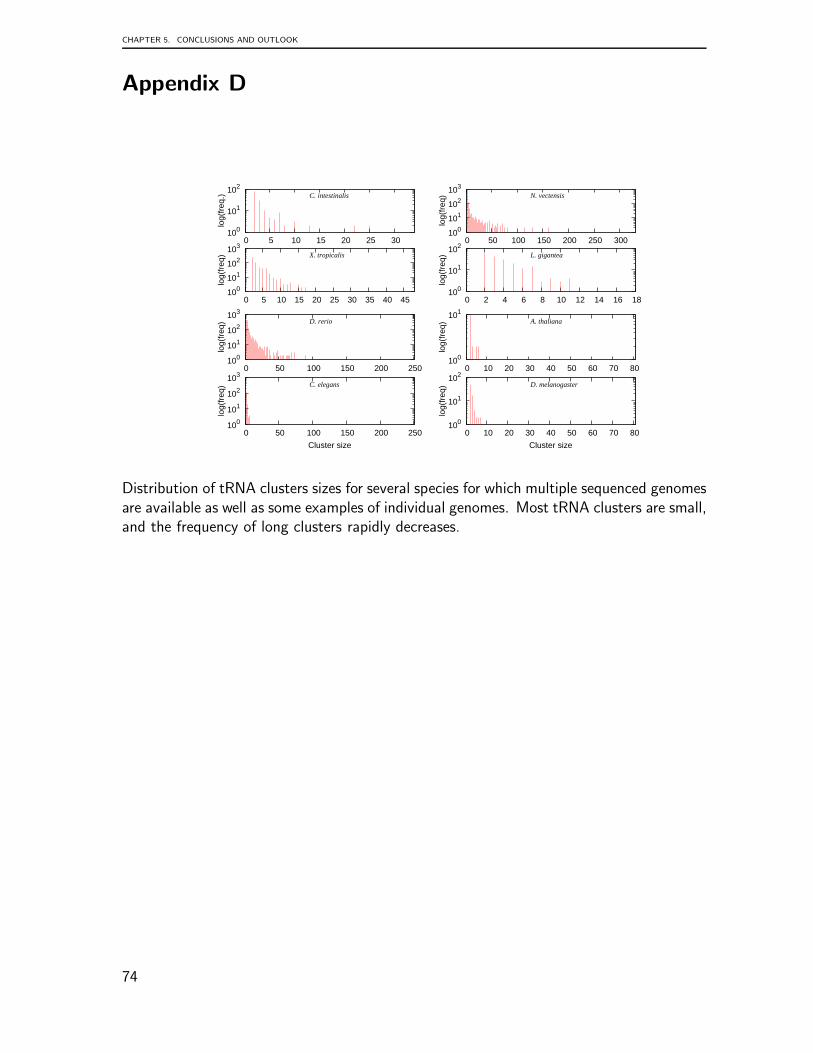
CHAPTER 5. CONCLUSIONS AND OUTLOOK
Appendix D
100
101
102
0 5 10 15 20 25 30
log(
freq
.) C. intestinalis
100
101
102
103
0 50 100 150 200 250 300
log(
freq
) N. vectensis
100
101
102
103
0 5 10 15 20 25 30 35 40 45
log(
freq
) X. tropicalis
100
101
102
0 2 4 6 8 10 12 14 16 18
log(
freq
) L. gigantea
100
101
102
103
0 50 100 150 200 250
log(
freq
) D. rerio
100
101
0 10 20 30 40 50 60 70 80
log(
freq
) A. thaliana
100
101
102
103
0 50 100 150 200 250
log(
freq
)
Cluster size
C. elegans
100
101
102
0 10 20 30 40 50 60 70 80lo
g(fr
eq)
Cluster size
D. melanogaster
Distribution of tRNA clusters sizes for several species for which multiple sequenced genomesare available as well as some examples of individual genomes. Most tRNA clusters are small,and the frequency of long clusters rapidly decreases.
74
List of Figures
1.1 tRNA secondary structure . . . . . . . . . . . . . . . . . . . . . . . . . . 41.2 Summary . . . . . . . . . . . . . . . . . . . . . . . . . . . . . . . . . . . 51.3 Stretch of the miR916 from C. reinhardtii . . . . . . . . . . . . . . . . . . 13
2.1 Summary of tRNA gene and tDNA statistics . . . . . . . . . . . . . . . . 212.2 Correlation of the number of tDNAs with genome size. . . . . . . . . . . 222.3 Distribution of tDNA clusters sizes for several lineages . . . . . . . . . . . 232.4 Summary of tRNA gene and tDNA statistics . . . . . . . . . . . . . . . . 242.5 Cumulative distribution of tDNA pairs distances . . . . . . . . . . . . . . 252.6 Example of heterogeneous tDNA cluster . . . . . . . . . . . . . . . . . . 262.7 Relative abundance tRNA isoacceptor families located consecutively . . . . 262.8 Correlation of syntenic conservation of tDNA loci with genomic distance. . 302.9 Comparison of the tRNA complement of Platyhelminth . . . . . . . . . . . 33
3.1 Cluster detection . . . . . . . . . . . . . . . . . . . . . . . . . . . . . . . 413.2 Distribution of frequency of clusters by size, distance and length. . . . . . 423.3 Non-coding RNAs exhibit specific block patterns . . . . . . . . . . . . . . 443.4 Base pairing probabilities of reads mapped to ncRNA loci . . . . . . . . . 453.5 HTS data reflects structural properties of ncRNAs . . . . . . . . . . . . . 463.6 Box plots for 8 different features selected to train the random forest classifier 473.7 Parallel coordinate displays on the Random Forest approach . . . . . . . . 483.8 Heatmaps used to represent the votes for each class and proximity matrices 493.9 Short reads are produced from a wide variety of structured ncRNAs. . . . . 503.10 Decomposition of the cluster of reads at the mir-125b-1 . . . . . . . . . . 51
4.1 Common system definition for tRNAs . . . . . . . . . . . . . . . . . . . . 564.2 Block expression visualization of Asparagine tRNAsuperfamily1 for Chicken 574.3 BLASTClust output example . . . . . . . . . . . . . . . . . . . . . . . . 594.4 Different proccesing patterns for some tRNAsuperfamilies . . . . . . . . . 604.5 Block expression distribution for all the merged blocks . . . . . . . . . . . 614.6 Block expression distribution for merged blocks . . . . . . . . . . . . . . . 624.7 Hierarchical cluster analysis with p-values for block patterns (rat) . . . . . 644.8 Hierarchical cluster analysis with p-values for block patterns (chicken) . . . 654.9 Hierarchical cluster analysis with p-values for block patterns (dog) . . . . . 66
75
List of Tables
1.1 Identified tRNAs . . . . . . . . . . . . . . . . . . . . . . . . . . . . . . . 12
2.1 Comparison of observed and expected number of tRNA pairs . . . . . . . . 272.2 Fisher test results for Teleosteos species . . . . . . . . . . . . . . . . . . . 282.3 Quantity structure of linkage analysis results in vertebrates . . . . . . . . . 292.4 Syntenic conservation of tDNAs . . . . . . . . . . . . . . . . . . . . . . . 29
3.1 Fractions of clusters and size of the cluster . . . . . . . . . . . . . . . . . 423.2 Fractions of Clusters and their distance locations . . . . . . . . . . . . . . 423.3 Fraction of Clusters length . . . . . . . . . . . . . . . . . . . . . . . . . . 423.4 In total 434 of 852 clusters were found within regions of annotated ncRNA
loci . . . . . . . . . . . . . . . . . . . . . . . . . . . . . . . . . . . . . . 433.5 Positive predictive values (PPV) and recall rates for training sets . . . . . 48
4.1 Counts of tRNAscan-SE predictions and fraction of mapped tRNAs . . . . 58
5.1 Summary of counts and fractions of Clusters in Teleosts and Mammalian . 73
76
Bibliography
[1] The R project for statistical computing. http://www.r-project.org/.
[2] Random forests. http://www.stat.berkeley.edu/∼breiman/RandomForests/.
[3] Random forests weka. Weka 3.5, University of Waikato,http://www.cs.waikato.ac.nz/ml/weka/.
[4] Supplementary data in machine-readable form, 2009.http://www.bioinf.uni-leipzig.de/Publications/SUPPLEMENTS/09-050.
[5] A. Admire, L. Shanks, N. Danz, M. Wang, U. Weier, W. Stevens, E. Hunt, andT. Weinert. Cycles of chromosome instability are associated with a fragile site andare increased by defects in DNA replication and checkpoint controls in yeast. Genes
& Dev., 20:159–173, 2006.
[6] N. Akimitsu. Messenger RNA surveillance systems monitoring proper translationtermination. J Biochem, 143(1):1–8, 2008.
[7] A. Alexandrov, I. Chernyakov, W. Gu, S. L. Hiley, T. R. Hughes, E. J. Grayhack, andE. M. Phizicky. Rapid tRNA decay can result from lack of nonessential modifications.Mol. Cell, 21:87–96, Jan 2006.
[8] A. Ambrogelly, S. Palioura, and D. Soll. Natural expansion of the genetic code. Nat
Chem Biol, 3:29–35, 2007.
[9] Mette M. F. van der Winden J. Matzke A. J. Aufsatz, W. and M. Matzke.RNA-directed DNA methylation in arabidopsis. Proc Natl Acad Sci U S A,99(NIL):1649916506, 2002.
[10] J. Babiarz, J. Graham, Y. Wang, D. Bartel, and R. Blelloch. Mouse es cells express en-dogenous shRNAs, siRNAs, and other microprocessor-independent, dicer-dependentsmall rnas. Gen Develop, 22:2773–2785, 2008.
[11] A. Barski, S Cuddapah, K. Cui, T-Y. Roh, D.E Schones, Z. Wang, G. Wei, Chepelev,and K. Keji Zhao. High-resolution profiling of histone methylations in the humangenome. Cell, 129(4):823–37, 2007.
[12] W. Bender. MicroRNAs in the Drosophila bithorax complex. Genes Dev., 22:14–19,Jan 2008.
77
BIBLIOGRAPHY
[13] P.J. Beuning, F. Yang, P. Schimmel, and K. Musier-Forsyth. Specific atomic groupsand RNA helix geometry in acceptor stem recognition by a tRNA synthetase. Proc
Natl Acad Sci U S A, 94(19):10150–4, 1997.
[14] E. Birney, J. A. Stamatoyannopoulos, A. Dutta, R. Guigo, T. R. Gingeras, E. H.Margulies, Z. Weng, M. Snyder, E. T. Dermitzakis, R. E. Thurman, M. S. Kuehn,and et. al. Identification and analysis of functional elements in 1% of the humangenome by the ENCODE pilot project. Nature, 447:799–816, Jun 2007.
[15] L. Breiman. Machine Learning: Random forests. Springer Netherlands, 2001.
[16] L. Brendan, I. Anderson, R. Davies, U. Alsmark, and et al. The genome of the protistparasite Entamoeba histolytica. Nature, 433(7028):865–8, 2005.
[17] K. Callahan and J. Butler. TRAMP complex enhances RNA degradation by thenuclear exosome component Rrp6. J Biol Chem, 285(6):3540–7, 2010.
[18] I. Chernyakov, J. Whipple, L. Kotelawala, E. Grayhack, and Eric M. Phizicky. Degra-dation of several hypomodified mature tRNA spceies in Saccharomyes cerevisiae ismediated by Me exonuclease Rat1 and Xrn1. GENES DEVELOP., 22:1369–1380,2008.
[19] J. Christoph, M. Rederstorff, J. Hertel, P. F. Stadler, I. L. Hofacker, M. Schrettl,H. Haas, and A. Huttenhofer. Small ncrna transcriptome analysis from Aspergillus
fumigatus suggests a novel mechanism for regulation of protein-synthesis. Nucleic
Acids Res., 36:2677–2689, 2008.
[20] T. Chung, O. Siol, T. Dingermann, and T. Winckler. Protein interactions involved intRNA gene-specific integration of Dictyostelium discoideum non-long terminal repeatretrotransposon TRE5-A. Mol Cell Biol, 27(24):8492–501, 2007.
[21] C. G. Clark, I. K. Ali, M. Zaki, B. J. Loftus, and N. Hall. Unique organisation oftRNA genes in Entamoeba histolytica. Mol. Biochem. Parasitol., 146:24–29, 2006.
[22] N. Cloonan, A. Forrest, G. Kolle, B. Gardiner, G. Faulkner, M. Brown, D. Tay-lor, A. Steptoe, S. Wani, G. Bethel, A. Robertson, A. Perkins, S. Bruce, C. Lee,S. Ranade, H. Peckham, J. Manning, K. McKernan, and S. Grimmond. Stem celltranscriptome profiling via massive-scale mRNA sequencing. Nat Methods, 5(7):613–9, 2008.
[23] C. Cole, A. Sobala, C.. Lu, S. R. Thatcher, A. Bowman, J. W. Brown, P. J. Green,G. J. Barton, and G. Hutvagner. Filtering of deep sequencing data reveals the exis-tence of abundant Dicer-dependent small RNAs derived from tRNAs. RNA, 15:2147–2160, 2009.
[24] J. R. Coleman, D. Papamichail, S. Skiena, B. Futcher, E. Wimmer, and S. Mueller.Virus attenuation by genome-scale changes in codon pair bias. Science, 320:1784–1787, 2008.
78
BIBLIOGRAPHY
[25] L. A. Copela, G. Chakshusmathi, R. L. Sherrer, and S. L. Wolin. The La proteinfunctions redundantly with tRNA modification enzymes to ensure tRNA structuralstability. RNA, 12:644–654, Apr 2006.
[26] C. Copeland, M. Marz, D. Rose, J. Hertel, P. Brindley, C. Bermudez Santana, S. Kehr,Stephan-Otto C., and P.F. Stadler. Non-coding rna annotation of the Schistosoma
mansoni genome. BMC Genomics, 10:464, 2009.
[27] N. Copeland, N. Jenkins, and S. O’Brien. Genomics. Mmu 16–comparative genomichighlights. Science, 296(5573):1617–8, 2002.
[28] M Crawley. The R Book. John Wiley & Sons, 2007.
[29] C. de Duve. Transfer RNA: the second genetic code. Nature, 333(12):117–118, 1988.
[30] W. Deng, X. Zhu, G. Skogerb, Y. Zhao, Z. Fu, Y. Wang, H. He, L. Cai, H. Sun,C. Liu, B. Li, B. Bai, J. Wang, D. Jia, S. Sun, H. He, Y. Cui, Y. Wang, D. Bu, andR. Chen. Organization of the Caenorhabditis elegans small non-coding transcriptome:genomic features, biogenesis, and expression. Genome Res., 16:20–29, Jan 2006.
[31] A. M. Deshpande and C.. Newlon. DNA replication fork pause sites dependent ontranscription. Science, 272:1030–1033, 1996.
[32] M. Deutscher. Degradation of stable RNA in bacteria. J Biol. Chem., 278:45041–45044, 2003.
[33] M. Di Giulio. The origin of the tRNA molecule: implications for the origin of proteinsynthesis. J. Theor. Biol., 226:89–93, 2004.
[34] M. Di Giulio. Formal proof that the split genes of tRNAs of Nanoarchaeum equitans
are an ancestral character. J Mol Evol., 69:505–511, 2009.
[35] S. Di Rienzi, D. Collingwood, M.K. Raghuraman, and B. Brewer. Fragile genomicsites are associated with origins of replication. Genome Biol Evol, 2009(NIL):350–63,2009.
[36] M. Doma and R. Parker. RNA quality control in Eukaryotes. Cell, 131:644–654, Nov2007.
[37] S. R. Eddy. E. P. Nawrocki, D. L. Kolbe. Infernal 1.0: Inference of RNA alignments.Bioinformatics, 25:1335–1337, 2009.
[38] J.R. Ecker and R. W. Davis. Inhibition of gene expression in plant cells by expressionof antisense RNA. Proc Natl Acad Sci U S A, 83(15):5372–6, 1986.
[39] S. R. E Eddy and R. Durbin. RNA sequence analysis using covariance models. Nucl.
Acids Res, 22:2079–2088, 1994.
[40] L. Eichinger, J.A. Pachebat, G. Glockner, and et al. (97 co authors). The genome ofthe social amoeba Dictyostelium discoideum. Nature, 435:43–57, 2005.
79
BIBLIOGRAPHY
[41] M. Eigen and R. Winkler-Oswatitsch. Transfer-RNA, an early gene? Naturwis-
senschaften, 68:282–292, 1981.
[42] Manfred Eigen, Bjorn F. Lindemann, M. Tietze, Ruthild Winkler-Oswatitsch, AndreasW. M. Dress, and Arndt von Haeseler. How old is the genetic code? Statisticalgeometry of tRNA provides an answer. Science, 244:673–679, 1989.
[43] A. Emde, M. Grunert, D. Weese, K. Reinert, and S. Sperling. MicroRazerS: rapidalignment of small RNA reads. Bioinformatics, 26(1):123–4, 2010.
[44] C. Ender, A. Krek, M. R. Friedlander, M. Beitzinger, L. Weinmann, W. Chen, S. Pf-effer, N. Rajewsky, and G. Meister. A human snoRNA with microRNA-like functions.Mol. Cell, 32:519–528, Nov 2008.
[45] J. Fey, J.H. Weil, K. Tomita, A. Cosset, A. Dietrich, I. Small, and L. Marechal-Drouard. Role of editing in plant mitochondrial transfer RNAs. Gene, 286(1):21–4,2002.
[46] A. Fichant and C. Burks. Identifying potential tRNA genes in genomic DNA se-quences. J. Mol. Bio., 220:659–671, 1991.
[47] Bhattacharyya S. N. Filipowicz, W. and N. Sonenberg. Mechanisms of posttran-scriptional regulation by microRNAs: are the answers in sight? Nat Rev Genet,9(NIL):102–104, 2008.
[48] R. A. Fisher. On the interpretation of χ2 from contingency tables, and the calculationof p. J. Royal Stat. Soc., 85:87–94, 1922.
[49] F. E. Frenkel, M. Chaley, E. V. Korotkov, and K. G. Skryabin. Evolution of tRNA-likesequences and genome variability. Gene, 335:57–71, 2004.
[50] M. Friedlander, W. Chen, C. Adamidi, J. Maaskola, R. Einspanier, S. Knespel, andN. Rajewsky. Discovering microRNAs from deep sequencing data using miRDeep.Nat Biotechnol, 26(4):407–15, 2008.
[51] K. Fujishima, J. Sugahara, M. Tomita, and A. Kanai. Sequence evidence in thearchaeal genomes that tRNAs emerged through the combination of ancestral genesas 5’ and 3’ tRNA halves. PLoS One, 3:e1622, 2008.
[52] M. R. Garcia-Silva, M. Frugier, J. P. Tosar, A. Correa-Dominguez, L. Ronalte-Alves,A. Parodi-Talice, C. Rovira, C. Robello, S. Goldenberg, and A. Cayota. A populationof tRNA-derived small RNAs is actively produced in Trypanosoma cruzi and recruitedto specific cytoplasmic granules. Mol Biochem Parasitol, Feb 2010.
[53] P. P. Gardner, J. Daub, J. G. Tate, E. P. Nawrocki, D. L. Kolbe, S. Lindgreen,A. C. Wilkinson, R. D. Finn, S. Griffiths-Jones, S. R. Eddy, and A. Bateman. Rfam:updates to the RNA families database. Nucleic Acids Res., 37:D136–140, Jan 2009.
[54] R. F. Gesteland and J. F. Atkins, editors. The RNA World. Cold Spring HarborLaboratory Press, Plainview, NY, 1993.
80
BIBLIOGRAPHY
[55] E. A. Glazov, K. Kongsuwan, W. Assavalapsakul, P. F. Horwood, N. Mitter, andT. J. Mahony. Repertoire of bovine miRNA and miRNA-like small regulatory RNAsexpressed upon viral infection. PLoS ONE, 4:e6349, 2009.
[56] Evgeny A Glazov, Pauline A Cottee, Wesley C Barris, Robert J Moore, Brian PDalrymple, and Mark L Tizard. A microRNA catalog of the developing chickenembryo identified by a deep sequencing approach. Genome Res, 18(6):957–64, 2008.
[57] Evgeny A Glazov, Kritaya Kongsuwan, Wanchai Assavalapsakul, Paul F Horwood,Neena Mitter, and Timothy J Mahony. Repertoire of bovine miRNA and miRNA-likesmall regulatory RNAs expressed upon viral infection. PLoS One, 4(7):e6349, 2009.
[58] J. M. Goodenbour and T. Pan. Diversity of tRNA genes in eukaryotes. Nucl. Acids
Res., 34:6137–6146, 2006.
[59] J. Gordon, K. Byrne, and K. Wolfe. Additions, losses, and rearrangements on theevolutionary route from a reconstructed ancestor to the modern Saccharomyces cere-visiae genome. PLoS Genet, 5(5):e1000485, 2009.
[60] S. Goto-Ito, T. Ito, M. Kuratani, Y. Bessho, and S. Yokoyama. Tertiary structurecheckpoint at anticodon loop modification in tRNA functional maturation. Nat Struct
Mol Biol, 16(10):1109–15, 2009.
[61] O Gotoh. An improved algorithm for matching biological sequences. J. Mol. Biol,162, 1982.
[62] R Graham, J. Calvin, C Player, M Axtell, W Lee, C Nusbaum, H. Ge, and D. Bartel.Large-scale sequencing reveals 21U-RNAs and additional microRNAs and endogenoussiRNAs in C. elegans. Cell, 127(6):1193–207, 2006.
[63] P Green. Crossmatch. http:www.phrap.org/phredphrap/general.html.
[64] S. Griffiths-Jones, A. Bateman, M. Marshall, A. Khanna, and S. R. Eddy. Rfam: anRNA family database. Nucleic Acids Res., 31:439–441, Jan 2003.
[65] M. Hackenberg, M. Sturm, D. Langenberger, J.M. Falcon-Perez, and A. Aransay.miRanalyzer: a microRNA detection and analysis tool for next-generation sequencingexperiments. Nucleic Acids Res, 37(Web Server issue):W68–76, 2009.
[66] H. J. Haiser, F. V. Karginov, G. J. Hannon, and M. A. Elliot. Developmentallyregulated cleavage of tRNAs in the bacterium Streptomyces coelicolor. Nucleic Acids
Res., 36:732–741, Feb 2008.
[67] D. Haussecker, Y. Huang, A. Lau, P. Parameswaran, A. Fire, and M. Kay. HumantRNA-derived small RNAs in the global regulation of RNA silencing. RNA, (1):1–5,2010.
[68] J. Hertel, I. L. Hofacker, and P. F. Stadler. SnoReport: computational identificationof snoRNAs with unknown targets. Bioinformatics, 24:158–164, Jan 2008.
81
BIBLIOGRAPHY
[69] P. Higgs and W. Ran. Coevolution of codon usage and tRNA genes leads to alternativestable states of biased codon usage. Mol Biol Evol, 25(11):2279–91, 2008.
[70] P. G. Higgs, D. Jameson, H. Jow, and M. Rattray. The evolution of tRNA-leu genesin animal mitochondrial genomes. J. Mol. Evol., pages 435–445, 2003.
[71] I. L. Hofacker and P. F. Stadler. Memory efficient folding algorithms for circular RNAsecondary structures. Bioinformatics, 22:1172–1176, May 2006.
[72] S. Hoffmann, C. Otto, S. Kurtz, C. Sharma, P. Khaitovich, P. F. Stadler, and J. Hack-ermueller. Fast mapping of short sequences with mismatches, insertions and deletionsusing index structures. PLoS Comp. Biol., 5(9):e1000502., 2009.
[73] M.J Hohn, H-S. Park, P. O’Donoghue, M. Schnitzbauer, and D. Soll. Emergence ofthe universal genetic code imprinted in an RNA record. Proc Natl Acad Sci U S A,103(48):18095–100, 2006.
[74] P. Hou, Y-M. Schimmel. A simple structural feature is a major determinant of theidentity of a transfer RNA. Nature, 333(12):140–145, 1988.
[75] J. Hsieh and C. A. Fierke. Conformational change in the Bacillus subtilis RNase Pholoenzyme–pre-tRNA complex enhances substrate affinity and limits cleavage rate.RNA, 15:1565–1577, Aug 2009.
[76] L-C. Hsieh, S.I Lin, A. Chun-Chieh, J. Chen, W-Y. Yi Lin, C. Tseng, W. Li, andT. Chiou. Uncovering small RNA-mediated responses to phosphate deficiency inArabidopsis by deep sequencing. Plant Physiol, 151(4):2120–32, 2009.
[77] Wolfgang Huber, Joern Toedling, and Lars M. Steinmetz. Transcript mapping withhigh-density oligonucleotide tiling arrays. Bioinformatics, 22:1963–1970, 2006.
[78] N. Hubert, R. Walczak, C. Sturchler, E. Myslinski, C. Schuster, E. Westhof, P. Car-bon, and A. Krol. RNAs mediating cotranslational insertion of selenocysteine ineukaryotic selenoproteins. Biochimie, 78:590–596, 1996.
[79] G. Hutvagner and M. J. Simard. Argonaute proteins: key players in RNA silencing.Nat Rev Mol Cell Biol, 9(NIL):22–32, 2008.
[80] A. Iacoangeli, T. S. Rozhdestvensky, N. Dolzhanskaya, B. Tournier, J. Schutt, J. Bro-sius, R. B. Denman, E. W. Khandjian, S. Kindler, and H. Tiedge. On BC1 RNA andthe fragile X mental retardation protein. Proc. Natl. Acad. Sci. USA, 105:734–739,2008.
[81] O. Isken and L. Maquat. Quality control of eukaryotic mRNA: safeguarding cells fromabnormal mRNA function. Genes & devp., 21:1833–1856, 2007.
[82] A S Ivessa, B A Lenzmeier, J B Bessler, L K Goudsouzian, S L Schnakenberg, andV A Zakian. The saccharomyces cerevisiae helicase Rrm3p facilitates replication pastnonhistone protein-DNA complexes. Mol. Cell, 12:1525–1536, 2003.
82
BIBLIOGRAPHY
[83] D. S. Johnson, A. Mortazavi, R. Myers, and B Wold. Genome-wide mapping of invivo protein-DNA interactions. Science, 316(5830):1497–502, 2007.
[84] C. Jung, M. Hansen, I. Makunin, D. Korbie, and J.S. Mattick. Identification ofnovel non-coding RNAs using profiles of short sequence reads from next generationsequencing data. BMC Genomics, 11:77, 2010.
[85] S. Kadaba, X. Wang, and J. Anderson. Nuclear RNA surveillance in Saccharomycescerevisiae: Trf4p-dependent polyadenylation of nascent hypomethylated tRNA andan aberrant form of 5S rRNA. RNA, 12(3):508–21, 2006.
[86] P. Kapranov, J. Cheng, S. Dike, D. A. Nix, R. Duttagupta, A. T. Willingham, P. F.Stadler, J. Hertel, J. Hackermuller, I. L. Hofacker, I. Bell, E. Cheung, J. Drenkow,E. Dumais, S. Patel, G. Helt, M. Ganesh, S. Ghosh, A. Piccolboni, V. Sementchenko,H. Tammana, and T. R. Gingeras. RNA maps reveal new RNA classes and a possiblefunction for pervasive transcription. Science, 316:1484–1488, Jun 2007.
[87] H. Kawaji, M. Nakamura, Y. Takahashi, A. Sandelin, S. Katayama, S. Fukuda, C. O.Daub, C. Kai, J. Kawai, J. Yasuda, P. Carninci, and Y. Hayashizaki. Hidden layersof human small RNAs. BMC Genomics, 9:157, 2008.
[88] H. Kawaji, M. Nakamura, Y. Takahashi1, A. Sandelin, S. Katayama, S. email, Fukuda,C. Daub, C. Kai, J. Jun Kawai, J. Yasuda, P. Carninci, and Y Hayashizaki. Hiddenlayers of human small RNAs. BMC genomics, (9):157, 2008.
[89] H. Kawasaki and K. Taira. Induction of dna methylation and gene silencing by shortinterfering rnas in human cells. Nature, 431(NIL):211–7, 2004.
[90] K. Kiontke and D. H. A. Fitch. The phylogenetic relationships of Caenorhabditis
and other rhabditids. In The C. elegans Research Communit, editor, Wormbook.Wormbook, 2005. doi/10.1895/wormbook.1.11.1, http://www.wormbook.org.
[91] T. Kirsten and E. Rahm. BioFuice: Mapping-based data intergation in bioinformat-ics. In Ulf Leser, Felix Naumann, and Barbara Eckmann, editors, Data Integration
in the Life Sciences, volume 4075 of Lect. Notes Comp. Sci., pages 124–135, 2006.Third International Workshop, DILS 2006.
[92] C.H. Kuo and H. Ochman. Deletional Bias across the Three Domains of Life. Genome
Biol Evol, 2009(NIL):145–52, 2009.
[93] K. Labib and B. Hodgson. Replication fork barriers: pausing for a break or stallingfor time? Embo reports, 8(4):8492–501, 2007.
[94] D. Langenberger, C. Bermudez-Santana, J. Hertel, S. Hoffmann, P. Khaitovich, andP. F. Stadler. Evidence for human microRNA-offset RNAs in small RNA sequencingdata. Bioinformatics, 25:2298–2301, Sep 2009.
[95] D. Langenberger, C. I. Bermudez-Santana, P. F. Stadler, and S. Hoffmann. Identi-fication and classification of small rnas in transcriptome sequence data. Pac Symp
Biocomput, pages 80–87, 2010.
83
BIBLIOGRAPHY
[96] M. Lechner, L. Steiner, and S. J. Prohaska. Proteinortho — orthology detection tool,2009. http://www.bioinf.uni-leipzig.de/∼marcus/software/proteinortho/.
[97] Y S Lee, H K Kim, S Chung, K S Kim, and A J Dutta. Depletion of human micro-RNA miR-125b reveals that it is critical for the proliferation of differentiated cells butnot for the down-regulation of putative targets during differentiation. Biol Chem.,280:16635–16641, 2005.
[98] Y S Lee, Y Shibata, A Malhotra, and A Dutta. A novel class of small RNAs: tRNA-derived RNA fragments (tRFs). Genes Dev., 23:2639–2649, 2009.
[99] J. Lehmann, P.F Stadler, and S. Prohaska. SynBlast: assisting the analysis of con-served synteny information. BMC Bioinformatics, 9(NIL):351, 2008.
[100] J. Leigh and F. Lang. Mitochondrial 3’ tRNA editing in the jakobid Seculamonasecuadoriensis: a novel mechanism and implications for tRNA processing. RNA,10(4):615–21, 2004.
[101] T. Lengauer. Bioinformatics: from Genomes to Therapies. WILEY-VCH VerlagGmbH & Co., Weinheim, 2007.
[102] H. Li, J. Ruan, and R. Durbin. Mapping short DNA sequencing reads and callingvariants using mapping quality scores. Genome Res., 18:1851–1858, Nov 2008.
[103] L. Li, Christian J. Stoeckert Jr, and David S. Roos Roos. OrthoMCL: Identificationof ortholog groups for eukaryotic genomes. Genome Res., 13:2178–2189, 2003.
[104] R. Li, Y. Li, K. Kristiansen, and J. Wang. SOAP: short oligonucleotide alignmentprogram. Bioinformatics, 24:713–714, Mar 2008.
[105] Y. Li, J. Luo, H. Zhou, J. Liao, L. Ma, Y. Chen, and L. Qu. Stress-induced tRNA-derived RNAs: a novel class of small RNAs in the primitive eukaryote Giardia lamblia.Nucleic Acids Res, 36:6048–6055, 2008.
[106] Y. Li, J. Luo, H. Zhou, J. Liao, Li Ma, Y. Chen, and L. Qu. Stress-induced tRNA-derived RNAs: a novel class of small RNAs in the primitive eukaryote Giardia lamblia.Nucleic Acids Res, 36:6048–6055, 2008.
[107] Z. Li, X. Gong, V. H. Joshi, and M. Li. Co-evolution of tRNA 3’ trailer sequenceswith 3’ processing enzymes in bacteria. RNA, 11:567–577, May 2005.
[108] H. Lin, Z. Zhang, M. Q. Zhang, B. Ma, and M. Li. ZOOM! Zillions of oligos mapped.Bioinformatics, 24:2431–2437, Nov 2008.
[109] R. Lister, R. OMalley, J. Tonti-Filippini, B. Gregory, C. Berry, A. Millar, and J. Ecker.Highly integrated single-base resolution maps of the epigenome in Arabidopsis. Cell,133(3):523–36, 2008.
[110] K.M Lonergan and M.V. Gray. Editing of transfer RNAs in Acanthamoeba castellaniimitochondria. Science, 259(5096):812–6, 1993.
84
BIBLIOGRAPHY
[111] T. M. Lowe and S. R. Eddy. tRNAscan-SE: a program for improved detection oftransfer RNA genes in genomic sequence. Nucleic Acids Res., 25:955–964, 1997.
[112] S. Lykke-Andersen, D. Brodersen, and T.H. Jensen. Origins and activities of theeukaryotic exosome. J Cell Sci, 122(Pt 10):1487–94, 2009.
[113] C. Marck and H. Grosjean. tRNomics: analysis of tRNA genes from 50 genomesof Eukarya, Archaea, and Bacteria reveals anticodon-sparing strategies and domain-specific features. RNA, 8:1189–1232, 2002.
[114] C Marck, R Kachouri-Lafond, I Lafontaine, E Westhof, B Dujon, and H. Grosjean.The RNA polymerase III-dependent family of genes in hemiascomycetes: comparativeRNomics, decoding strategies, transcription and evolutionary implications. Nucleic
Acids Res., 34:1816–1835, 2006.
[115] L. Marechal-Drouard, R. Kumar, C. Remacle, and I. Small. RNA editing of larchmitochondrial tRNA(His) precursors is a prerequisite for processing. Nucleic Acids
Res, 24(16):3229–34, 1996.
[116] M. Margulies, M. Egholm, W. Altman, S. Attiya, J. Bader, L. Bemben, J. Berka,M. Braverman, Y. Chen, Z. Chen, S. Dewell, Lei Du, J. Fierro, X. Gomes, B. Godwin,W. He, S. Helgesen, C.H. Ho, G. Irzyk, S. Jando, M. Alenquer, T. Jarvie, K. Jirage,J-B. Kim, J. Knight, J.R. Lanza, J. Leamon, S. Lefkowitz, M. Lei, J. Li, K. Lohman,H. Lu, V. Makhijani, K. McDade, M. McKenna, E. Myers, E. Nickerson, J. Nobile,R. Plant, B. Puc, M. Ronan, G. Roth, G. Sarkis, J. Simons, J. Simpson, M. Srinivasan,K. Tartaro, A. Tomasz, K. Vogt, G. Volkmer, S. Wang, Y. Wang, M. Weiner, P. Yu,R. Begley, and J. Rothberg. Genome sequencing in microfabricated high-densitypicolitre reactors. Nature, 437(7057):376–80, 2005.
[117] J. Marioni, C. Mason, S. Mane, M. Stephens, and Y. Gilad. RNA-seq: an assessmentof technical reproducibility and comparison with gene expression arrays. Genome Res,18(9):1509–17, 2008.
[118] Chen Y-M. Foss K. Schneider J. McClain, W. Association of transfer RNA acceptoridentity with a helical irregularity. Science, 241:1681–1684, 1988.
[119] W.C. McClain. Surprising contribution to aminoacylation and translation of non-WatsonCrick pairs in tRNA. PNAS, 103:4570–4575, 2006.
[120] R J McFarlane and S K. Whitehall. tRNA genes in eukaryotic genome organizationand reorganization. Cell Cycle, 8:3102–3106, 2009.
[121] W. Miller, K. Rosenbloom, R. C. Hardison, M. Hou, J. Taylor, B. Raney, R. Burhans,D. C. King, R. Baertsch, D. Blankenberg, S. L. Kosakovsky, A. Nekrutenko, B. Gi-ardine, R. S. Harris, S. Tyekucheva, M. Diekhans, T. H. Pringle, W. J. Murphy,A. Lesk, G. M. Weinstock, K. Lindblad-Toh, R. A. Gibbs, E. S. Lander, A. Siepel,D. Haussler, and W. J. Kent. 28-way vertebrate alignment and conservation track inthe UCSC genome browser. Genome Res., 17:1797–1808, 2007.
85
BIBLIOGRAPHY
[122] D. Moazed. Small RNAs in transcriptional gene silencing and genome defence. Na-
ture, 457:413–420, Jan 2009.
[123] A Molnar, F Schwach, D J Studholme, E C Thuenemann, and D C Baulcombe.miRNAs control gene expression in the single-cell alga Chlamydomonas reinhardtii.Nature, 447:1126–1129, 2007.
[124] A. Mortazavi, B. Williams, K. McCue, L. Schaeffer, and B. Barbara Wold. Mappingand quantifying mammalian transcriptomes by RNA-Seq. Nat Methods, 5(7):621–8,2008.
[125] P Mukhopadhyay, S Basak, and T C Ghosh. Nature of selective constraints onsynonymous codon usage of rice differs in GC-poor and GC-rich genes. Gene, 400:71–81, 2007.
[126] D. Murphy, B. Dancis, and J. R. Brown. The evolution of core proteins involved inmicroRNA biogenesis. BMC Evol Biol, 8(NIL):92, 2008.
[127] U. Nagalakshmi, Z. Wang, K. Waern, C. Shou, D. Raha, M. Gerstein, and M. Sny-der. The transcriptional landscape of the yeast genome defined by RNA sequencing.Science, 320(5881):1344–9, 2008.
[128] Y. Nakamura. Codon usage database. NCBI-GenBank, Flat File Release 160.0 [June15 2007],http://www.kazusa.or.jp/codon/.
[129] K. Nakanishi and O. Nureki. Recent progress of structural biology of tRNA processingand modification. Mol. Cells, 19:157–166, Apr 2005.
[130] C. Napolii, C. Lemieux, and R. Jorgensen. Introduction of a Chimeric ChalconeSynthase Gene into Petunia Results in Reversible Co-Suppression of HomologousGenes in trans. Plant Cell, 2(4):279–289, 1990.
[131] E. P. Nawrocki, D. L. Kolbe, and S. R. Eddy. Infernal 1.0: inference of RNA align-ments. Bioinformatics, 25:1335–1337, May 2009.
[132] H. Nishihara and Okada N. Smit A. F. Functional noncoding sequences derived fromSINEs in the mammalian genome. Genome Res, 16:864–874, 2006.
[133] M Nozawa, Y Kawahara, and M. Nei. Genomic drift and copy number variation ofsensory receptor genes in humans. Proc Natl Acad Sci U S A., 104:20421–20426,2007.
[134] J. O’Rourke and M. Swanson. Mechanisms of RNA-mediated disease. J Biol Chem,284(12):7419–23, 2009.
[135] E. Passarge, B. Horsthemke, and R. A. Farber. Incorrect use of the term synteny.Nat Genet, 23(4):387, 1999.
[136] N. Pater. Enhancing Random Forest Implementation in Weka. Machine learning
conference paper for ECE591Q, Nov:1–10, 2005.
86
BIBLIOGRAPHY
[137] A. Pavesi, F. Conterio, A. Bolchi, G. Dieci, , and S. Ottonello. Identification ofnew eukaryotic tRNA genes in genomic DNA databases by a multistep weight matrixanaylsis of transcriptional control regions. Nucl. Acids Res, 22:1247–1256, 1994.
[138] G. H. Perry, F. Yang, T. Marques-Bonet, C. Murphy, T. Fitzgerald, A. S. Lee, C. Hy-land, A. C. Stone, M. E. Hurles, C. Tyler-Smith, E. E. Eichler, N. P. Carter, C. Lee,and R. Redon. Copy number variation and evolution in humans and chimpanzees.Genome Res., 18:1698–1710, 2008.
[139] H. Persson, A. Kvist, J. Vallon-Christersson, P. Medstrand, A. Borg, and C. Rovira.The non-coding RNA of the multidrug resistance-linked vault particle encodes mul-tiple regulatory small RNAs. Nat. Cell Biol., 11:1268–1271, Oct 2009.
[140] E. M. Phizicky. Have tRNA, will travel. Proc. Natl. Acad. Sci. U.S.A., 102:11127–11128, Aug 2005.
[141] E. M. Phizicky and J. D. Alfonzo. Do all modifications benefit all tRNAs? FEBS
Lett., 584:265–271, Jan 2010.
[142] J. Putz, R. Giege, and C. Florentz. Diversity and similarity in the tRNA world: overallview and case study on malaria-related tRNAs. FEBS Lett, 584(2):350–8, 2010.
[143] L. Rabiner. A tutorial on Hidden Markov Models and selected applications in speechrecognition. Proceedings of the IEEE, 77:257286, 1989.
[144] T. A. Rawlings, T. M. Collins, and R. Bieler. Changing identities: tRNA duplica-tion and remolding within animal mitochondrial genomes. Proc. Acad. Natl. USA,100:15700–15705, 2003.
[145] M. Rederstorff, S. H. Bernhart, A. Tanzer, M. Zywicki, K. Perfler, M. Lukasser, I. L.Hofacker, and A. Huttenhofer. RNPomics: Defining the ncRNA transcriptome bycDNA library generation from ribonucleo-protein particles. Nucleic Acids Res, Feb2010.
[146] E. Rocha. Codon usage bias from tRNA’s point of view: Redundancy, specialization,and efficient decoding for translation optimization. Genomes Res., 14:2279–2286,2004.
[147] S. Rodin, Ohno. S., and A. Rodin. Transfer RNAs with complementary anticodons:could they reflect early evolution of discriminative genetic code adaptors? Proc. Natl.
Acad. Sci. USA, 90:4723–4727, 1993.
[148] T. S. Rozhdestvensky, A. M. Kopylov, J. Brosius, and A. Huttenhofer. Neuronal BC1RNA structure: evolutionary conversion of a tRNA(Ala) domain into an extendedstem-loop structure. RNA, 7:722–730, 2001.
[149] F. Sanger, G.M. Air, B. Barrell, N. L. Brown, A. R. Coulson, J.C. Fiddes, C. A.Hutchison, P. M. Slocombe, and M. Smith. Nucleotide sequence of bacteriophagephi-x174 DNA. Nature, 265:687–695, 1977.
87
BIBLIOGRAPHY
[150] F. Sanger, S. Nicklen, and A.R. Coulson. DNA sequencing with chain-terminatinginhibitors. PNAS, 74:5463 – 5467, 1977.
[151] A. A. Saraiya and C. C. Wang. snoRNA, a novel precursor of microRNA in Giardialamblia. PLoS Pathog., 4:e1000224, Nov 2008.
[152] P. Schimmel, R. Giege, D. Moras, and S. Yokoyama. An operational RNA code foramino acids and possible relationship to genetic code. Proc Natl Acad Sci U S A,90(19):8763–8, 1993.
[153] S.C. Schuster. Next-generation sequencing transforms todays biology. Nature meth-
ods, 5(1):16–18, 2008.
[154] H. Shaheen, R. Horetsky, S. Kimball, A. Murthi, L. Jefferson, and A. Hopper. Ret-rograde nuclear accumulation of cytoplasmic tRNA in rat hepatoma cells in responseto amino acid deprivation. Proc Natl Acad Sci USA, 104(21):8845–8850, 2007.
[155] J. Shendure, G. Porreca, N. Reppas, X. Lin, J.P. McCutcheon, A. Rosenbaum,M. Wang, K. Zhang, R. Mitra, and G. Church. Accurate multiplex polony sequencingof an evolved bacterial genome. Science, 309(5741):1728–32, 2005.
[156] K Sheppard, P M Akochy, and D. Soll. Assays for transfer RNA-dependent aminoacid biosynthesis. Methods, 44:139–145, 2008.
[157] W. Shi, D. Hendrix, M. Levine, and B. Haley. A distinct class of small RNAs arisesfrom pre-miRNA-proximal regions in a simple chordate. Nat. Struct. Mol. Biol.,16:183–189, Feb 2009.
[158] W. Shi, D. Hendrix, M. Levine, and B. Haley. A distinct class of small RNAs arisesfrom pre-miRNA-proximal regions in a simple chordate. Nat Struct Mol Biol., 16:183–189, 2009.
[159] A. F. A. Smit, R. Hubley, and P. Green. RepeatMasker. version, open-3.2.5 [RMLib:20080611], http://www.repeatmasker.org/.
[160] M.S. Smith.T.F., Waterman and W.M. Fitch. Comparative biosequence metrics. J.
Mol. Biol, 18, 1981.
[161] L D Spotila, H Hirai, D M Rekosh, and P T Lo Verde. A retroposon-like short repet-itive DNA element in the genome of the human blood fluke, Schistosoma mansoni.Chromosoma, 97:421–428, 1989.
[162] P. F. Stadler, J. J. Chen, J. Hackermuller, S. Hoffmann, F. Horn, P. Khaitovich,A. K. Kretzschmar, A. Mosig, S. J. Prohaska, X. Qi, K. Schutt, and K. Ullmann.Evolution of vault RNAs. Mol. Biol. Evol., 26:1975–1991, Sep 2009.
[163] A. Stark, N. Bushati, C. H. Jan, P. Kheradpour, E. Hodges, J. Brennecke, D. P.Bartel, S. M. Cohen, and M. Kellis. A single Hox locus in Drosophila producesfunctional microRNAs from opposite DNA strands. Genes Dev., 22:8–13, Jan 2008.
88
BIBLIOGRAPHY
[164] S. Steinberg, A. Misch, and M. Sprinzl. Compilation of trna sequences and sequencesof trna genes. Nucl. Acids Res, 21:3011–3015, 1993.
[165] R. Strausberg and S. Levy. Promoting transcriptome diversity. Genome Res,17(7):965–8, 2007.
[166] J Sugahara, K Kikuta, K Fujishima, N Yachie, M Tomita, and A. Kanai. Compre-hensive analysis of archaeal tRNA genes reveals rapid increase of tRNA introns in theorder thermoproteales. Mol Biol Evol., 25:2709–2716, 2008.
[167] F. J. Sun, S. Fleurdepine, C. Bousquet-Antonelli, G. Caetano-Anolles, and J. M.Deragon. Common evolutionary trends for SINE RNA structures. Trends Genet.,23:26–33, 2007.
[168] R. Suzuki and H. Shimodaira. pvclust: An R package for hierarchical clustering withp-values. http://www.is.titech.ac.jp/∼shimo/prog/pvclust/.
[169] R. J. Taft, E. A. Glazov, N. Cloonan, C. Simons, S. Stephen, G. J. Faulkner,T. Lassmann, A. R. Forrest, S. M. Grimmond, K. Schroder, K. Irvine, T. Arakawa,M. Nakamura, A. Kubosaki, K. Hayashida, C. Kawazu, M. Murata, H. Nishiyori,S. Fukuda, J. Kawai, C. O. Daub, D. A. Hume, H. Suzuki, V. Orlando, P. Carninci,Y. Hayashizaki, and J. S. Mattick. Tiny RNAs associated with transcription startsites in animals. Nat. Genet., 41:572–578, May 2009.
[170] R. J. Taft, E. A. Glazov, T. Lassmann, Y. Hayashizaki, P. Carninci, and J. S. Mattick.Small RNAs derived from snoRNAs. RNA, 15:1233–1240, Jul 2009.
[171] R. J. Taft, C. D. Kaplan, C. Simons, and J. S. Mattick. Evolution, biogenesis andfunction of promoter-associated RNAs. Cell Cycle, 8:2332–2338, Aug 2009.
[172] A. Takashi, I. Toshimichi, O. Yasuo, U. Hiroshi, K. Makoto, K. Shigehiko, Y. Yuko,M. Akira, and I. Hachiro. tRNADB-CE: tRNA gene database curated manually byexperts. Nucleic Acids Res., 37:D163–D168, 2009.
[173] P. B. Talbert and S. Henikoff. Chromatin-based transcriptional punctuation. Genes
Dev., 23:1037–1041, 2009.
[174] K Tamura, S Subramanian, and S Kumar. Temporal patterns of fruit fly (drosophila)evolution revealed by mutation clocks. Mol Biol Evol, 21(1):36–44, Jan 2004.
[175] H. Tang, J. Bowers, X. Wang, R. Ming, M. Alam, and A. Paterson. Synteny andcollinearity in plant genomes. Science, 320(5875):486–8, 2008.
[176] A. Tanzer, M. Riester, J. Hertel, C.I Bermudez-Santana, J. Gorodkin, I. Hofacker,and P.F. Stadler. Evolutionary Genomics. John Wiley & Sons, 2010.
[177] B. Tawari, I. K. Ali, C. Scott, M. A. Quail, M. Berriman, N. Hall, and C. G. Clark.Patterns of evolution in the unique tRNA gene arrays of the genus Entamoeba. Mol.
Biol. Evol., 25:187–198, 2008.
89
BIBLIOGRAPHY
[178] D. M. Thompson, C. Lu, P. J. Green, and R. Parker. tRNA cleavage is a conservedresponse to oxidative stress in eukaryotes. RNA, 14:2095–2103, Oct 2008.
[179] D. M. Thompson and R. Parker. The RNase Rny1p cleaves tRNAs and promotes celldeath during oxidative stress in Saccharomyces cerevisiae. J. Cell Biol., 185:43–50,Apr 2009.
[180] D.M. Thompson and R. Parker. Stressing Out over tRNA Cleavage. Cell, 138:215–219, 2009.
[181] D. M. Tyler, K. Okamura, W. J. Chung, J. W. Hagen, E. Berezikov, G. J. Han-non, and E. C. Lai. Functionally distinct regulatory RNAs generated by bidirectionaltranscription and processing of microRNA loci. Genes Dev., 22:26–36, Jan 2008.
[182] G. Vivo-Truyols, J. R. Torres-Lapasio, A. M. van Nederkassel, Y. Vander Heyden,and D. L. Massart. Automatic program for peak detection and deconvolution ofmulti-overlapped chromatographic signals: Part II: Peak model and deconvolutionalgorithms. J. Chromatography A, 1096:146–155, 2005.
[183] J. N. Volff and J. Brosius. Modern genomes with retro-look: retrotransposed ele-ments, retroposition and the origin of new genes. Genome Dyn., 3:175–190, 2007.
[184] X. Wang, H. Jia, E. Jankowsky, and J. T. Anderson. Degradation of hypomodifiedtRNA(iMet) in vivo involves RNA-dependent ATPase activity of the DExH helicaseMtr4p. RNA, 14:107–116, Jan 2008.
[185] Z. Wang, M. Gerstein, and M. Snyder. RNA-Seq: a revolutionary tool for transcrip-tomics. Nat Rev Genet, 10(1):57–63, 2009.
[186] F. Wei, S. Li, and H. R Ma. Computer simulation of tRNA evolution. J. Phys. A:
Math. Theor., 42:345101, 2009.
[187] M. Withers, L. Wernisch, and M. dos Reis. Archaeology and evolution of transferRNA genes in the Escherichia coli genome. RNA, 12:933–942, 2006.
[188] I. Witten and E. Frank. Data Mining: practical machine learning tools and techniques.Morgan Kaufmann publications, 2005.
[189] S. Wolin and A.G. Matera. The trials and travels of tRNA. Gene. Deve., 13:1–10,1999.
[190] S. Yamasaki, P. Ivanov, G-F. Hu, and A. Anderson. Angiogenin cleaves tRNA andpromotes stress-induced translational repression. J Cell Biol, 185(1):35–42, 2009.
[191] Q. Zhao, O. Caballero, S. Levy, B. Stevenson, C. Iseli, S. de Souza, P. Galante,D. Busam, M. Leversha, K. Chadalavada, Y. Rogers, J. Venter, A. Simpson, andR. Strausberg. Transcriptome-guided characterization of genomic rearrangements ina breast cancer cell line. Proc Natl Acad Sci U S A, 106(6):1886–91, 2009.
90
BIBLIOGRAPHY
[192] T. Zhao, G. Li, S. Mi, S. Li, G. Hannon, X. Wang, and Y. Qi. A complex systemof small RNAs in the unicellular green alga Chlamydomonas reinhardtii. Genes Dev,21(10):1190–203, 2007.
91

BIBLIOGRAPHY
92
BIBLIOGRAPHY
Curriculum Vitae
Personal Information
Name Clara Isabel Bermudez SantanaAddress Ritterstr. 12, 04109 LeipzigEmail [email protected] and place of birth 11.06.1973, Chiquinquira, ColombiaNationality ColombianMarital status Married06/2000-02/2001 Maternity leave
High school Education
02/1984-12/1989 Liceo Femenino de Cundinamarca, Bogota, Colombia
University Studies
02/1990-08/1997 Biology, National University of Colombia, Bogota, ColombiaDiplom: BiologyDiplom work: A model to characterize the secondary structure oftRNA isoaceptors of Escherichia coli by using graph theory”. Au-gust, 1, 1997.
02/2001-04/2004 Magister Scientiae, National University of Colombia, Bogota,ColombiaDiplom : Magister ScientiaeMagister work : A model to establish structure-biological func-tion correlations based on a tRNA characterization model, April14, 2004.
since 10/2006 Ph.D. scholarship holder from DAAD-Alecol program.Leipzig University, Bioinformatics group.
93
BIBLIOGRAPHY
Job experience
Since 01/2006 Ternured Assistant Professor.01/2005-12/2005 Assistant Professor.
Department of Biology, National University of Colombia, Bogota.
06/2004-12/2004 Adjunct scientist: Evolutive Biology and Molecular Biology Groupand the Theoretical Chemistry Group, Faculty of Science, Univer-sidad Nacional de Colombia. Research project :“Molecular descrip-
tors to model tRNAs based on quantum and graph theoretical ap-
proaches ”. Grant: Colciencias.
01/2002-06/2004 Adjunct scientist: Evolutive Biology and Molecular Biology Groupand the Theoretical Chemistry Group, Faculty of Science, Univer-sidad Nacional de Colombia. Research project: “tRNA structure
model”
01/1999-12/2001 Adjunct scientist: Evolutive Biology and Molecular Biology Groupand the Theoretical Chemistry Group, Faculty of Science, Univer-sidad Nacional de Colombia. Research project: Characterization of
tRNAs of different organisms using a theoretical model of weighted
graphs. Grant: Banco de la Republica of Colombia and DIB.Publications of Thesis
• Bermudez-Santana, C., Stephan-Otto, C., Kirsten, T., Engelhardt, J. Prohaska, S.,Steigele, S., Stadler, P.F. (2010). Genomic Organization of Eukaryotic tRNAs. BMCGenomics. In press.
• Tanzer, T., Riester, M., Hertel, J., Bermudez-Santana, C, Gorodkin, J. Hofacker, I.Stadler. P.F. Evolutionary Genomics and Systems Biology: Chapter: Evolutionary genomics
of microRNAs and their relatives. ISBN: 978-0-470-19514-7, March 2010, Wiley-Blackwell
• Marz, M., Tafer, H., Hertel,J., Bartschat, S., Kehr, S., Rose, D., Otto, W., Donath,A., Tanzer, A., Bermudez-Santana, C., Gruber, A., Juhling, F., Engelhardt, J., Busch,A., Stadler, P.F., Dieterich, C. (2010). Comparative Analysis of Non-Coding RNAs inNemathodes Submitted.
• Langenberger D, Bermudez-Santana, C, Stadler, P. F. Hoffmann, S. (2010). Identifica-tion and classification of small RNAs in transcriptome sequence data. Pacific Symposiumon Biocomputing 15:81-87.
• Langenberger D,Bermudez-Santana C, Hertel J, Hoffmann S, Khaitovitch P, Stadler PF:(2009). Evidence for Human microRNA-Offset RNAs in Small RNA Sequencing Data”,Bioinformatics, doi:10.1093/bioinformatics/btp419. 25(18):2298-2301.
• Copeland, C., Marz, M., Rose, D., Hertel, J., Brindley, P., Bermudez-Santana, C., Kehr,S., Stephan-Otto, C., Stadler, P. F. (2009).Homology-Based Annotation of Non-codingRNAs in the Genomes of Schistosoma mansoni and Schistosoma japonicum. BMC Ge-nomics, 10:464:1-13.
94
BIBLIOGRAPHY
Publications: Other contributions
• Galindo, J.F. Bermudez, C., Daza. E.E. tRNA Chemical Structure from a Quantum andGraph Theoretical Perspective, 2006. J. Theor. Biol. Volume 240: 4, 574-582.
• Galindo, J.F., Bermudez, C., Daza E.E. A classification of central nucleotides induced by
the influence of neighboring nucleotides in triplets. Journal of Molecular Structure. 2006,J. of Mol. Struct. THEOCHEM. Volume 769:1-3, 103-109.
• Bermudez, C., Daza, E.E., Andrade. E. Characterization and Comparison of Escherichia
coli transfer RNAs by graph theory based on secondary structure. Journal of TheoreticalBiology, 1999, Vol. 197: 193–205
Talks
• Convention 23th TBI Winter-seminar- Computational Mathematics and Theoretical Biologyin Bled, Slovenia, 14/02/2010-21/02/2010. Talk:“ Searching tRNA processing patterns in
transcriptome sequencing data.
• Herbstseminar Bioinformatik 2009 Vysoka Lipa (Decin), Czech Republic. 21/10/2009-25/10/2009. Talk: “tRNA pair arrangements”.
• Herbstseminar Bioinformatik 2007. Studeny, Czech Republic. 27/10/2007-31/10/2007.Talk: “Patterns of mir916 in Chlamydomonas reinhardtii”.
• Convention 23th TBI Winter-seminar- Computational Mathematics and Theoretical Biol-ogy in Bled, Slovenia, 17/02/2008-24/02/2008. . Talk :“Configurations of tRNA pair
arrangements”.
• Convention 22th TBI Winter-seminar- Computational Mathematics and Theoretical Biologyin Bled, Slovenia, 18/02/2007-24/02/2007. Talk: “Doctorate Project”.
Posters
2010 At the 14th International Conference on Research in Computational Molecular Biology(RECOMB 2010), August. Lisboa, Portugal. Searching tRNA processing patterns in tran-scriptome sequencing data. Bermudez-Santana, C., Langenberger, D., Hoffmann, S.,Stadler, P.F.
2009 At German Conference of Bioinformatic 2009, Halle, Germany, Sept. 28-30. tRNA Clus-ters. Bermudez-Santana, C., Stephan-Otto, C., Kirsten, T., Prohaska, S., Steigele, S.,Engelhardt, J., Stadler, P.F.
2009 At German Conference of Bioinformatic 2009, Halle, Germany, Sept. 28-30. Classificationand Identification of Non-coding RNAs using High Throughput Sequencing Data, Langen-berger, D., Hoffmann, S., Bermudez-Santana, C., Stadler, P.F.
2006 Seminar of advanced studies in molecular design”, SEADIN. January 16 to 20, La Habana,Cuba. A structure–activity relation of the tRNAAla acceptor stem based on the chargedistribution. Marin, R.M, C.I. Bermudez, C., Daza, E.E.
95
BIBLIOGRAPHY
2005 XXXI congress of theoretician chemists of latin expression, 2005. Islas Margaritas, Venezuela.Structure–activity correlations of the tRNAAla acceptor stem by a quantum chemical char-acterization. Marin, R., Bermudez, C., Daza, E.E.
2005 XXXI congress of theoretician chemists of latin expression, QUITEL, 2005. Islas Margaritas,Venezuela. Anticodons classification by an isoprotonic set. Galindo, J.F., Bermudez, C.,Daza, E.E.
2005 XXXI congress of theoretician chemists of latin expression, QUITEL, 2005. Islas Margaritas,Venezuela. tRNA Structure from a Graph and Quantum Theoretical Perspective. Galindo,J.F., Bermudez, C., Daza. E.E..
1997 7th International conference on mathematical Chemistry and 3rd Girona seminar molecularSimilarity University of Girona, Girona (Spain), May 26-31 1997. Graph Modelling of tRNAisoaceptor molecules Bermudez, C., Andrade, E. , Daza, E.E.
Awards
2006 Awared with a scholarship at Colombian DAAD-Alecol programcontest.
2004 Magister Scientiae work: with Honors1999 2nd prize: Best Undergraduate works. National University of
Colombia1997 Diplom work in Biology: with Honors.
Other courses
02/99-07/99 Set Theory and Topology.Mathemathics Department, National University of Colombia.
11/97-12/97 Local training seminar on multivaried statistical methods with ap-plications in human and social sciences.Programme de recherche et d’enseignement en statisque applique,Laboratoire de methodologie du traitemet des Donnes, Bruxelles-Belgique, Universite Libre de Bruxelles, Department of Mathemat-ics, Faculty of Science, Universidad Nacional de Colombia,
04/96-05/96 Mathematics for graduate students.Department of Mathematics, Faculty of Science, Universidad Na-cional de Colombia. Colombia.
Communication skills
10/06-03/07 German Language Course. InterdaF at Herder Institute, LeipzigUniversity.
1999 Certificate of achievement in English language. Colombian-American Center, Bogota, Colombia.
Languages
Perl, LaTeX, PSTricks and HTML.Fundaments in ANSI C, PHP, Postscript and MySQL.
Spanish, English and German (Fundaments).
96

BIBLIOGRAPHY
97
Selbstandigkeitserklarung
Hiermit erklare ich, die vorliegende Dissertation selbstandig und ohne unzulassige fremde Hilfeangefertigt zu haben. Ich habe keine anderen als die angefuhrten Quellen und Hilfsmittel benutztund samtliche Textstellen, die wortlich oder sinngemaß aus veroffentlichten oder unveroffentlichtenSchriften entnommen wurden, und alle Angaben, die auf mundlichen Auskunften beruhen, alssolche kenntlich gemacht. Ebenfalls sind alle von anderen Personen bereitgestellten Materialienoder Dienstleistungen als solche gekennzeichnet.
Clara Isabel Bermudez Santana
Leipzig, 13. September 2010


![1 Inferring patterns of folktale diffusion using genomic ...€¦ · 3 distinct “international tale types” distributed among more than 200 cultures [22]. Each international 4](https://img.pdfslide.us/doc/110x75/605dfb403cfb0d21e353385b/1-inferring-patterns-of-folktale-diffusion-using-genomic-3-distinct-aoeinternational.jpg)