Embed Size (px)
Citation preview
Navigation and Ancillary Information Facility
Trivial Exampleof Using WebGeocalc
(WGC)
Computing Distances Between Objects
March 2018
SPICE components and services are not restricted under ITAR and EAR regulations
Navigation and Ancillary Information Facility
WebGeocalc Overview
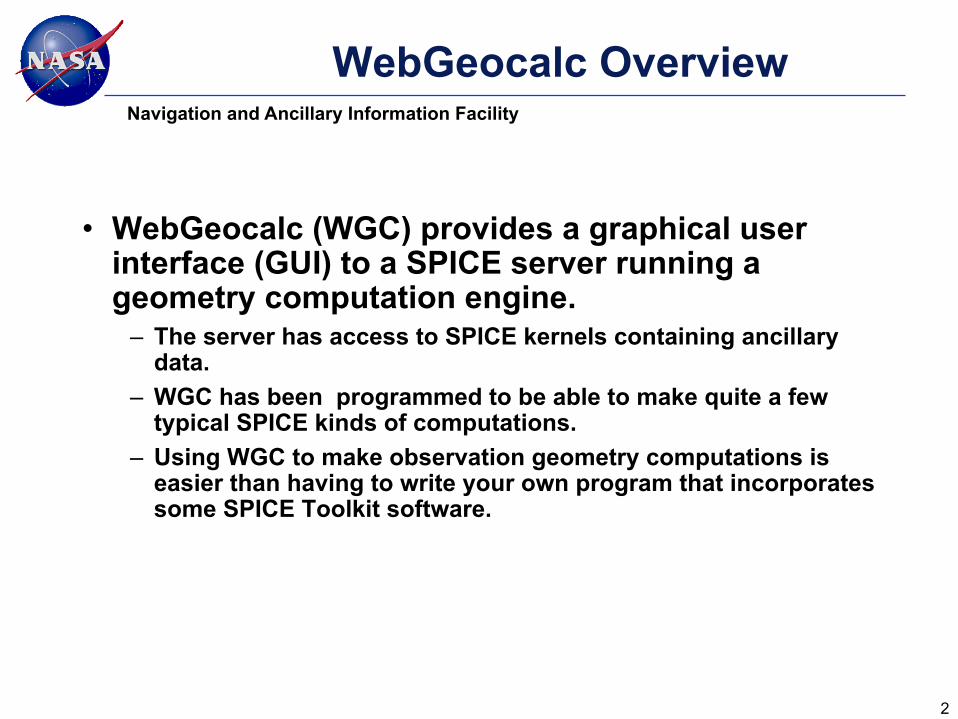
• WebGeocalc (WGC) provides a graphical user interface (GUI) to a SPICE server running a geometry computation engine.– The server has access to SPICE kernels containing ancillary
data.– WGC has been programmed to be able to make quite a few
typical SPICE kinds of computations.– Using WGC to make observation geometry computations is
easier than having to write your own program that incorporates some SPICE Toolkit software.
2
Navigation and Ancillary Information Facility
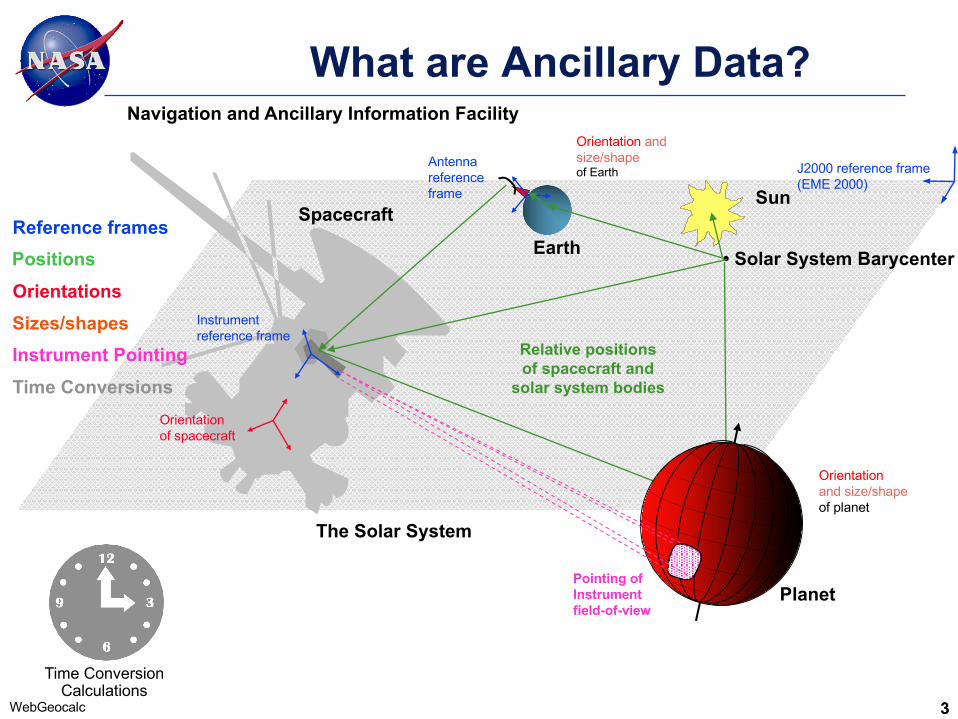
What are Ancillary Data?
33WebGeocalc
Spacecraft
Planet
Earth
Sun
• Solar System Barycenter
Time ConversionCalculations
Time Conversions
Instrumentreference frame
Antennareferenceframe
J2000 reference frame(EME 2000)
Reference frames
Orientation and size/shapeof planet
Orientation and size/shapeof Earth
Sizes/shapesRelative positionsof spacecraft and
solar system bodies
Positions
Orientations
Pointing ofInstrumentfield-of-view
Instrument Pointing
The Solar System
Orientationof spacecraft
Navigation and Ancillary Information Facility
Architecture
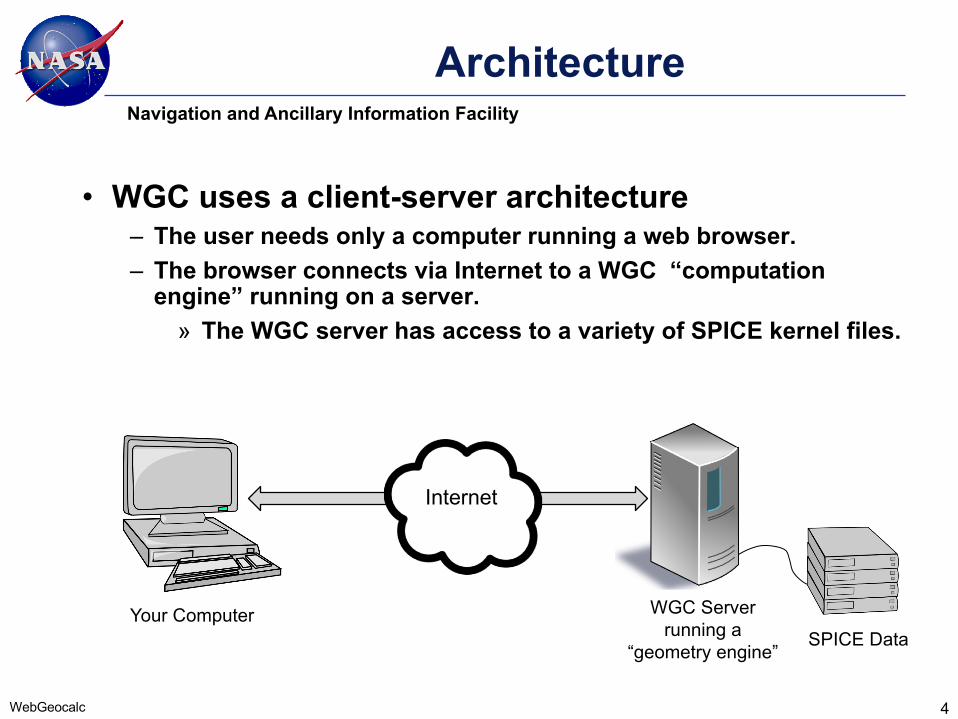
• WGC uses a client-server architecture– The user needs only a computer running a web browser.– The browser connects via Internet to a WGC “computation
engine” running on a server.» The WGC server has access to a variety of SPICE kernel files.
4
SPICE DataYour Computer
Internet
WebGeocalc
WGC Serverrunning a
“geometry engine”
Navigation and Ancillary Information Facility
Using WebGeocalc
• WGC makes it “easy” to do many kinds of SPICE computations.– You need not write a program using SPICE Toolkit software.
– Instead, open a web browser and use standard GUI widgets to:
» read a variety of HELP statements (if just learning to use WGC)
» select the computation desired
» select the data to be used in your computation
» specify the computation details
» press the “CALCULATE” button
– Your results, possibly including some plots, appear in your browser window.
5WebGeocalc
Navigation and Ancillary Information Facility
A Very Simple Example
• We’ll compute the distance between two “ephemeris objects” over a time range.– One of the objects will be designated as the ”target” and the
other object as the “observer.”
• If you’ve read a bit about SPICE, you’ll know that in SPICE terminology an “ephemeris object” is anything whose position & velocity are provided using a SPICE-style ephemeris–a SPICE SPK file.– Examples: planets, satellites, spacecraft
– You can read about ephemeris objects and SPK files here:» http://naif.jpl.nasa.gov/pub/naif/toolkit_docs/Tutorials/pdf/individual_docs/1
8_spk.pdf
6
Navigation and Ancillary Information Facility
Possible Differences
• Your results could differ somewhat from those shown in this presentation if:– the planet ephemeris used in the “solar_system_kernels” data
set currently used by WebGeocalc (WGC) is different from the one used when this example was produced
– new leap seconds have been declared and the leapseconds kernel used in the “solar_system_kernels” data set has been updated as compared to the one used when this example was produced
– a future upgrade of the WGC server’s math libraries results in round off of a last digit differently as compared to the round offs made when this example was produced
7
Navigation and Ancillary Information Facility
Your Problem Statement
• You wonder what is the range from Earth to Jupiter in the period Jan 01, 2015 to Jan 01, 2020?
8
Navigation and Ancillary Information Facility
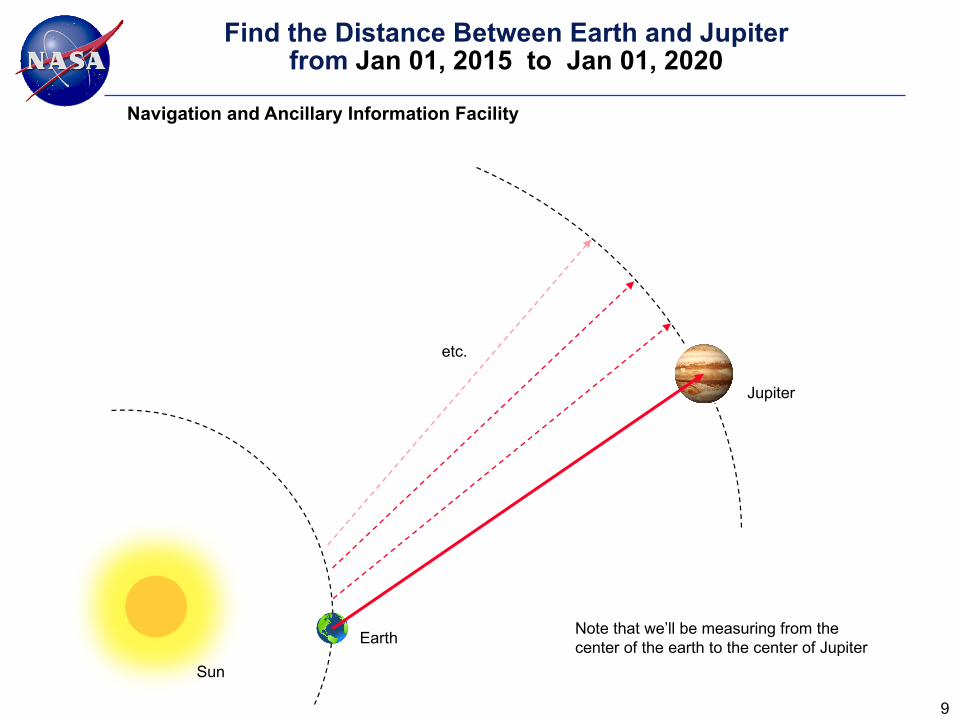
Find the Distance Between Earth and Jupiterfrom Jan 01, 2015 to Jan 01, 2020
9
etc.
Note that we’ll be measuring from the center of the earth to the center of Jupiter
Jupiter
Sun
Earth
Navigation and Ancillary Information Facility
Before Diving In…
• The “About the Data” link available on the WGC pages
(upper-right corner) contains very important information
about the data available to WGC. It’s a bit long but be sure
to read this!
– “About the Data” also links to a WGC tutorial, and to a glossary of terms.
• If you are new to using SPICE, some of the on-line SPICE
tutorials might be helpful, especially:
» Conventions
» Time
» SPK
» Geometry finder
– These and many other SPICE tutorials are found here:
» http://naif.jpl.nasa.gov/naif/tutorials.html
– Keep these in mind if you get stymied.
10
Navigation and Ancillary Information Facility
Getting Started
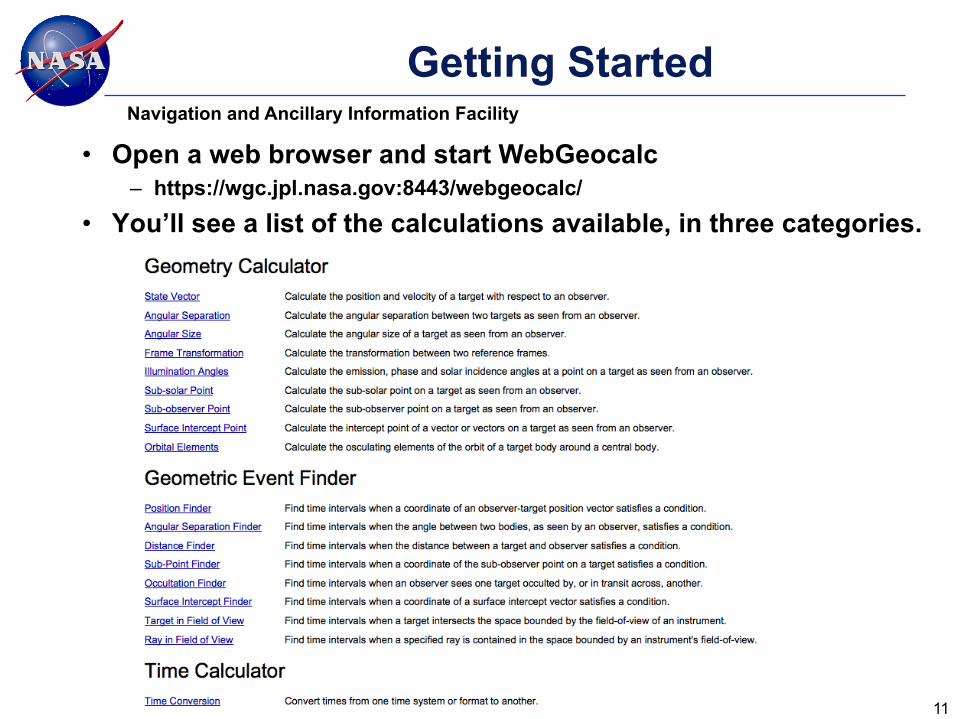
• Open a web browser and start WebGeocalc
– https://wgc.jpl.nasa.gov:8443/webgeocalc/
• You’ll see a list of the calculations available, in three categories.
11
Navigation and Ancillary Information Facility
Getting Started
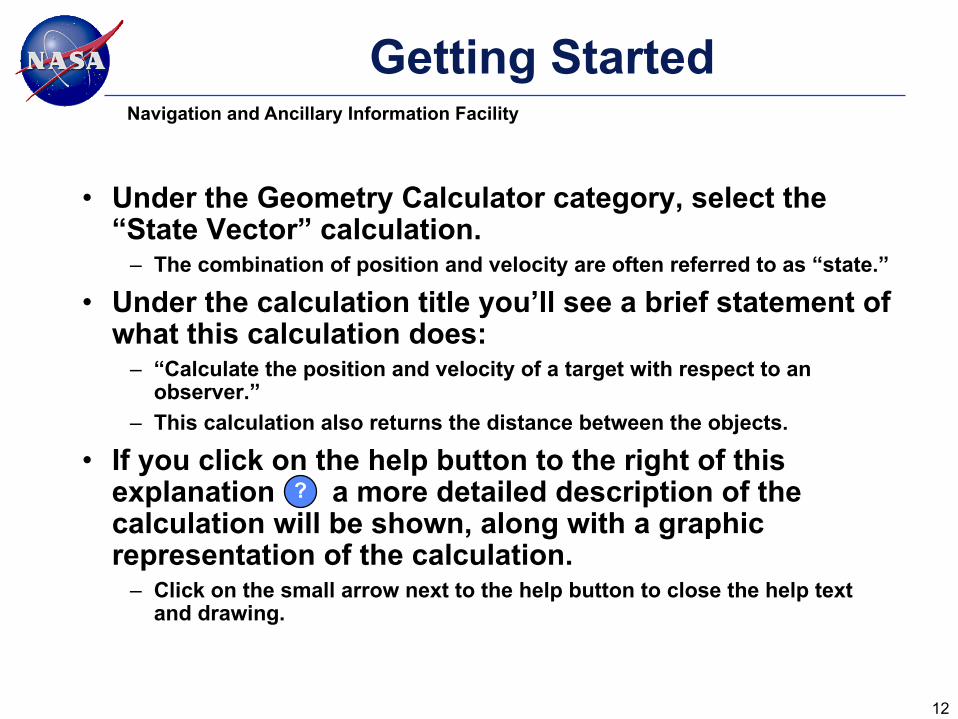
• Under the Geometry Calculator category, select the “State Vector” calculation.– The combination of position and velocity are often referred to as “state.”
• Under the calculation title you’ll see a brief statement of what this calculation does:– “Calculate the position and velocity of a target with respect to an
observer.”– This calculation also returns the distance between the objects.
• If you click on the help button to the right of this explanation a more detailed description of the calculation will be shown, along with a graphic representation of the calculation.– Click on the small arrow next to the help button to close the help text
and drawing.
12
?
Navigation and Ancillary Information Facility
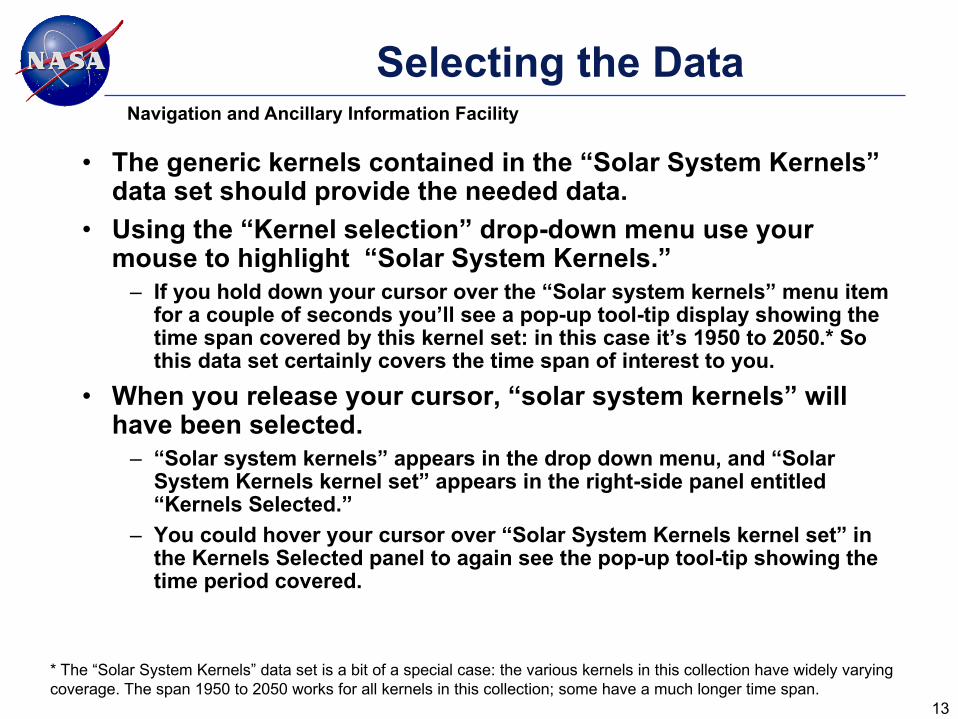
Selecting the Data
• The generic kernels contained in the “Solar System Kernels” data set should provide the needed data.
• Using the “Kernel selection” drop-down menu use your mouse to highlight “Solar System Kernels.”
– If you hold down your cursor over the “Solar system kernels” menu item for a couple of seconds you’ll see a pop-up tool-tip display showing the time span covered by this kernel set: in this case it’s 1950 to 2050.* So this data set certainly covers the time span of interest to you.
• When you release your cursor, “solar system kernels” will have been selected.
– “Solar system kernels” appears in the drop down menu, and “Solar System Kernels kernel set” appears in the right-side panel entitled “Kernels Selected.”
– You could hover your cursor over “Solar System Kernels kernel set” in the Kernels Selected panel to again see the pop-up tool-tip showing the time period covered.
13
* The “Solar System Kernels” data set is a bit of a special case: the various kernels in this collection have widely varying coverage. The span 1950 to 2050 works for all kernels in this collection; some have a much longer time span.
Navigation and Ancillary Information Facility
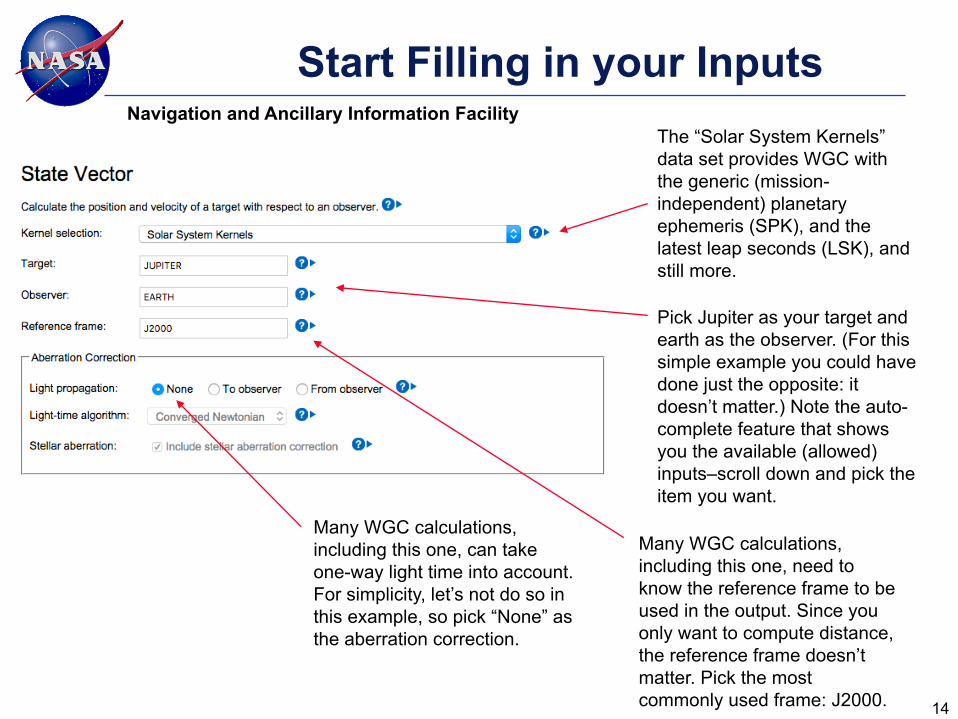
Start Filling in your Inputs
14
The “Solar System Kernels” data set provides WGC with the generic (mission-independent) planetary ephemeris (SPK), and the latest leap seconds (LSK), and still more.
Pick Jupiter as your target and earth as the observer. (For this simple example you could have done just the opposite: it doesn’t matter.) Note the auto-complete feature that shows you the available (allowed) inputs–scroll down and pick the item you want.
Many WGC calculations, including this one, need to know the reference frame to be used in the output. Since you only want to compute distance, the reference frame doesn’t matter. Pick the most commonly used frame: J2000.
Many WGC calculations, including this one, can take one-way light time into account. For simplicity, let’s not do so in this example, so pick “None” as the aberration correction.
Navigation and Ancillary Information Facility
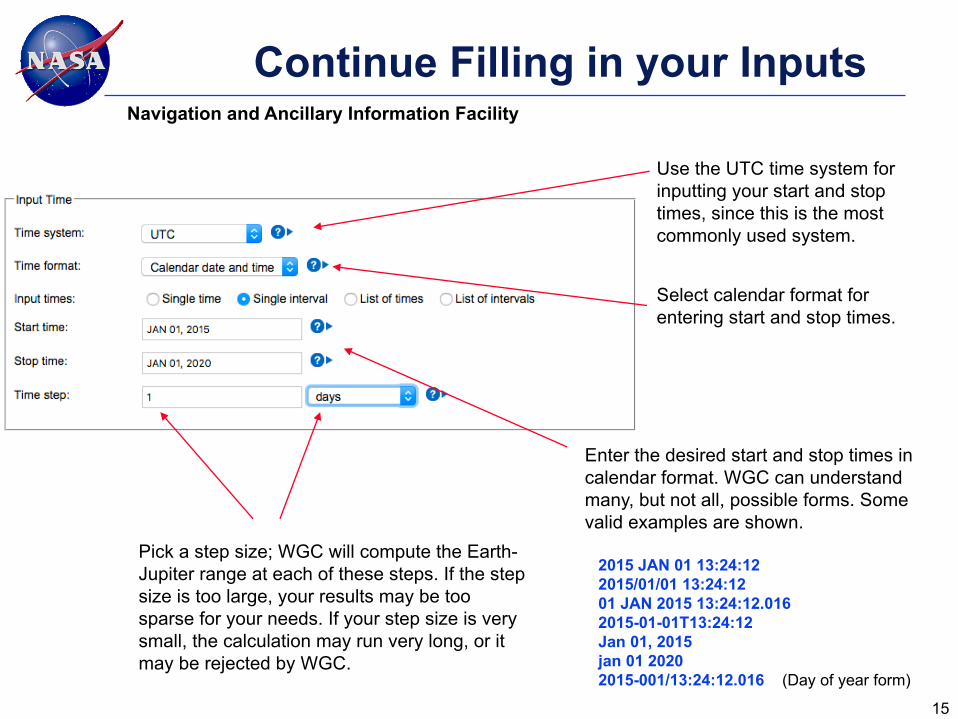
Continue Filling in your Inputs
15
Use the UTC time system forinputting your start and stoptimes, since this is the mostcommonly used system.
Select calendar format for entering start and stop times.
Enter the desired start and stop times in calendar format. WGC can understand many, but not all, possible forms. Some valid examples are shown.
2015 JAN 01 13:24:122015/01/01 13:24:1201 JAN 2015 13:24:12.0162015-01-01T13:24:12Jan 01, 2015jan 01 20202015-001/13:24:12.016 (Day of year form)
Pick a step size; WGC will compute the Earth-Jupiter range at each of these steps. If the step size is too large, your results may be too sparse for your needs. If your step size is very small, the calculation may run very long, or it may be rejected by WGC.
Navigation and Ancillary Information Facility
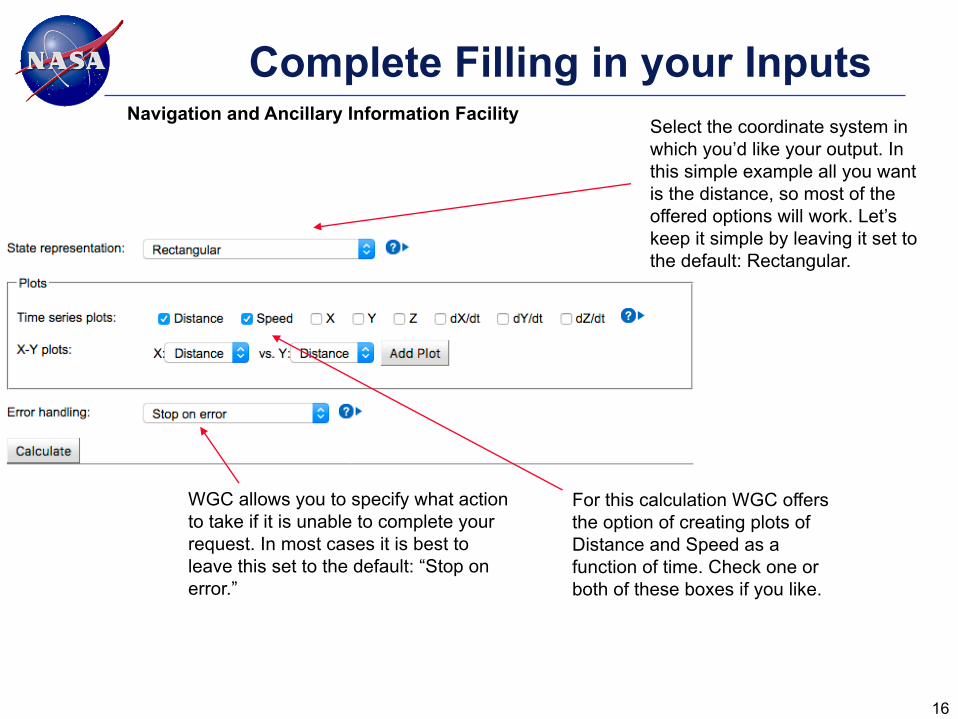
Complete Filling in your Inputs
16
Select the coordinate system in which you’d like your output. In this simple example all you want is the distance, so most of the offered options will work. Let’s keep it simple by leaving it set to the default: Rectangular.
For this calculation WGC offers the option of creating plots of Distance and Speed as a function of time. Check one or both of these boxes if you like.
WGC allows you to specify what action to take if it is unable to complete your request. In most cases it is best to leave this set to the default: “Stop on error.”
Navigation and Ancillary Information Facility
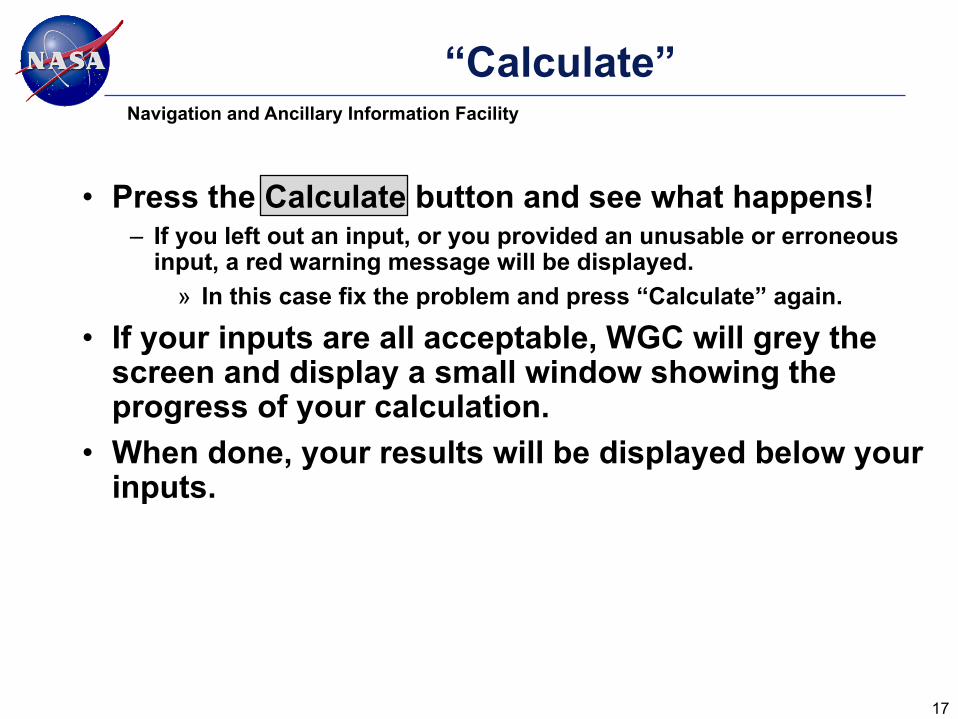
“Calculate”
• Press the Calculate button and see what happens!– If you left out an input, or you provided an unusable or erroneous
input, a red warning message will be displayed.» In this case fix the problem and press “Calculate” again.
• If your inputs are all acceptable, WGC will grey the screen and display a small window showing the progress of your calculation.
• When done, your results will be displayed below your inputs.
17
Navigation and Ancillary Information Facility
Your Results
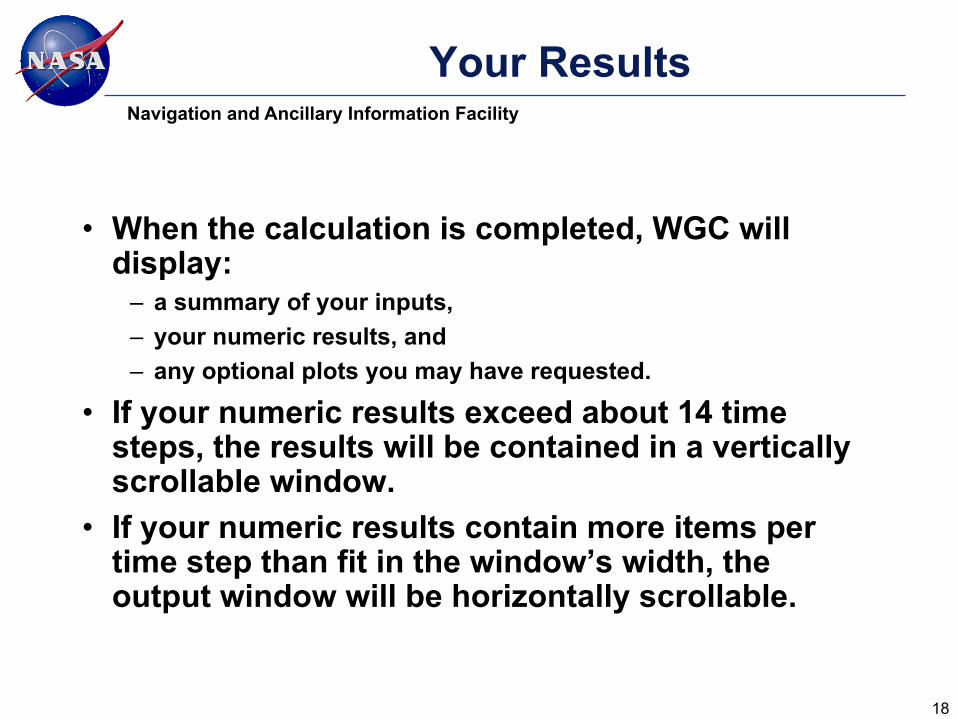
• When the calculation is completed, WGC will display:– a summary of your inputs,
– your numeric results, and
– any optional plots you may have requested.
• If your numeric results exceed about 14 time steps, the results will be contained in a vertically scrollable window.
• If your numeric results contain more items pertime step than fit in the window’s width, theoutput window will be horizontally scrollable.
18
Navigation and Ancillary Information Facility
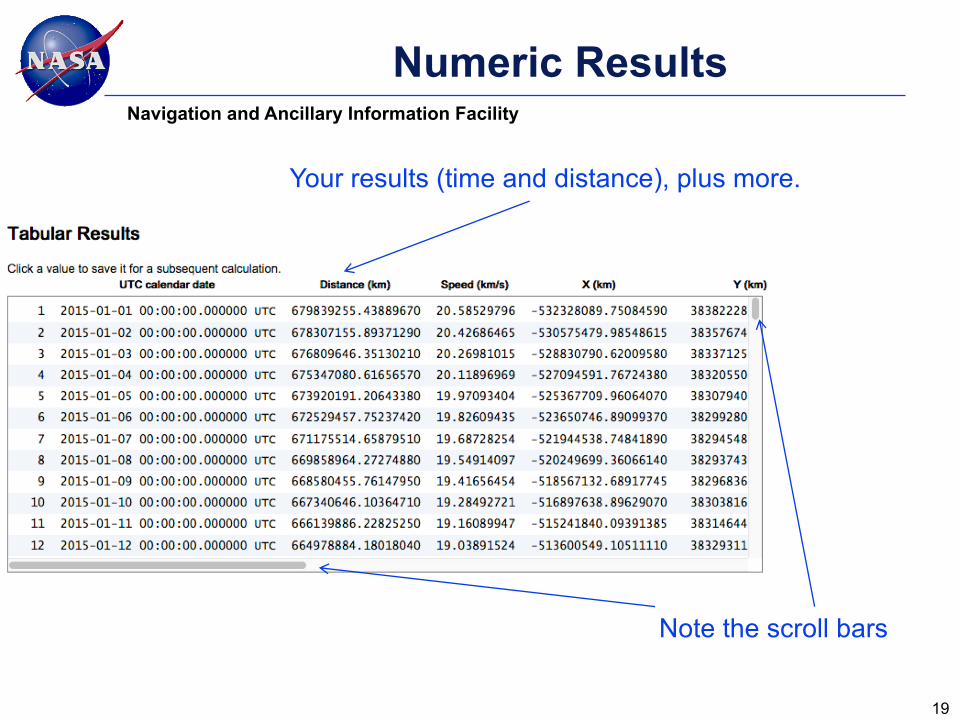
Numeric Results
19
Note the scroll bars
Your results (time and distance), plus more.
Navigation and Ancillary Information Facility
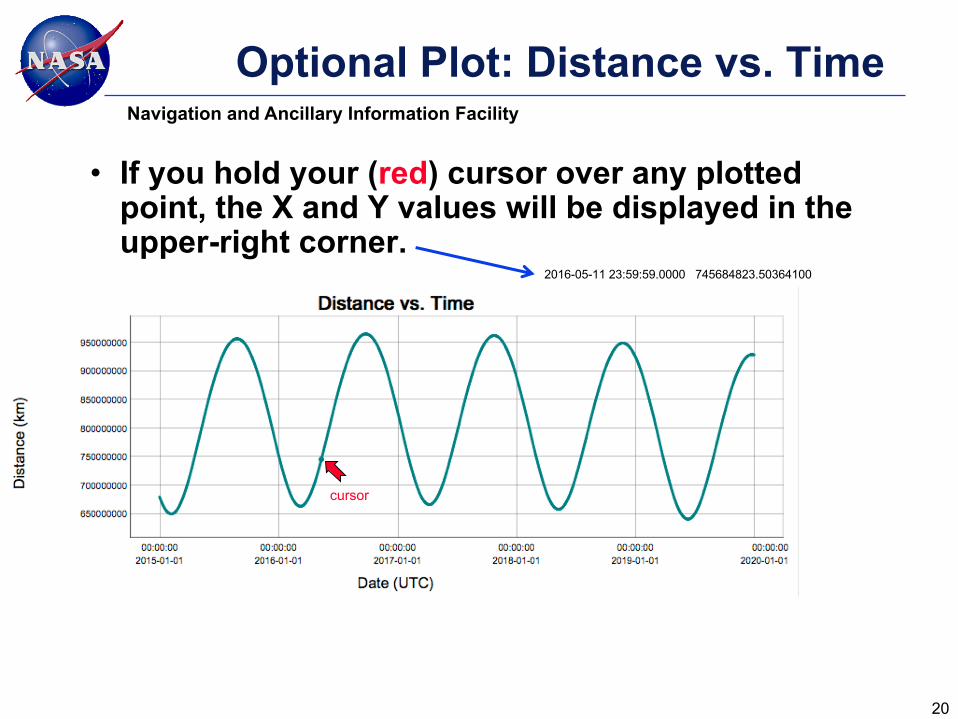
Optional Plot: Distance vs. Time
• If you hold your (red) cursor over any plotted point, the X and Y values will be displayed in the upper-right corner.
20
2016-05-11 23:59:59.0000 745684823.50364100
cursor
Navigation and Ancillary Information Facility
Examining Your Results
• You can scroll through the table of numeric results to find the distance to Jupiter at any of the time steps.
• You can hover your cursor over a plot to see the time and distance or speed value at any point.– To make examination of the plot easier, you could click and
drag your cursor horizontally or vertically over a portion of the plot to zoom in.» This can be repeated multiple times.
– Click “Prior zoom” to back out one zoom step.– Click “Reset Zoom” to jump back to the original plot.
21
Navigation and Ancillary Information Facility
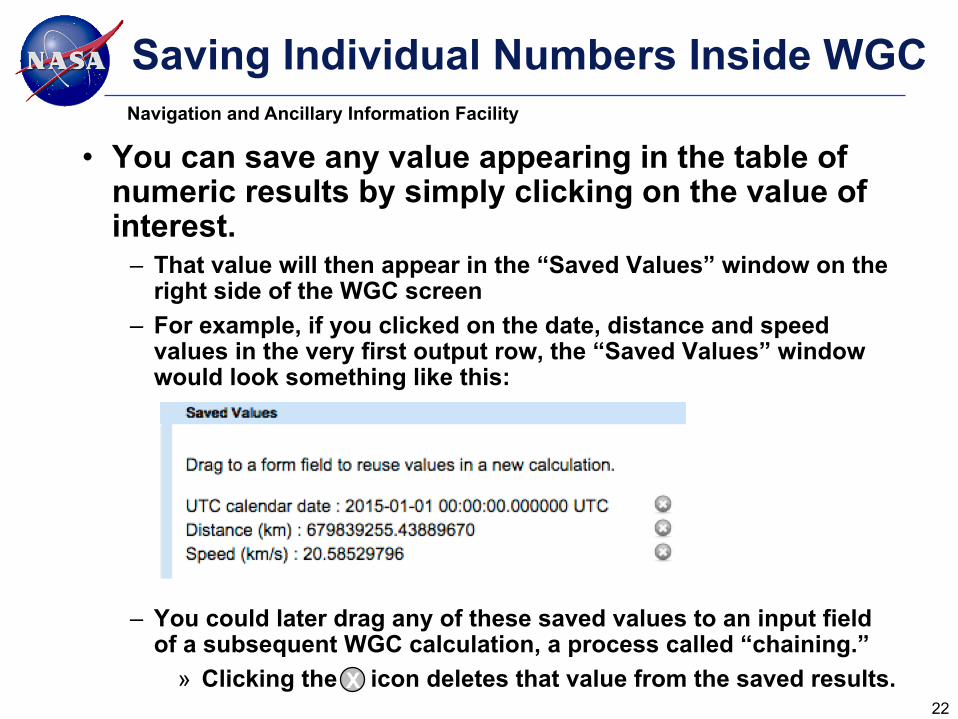
Saving Individual Numbers Inside WGC
• You can save any value appearing in the table of numeric results by simply clicking on the value of interest.– That value will then appear in the “Saved Values” window on the
right side of the WGC screen
– For example, if you clicked on the date, distance and speed values in the very first output row, the “Saved Values” window would look something like this:
– You could later drag any of these saved values to an input field of a subsequent WGC calculation, a process called “chaining.”
» Clicking the icon deletes that value from the saved results.22
X
Navigation and Ancillary Information Facility
Downloading Output
• You can download the entire table of numeric output by clicking on the “Download Results” button appearing directly underneath the “Results” title.– You’ll be given three formatting options:
» Excel» Comma separated values» Plain text
– This option can be helpful if you wish to use the results in another application, or if you wish to include the results in a presentation or document.
• You can download any of the optional plots by pressing the “Download Plot” button appearing just above the plots.– The plots will be downloaded to your computer in PNG format,
ready for inclusion in a presentation or document.23
Navigation and Ancillary Information Facility
What You’ve Learned
• Each input has associated HELP text.
• WGC will display an error message in red font in a
red box whenever it detects a problem.
• When a named kernel set is used, an auto-
complete feature helps you pick valid objects and
reference frames. (This also applies to
instruments, when an instrument is involved.)
• The numeric results panel will contain a scroll bar
if the number of lines exceeds approximately 14.
• Many calculations offer optional plotting, with
available zoom features. Your cursor can be used
to determine the coordinates for a given point.
• You can save numeric results for use later on.
• You can download plots for use elsewhere.24
Navigation and Ancillary Information Facility
Limitations of WebGeocalc
• While WGC offers a good deal of capability, it does not allow one to do everything possible when using SPICE APIs in one’s own program. Most particularly:– a limited set of SPICE computations are built-in to WGC– WGC can use only those SPICE kernels available on the host
server– the auto-complete feature available for some fill-in boxes
works only for SPICE data sets configured for use in WGC: itdoes not work for kernels selected using the MANUAL process.
– WGC is set up to disallow very time consuming computations
25