Embed Size (px)
Citation preview

*For correspondence: kelly.d.
[email protected] (KDS);
(JME)
Competing interest: See
page 23
Funding: See page 23
Received: 19 March 2016
Accepted: 28 July 2016
Published: 29 July 2016
Reviewing editor: Christopher K
Glass, University of California,
San Diego, United States
Copyright Sullivan et al. This
article is distributed under the
terms of the Creative Commons
Attribution License, which
permits unrestricted use and
redistribution provided that the
original author and source are
credited.
Trisomy 21 consistently activates theinterferon responseKelly D Sullivan1,2,3,4*, Hannah C Lewis1,2, Amanda A Hill1,2, Ahwan Pandey1,2,3,4,Leisa P Jackson1,3,4, Joseph M Cabral1,3,4, Keith P Smith1, L Alexander Liggett1,5,Eliana B Gomez1,3,4, Matthew D Galbraith1,2,3,4, James DeGregori1,5,6,7,8,9,Joaquın M Espinosa1,2,3,4*
1Linda Crnic Institute for Down Syndrome, University of Colorado School ofMedicine, Aurora, United States; 2Department of Pharmacology, University ofColorado School of Medicine, Aurora, United States; 3Department of Molecular,Cellular and Developmental Biology, University of Colorado Boulder, Boulder,United States; 4Howard Hughes Medical Institute, Chevy Chase, United States;5Department of Biochemistry and Molecular Genetics, University of ColoradoSchool of Medicine, Aurora, United States; 6Department of Pediatrics, University ofColorado School of Medicine, Aurora, United States; 7Integrated Department ofImmunology, University of Colorado School of Medicine, Aurora, United States;8Section of Hematology, University of Colorado School of Medicine, Aurora, UnitedStates; 9Department of Medicine, University of Colorado School of Medicine,Aurora, United States
Abstract Although it is clear that trisomy 21 causes Down syndrome, the molecular events
acting downstream of the trisomy remain ill defined. Using complementary genomics analyses, we
identified the interferon pathway as the major signaling cascade consistently activated by trisomy
21 in human cells. Transcriptome analysis revealed that trisomy 21 activates the interferon
transcriptional response in fibroblast and lymphoblastoid cell lines, as well as circulating monocytes
and T cells. Trisomy 21 cells show increased induction of interferon-stimulated genes and
decreased expression of ribosomal proteins and translation factors. An shRNA screen determined
that the interferon-activated kinases JAK1 and TYK2 suppress proliferation of trisomy 21
fibroblasts, and this defect is rescued by pharmacological JAK inhibition. Therefore, we propose
that interferon activation, likely via increased gene dosage of the four interferon receptors
encoded on chromosome 21, contributes to many of the clinical impacts of trisomy 21, and that
interferon antagonists could have therapeutic benefits.
DOI: 10.7554/eLife.16220.001
IntroductionTrisomy 21 (T21) is the most common chromosomal abnormality in the human population, occurring
in approximately 1 in 700 live births (Alexander et al., 2016). The extra copy of chromosome 21
(chr21) impacts human development in diverse ways across every major organ system, causing the
condition known as Down syndrome (DS). One of the most intriguing aspects of T21 is that it causes
an altered disease spectrum in the population with DS, protecting these individuals from some dis-
eases (e.g. solid tumors, hypertension), while strongly predisposing them to others (e.g. Alzheimer’s
disease, leukemia, autoimmune disorders) (Alexander et al., 2016; Sobey et al., 2015;
Bratman et al., 2014; Roberts and Izraeli, 2014; Anwar et al., 1998; Malinge et al., 2013;
Hasle et al., 2016). Despite many years of study, the molecular, cellular, and physiological
Sullivan et al. eLife 2016;5:e16220. DOI: 10.7554/eLife.16220 1 of 28
SHORT REPORT
mechanisms driving both the protective and deleterious effects of T21 are poorly understood. A few
chr21-encoded genes have been implicated in the development of specific comorbidities, such as
APP in Alzheimer’s disease (Wiseman et al., 2015), and DYRK1A and ERG in hematopoietic malig-
nancies (Stankiewicz and Crispino, 2013; Malinge et al., 2012). Therefore, research in this area
could inform a wide range of medical conditions affecting not only those with DS, but also the typi-
cal population.
The clinical manifestation of DS is highly variable among affected individuals, with various comor-
bidities appearing in a seemingly random fashion, suggesting the presence of strong modifiers,
genetic or otherwise, of the deleterious effects of T21. Even conserved features, such as cognitive
impairment, display wide quantitative variation (de Sola et al., 2015). Collectively, our understand-
ing of the mechanisms driving such inter-individual variation in the population with DS is minimal.
More specifically, it is unclear what gene expression changes are consistently caused by T21, versus
those that are context-dependent. Integrated analyses of a large body of studies have indicated that
the changes in gene expression caused by T21 involve various signaling pathways (Scarpato et al.,
2014), however, these studies vary widely in cell type, number of samples, and even analysis plat-
form, among other variables (Volk et al., 2013; Costa et al., 2011). More recently, gene expression
analysis of cells derived from discordant monozygotic twins, only one of which was affected by T21,
concluded that global gene expression changes in T21 cells are driven by differences in chromatin
topology, whereby affected genes are clustered into large chromosomal domains of activation or
repression (Letourneau et al., 2014). However, independent re-analysis of these data has chal-
lenged this conclusion (Do et al., 2015). Therefore, there remains a clear need to identify the consis-
tent gene expression changes caused by T21 and to characterize how these programs are modified
across cell types, tissue types, genetic backgrounds, and developmental stages.
In order to identify consistent signaling pathways modulated by T21, defined as those that with-
stand the effects of inter-individual variation, we employed two complementary genomics
approaches, transcriptome analysis and shRNA loss-of-function screening, in both panels of cell lines
eLife digest Our genetic information is contained within structures called chromosomes. Down
syndrome is caused by the genetic condition known as trisomy 21, in which a person is born with an
extra copy of chromosome 21. This extra chromosome affects human development in many ways,
including causing neurological problems and stunted growth. Trisomy 21 makes individuals more
susceptible to certain diseases, such as Alzheimer’s disease and autoimmune disorders – where the
immune system attacks healthy cells in the body – while protecting them from tumors and some
other conditions.
Since cells with trisomy 21 have an extra copy of every single gene on chromosome 21, it is
expected that these genes should be more highly expressed – that is, the products of these genes
should be present at higher levels inside cells. However, it was not clear which genes on other
chromosomes are also affected by trisomy 21. Sullivan et al. aimed to identify which genes are
affected by trisomy 21 by studying samples collected from a variety of individuals with, and without,
this condition.
Four genes in chromosome 21 encode proteins that recognize signal molecules called
interferons, which are produced by cells in response to viral or bacterial infection. Interferons act on
neighboring cells to regulate genes that prevent the spread of the infection, shut down the
production of proteins and activate the immune system. Sullivan et al. show that cells with trisomy
21 produce high levels of genes that are activated by interferons and lower levels of genes required
for protein production. In other words, the cells of people with Down syndrome are constantly
fighting a viral infection that does not exist.
Constant activation of interferon signaling could explain many aspects of Down syndrome,
including neurological problems and protection against tumors. The next steps are to fully define
the role of interferon signaling in the development of Down syndrome, and to find out whether
drugs that block the action of interferons could have therapeutic benefits.
DOI: 10.7554/eLife.16220.002
Sullivan et al. eLife 2016;5:e16220. DOI: 10.7554/eLife.16220 2 of 28
Short report Genes and Chromosomes Human Biology and Medicine

and primary cell types from individuals of diverse genetic background, gender, and age, with and
without T21. Our RNA-seq transcriptome analysis identified consistent gene expression signatures
associated with T21 in all cell types examined. Interestingly, the fraction of this gene expression sig-
nature that is not encoded on chr21 is dominated by the interferon (IFN) transcriptional response, an
observation that is reproducible in skin fibroblasts, B cell-derived lymphoblastoid cell lines, as well as
primary monocytes and T cells. In parallel, we performed a kinome-focused shRNA screen that iden-
tified the IFN-activated kinases JAK1 and TYK2 as strong negative regulators of T21 cell proliferation
in fibroblasts. Importantly, pharmacological inhibition of JAK kinases improves T21 cell viability.
Taken together, our results identify the IFN pathway as consistently activated by T21, which could
merely be a result of increased gene dosage of four IFN receptor subunits encoded on chr21. We
hypothesize that IFN activation could contribute to many of the effects of T21, including increased
risk of leukemia and autoimmune disorders, as well as many developmental abnormalities also
observed in interferonopathies (Yao et al., 2010; Zitvogel et al., 2015; Crow and Manel, 2015;
McGlasson et al., 2015).
Results
Trisomy 21 causes consistent genome-wide changes in gene expressionIn order to investigate consistent gene expression signatures associated with T21, we performed
RNA-seq on a panel of 12 age- and gender-matched human fibroblasts from euploid (disomic, D21)
and T21 individuals (Figure 1—figure supplement 1A–C). T21 was confirmed by PCR analysis of the
chr21-encoded RCAN1 gene (Figure 1—figure supplement 1D). We included samples from differ-
ent genetic backgrounds, ages, and genders, in order to avoid identifying differences that are spe-
cific to a particular pair of isogenic or genetically related cell lines and which would not withstand
the effects of inter-individual variation. To illustrate this point, comparison of one pair of disomic
male individuals of similar age yielded thousands of differentially expressed genes (DEGs), with simi-
lar numbers of upregulated and downregulated DEGs (Figure 1A–B, Male 1 vs. Male 2). However,
when the 12 samples are divided into two groups with roughly balanced age, sex, and T21 status,
very few consistent changes were identified, thus demonstrating the impact of inter-individual varia-
tion within our sample set (Figure 1A–B, Figure 1—figure supplement 1C, Group 1 vs. Group 2). In
contrast, comparison of all T21 versus all D21 cells identified 662 consistent DEGs, with a dispropor-
tionate number of these upregulated in T21 cells (471 of 662, Figure 1A, T21 vs. D21,
Supplementary file 1A). We also observed an uncharacteristic spike of DEGs at ~1.5-fold overex-
pression in T21 cells on a volcano plot, consistent with many chr21 genes being overexpressed solely
due to increased gene dosage (Figure 1B). For comparison purposes, we also analyzed samples by
sex which expectedly yielded DEGs encoded on chrX (e.g. XIST) and chrY (Figure 1 A–B; Female vs.
Male). Sex causes fewer significant changes than T21, with roughly equal numbers of upregulated
and downregulated genes. Taken together, these data indicate that T21 produces consistent
changes in a gene expression signature that withstands differences in genetic background, age, sex,
and site of biopsy. Of note, when we performed RNA-seq analysis using increasing numbers of T21
vs. D21 pairs, the fraction of chr21-encoded DEGs increased steadily with sample size, accounting
for ~12% of the core gene expression signature in the 12 cell line panel. However, 88% of DEGs are
located on other chromosomes, indicating the existence of conserved mechanisms driving these
genome-wide changes in gene expression (Figure 1—figure supplement 1E).
A recent report concluded that changes in gene expression caused by T21 between a single pair
of discordant monozygotic twins were due to dysregulation of chromosomal domains
(Letourneau et al., 2014). Thus, we next asked where the ~88% of core DEGs not encoded on
chr21 are located across the genome. This exercise revealed broad distribution across all chromo-
somes, with no obvious contiguous domains of up- or downregulation (see Figure 1—figure supple-
ment 2A for a whole genome Manhattan plot, and Figure 1—figure supplement 3 for individual
chromosomes). In fact, mere visual analysis of DEGs from the individual chromosomes previously
claimed by Letourneau et al. to harbor large dysregulated domains (e.g. chr3, chr11, chr19) did not
reveal such domains in our dataset, showing instead obvious regions of overlapping activation and
repression (shaded gray boxes in Figure 1C). Thus, our analysis is more consistent with the report
that re-analyzed the data in Letournaeu et al. and questioned the existence of these chromosomal
Sullivan et al. eLife 2016;5:e16220. DOI: 10.7554/eLife.16220 3 of 28
Short report Genes and Chromosomes Human Biology and Medicine

2010 150 255
2230
2561
7
25
156
146
XIST
chr Y
genes
471
191
200
150
100
50
300
250
0
156146
XISTchr Y
genes
ad
j.p
va
lue
(-lo
g1
0)
Group 1 vs. Group 2 T21 vs. D21 Female vs. MaleA
B
15
10
5
0
-15
-10
-5
2010 150 255 2010 150 255 2010 150 255
8
6
4
2
0
10
12
14471
(81 chr21)
191
(0 chr21)
0 5 15-15 -5 10-10
8
6
4
2
0
10
12
14725
0 5 15-15 -5 10-10
22302561
200
150
100
50
300
250
00 5 15-15 -5 10 -10 0 5 15-15 -5 10-10
Female vs. Male
fold change (log2)
T21 vs. D21Group 1 vs. Group 2Male 1 vs. Male 2
Male 1 vs. Male 215
10
5
0
-15
-10
-5
expression (log2 basemean)
fold
ch
an
ge
(lo
g2)
15
10
5
0
-15
-10
-5
UpDown
fold
ch
an
ge
(lo
g2)
chr118
-8
0
chr198
-8
0
8
-8
0
chr3 chr218
-8
0
15
10
5
0
-15
-10
-5
C
D E F
Sta
nd
ard
De
via
tio
n (
log
2)
chr21 All
−6
−4
−2
0
2
4
6
8
10
12G
−6 −4 −2 0 2 4 60.0
0.1
0.2
0.3
0.4
0.5
0.6
0.7
0.8
0.9
chr21all genes non-chr21
Pro
ba
bili
ty
fold change (log2)
0
1.5x
MX1MX2
APP
ETS2
ch
r21
fold change (log2)
6.1
6.1
-4.7-4.7
chr21
DEGs
All Up Down−6
−4
−2
0
2
4
6
8
fol d
ch
an
ge
(lo
g2)
2.47E-22DE
Gs
non-chr21 DEGs
DEGs
FD
R<
10
%
FD
R<
10
%
FD
R<
10
%
FD
R<
10
%
UpDown UpDown UpDown
1.5x
1.31E-51
1.83E-15
1.33E-071.5x
Figure 1. Transcriptome analysis identifies consistent changes in global gene expression between euploid (D21) and trisomy 21 (T21) fibroblasts. (A)
MA plots displaying the results of RNA-seq analysis for the indicated comparisons (see Figure 1—figure supplement 1A–C). Differentially expressed
Figure 1 continued on next page
Sullivan et al. eLife 2016;5:e16220. DOI: 10.7554/eLife.16220 4 of 28
Short report Genes and Chromosomes Human Biology and Medicine
domains (Do et al., 2015). In fact, the only region of the genome at which there was clear contigu-
ous upregulation of DEGs was chr21 itself (Figure 1C, Figure 1—figure supplements 2A and 3).
In order to characterize the mechanism driving the consistent changes caused by T21, we exam-
ined the regulatory differences between DEGs encoded on chr21 and those not encoded on chr21.
Several lines of evidence indicate that, while chr21 DEGs are regulated mostly by increased gene
dosage, non-chr21 DEGs may be driven by specific pathways that are subject to signal amplification,
with a bias toward upregulation, and greatly affected by inter-individual variation. First, violin plots
display the relatively small number of chr21 DEGs, showing mostly upregulation clustered around
1.5 fold, versus a much larger number of non-chr21 DEGs, showing both up- and downregulation
with no obvious clustering of fold changes (Figure 1D, Figure 1—figure supplement 2B). Second,
the obvious effect of gene dosage on the expression of chr21 DEGs is apparent in the violin plots
and heatmaps (Figure 1D,E), where the median fold change centers around 1.5 fold (e.g. APP,
ETS2), while a few genes show greater induction (e.g. MX1, MX2). In fact, chr21 genes exhibit more
than an 80% probability of a ~1.5-fold change as calculated by kernel density estimation analysis
(Figure 1F). Third, the bias toward upregulation among non-chr21 DEGs is evident in the violin
plots, heatmaps, and density estimation analysis (Figure 1D–F), where a larger fraction of these
genes is upregulated. Finally, we measured the inter-individual variation of chr21 DEGs versus non-
chr21 DEGs by calculating the standard deviation for each DEG across each age- and gender-
matched pair of fibroblasts. As shown in Figure 1G, the median standard deviation for chr21 DEGs
is much smaller than for all DEGs.
Altogether, these results suggest the existence of consistent signaling pathways activated by
increased dosage of chr21 genes, which in turn cause global changes in gene expression, with a bias
toward upregulation and displaying strong inter-individual variation.
Trisomy 21 leads to constitutive activation of the interferontranscriptional responseNext, we subjected T21 DEGs to upstream regulator analysis using Ingenuity Pathway Analysis (IPA)
to identify putative factors contributing to consistent changes in gene expression. This analysis tool
includes both a hypergeometric test for overlapping sets of genes and a directional component to
predict activation or inactivation of factors that control gene expression (e.g. transcription factors,
protein kinases) (Kramer et al., 2014). We confirmed the effectiveness of this tool using published
RNA expression datasets from our lab for cells treated with an inhibitor of the p53-MDM2 interac-
tion, hypoxia, and serum stimulation (Sullivan et al., 2012; Donner et al., 2010; Galbraith et al.,
2013). IPA effectively identified p53, the Hypoxia Inducible Factor 1A (HIF1A), and growth factor
receptors and downstream kinases (PDGF, ERK) as the top upstream regulators in each scenario,
respectively (Figure 2—figure supplement 1A). Strikingly, the top 13 upstream regulators predicted
Figure 1 continued
genes (DEGs), as defined by DEseq2 (FDR < 10%), are labeled in red. (B) Volcano plots of comparisons in A highlight changes in chr21 gene expression
(green) consistent with increased gene dosage effects. (C) Manhattan plots displaying DEGs (red) and all genes (black) for individual chromosomes do
not show obvious domains of contiguous upregulation or downregulation. Shaded areas highlight regions of overlapping upregulation and
downregulation (see Figure 1—figure supplements 2A and 3). (D) Violin plots of chr21 and non-chr21 DEGs displaying the distribution of fold
changes of DEGs in each category. p-values were calculated with the Kolmogorov-Smirnov test. (E) Heatmap of all significant DEGs showing clustering
of chr21 DEGs (green) around 1.5 fold upregulation in T21 cells. (F) Kernel density estimate plot highlighting the probabilities of chr21 DEGs (green,
green dashed line indicates median), non-chr21 DEGs (black, black dashed line indicates median), and all genes (gray), of having a given fold change.
(G) Box and whisker plot of standard deviations of fold changes in DEGs for six pairwise comparisons of age- and gender-matched T21 versus D21
fibroblasts showing greater variation in fold change for non-chr21 DEGs. p-values were calculated with the Kolmogorov-Smirnov test.
DOI: 10.7554/eLife.16220.003
The following figure supplements are available for figure 1:
Figure supplement 1. T21 and D21 fibroblast RNA-seq.
DOI: 10.7554/eLife.16220.004
Figure supplement 2. Amplification of changes in gene expression emanating from T21.
DOI: 10.7554/eLife.16220.005
Figure supplement 3. Differentially expressed genes in trisomy 21 fibroblasts are not organized into obvious chromatin domains.
DOI: 10.7554/eLife.16220.006
Sullivan et al. eLife 2016;5:e16220. DOI: 10.7554/eLife.16220 5 of 28
Short report Genes and Chromosomes Human Biology and Medicine
IRF7
IRF3
IFNB1
IFNA2
IFN Beta
Interferon alpha
PRL
TLR7
Activation Z-score
3.889-3.095
All
non
chr2
1
chr2
1
T21 vs. D21
IFNA1/IFNA13
MAPK1
IFNL1
STAT1
TRIM24
IFNG
IRF5
B
MX1
ADGRE1
TNFSF10
IFI44L
MYH2
OAS2
OAS1
IFNA2
CMPK2
HLA-C
HERC6
MX2
IFI27
EFNB3
IFNAR2
IFITM1
BST2
IL10RB
IFIT2
RSAD2
IFI6
Effect consistent with predictionEffect not predictedEffect not consistent with prediction
Upregulated DownregulatedStrongly Upregulated
JAK1, JAK2, TYK2
IRFs and STATs
IFNAR2
IFNAR1
IFNGR2
IFNGR1
IL10RB
IFNLR1
Upstream Regulators T21 vs D21 DEG
chr21 Encoded DEG
Type-I
IFNB1/A1/A2
Type-II
IFNG
Type-III
IFNLI
APP
TMEM50B
MX1
MX2
IFIT2
IDO1
OAS1
OAS2
CMPK2
IFI27
IFITM1
BST2
IL1A
IFI44L
TNFSF10
IFI6
MYH6
RSAD2
HERC6
ISG15
Interferon Stimulated Genes (ISGs)
CA
p: 6.6e-03 p: 8.23e-05
mR
NA
exp
ressio
n (
RP
KM
)
IFNLR1 IL10RB
p: 4.30e-10 p: 1.00e-04 p: 4.00e-04 p: 3.22e-07 p: 4.8e-11 p: 6.73e-10
mR
NA
exp
ressio
n (
RP
KM
)
TBX1 TNFSF10 CMPK2 IDO1 IFI27 MX1
p: 5.03-04
IFNAR1
30
25
20
15
10
5
p: 4.17e-07
IFNAR2
12
10
8
6
4
2
p: 0.20
IFNGR1
25
20
15
10
5
0
p: 6.24e-10
IFNGR2
55
50
45
40
35
30
25
20
15
0.16
0.14
0.12
0.10
0.08
0.06
0.04
0.02
0.00
-0.02
25
20
15
10
5
0
30
35
D E
12
10
8
6
4
2
14
16
0
-2
0.30
0.25
0.20
0.15
0.10
0.05
0.00
-0.05
8
6
4
2
0
3.5
3.0
2.5
2.0
1.5
1.0
0.5
0.0
-0.5
30
25
20
15
10
5
-5
0
120
100
80
60
40
20
0
-20
D21 T21
MX1
IFI27
ISG15
GAPDH
Type-I Type-II Type-III
Interferon Stimulated Genes
101 Total IFN-related DEGs
IFNAR1
IL10RB
IFNGR2
pSTAT1
GM
08
44
7
GM
05
65
9
GM
00
96
9
GM
02
03
6
GM
03
37
7
GM
03
44
0
GM
04
61
6
AG
05
39
7
AG
06
92
2
GM
02
76
7
AG
08
94
1
AG
08
94
2
D21 T21 D21 T21 D21 T21 D21 T21 D21 T21 D21 T21
D21 T21D21 T21D21 T21D21 T21D21 T21D21 T21
SOMAscan ProteomicsFAPOBEC3G
p: 8.72e-3
APPp: 3.13e-3
ITSN1p: 1.67e-3
LGALS3p: 9.57e-3
LGALS9p: 6.51e-2
NCAM1p: 3.00e-6
MMP2p: 8.40e-5
TBX3p: 1.00e-5
3500
1000
3000
2500
2000
1500
D21 T21 D21 T21 D21 T21 D21 T21 D21 T21 D21 T21 D21 T21 D21 T21
14000
2000
10000
8000
6000
4000
12000
7000
4000
6000
5500
5000
4500
6500
3500
3000
12000
6000
10000
9000
8000
7000
11000
5000
4000
3500
4000
3000
2500
4500 1200
600
1000
900
800
700
1100
500
400
300
3800
2600
3400
3200
3000
2800
3600
2400
2200
2000
1000
400
800
700
600
500
900
300
200
rela
tive
flu
ore
sce
nce
un
its (
RF
U)
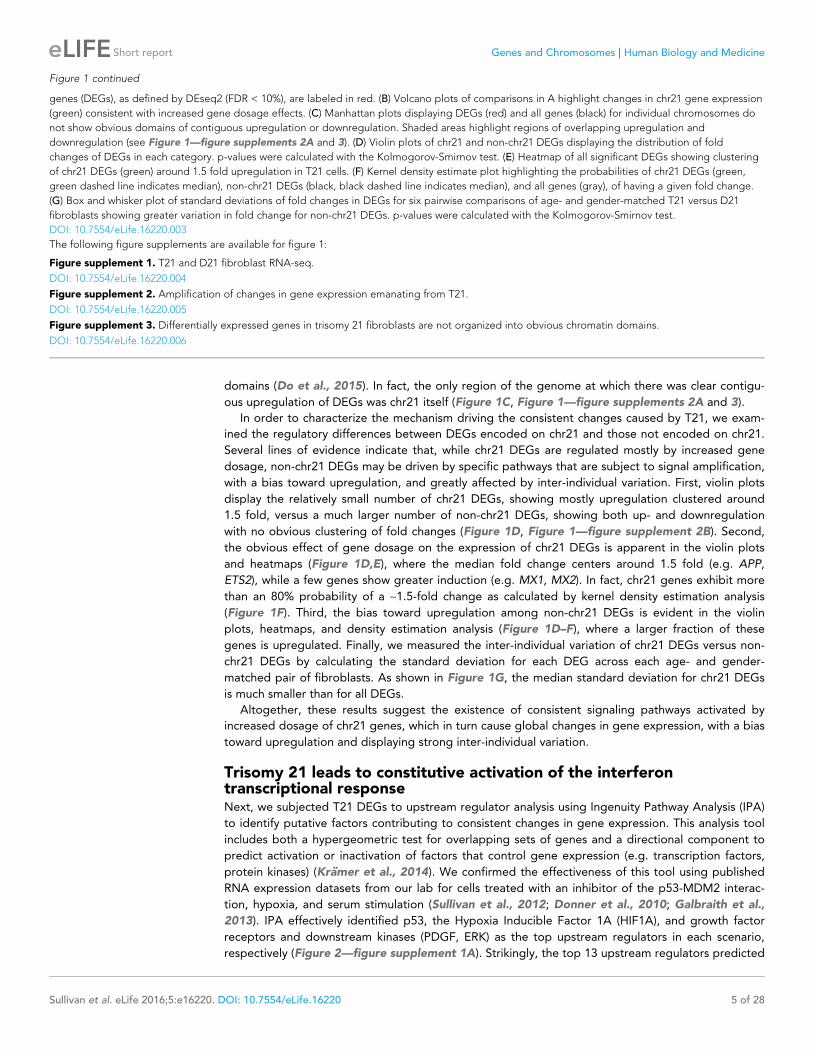
Figure 2. The interferon (IFN) transcriptional response is activated in trisomy 21 (T21) fibroblasts. (A) Upstream regulator analysis of the T21-associated
gene expression signature using Ingenuity Pathway Analysis (IPA) predicts numerous IFN-related factors as activated in T21 cells. (B) Representative
Figure 2 continued on next page
Sullivan et al. eLife 2016;5:e16220. DOI: 10.7554/eLife.16220 6 of 28
Short report Genes and Chromosomes Human Biology and Medicine

to be activated in T21 cells are all IFN-related factors, including IFN ligands (e.g. IFNA2, IFNB, IFNG)
and IFN-activated transcription factors (e.g. IRF3, IRF5, IRF7, STAT1) (Figure 2A). Importantly, most
of these signals are derived from non-chr21 DEGs, and would be missed by analyses focused specifi-
cally on chr21-encoded genes (Figure 2A). This analysis also identified two known repressors of IFN
signaling, MAPK1 and TRIM24, as upstream regulators inactivated in T21 cells, consistent with acti-
vation of the IFN pathway (Huang et al., 2008; Tisserand et al., 2011). As an example of how the
RNA-seq data supports the upstream regulator prediction by IPA, Figure 2B shows the gene net-
work centered on the ligand IFNA2 as a potential driver of consistent gene expression changes.
Strong activation of the IFN pathway was also predicted using a different tool, the Pathway Com-
mons Analysis in WebGestalt (Zhang et al., 2005; Wang et al., 2013; Cerami et al., 2011), where 4
of the top 15 pathways identified were IFN-related (Figure 2—figure supplement 1B).
Notably, activation of IFN signaling in T21 cells could be explained by the fact that four of the six
IFN receptors, IFNAR1, IFNAR2, IFNGR2, and IL10RB, (representing each IFN class, Type-I, -II, and -
III), are chr21-encoded DEGs (Figure 2C,D). Using a combination of IPA upstream regulator predic-
tions and our RNA-seq data, we clearly identified the canonical IFN pathways –from ligands through
receptors and kinases and down to transcription factors and IFN-stimulated genes (ISGs)– as acti-
vated in T21 cells (Figure 2C). Whereas IFN receptors are upregulated ~1.5 fold with relatively low
levels of inter-individual variation, as expected for increased gene dosage in T21 cells, the down-
stream ISGs exhibit larger fold changes, greater variation between samples, and tend to have low
expression levels in D21 cells, in accord with activation of IFN only in T21 cells (Figure 2D). We con-
firmed the elevated basal expression of three of the IFN receptors (IFNAR1, IFNGR2, and ILR10RB),
enhanced basal phosphorylation of STAT1, as well as increased basal expression of several ISGs at
the protein level in T21 cells, with noticeable inter-individual variation (Shuai et al., 1994;
Waddell et al., 2010; Schoggins et al., 2011) (Figure 2E).
We next analyzed protein lysates from the 12 fibroblast lines using SOMAScan technology, which
employs DNA aptamers to monitor epitope abundance (Gold et al., 2012; Mehan et al., 2014;
Hathout et al., 2015). This assay confirmed elevated protein levels for many of the IFN-related
genes found to be induced at the mRNA level in the RNA-seq experiment (Figure 2F). Finally, we
examined the fraction of our upregulated DEGs linked to IFN signaling using IPA, Pathway Com-
mons, and a list of 387 validated ISGs curated by Schoggins and colleagues (Schoggins et al.,
2011). Our analysis revealed that 21% (101/471) of DEGs upregulated in T21 cells are linked to IFN
signaling, with contributions from both chr21 (17%, 14/81) and non-chr21 (22%, 87/390) DEGs,
pointing to IFN activation as a potential mechanism for the larger number of upregulated versus
downregulated DEGs (Figure 2—figure supplement 1C). Altogether, these results indicate that the
IFN pathway is consistently induced by trisomy 21 in fibroblasts, and that the IFN transcriptional
response accounts for a considerable fraction of the transcriptome changes caused by trisomy 21
across the genome.
Figure 2 continued
results of the upstream regulator analysis for the Type I IFN ligand IFNA2. (C) Graphical summary of the observed deregulation of the IFN pathway in
T21 fibroblasts, showing the six IFN receptor subunits, four of which are encoded on chr21 and significantly upregulated in T21 fibroblasts; the
predicted upstream regulators (orange), including the Type I, II, and III IFN ligands, as well as the IFN-activated transcription factors (IRFs and STATs);
and select examples of Interferon Stimulated Genes (ISGs) upregulated in T21 fibroblasts, either encoded on chr21 (green) or elsewhere in the genome
(gray). (D) Box and whisker plots showing RNA expression for the six IFN receptor subunits and select ISGs. chr21-encoded genes are highlighted in
green. mRNA expression values are displayed in reads per kilobase per million (RPKM). Benjamini-Hochberg adjusted p-values were calculated using
DESeq2. (E) Western blot analysis confirming upregulation of IFN receptors, STAT1 phosphorylation, and ISGs, in T21 fibroblasts. (F) Box and whisker
plots showing protein expression of select IFN-related genes as measured by SOMAscan assay. chr21-encoded genes are highlighted in green. Protein
expression values are displayed in relative fluorescence units (RFU). Adjusted p-values were calculated using the Empirical Bayes method in QPROT.
DOI: 10.7554/eLife.16220.007
The following figure supplement is available for figure 2:
Figure supplement 1. Network analysis confirms IFN activation signature in T21 cells.
DOI: 10.7554/eLife.16220.008
Sullivan et al. eLife 2016;5:e16220. DOI: 10.7554/eLife.16220 7 of 28
Short report Genes and Chromosomes Human Biology and Medicine

Induced Protein Expression
Interferon-α
IFN-α ng/mL: - 1 10
10
0
- 1 10
10
0
D21 T21
GM03377 - AG08941
ng/mL: - 1 10
10
0- 1 1
0
10
0
D21 T21
GM05659 - AG05397
ng/mL: - 1 10
10
0
- 1 10
10
0
D21 T21
GM02036 - GM02767
pSTAT1
ISG15
IDO1
GAPDH
MX1
ng/mL: - 1 10
10
0
- 1 10
10
0
D21 T21
ng/mL: - 1 10
10
0
- 1 10
10
0
D21 T21
ng/mL: - 1 10
10
0
- 1 10
10
0
D21 T21
Interferon-β
pSTAT1
ISG15
IDO1
GAPDH
MX1
ng/mL: - 1 10
10
0
- 1 10
10
0
D21 T21
ng/mL: - 1 10
10
0
- 1 10
10
0
D21 T21
ISG15
ng/mL: - 1 10
10
0
- 1 10
10
0
D21 T21
Interferon-γ
pSTAT1
IDO1
GAPDH
MX1
A
B
C
Pair 1 Pair 2 Pair 3
Pair 1 Pair 2 Pair 3
Pair 1 Pair 2 Pair 3
**
*
*
*
*
IFN-β
IFN-γ
Figure 3. T21 fibroblasts are more sensitive to IFN stimulation than D21 fibroblasts. (A) Western blots showing that three T21 cell lines are more
sensitive to IFN-a treatment (24 hr) than age- and gender-matched D21 control cells as measured by induced expression of the ISGs MX1, IDO1 and
Figure 3 continued on next page
Sullivan et al. eLife 2016;5:e16220. DOI: 10.7554/eLife.16220 8 of 28
Short report Genes and Chromosomes Human Biology and Medicine

Trisomy 21 cells display stronger induction of ISGs upon stimulationwith IFN ligands than euploid cellsWe next investigated whether T21 cells produce a stronger response to specific IFN ligands than
their D21 counterparts. To test this, we treated three pairs of fibroblasts –roughly matched by age
and sex– with various doses of the Type I ligands IFN-a or -b, or with the Type II ligand IFN-g , and
monitored the expression of key ISGs via western blot. We also monitored phosphorylation of
STAT1. Overall, these efforts revealed that trisomy 21 cells show stronger induction of ISGs upon
treatment with all three ligands, albeit with variation across specific cell lines and ligands (Figure 3).
For example, stimulation with IFN-a led to stronger induction in the T21 cell line for MX1 in pairs 1
and 2, stronger induction of IDO1 in pairs 1 and 3, and stronger induction of ISG15 in pairs 1 and 2
(Figure 3A). Similar results were observed for the other Type I ligand, IFN-b. However, ligand-spe-
cific differences were also observed. For example, IDO1 was more strongly induced by IFN-a and -b
in the T21 cell line in pair 1, but this was not the case when using IFN-g (Figure 3A–C). Thus, these
results confirm the notion of strong inter-individual variation in the downstream signaling effects of
T21. Of note, all three IFN ligands consistently induced STAT1 phosphorylation (pSTAT1) both in
D21 and T21 cells, but the levels of pSTAT1 did not correlate precisely with the expression levels of
the various ISGs. For example, the obviously different levels of ISG15 in pair 2 upon treatment with
the three ligands do not correlate with dissimilar levels of pSTAT1 (Figure 3A–C). This suggests that
STAT1 phosphorylation is not a robust predictor of ISG expression, which is ultimately defined by
the orchestrated action of multiple IFN-activated transcription factors.
A kinome shRNA screen identifies the IFN-activated kinases JAK1 andTYK2 as negative regulators of cell viability in trisomy 21 fibroblastsIn a parallel unbiased approach to identify signaling cascades deregulated by T21, we employed an
shRNA screen to identify protein kinases that may have a differential impact on the viability (i.e. pro-
liferation and/or survival) of T21 cells relative to D21 cells. We hypothesized that core gene expres-
sion changes in T21 cells lead to a rewiring of signaling cascades, creating differential requirements
for specific kinases during cell survival and proliferation. In order to identify such kinases, we intro-
duced a library of 3,075 shRNAs targeting 654 kinases into each of the 12 fibroblast cell lines we
subjected to transcriptome analysis. We then propagated these cells for 14 days to allow for selec-
tion of cells harboring shRNAs targeting kinases that differentially affect survival and/or proliferation
of T21 cells versus D21 cells, henceforth referred to as DMT21 kinases (Differential Modulators of T21
cells) (Figure 4A). In this screen, relative enrichment of a given shRNA in the T21 population could
result from the targeted kinase being a negative regulator of T21 cellular fitness, a positive regulator
of D21 cellular fitness, or a combination of both. To minimize the possibility of shRNA off-target
effects, we required at least three independent shRNAs targeting a given kinase to score as signifi-
cantly enriched or depleted, with no more than one shRNA against each kinase scoring in the oppo-
site direction (see Materials and methods for details). This analysis identified a total of 25 and 15
kinases that negatively and positively affect the fitness of T21 cells relative to D21 cells, respectively
(Figure 4B, Figure 4—figure supplement 1, Supplementary file 2). The top scoring enriched
kinase was mTOR, indicating that this kinase differentially decreases the fitness of T21 cells (and/or
differentially increases the fitness of D21 cells). This could be consistent with previous reports show-
ing hyperactivation of mTOR signaling in the brains of individuals with DS and mouse models of tri-
somy 21 and consequent impairments in autophagy (Ahmed et al., 2013; Perluigi et al., 2015;
Troca-Marın et al., 2014; Iyer et al., 2014). Importantly, among DMT21 kinases predicted to hinder
T21 cell viability were the IFN-activated kinases JAK1 and TYK2 (Muller et al., 1993; Stahl et al.,
1994) (Figure 4B,C, Figure 4—figure supplement 1A,B). To confirm that JAK1 signaling negatively
affects the relative viability of T21 cells, we treated two pairs of D21/T21 fibroblasts with increasing
doses of the JAK1/2 inhibitor ruxolitinib (Rux) (Tefferi et al., 2011). Rux treatment led to decreased
Figure 3 continued
ISG15. Elevated pSTAT1 levels confirm effective induction of the IFN pathway in response to ligand exposure. (B) Western blots as in A for IFN-b
treatment. (C) Western blots as in A for IFN-g treatment. * indicates non-specific bands.
DOI: 10.7554/eLife.16220.009
Sullivan et al. eLife 2016;5:e16220. DOI: 10.7554/eLife.16220 9 of 28
Short report Genes and Chromosomes Human Biology and Medicine

levels of pSTAT1, decreased protein expression of MX1 –an ISG encoded on chr21–, and decreased
mRNA expression of several ISGs found to be upregulated in T21 fibroblasts in our RNA-seq experi-
ment (Figure 4D and Figure 4—figure supplement 1C,D). To assess the impact of Rux treatment
on cell viability, we seeded equal numbers of D21 and T21 fibroblasts in the absence or presence of
increasing doses of the inhibitor, and counted the number of viable cells 3 days post-seeding.
Transduce
shRNA Library
Propogate D21 and T21 Cells
Harvest
Genomic DNA
PCR Amplify and Barcode
shRNA Cassettes
Sequence
shRNA LibrariesData Analysis
A
B C
D
−0.6 −0.4 −0.2 0.0 0.2 0.4 0.60.0
0.5
1.0
1.5
2.0
2.5
-lo
g1
0(p
ad
j)
DMT21 shRNAs
En
rich
ed
in
T2
1 C
ells
fold
ch
an
ge
(lo
g2
)
T2
1/D
21
De
ple
ted
in
T2
1 C
ells
Genetic screen to identify Differential Modulators of T21
cellular fitness (DMT21 genes)
shRNA: 4321
MAPK9
shRNA: 4321
NRBP1
Enriched in T21 CellsDepleted in T21 Cells
FDR 5%
NRBP1 JAK1
fold change (log2)
fold
ch
an
ge
(lo
g2
)
T2
1/D
21
F
1
2
3
4
0
Re
lative
Ce
ll #
– 0.1 1.0 10
T21D21
G
6
1
2
3
4
5
0
T2
1/D
21
Ra
tio
– 0.1 1.0 10[Rux] µM:
E
pSTAT1
MX1
GAPDH
1.0
10– 0.1[Rux] µM: 1.0
10– 0.1
D21 T21
0.0e4
1.0e4
2.0e4
3.0e4
Ab
so
lute
Ce
ll #
[Rux] µM: – 0.1 1.0 10
T21D21
JAK10.5
-0.5
0
shRNA: 4321
mTOR0.5
-0.5
0
shRNA: 4321 5 6
TYK2
shRNA: 4321
0.5
-0.5
0
TSSK60.5
-0.5
0
0.5
-0.5
0
0.5
-0.5
0
shRNA: 321
GM02036 - GM02767
Figure 4. An shRNA screen identifies the interferon (IFN)-activated kinases JAK1 and TYK2 as negative regulators of trisomy 21 (T21) cellular fitness. (A)
Schematic of kinome-focused shRNA screen to identify Differential Modulators of T21 (DMT21) cellular fitness. (B) Volcano plot highlighting shRNAs
targeting DMT21 genes that differentially inhibit T21 (blue) or euploid (D21, yellow) cellular fitness. Top hits were filtered by a FDR < 5% and at least
three shRNAs to the same gene scoring in one direction with no more than one shRNA scoring in the opposite direction. NRBP1 and JAK1 shRNAs are
indicated with arrows. (C) Bar graphs of the screen results for the IFN-related kinases JAK1 and TYK2, as well as mTOR, NRBP1, MAPK9 and TSSK6. (D)
Western blot analysis confirming downregulation of STAT1 phosphorylation and MX1 expression upon inhibition of JAK kinases with ruxolitinib (Rux) at
the indicated concentrations in the GM02036-GM02767 cell pair. (E) Absolute cell numbers grown for 72 hr in their respective conditioned media with
the indicated doses of Rux. (F) Relative cell numbers from (E). (G) Ratio of T21:D21 relative cell numbers demonstrates the overall differential effect of
Rux on the number of viable cells from this T21-D21 pair. Results from a second cell line pair are shown in Figure 4—figure supplement 1D–G. All
data shown are an average of three experiments ± standard error of the mean.
DOI: 10.7554/eLife.16220.010
The following figure supplement is available for figure 4:
Figure supplement 1. An shRNA screen identifies differential modulators of T21 (DMT21) cellular fitness.
DOI: 10.7554/eLife.16220.011
Sullivan et al. eLife 2016;5:e16220. DOI: 10.7554/eLife.16220 10 of 28
Short report Genes and Chromosomes Human Biology and Medicine

Notably, the number of viable T21 cells was much lower in all conditions tested (Figure 4E and Fig-
ure 4—figure supplement 1E). However, whereas Rux treatment led to a dose-dependent increase
in the number of viable T21 cells, it also produced a decrease in the number of viable D21 cells at
the highest concentration. When the cell counts are represented as T21/D21 ratios, it is clear that
JAK inhibition has a differential effect on cell proliferation between T21 and D21 cells (Figure 4F,G
and Figure 4—figure supplement 1F,G). This is consistent with shRNAs targeting JAK1 (and TYK2)
being differentially enriched in T21 cells during the 14-day course of the screen. Ultimately, these
data support the notion of differential signaling requirements in T21 relative to D21 cells and identify
two IFN-related kinases as negative regulators of T21 fibroblast viability.
IRF7OSM
IfnarIFNA2
Interferon alpha
XBP1
Activation Z-score5.734-3.349
All
non-
chr2
1
chr2
1
Lym
phob
lasts (a
ll)
Fibro
blas
ts (a
ll)
MGEA5
NKX2-3
STAT1
IL21
IFNG
TRIM24
Interferon alphaIFNG
STAT1IRF7
IFNA2IFNB1
TRIM24PRLIfnar
IFNL1IFN Beta
MAPK1
mR
NA
exp
ressio
n (
RP
KM
)
TBX21
GBP5
GAPDH
D21 T21
A B
F
EC
p: 2.05e-07
IL10RB
70
60
50
30
40
20
p: 2.07e-11
IFNAR2
70
60
50
30
40
20
p: 3.30e-02
IFNGR2
60
55
50
45
40
35
30
25
p: 4.50e-31
IFNAR1
30
25
20
15
10
p: 3.00e-03
TBX21
60
50
40
30
20
10
0
-10
p: 2.11e-05
GBP5
20
15
10
5
-5
0
15
10
5
0
-15
-10
-5
2010 150 255
861
677
fold
ch
an
ge
(lo
g2)
fold change (log2)
T21 vs. D21
30
25
20
15
0
5
10
0 5-5 10-10
677
(2 chr21)
ad
j.p
va
lue
(-lo
g1
0)
fold change (log2)
861
(85 chr21)
T21 vs. D21
UpDown
chr21
8
-8
0
fold
ch
an
ge
(lo
g2)
D
BCL2L11
G
p: 7.66e-02
BCL2L11
10
8
6
4
0
2
IFNAR1
FD
R<
10
%
D21 T21 D21 T21D21 T21 D21 T21 D21 T21 D21 T21D21 T21
15
10
5
0
-15
-10
-5
2010 150 255
861
677
fold
ch
an
ge
(lo
g2)
fold change (log )
ad
j.p
va
lue
(-lo
g)
IFNAR1
IL10RB
pSTAT1
Figure 5. Activation of the interferon (IFN) transcriptional response is conserved in trisomy 21 (T21) lymphoblastoid cell lines. (A) MA plot displaying the
gene expression signature associated with T21 in a panel of six lymphoblastoid cell lines, three of which harbor T21. Differential expressed genes
(DEGs), as defined by DEseq2 (FDR < 10%), are labeled in red. (B) Volcano plot of DEGs with those encoded on chr21 highlighted in green. (C)
Manhattan plot of chr21 with DEGs in red and all other genes in black. (D) Upstream regulator analysis reveals activation of the IFN transcriptional
response in T21 lymphoblastoid cell lines. (E) Comparative analysis between fibroblasts and lymphoblastoids highlights conserved upstream regulators
within the IFN pathway. (F) Box and whisker plots of RNA expression for the four IFN receptor subunits encoded on chr21 (green) and three interferon-
related genes (black). mRNA expression values are displayed in reads per kilobase per million (RPKM). Benjamini-Hochberg adjusted p-values were
calculated using DESeq2. (G) Western blot analysis confirming upregulation of IFN receptors, pSTAT1, and interferon related genes, at the protein level
in T21 lymphoblastoids.
DOI: 10.7554/eLife.16220.012
The following figure supplements are available for figure 5:
Figure supplement 1. Biological replicates of lymphoblastoid samples are highly related.
DOI: 10.7554/eLife.16220.013
Figure supplement 2. Differentially expressed genes in trisomy 21 lymphoblastoid cell lines are not organized into obvious chromatin domains.
DOI: 10.7554/eLife.16220.014
Figure supplement 3. Components of the IFN response are activated in a mouse model of Down syndrome.
DOI: 10.7554/eLife.16220.015
Sullivan et al. eLife 2016;5:e16220. DOI: 10.7554/eLife.16220 11 of 28
Short report Genes and Chromosomes Human Biology and Medicine

Activation of the IFN response by trisomy 21 is conserved inlymphoblastoid cellsTo test whether consistent changes in gene expression programs elicited by trisomy 21 are con-
served across cell types, we performed RNA-seq on a panel of six age-matched, female lymphoblas-
toid cell lines from D21 and T21 individuals (Figure 5—figure supplement 1A–B). These cell lines
were generated by immortalizing B cells with Epstein Barr Virus (EBV), thus enabling us to compare
a cell type of lymphocytic origin with the fibroblasts of mesenchymal origin. Analysis of DEGs associ-
ated with T21 identified 1538 genes both up and downregulated with more upregulated DEGs (861
out of 1538), as was seen in the fibroblasts (Figure 5A, Supplementary file 1B). Similarly, a peak of
highly significant DEGs with ~1.5-fold change, comprised of chr21-encoded genes, is observed in a
volcano plot (Figure 5B). Furthermore, most DEGs are distributed across the genome, and not
arranged into obvious chromosomal domains outside of chr21 (Figure 5C and Figure 5—figure sup-
plement 2). IPA revealed that the top upstream regulators of the consistent gene expression signa-
ture driven by T21 in lymphoblastoids are also IFN-related, and that this prediction is powered by
non-chr21 DEGs (Figure 5D). Comparison of DEGs from fibroblasts and lymphoblastoids demon-
strates that many of the same upstream regulators are predicted to be activated and are IFN-related
factors (Figure 5E). All four chr21-encoded IFN receptors are significantly upregulated in lympho-
blastoids (Figure 5F), as they are in fibroblasts. In fact, the most significant DEG encoded on chr21
is IFNAR1 (Figure 5B). Increased basal protein expression was confirmed by western blot for IFNAR1
and IL10RB, as well as for the interferon-related genes TBX21, GBP5 and BCL2L11 (BIM)
(Figure 5G). STAT1 phosphorylation was also elevated in the T21 lymphoblastoids (Figure 5G).
We next wanted to determine if the IFN signature was conserved in a mouse model of Down syn-
drome. Dp16 mice were selected because they contain a region of mouse chromosome 16 syntenic
to human chromosome 21 that includes the IFN receptor cluster, without triplication of non-syntenic
regions (Li et al., 2007). RNA-seq was performed on the LSK (Lineage negative, Sca1 positive, c-Kit
positive) population of multipotent hematopoietic stem and progenitor cells obtained from the
bone marrow of Dp16 mice and matched littermate controls. These results confirmed that three of
the four IFN receptors are upregulated in Dp16 mice (Ifnar1, Ifnar2, and Ifngr2), along with several
canonical ISGs (Figure 5—figure supplement 3, Supplementary file 1C). Our results demonstrate
that IFN activation by trisomy 21 is conserved in the hematopoietic lineage.
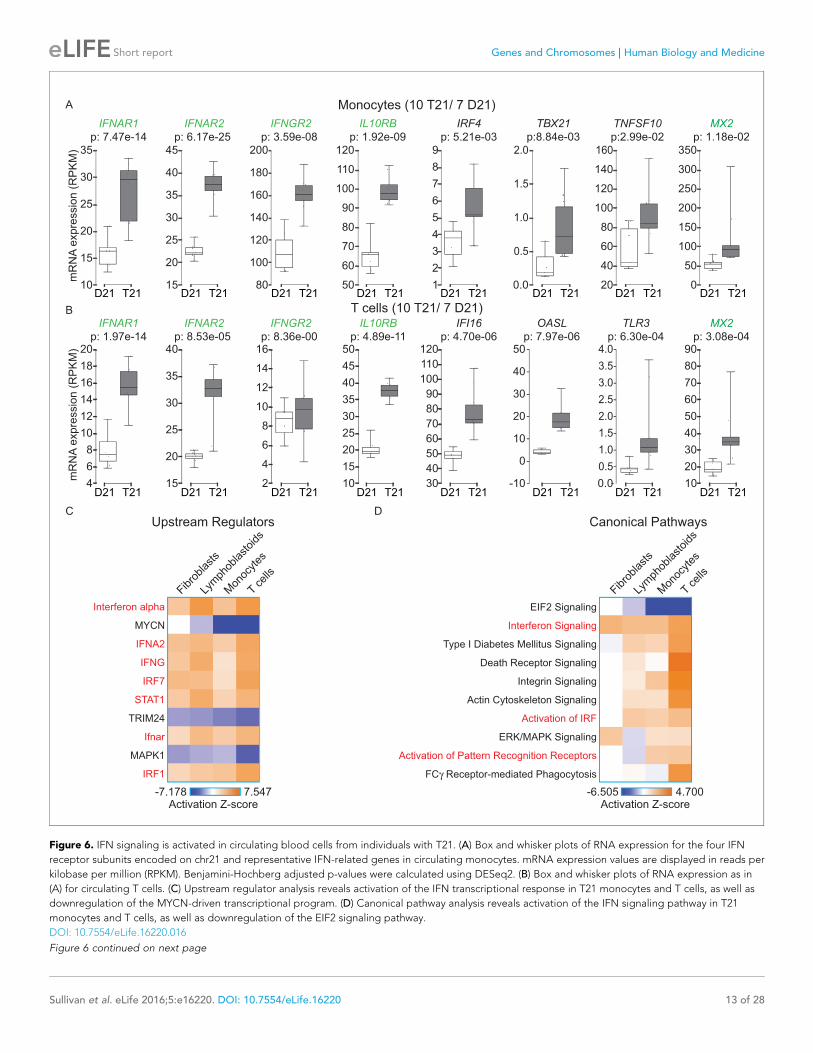
The IFN response is activated in circulating blood cell types ofindividuals with trisomy 21In order to determine whether our findings are applicable to living human individuals with T21, we
isolated monocytes, T cells, and B cells, from 10 individuals with T21 and seven D21 individuals. As
for our cell line work, we included samples from both sexes with varying ages and genetic back-
grounds (Figure 6—figure supplement 1A,B). Monocytes and T cells were subjected to transcrip-
tome analysis by RNA-seq, and B cells used for IFN receptor surface expression analysis by flow
cytometry. The transcriptome analyses identified hundreds of consistent gene expression changes
associated with T21 in both cell types, with the expected ~1.5x fold increase in chr21 gene expres-
sion (Figure 6—figure supplement 1C,D). The IFN receptors encoded on chr21 are significantly
upregulated in circulating blood cell types from individuals with T21, with the sole exception of
IFNGR2 in T cells (Figure 6A,B, Supplementary file 1D). Flow cytometry detected a minor increase
in surface expression of IFNAR1, IFNGR2, and IL10RB, in the B cell population, but not for IFNGR1,
which is not encoded on chr21 (Figure 6—figure supplement 2). Once again, upstream regulator
analysis identified IFN ligands and IFN-activated transcription factors as predicted drivers of gene
induction in T21 monocytes and T cells (Figure 6C and Figure 6—figure supplement 3) with many
canonical ISGs scoring among the most significantly induced genes (Figure 6A,B).
A comparison of the upstream regulator analyses of the four cell types included in this study
revealed both conserved and cell type-specific features. The upstream regulator analysis shows that
IFN activation is conserved, as is predicted inactivation of the IFN repressors MAPK1 and TRIM24
(Figure 6C). However, a unique feature of the primary cell types -monocytes and T cells- is a pre-
dicted inactivation of the gene expression program driven by the transcription factor MYCN
(Figure 6C). Comparison of the canonical pathways deregulated in all four cell types confirms that
IFN signaling is the top activated pathway, but also reveals that monocytes and T cells, and to a
Sullivan et al. eLife 2016;5:e16220. DOI: 10.7554/eLife.16220 12 of 28
Short report Genes and Chromosomes Human Biology and Medicine
IFNAR1
p: 7.47e-14
35
10
30
25
20
15
IFNAR2
p: 6.17e-25
45
15
35
30
25
20
40
IFNGR2
p: 3.59e-08
200
80
180
160
140
120
100
IRF4
p: 5.21e-03
9
1
8
7
6
5
4
3
2
TBX21
p:8.84e-03
2.0
0.0
1.5
1.0
0.5
TNFSF10
p:2.99e-02
160
20
80
140
120
100
60
40
MX2
p: 1.18e-02
350
0
300
250
200
150
100
50
IL10RB
p: 1.92e-09
120
50
90
110
100
80
70
60
Monocytes (10 T21/ 7 D21)
IFNAR1
p: 1.97e-1420
4
10
8
6
12
14
16
18
IFNAR2
p: 8.53e-05
15
35
30
25
20
40
2
4
10
8
6
12
14
16
IFNGR2
p: 8.36e-00
45
15
35
30
25
20
40
10
50
IL10RB
p: 4.89e-11
IFI16
p: 4.70e-06120
50
90
110
100
80
70
60
30
40
MX2
p: 3.08e-04
50
90
80
70
60
30
20
40
10
T cells (10 T21/ 7 D21)
30
20
40
10
50
-10
0
OASL
p: 7.97e-06
2.0
0.0
1.5
1.0
0.5
4.0
3.5
3.0
2.5
TLR3
p: 6.30e-04
B
C
A
D
mR
NA
exp
ressio
n (
RP
KM
)m
RN
A e
xp
ressio
n (
RP
KM
)
Activation Z-score4.700-6.505
ERK/MAPK Signaling
EIF2 Signaling
FCγ Receptor-mediated Phagocytosis
Interferon Signaling
Activation of IRF
Type I Diabetes Mellitus Signaling
Death Receptor Signaling
Integrin Signaling
Actin Cytoskeleton Signaling
Activation of Pattern Recognition Receptors
Fibro
blas
ts
Lym
phob
lastoids
Mon
ocytes
T cells
Activation Z-score7.547-7.178
Interferon alpha
MYCN
IFNA2
IFNG
IRF7
STAT1
TRIM24
Ifnar
MAPK1
IRF1
Fibro
blas
ts
Lym
phob
lastoids
Mon
ocytes
T cells
Upstream Regulators Canonical Pathways
D21 T21 D21 T21 D21 T21 D21 T21 D21 T21 D21 T21 D21 T21 D21 T21
D21 T21 D21 T21 D21 T21 D21 T21 D21 T21 D21 T21 D21 T21 D21 T21
Figure 6. IFN signaling is activated in circulating blood cells from individuals with T21. (A) Box and whisker plots of RNA expression for the four IFN
receptor subunits encoded on chr21 and representative IFN-related genes in circulating monocytes. mRNA expression values are displayed in reads per
kilobase per million (RPKM). Benjamini-Hochberg adjusted p-values were calculated using DESeq2. (B) Box and whisker plots of RNA expression as in
(A) for circulating T cells. (C) Upstream regulator analysis reveals activation of the IFN transcriptional response in T21 monocytes and T cells, as well as
downregulation of the MYCN-driven transcriptional program. (D) Canonical pathway analysis reveals activation of the IFN signaling pathway in T21
monocytes and T cells, as well as downregulation of the EIF2 signaling pathway.
DOI: 10.7554/eLife.16220.016
Figure 6 continued on next page
Sullivan et al. eLife 2016;5:e16220. DOI: 10.7554/eLife.16220 13 of 28
Short report Genes and Chromosomes Human Biology and Medicine

lesser degree lymphoblastoids, show strong repression of the EIF2 pathway (Figure 6D). Since both
MYCN and EIF2 are potent regulators of protein synthesis, we decided to investigate this observa-
tion in more detail.
Trisomy 21 downregulates the translation machinery in primarymonocytes and T cellsA well-established aspect of the IFN response is the selective control of protein translation, purport-
edly to prevent the synthesis of viral proteins during the course of infection (Johnson et al., 1968).
Mechanistically, it has been shown that IFN signaling impairs processing of rRNAs and controls the
Figure 6 continued
The following figure supplements are available for figure 6:
Figure supplement 1. Effects of T21 on the transcriptome of circulating monocytes and T cells from individuals with T21 and typical controls.
DOI: 10.7554/eLife.16220.017
Figure supplement 2. Surface expression of IFN receptors is increased in B cells from individuals with T21.
DOI: 10.7554/eLife.16220.018
Figure supplement 3. The IFN gene signature from monocytes and T cells is largely encoded by non-chr21 genes.
DOI: 10.7554/eLife.16220.019
35 3952
MYCN
EIF2
Signaling
Monocytes
45 4856
T cells
EIF3H
p: 2.67e-04
300
280
260
320
240
240
200
EIF2S3
p: 3.19e-03
120
90
110
100
80
70
130
EEF1A1
p:1.10e-025500
3500
5000
4500
3000
EEF1B2
p:1.48e-02360
220
340
320
300
280
260
240
RPS4X
p:4.33e-041400
700
1300
1200
1100
1000
900
800
RPS16
p:2.12e-03
700
1300
1200
1100
1000
900
800
600
RPL13A
p:1.03e-04260
240
200
220
180
140
160
RPLP1
p:5.52e-042600
1800
2400
2200
2000
1400
1600
EIF3E
p: 2.10e-03
650
600
550
700
500
450
400
350
300
360
340
320
300
280
440
420
400
380
EIF4A2
p: 3.13e-03
2600
1800
2400
2200
2000
1600
3000
2800
RPS27A
p: 1.73e-04
RPS15
p: 1.40e-04
2600
1800
2400
2200
2000
1600
2800
1400
RPL17
p: 2.78e-05500
450
350
400
300
200
250
RPL14
p: 2.15e-04
1800
2200
2000
1400
1600
1200
1000
800
C
A Monocytes (10 T21/ 7 D21)
T cells (10 T21/ 7 D21)
MYCN
EIF2
Signaling
D
B
D21 T21
EEF1D
p: 2.10e-03
360
340
320
300
280
380
260
240
220
EEF1G
p: 1.10e-02
2000
4000
3500
2500
1500
3000
D21 T21 D21 T21 D21 T21D21 T21D21 T21D21 T21D21 T21
D21 T21 D21 T21 D21 T21 D21 T21 D21 T21 D21 T21 D21 T21 D21 T21
mR
NA
exp
ressio
n (
RP
KM
)m
RN
A e
xp
ressio
n (
RP
KM
)
ribosomal
proteins
ribosomal
proteins +
translation
initiation
metabolic
enzymes +
translation
elongation
Figure 7. Trisomy 21 globally downregulates the translation machinery in monocytes and T cells. (A) Venn diagram demonstrating the overlap in DEGs
comprising the MYCN upstream regulator and EIF2 signaling pathway gene signatures identified by IPA in monocytes. Prominent components of each
group are indicated with arrows. See also Figure 7—figure supplement 2. (B) Box and whisker plots of RNA expression for representative translation-
related genes from monocytes. mRNA expression values are displayed in reads per kilobase per million (RPKM). Benjamini-Hochberg adjusted p-values
were calculated using DESeq2. (C) Venn diagram demonstrating the overlap in DEGs as in (A) for T cells. (D) Box and whisker plots of RNA expression
as in (C) for T cells.
DOI: 10.7554/eLife.16220.020
The following figure supplements are available for figure 7:
Figure supplement 1. The MYCN transcriptional program is downregulated by T21.
DOI: 10.7554/eLife.16220.021
Figure supplement 2. The EIF2 Signaling pathway is downregulated by T21.
DOI: 10.7554/eLife.16220.022
Sullivan et al. eLife 2016;5:e16220. DOI: 10.7554/eLife.16220 14 of 28
Short report Genes and Chromosomes Human Biology and Medicine

activity and/or expression of specific translation factors (Walsh et al., 2013; Maroun, 1978). On the
other hand, the MYC family of transcription factors are known drivers of ribosome biogenesis, pro-
tein synthesis and cell growth (van Riggelen et al., 2010; Boon et al., 2001; Kim et al., 2000;
Arabi et al., 2005). Similarly, the EIF2 pathway is a key driver of protein translation, with eIF2 itself
being an essential translation initiation factor (Hinnebusch, 2014). Analysis of the gene signatures
PC1 (80.5%)
PC
2 (
11
.3%
)
−40
−20
0
20
40
60
−100 −50 0 50−150 100
Fibroblasts
Lymphoblastoids
Fibroblasts
Lymphoblastoids
Monocytes
T cells
IFNAR1
p: 5.52e-26
40
0
20
30
10
15
5
25
35
D21 T21
IFNAR2
p: 1.48e-30
D21 T21
70
60
50
40
30
20
10
0
-10
IFNGR2
p: 1.10e-05
D21 T21
200
150
100
50
0
-50
IL10RB
p: 3.67e-19
D21 T21
120
100
60
40
20
0
-20
80
A B
−40
−20
0
20
40
60
−100 −50 0 50−150 100
T21
D21
IFI35
p: 6.02e-2
D21 T21
160
120
100
60
40
20
0
-20
80
140
TBX1
p: 7.70e-3
TNFSF10
p: 5.38e-4
IFITM1
p: 7.84e-3
200
150
100
50
0
-50
16
12
10
6
4
2
0
-2
8
14
200
0
-200
400
600
800
1000
1200
1400
D21 T21 D21 T21D21 T21
APP
p: 1.01e-01
U2AF1
p: 1.39e-24
ETS2
p: 2.89e-06
DYRK1A
p: 3.01e-20
300
200
100
0
-100
400
600
500200
150
100
50
0
250
70
60
50
40
30
20
10
0
-10
80
40
0
20
30
10
15
5
25
35
45
D21 T21 D21 T21 D21 T21D21 T21
C
D E
Fibroblasts
Lymphoblastoids
Fibroblasts
Lymphoblastoids
Monocytes
T cells
Monocytes T cells
chr21−6
−4
−2
0
2
4
6
chr19−6
−4
−2
0
2
4
6
9
18
1
20
1
3
0
36
4
162
17
2
73
Fibroblasts
Lymphoblastoids Monocytes
T cells
F
MX1IFNAR1IFNAR2
G
fold
ch
an
ge
(lo
g2)
Interferon alpha signatures
Figure 8. Trisomy 21 activates the IFN gene expression program in a cell type-specific manner. (A) Principal component analysis (PCA) of all RNA-seq
samples from this study colored by cell type. (B) PCA analysis as in (A) colored by chr21 copy number. (C) Box and whisker plots of RNA expression for
representative chr21-encoded genes from all samples. mRNA expression values are displayed in reads per kilobase per million (RPKM). Benjamini-
Hochberg adjusted p-values were calculated using DESeq2 by comparing all T21 samples to all D21 samples. Individual data points are colored by cell
type. (D,E) Box and whisker plots as in (C) for chr21-encoded IFN receptors and representative ISGs. (F) Venn diagram showing the cell type-specificity
of the Interferon alpha gene expression programs identified by IPA for each cell type. (G) Manhattan plots for chromosomes 19 and 21 comparing the
DEGs from monocytes and T cells derived from the same individuals.
DOI: 10.7554/eLife.16220.023
Sullivan et al. eLife 2016;5:e16220. DOI: 10.7554/eLife.16220 15 of 28
Short report Genes and Chromosomes Human Biology and Medicine
identified by IPA that predicted inactivation of both the MYCN transcriptional program and the EIF2
pathway showed a substantial degree of overlap (Figure 7A,C, Supplementary file 1E). In mono-
cytes and T cells, the genes common between the two repressed programs encode components of
both the small and large ribosome subunits (i.e. RPS proteins in the 40S complex and RPL proteins
in the 60S complex) (Figure 7A,C, Figure 7—figure supplements 1 and 2). Genes exclusive to the
MYCN signature are enriched for metabolic enzymes and translation elongation factors (EEFs).
Genes exclusive to the EIF2 signature are enriched for translation initiation factors (EIFs) and addi-
tional ribosomal proteins. Examples of RPSs, RPLs, EEFs and EIFs downregulated in trisomy 21 cells
are shown in Figure 7B and D (see also Figure 7—figure supplements 1 and 2). This result is con-
sistent with reports that interferon treatment results in a global decrease in expression of the transla-
tion machinery in primary PBMCs (Taylor et al., 2007; Gupta et al., 2012). Altogether, these results
indicate that T21 causes a general downregulation of dozens of components of the protein synthesis
machinery in circulating monocytes and T cells.
Trisomy 21 elicits cell type-specific IFN transcriptional responsesHaving performed transcriptome analysis of cell types of different origins, we investigated to what
degree the gene expression changes caused by T21 are affected by cell type-specific regulatory
landscapes. A principal component analysis (PCA) shows the fibroblast transcriptomes segregating
strongly (PC1 80.5%) from those of the cell types of hematopoietic origin (Figure 8A). B cell-derived
lymphoblastoids and T lymphocytes cluster together, yet they segregate away from the monocytes
of myeloid origin (PC2, 11.3%). Within this background, the global impact of the trisomy on the tran-
scriptome is secondary to the effects of the cell type of origin (Figure 8B). Next, we asked to what
degree genes encoded on chr21 could be affected by these cell type-specific regulatory landscapes.
Indeed, it was easy to identify many chr21 genes displaying obvious differences in relative expres-
sion among cell types. For example, APP is relatively more highly expressed in fibroblasts, U2AF1
more highly expressed in lymphoblastoids, ETS2 more highly expressed in monocytes, and DYRK1A
more highly expressed in T cells (Figure 8C, Supplementary file 1F). The IFN receptors on chr21
also showed some degree of cell type-specific expression (e.g. IFNAR2 lowly expressed in fibro-
blasts, IFNGR2 lowly expressed in T cells, Figure 8D). Furthermore, relative differences in cell type-
specific expression is also evident for canonical ISGs (Figure 8E). These observations led us to ask to
what degree the IFN transcriptional response elicited by T21 is conserved across cell types. To
address this, we compared the DEGs comprising the T21-induced Interferon alpha signature identi-
fied by IPA in each cell type (Figure 6C). Remarkably, this exercise revealed a large degree of cell
type-specificity, with most IFN-related genes being differentially expressed in only one cell type
(Figure 8F). In fact, the only common genes among all four signatures are three IFN-a-related genes
encoded on chr21: IFNAR1, IFNAR2, and MX1. Expectedly, lymphoblastoids and T cells showed a
greater degree of overlap than other pairwise comparisons. Overall, these results indicate that while
T21 operates within, and is modulated by, cell type-specific regulatory landscapes, it nonetheless
activates the IFN transcriptional response consistently by inducing different gene sets within this pro-
gram. This is in stark contrast to the notion that T21 affects gene expression either stochastically or
through large rearrangements of chromatin domains. In fact, Manhattan plots of the DEGs in mono-
cytes and T cells derived from the same individuals not only confirm the absence of large domains of
chromatin deregulation, but also highlight the high degree of cell type-specific changes caused by
the trisomy (Figure 8G).
DiscussionWe report here that T21 leads to consistent activation of the IFN pathway. As discussed below, IFN
hyperactivation could explain many of the developmental and clinical impacts of T21. In fact, we
posit that Down syndrome can be understood largely as an interferonopathy, and that the variable
clinical manifestations of T21 could be explained by inter-individual differences in adaptation to
chronic IFN hyperactivity.
The link between IFN signaling and T21 is not entirely unprecedented. More than 40 years ago, it
was found that human T21 fibroblasts, but not those trisomic for chr13 or chr18, have increased sen-
sitivity to IFN exposure and are more resistant to viral infection (Tan et al., 1974a, 1974b). In fact,
somatic cell hybrid experiments showed that chr21 is sufficient to confer sensitivity to human IFN in
Sullivan et al. eLife 2016;5:e16220. DOI: 10.7554/eLife.16220 16 of 28
Short report Genes and Chromosomes Human Biology and Medicine
mouse cells (Slate et al., 1978). Pioneering work by Maroun and colleagues using an early mouse
model of DS carrying an extra copy of chr16 that harbors orthologues of many human chr21 genes,
including the four IFN receptors, clearly implicated IFN as a contributor to the deleterious effects of
the trisomy. For example, treatment of pregnant female mice with anti-IFN antibodies resulted in
the partial rescue of embryonic growth defects and embryonic lethality (Maroun, 1995). Further-
more, partial normalization of gene dosage for the IFN receptor subunits via gene knockout was
shown to improve embryonic development and survival of T21 cortical neurons in vitro
(Maroun et al., 2000). More recently, a study found global disruption of IFN-related gene networks
in the brains of the Ts1Cje mouse model of DS, which also carries triplication of the IFN receptor
subunits (Ling et al., 2014). However, deeper investigations of IFN signaling in human T21 cells and
tissues are largely absent from the literature of the past 30 years, with a few exceptions, such as the
description of IFN signaling as a contributor to periodontal disease in DS (Tanaka et al., 2012;
Iwamoto et al., 2009). Collectively, these reports and the genomics analyses reported here demon-
strate that activation of the IFN pathway in T21 cells is a widespread phenomenon that occurs in
diverse tissues, and that is relevant to human Down syndrome as well as the various mouse models
of DS with triplication of IFN receptors.
Constitutive activation of IFN signaling could conceivably explain a large number of comorbidities
associated with DS, such as the increased risk of transient myeloproliferative disorder, diverse leuke-
mias, several autoimmune disorders (Richardson et al., 2011), and perhaps even the lower rate of
solid tumors (Zitvogel et al., 2015; Hasle et al., 2016). Importantly, several JAK inhibitors are either
approved or being tested in clinical trials for the treatment of several conditions associated with DS
–albeit in the typical population–, including myeloproliferative, inflammatory and autoimmune disor-
ders, as well as leukemia (Padron et al., 2016; Spaner et al., 2016; Tefferi et al., 2011; Quintas-
Cardama et al., 2010; Shi et al., 2014; Keystone et al., 2015; Jabbari et al., 2015). It should be
noted, however, that the dose limiting toxicities of JAK inhibitors, like ruxolitinib, are anemia and
thrombocytopenia (McKeage, 2015; Plosker, 2015). Therefore, rigorous clinical investigations will
be required to define if there is a therapeutic window in which these drugs would benefit individuals
with DS before the appearance of toxicity. Additional research will also be required to elucidate the
interplay between hyperactive IFN signaling in DS with other important factors encoded on chr21
(e.g. DYRK1A, APP) (Malinge et al., 2012; Wiseman et al., 2015) or elsewhere in the genome, that
have been involved in the development of the specific comorbidities. For example, the Sonic Hedge-
hog (SHH) pathway has been implicated in the etiology of structural and cognitive defects in a
mouse model of DS, including cerebellar atrophy (Das et al., 2013). Interestingly, IFN signaling has
been shown to crosstalk with the SHH pathway, and cerebellar atrophy is also a hallmark of Type I
Interferonopathies (Moisan et al., 2015; Sun et al., 2010; McGlasson et al., 2015; Crow and
Manel, 2015).
Increased JAK/STAT signaling has been postulated to contribute to some of the neurological fea-
tures of DS (Lee et al., 2016). Notably, it has been reported that therapeutic exposure to interferons
can produce diverse types of neurological dysfunction, including depression, cerebral palsy and
spastic diplegia (Wichers et al., 2005; Grether et al., 1999; Worle et al., 1999; Barlow et al.,
1998). Furthermore, a large number of neurological conditions have been linked to deregulated IFN
signaling, most prominent among them the so called Type I Interferonopathies (McGlasson et al.,
2015; Crow and Manel, 2015). Therefore, we propose that constitutive activation of the IFN path-
way in the central nervous system of individuals with DS is responsible for many of the neurological
problems caused by the trisomy. In particular, IFN-mediated activation of microglia could lead to
neurotoxicity by several mechanisms, including serotonin depletion, generation of reactive oxygen
species, and excitatory toxicity, which could potentially be ameliorated with inhibitors of the IDO1
enzyme, a key ISG (Wichers and Maes, 2004; Wichers et al., 2005). Although much research
remains to be done, it is now possible to envision early intervention strategies to ameliorate the vari-
able ill effects of T21 by using pharmacological inhibitors of the IFN pathway.
Sullivan et al. eLife 2016;5:e16220. DOI: 10.7554/eLife.16220 17 of 28
Short report Genes and Chromosomes Human Biology and Medicine

Materials and methods
Cell culture and drug treatmentsSix human fibroblast lines from individuals with trisomy 21 (T21) and six approximately age- and sex-
matched fibroblast lines from typical individuals (D21) were obtained from the Coriell Cell
Repository (Camden, NJ) and immortalized with hTERT as described (Lindvall et al., 2003). EBV-
immortalized lymphoblastoid lines, three T21 and three D21, were obtained from the Nexus Clinical
Data Registry and Biobank at the University of Colorado. Fibroblasts were maintained in DMEM and
lymphoblastoids were maintained in RPMI medium in a humidified 5% CO2 incubator at 37˚C.The media was supplemented with 10% fetal bovine serum and 1% antibiotic/antimycotic and was
changed every 3–6 days. Fibroblast monolayers were serially passaged by trypsin-EDTA treatment,
and lymphoblastoids were serially passaged via dilution in fresh media. Fibroblast lines used in this
study are described in Figure 1—figure supplement 1. All cell lines were confirmed mycoplasma
negative by PCR as previously described (Uphoff and Drexler, 2002). T21 status was authenticated
as described in Figure 1—figure supplement 1D. Research Resource Identifiers (RRIDs) for fibro-
blast cell lines are:
Line RRID #
GM08447 CVCL_7487
GM05659 CVCL_7434
GM00969 CVCL_7311
GM02036 CVCL_7348
GM03377 CVCL_7384
GM03440 CVCL_7388
GM04616 CVCL_V475
AG05397 CVCL_L780
AG06922 CVCL_X793
GM02767 CVCL_V469
AG08941 CVCL_X871
AG08942 CVCL_X872
Interferon treatment in cell cultureRecombinant human interferons alpha 2A (11101–2, R&D Systems), beta (300-02BC, Peprotech) and
gamma (PHC4031, Gibco) were obtained from Thermo Fisher Scientific (Waltham, MA), aliquoted,
and stored at �80˚C. Three T21 fibroblast lines and their age- and sex-matched D21 fibroblast coun-
terparts were plated at equivalent densities and grown 72 hr to ensure similar cycling of the cells,
then re-plated at equivalent densities and incubated overnight. Media was removed the following
day and replaced with media containing the indicated doses of interferon ligands dissolved in PBS
or vehicle (PBS alone). All media were normalized for final PBS concentration at highest interferon
dose. Cells were grown an additional 24 hr after interferon application, then the media removed,
cells washed with PBS and harvested via cell scraping. The harvested cells were pelleted and lysed in
RIPA buffer with protease and phosphatase inhibitors.
JAK inhibition in cell cultureRuxolitinib (INCB018424) was obtained from Selleck Chemicals (Houston, TX, S1378) and dissolved
in DMSO to make a 5 mM stock solution and stored at �20˚C. Fibroblast lines were plated at equiv-
alent cell numbers and allowed to grow for 72 hr in order to condition the media with secreted fac-
tors. The conditioned media was harvested and stored at 4˚C for 3–7 days prior to use. One T21
fibroblast line and its age- and sex-matched D21 fibroblast counterpart were plated at equivalent
cell numbers in their respective conditioned media and incubated overnight. Plating media was
removed the following day and replaced with conditioned media containing the indicated doses of
Sullivan et al. eLife 2016;5:e16220. DOI: 10.7554/eLife.16220 18 of 28
Short report Genes and Chromosomes Human Biology and Medicine
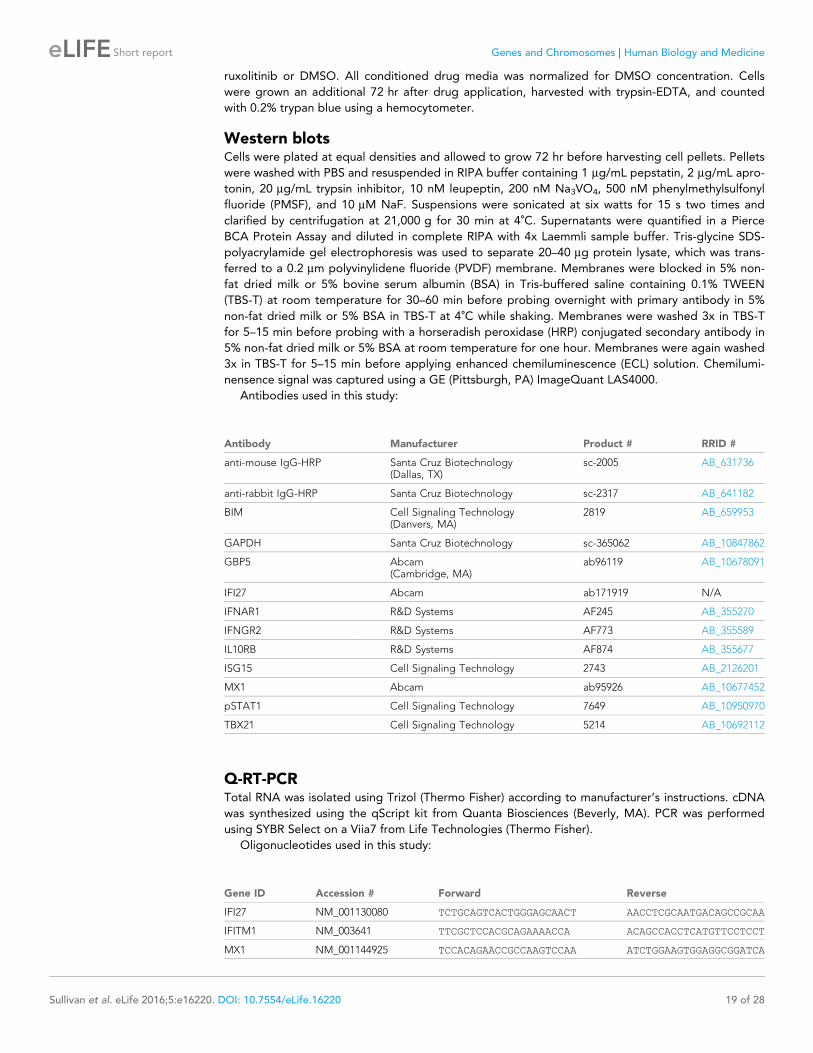
ruxolitinib or DMSO. All conditioned drug media was normalized for DMSO concentration. Cells
were grown an additional 72 hr after drug application, harvested with trypsin-EDTA, and counted
with 0.2% trypan blue using a hemocytometer.
Western blotsCells were plated at equal densities and allowed to grow 72 hr before harvesting cell pellets. Pellets
were washed with PBS and resuspended in RIPA buffer containing 1 mg/mL pepstatin, 2 mg/mL apro-
tonin, 20 mg/mL trypsin inhibitor, 10 nM leupeptin, 200 nM Na3VO4, 500 nM phenylmethylsulfonyl
fluoride (PMSF), and 10 mM NaF. Suspensions were sonicated at six watts for 15 s two times and
clarified by centrifugation at 21,000 g for 30 min at 4˚C. Supernatants were quantified in a Pierce
BCA Protein Assay and diluted in complete RIPA with 4x Laemmli sample buffer. Tris-glycine SDS-
polyacrylamide gel electrophoresis was used to separate 20–40 mg protein lysate, which was trans-
ferred to a 0.2 mm polyvinylidene fluoride (PVDF) membrane. Membranes were blocked in 5% non-
fat dried milk or 5% bovine serum albumin (BSA) in Tris-buffered saline containing 0.1% TWEEN
(TBS-T) at room temperature for 30–60 min before probing overnight with primary antibody in 5%
non-fat dried milk or 5% BSA in TBS-T at 4˚C while shaking. Membranes were washed 3x in TBS-T
for 5–15 min before probing with a horseradish peroxidase (HRP) conjugated secondary antibody in
5% non-fat dried milk or 5% BSA at room temperature for one hour. Membranes were again washed
3x in TBS-T for 5–15 min before applying enhanced chemiluminescence (ECL) solution. Chemilumi-
nensence signal was captured using a GE (Pittsburgh, PA) ImageQuant LAS4000.
Antibodies used in this study:
Antibody Manufacturer Product # RRID #
anti-mouse IgG-HRP Santa Cruz Biotechnology(Dallas, TX)
sc-2005 AB_631736
anti-rabbit IgG-HRP Santa Cruz Biotechnology sc-2317 AB_641182
BIM Cell Signaling Technology(Danvers, MA)
2819 AB_659953
GAPDH Santa Cruz Biotechnology sc-365062 AB_10847862
GBP5 Abcam(Cambridge, MA)
ab96119 AB_10678091
IFI27 Abcam ab171919 N/A
IFNAR1 R&D Systems AF245 AB_355270
IFNGR2 R&D Systems AF773 AB_355589
IL10RB R&D Systems AF874 AB_355677
ISG15 Cell Signaling Technology 2743 AB_2126201
MX1 Abcam ab95926 AB_10677452
pSTAT1 Cell Signaling Technology 7649 AB_10950970
TBX21 Cell Signaling Technology 5214 AB_10692112
Q-RT-PCRTotal RNA was isolated using Trizol (Thermo Fisher) according to manufacturer’s instructions. cDNA
was synthesized using the qScript kit from Quanta Biosciences (Beverly, MA). PCR was performed
using SYBR Select on a Viia7 from Life Technologies (Thermo Fisher).
Oligonucleotides used in this study:
Gene ID Accession # Forward Reverse
IFI27 NM_001130080 TCTGCAGTCACTGGGAGCAACT AACCTCGCAATGACAGCCGCAA
IFITM1 NM_003641 TTCGCTCCACGCAGAAAACCA ACAGCCACCTCATGTTCCTCCT
MX1 NM_001144925 TCCACAGAACCGCCAAGTCCAA ATCTGGAAGTGGAGGCGGATCA
Sullivan et al. eLife 2016;5:e16220. DOI: 10.7554/eLife.16220 19 of 28
Short report Genes and Chromosomes Human Biology and Medicine

MX2 NM_002463 TCGGACTGCAGATCAAGGCTCT CGTGGTGGCAATGTCCACGTTA
OAS1 NM_001032409 CCGCATGCAAATCAACCATGCC TTGCCTGAGGAGCCACCCTTTA
OAS2 NM_001032731 AGGTGGCTCCTATGGACGGAAA CGAGGATGTCACGTTGGCTTCT
RNA-seq from cell linesBiological replicates for each cell line were obtained by independently growing cells in duplicate.
Total RNA was purified from ~1 � 107 logarithmically growing cells using Qiagen (Valencia, CA)
RNeasy columns per manufacturer’s instructions including on-column DNAse digestion. RNAs were
quantified using a Take3 Micro-Volume plate in a Biotek (Winooski, VT) Synergy2 plate reader and
their integrity confirmed using the Agilent RNA 6000 Pico Kit and the Agilent (Santa Clara, CA) 2100
Bioanalyzer System. 500 ng of total RNA with an RNA Integrity Number (RIN) greater than 7 were
used to prepare sequencing libraries with the Illumina (San Diego, CA) TruSeq Stranded mRNA
Library Prep Kit. Libraries were sequenced with an Illumina HiSeq 2000 System at the UCCC Geno-
mics Core.
Isolation of monocytes and T cells by fluorescence activated cell sorting(FACS)Peripheral blood was collected in EDTA vacutainer tubes from 10 individuals with T21 and seven
D21 controls. Blood was centrifuged at 500 g for 15 min to separate plasma, buffy coat and red
blood cells (RBCs). Peripheral Blood Mononuclear Cells (PBMCs) were isolated from the buffy coat
fraction by RBC lysis and 1x PBS wash according to manufacturer’s instructions (BD, 555899). After
RBC lysis and PBS wash, PBMCs were stained for sorts at 10–20 � 107 cells/ml then diluted to
approximately 5 � 107 cells/ml in flow cytometry sorting buffer (1x PBS, 1 mM EDTA, 25 mM HEPES
pH 7.0, 1% FBS). All staining was performed in flow cytometry sorting buffer with fluorochrome-con-
jugated antibodies for at least 15 min on ice while protected from light. Single cell suspensions were
stained with CD45 (eBioscience, San Diego, CA, HI30, RRID:AB_467273), CD14 (Biolegend, San
Diego, CA, 63D3, RRID:AB_2571928), CD3 (Biolegend, OKT3, RRID:AB_571907), CD16 (Biolegend,
B73.1, RRID:AB_2616914), CD19 (Biolegend, HIB19, RRID:AB_2073119), CD56 (Biolegend, 5.1H11,
RRID:AB_2565855) and CD34 (Biolegend, 561, RRID:AB_343601) antibodies. CD45+CD14+CD19-
CD3-CD56- Monocytes and CD45+CD3+CD14-CD19-CD56- T cells were FAC-sorted into Dulbec-
co’s Modified Eagle Medium (DMEM) supplemented with 4.5 g/L D-Glucose, L-Glutamine, and 5%
FBS, on the MoFlo Astrios (Beckman Coulter, Brea, CA) at the CU-SOM Cancer Center Flow Cytom-
etry Shared Resource.
RNA extraction from monocytes and T cellsFAC-sorted cells were centrifuged at 500 g for 5 min and the media removed. Cells were resus-
pended in 350 ml RLT plus (Qiagen) and Beta-mercaptoethanol (BME) lysis buffer (10 mL BME:1 mL
RLT plus) for downstream RNA isolation. Lysed cells were immediately stored at �80˚C and RNA
was later extracted using the AllPrep DNA/RNA/Protein Mini Kit according to manufacturer’s instruc-
tions (Qiagen, 80004). RNA quality was determined by BioAnalyzer (Agilent) and quantified by Qubit
(Life Technologies). Samples with RIN of 7 or greater and a minimum of 500 ng total RNA were used
for library prep and sequencing.
RNA-seq data analysisAnalysis of library complexity and high per-base sequence quality across all reads (i.e. q > 30) was
performed using FastQC (v0.11.2) software (Andrews, 2010). Low quality bases (q < 10) were
trimmed from the 3’ end of reads and short reads (<30 nt after trimming) and adaptor sequences
were removed using the fastqc-mcf tool from ea-utils. Common sources of sequence contamination
such as mycoplasma, mitochondria, ribosomal RNA were identified and removed using FASTQ
Screen (v0.4.4). Reads were aligned to GRCh37/hg19 using TopHat2 (v2.0.13, –b2-sensitive –keep-
fasta-order –no-coverage-search –max-multihits 10 –library-type fr-firststrand) (Kim et al., 2013).
High quality mapped reads (MAPQ > 10) were filtered with SAMtools (v0.1.19) (Li et al., 2009).
Reads were sorted with Picardtools (SortSAM) and duplicates marked (MarkDuplicates). QC of final
Sullivan et al. eLife 2016;5:e16220. DOI: 10.7554/eLife.16220 20 of 28
Short report Genes and Chromosomes Human Biology and Medicine

reads was performed using RSeQC (v2.6) (Wang et al., 2012). Gene level counts were obtained
using HTSeq (v0.6.1,–stranded=reverse –minaqual=10 –type=exon –idattr=gene –mode= intersec-
tion-nonempty, GTF-ftp://igenome:[email protected]/Homo_sapiens/UCSC/hg19/
Homo_sapiens_UCSC_hg19.tar.gz) (Anders et al., 2015). Differential expression was determined
using DESeq2 (v1.6.3) and R (3.10) (Love et al., 2014). Volcano plots, manhattan plots, and violin
plots, were made using the Python plotting library ’matplotlib’ (http://matplotlib.org).
shRNA screeningA pool of plasmids encoding 3,075 shRNAs targeting 654 kinases (kinome library) in the pLKO.1
backbone produced by The RNAi Consortium (TRC, Sigma-Aldrich, St. Louis, MO) were obtained
from the University of Colorado Cancer Center Functional Genomics Shared Resource, as were the
pD8.9 and pCMV-VSV-G lentiviral packaging plasmids. 2 mg of kinome library plasmid DNA at 100
ng/mL was mixed with 2 mg of packaging plasmid mix (at a 9:1 ratio of pD8.9:pCMV-VSV-G) at 100
ng/mL and incubated with 12 mg of Polyethylenimine for 15 min at RT. The entire mixture was then
added to 3 � 105 HEK293FT packaging cells to give 100X coverage. 16 hr after transfection, media
on cells was replaced with complete DMEM. 24 hr after media replacement, target cells were
seeded at 1 � 105 cells/ well in a 6-well plate. Three wells for each line were combined at the time
of harvest to reach a starting number of 3 � 105 cells per condition (again 100X coverage of the
kinome library). 24 hr after seeding, the media from each well of packaging cells (now containing
lentiviral library particles) was filtered through 0.45 mm cellulose acetate filters, diluted 1:3 into 6 mL
of DMEM, and mixed with 6 mL of 8 mg/mL polybrene to facilitate transduction. This mixture was
then used to transduce 3 wells (one total replicate) of each target cell line. 24 hr after transduction
viral transduction, the media was replaced with fresh media. Finally, after an additional 24 hr, selec-
tion began by adding fresh DMEM with 1 mg/mL puromycin. Cells were then propagated for 14
days and genomic DNA harvested from all remaining cells using the Qiagen DNeasy Blood and Tis-
sue kit with the optional RNAse A treatment step. Genomic DNA was quantified by A260 using a
Take3 micro-volume plate on a Synergy2 Microplate Reader. The quality of the genomic DNA was
confirmed via electrophoresis on a 0.5% TAE agarose gel. Screens were performed in three indepen-
dent biological replicates for each of the 12 fibroblast cell lines.
shRNA library preparationThe library preparation strategy uses genomic DNA and two rounds of PCR in order to isolate the
shRNA cassette and prepare a single strand of the hairpin for sequencing by means of an XhoI
restriction digest in the stem loop region. This is critical as the hairpin secondary structures of
shRNAs are not amenable to NGS and the TRC shRNAs do not have a long enough loop to allow
PCR amplification of one shRNA arm in a single step. The first step in sequencing library preparation
is to calculate how much genomic DNA must be used for PCR1 which isolates and amplifies the
shRNA cassettes from genomic DNA using Phusion Polymerase. The oligonucleotides for PCR1
anneal to regions inside of the LTRs that are common to all clones in the library and should, there-
fore, amplify all shRNA cassettes with equal efficiency. Each reaction mixture for PCR1 consisted of
10 mL 5X Phusion HF buffer, 1 mL dNTPs (10 mM each), 2.5 mL pLKO Forward and Reverse primers
(10 mM), 1 mL of 2 unit/ml Phusion Polymerase, 500 ng genomic DNA, and dH2O to 50 mL. The
cycling conditions were as follows: 1 cycle of 98˚C for 5 min, 15 to 25 cycles of 98˚C for 30 s, 70˚Cfor 30 s, 72˚C for 30 s, and 1 cycle of 72˚C for 7 min. 5 mL of each PCR1 were run on a 2% TAE aga-
rose gel in order to visualize the expected band of 497 bp. It should be noted that the optimal
PCR1 cycle number must be empirically determined for each library and to limit cycle numbers to
minimize the effects of amplification bias. The correct product of PCR1 is 497 bp; however, excessive
cycle numbers can result in the appearance of a slower migrating band. This band represents an
annealing event between two amplification products with different shRNA sequences. As the major-
ity of the 497 bp amplicon is common to all products, denatured PCR products can anneal to one
another when not out-competed by an excess of primer in later cycles. This aberrant product does
not correctly anneal within the central shRNA-containing sequence, therefore disrupting the double-
stranded XhoI site required for the subsequent restriction digestion. Carefully determining the
appropriate number of cycles prevents the appearance of this undesired product. After establishing
an optimal cycle number, we performed 12 identical PCR1 reactions in order to amplify sufficient
Sullivan et al. eLife 2016;5:e16220. DOI: 10.7554/eLife.16220 21 of 28
Short report Genes and Chromosomes Human Biology and Medicine

amounts of genomic DNA and pooled them all prior to cleanup with a QIAquick PCR Purification
Kit.
XhoI digest1 mg of the resulting DNA was digested with XhoI overnight at 37˚C. Digest reactions consisted of
3.5 mL 10X FD buffer, 1 mL of 20,000 units/mL XhoI, 1 mg of DNA and dH2O to 35 mL. Heat inactiva-
tion of XhoI is not recommended, as the high temperatures result in reappearance of the spurious
annealing products mentioned above, leading to a disruption of the XhoI overhang required for liga-
tion. For the TRC1 and TRC1.5 libraries, there are two XhoI sites within the product of PCR1, result-
ing in fragments of 271, 43 and 183 bp. In order to purify the desired fragment, the entire digest
was run on a 2% TAE agarose gel and purified the 271 bp fragment using a QIAquick Gel Extraction
Kit. Once the band was excised, three volumes of buffer QG were added and the mixture heated at
30˚C to dissolve the agarose. Lower melting temperatures are recommended so as not to denature
the complementary double-stranded shRNA cassettes, which may not reanneal to their cognate
strand. After the agarose was dissolved, one volume of isopropanol was added and protocol
resumed following the manufacturer’s instructions including the optional addition of NaOAc.
Ligation of barcoded linkersWe prepared the barcoded linkers required for ligation by resuspending the lyophilized oligonucleo-
tides in ST buffer (10 mM Tris pH 8.0, 50 mM NaCl) to 200 mM and combining 25 mL of each for a
final concentration of 100 mM. The mixture was heated to 94˚C for 10 min and gradually cooled to
ensure proper annealing. Single-stranded oligonucleotides were removed from annealed oligonu-
cleotides using Illustra MicroSpin G-25 columns. The sense (S1-S4) oligonucleotides are 5’-phosphor-
ylated and the antisense oligonucleotides (AS1-AS4) each contain a single phosphorothioate bond
at the 3’ end to stabilize them and are designed to prevent the reformation of a functional XhoI site.
The barcodes within these linkers are used for multiplexing and their length ensures they are com-
patible with the Illumina HiSeq 2000. Shorter barcode sequences may be compatible with other
sequencing platforms. The selected barcoded linkers were added to ligation reactions with 100 ng
of each purified 271 bp XhoI fragment, 3.5 mL 10X T4 DNA ligase buffer, 4 mL of 1 mM barcoded
linker, 1 mL T4 DNA ligase and dH2O to 35 mL. Ligations were performed overnight at 16˚C. Theentire ligation was run on a 2% TAE agarose gel and the resulting 312 bp band purified using the
QIAquick Gel Extraction Kit in the same manner as previously described.
PCR2The final step in the preparation of the sequencing library is a second PCR with oligonucleotides
that contain the Illumina adaptors required for bridge amplification and sequencing. In this PCR, the
number of cycles is minimized in order to avoid PCR bias as well as errors that could affect sequenc-
ing. The reaction for PCR2 was as follows: 10 mL 5X Phusion HF buffer, 1 mL dNTPs (10 mM each),
2.5 mL Forward adapter primer (10 mM) 2.5 mL, Reverse adapter primer (10 mM), 1 mL Phusion DNA
polymerase 10 ng barcoded DNA, and dH2O to 50 mL. The cycling program consisted of 1 cycle of
98˚C for 2 min, 2 cycles of 98˚C for 30 s, 62˚C for 30 s, 72˚C for 30 s, 7 cycles of 98˚C for 30 s, 72˚Cfor 30 s and 1 cycle of 72˚C for 3 min. The final 141 bp product was purified on a 2% TAE-agarose
gel followed by QIAquick Gel Extraction as described above.
Illumina sequencingWe assessed the purity of our sequencing library using the Bioanalyzer High Sensitivity DNA Kit (Agi-
lent-5067-4626) and confirmed the presence of a single 141 bp peak, indicating one PCR product at
the appropriate size. We utilized a multiplexing strategy consisting of four different barcodes with
each nucleotide represented at each position of the barcode, allowing us to sequence four samples
in each lane on a HiSeq 2000 Illumina instrument. To accomplish this, each sample was quantified
and mixed together at a final concentration of 10 ng/mL and using Illumina-specific oligonucleotides
and qPCR, we determined the cluster formation efficiency (i.e. effective concentration) of our library
to be slightly greater than that of a known library. Accordingly, we loaded the flow cell at 5 pM and
included a 10% FX-174 spike-in, which aids in quality control of cluster formation and sequencing on
the Illumina platform. Cluster formation efficiency and the concentration of library to be loaded on
Sullivan et al. eLife 2016;5:e16220. DOI: 10.7554/eLife.16220 22 of 28
Short report Genes and Chromosomes Human Biology and Medicine

the flow cell needs to be determined empirically for each library preparation. These loading condi-
tions yielded cluster densities between 733,000 clusters/mm2 and 802,000 clusters/mm2 and
between 203 and 222 million reads per lane.
shRNA screen analysisshRNA data were analyzed in a similar fashion to RNA-seq data. Briefly, quality control was per-
formed with FastQC, reads were trimmed to include only shRNA sequences using FASTQ trimmer,
and filtered with the FASTQ Quality Filter. Reads were then aligned to a custom reference library of
shRNA sequences using TopHat2. Three out of 36 samples were removed based on poor perfor-
mance in unsupervised hierarchical clustering and/or principal component analysis, but each fibro-
blast cell line retained at least two biological replicates and nine of 12 retained all three replicates.
Count tables were generated using HTSeq and differential expression determined by DESeq2.
SOMAScan proteomicsCell lysates from all 12 fibroblast cell lines were analyzed using SOMAscan v4.0 according to manu-
facturer’s instructions and as previously reported (Hathout et al., 2015; Mehan et al., 2014). Data
were analyzed using the QPROT statistical package (Choi et al., 2015).
Isolation of RNA from LSK cells for RNA-seqThe whole bone marrow was harvested from the long bones of Dp16 mice (RRID:IMSR_JAX:013530)
and matched littermate controls. Cells were first purified using hemolysis to remove RBCs and then
stained and sorted for LSK cells (CD3-, Ter119-, Mac1-, Gr1-, B220-, Sca1+, cKit) using the Moflo
XDP 70 FACS sorter. RNA was then isolated from these cells using the RNeasy Kit from Qiagen.
AcknowledgementsThis work was supported primarily by the Linda Crnic Institute for Down Syndrome and the Anna
and John J Sie Foundation. We thank T Blumenthal and J Costello for stimulating discussion and crit-
ical reading of this manuscript. We also thank the individuals with Down syndrome that donated the
biological samples that enabled these studies. We also thank the Functional Genomics, Genomics,
and Flow Cytometry Shared Resources at the University of Colorado Cancer Center.
Additional information
Competing interests
JME: Reviewing editor, eLife. The other authors declare that no competing interests exist.
Funding
Funder Grant reference number Author
University of Colorado Linda Crnic Institute forDown Syndrome
Joaquın M Espinosa
Howard Hughes Medical Insti-tute
Joaquın M Espinosa
National Institutes of Health R01CA117907 Joaquın M Espinosa
National Science Foundation MCB-1243522 Joaquın M Espinosa
Anna and John J. Sie Founda-tion
Joaquın M Espinosa
National Institutes of Health P30CA046934-27 Joaquın M Espinosa
The funders had no role in study design, data collection and interpretation, or the decision tosubmit the work for publication.
Author contributions
KDS, HCL, AAH, LPJ, KPS, LAL, Conception and design, Acquisition of data, Analysis and interpreta-
tion of data, Drafting or revising the article; AP, MDG, JD, JME, Conception and design, Analysis
Sullivan et al. eLife 2016;5:e16220. DOI: 10.7554/eLife.16220 23 of 28
Short report Genes and Chromosomes Human Biology and Medicine
and interpretation of data, Drafting or revising the article; JMC, Conception and design, Acquisition
of data, Analysis and interpretation of data; EBG, Conception and design, Acquisition of data
Author ORCIDs
Joaquın M Espinosa, http://orcid.org/0000-0001-9048-1941
Ethics
Human subjects: All individuals in this study were consented on Colorado Multiple Institutional
Review Board (COMIRB)-approved protocols (Protocol Numbers: 11-1790 or 15-1774) and samples
collected and processed as describe in the Materials and Methods.
Animal experimentation: This study was performed in strict accordance with the recommendations
in the Guide for the Care and Use of Laboratory Animals of the National Institutes of Health. All of
the animals were handled according to approved institutional animal care and use committee
(IACUC) protocols of the University of Colorado. The protocol was approved by the University of
Colorado IACUC (Protocol Number: B-41413(04)1E).
Additional files
Supplementary files. Supplementary file 1. (A) Fibroblast, (B) lymphoblastoid, (C) Dp16, (D) monocyte, (E) T cell and (F)
meta RNA-seq. DESeq2 analysis of T21 versus D21 fibroblasts. Columns include: (A) Chromosome,
(B) Gene start coordinate, (C) Gene end coordinate, (D) Gene strand, (E) Gene name, (F) basemean
(average read count across all samples), (G) basemeanD21 (average read count across all D21 sam-
ples), (H) basemeanT21 (average read count across all T21 samples), (I) foldChange (basemeanT21/
basemeanD21), (J) log2FoldChange, (K) foldChange_adj (DESeq2 adjusted fold change), (L) log2-
FoldChange_adj, (M) pval (p-value), (N) padj (Benjamini-Hochberg adjusted p-value).
DOI: 10.7554/eLife.16220.024
. Supplementary file 2. Fibroblast kinome shRNA screen analysis. DESeq2 analysis of kinome shRNA
screens in T21 versus D21 fibroblasts. Columns include: (A) TRC number (B) shRNA targeting loca-
tion (C) Chromosome, (D) Genomic coordinates, (E) Gene strand, (F) Gene name, (G) RefSeq ID (H)
basemean (average read count across all samples), (I) basemeanD21 (average read count across all
D21 samples), (J) basemeanT21 (average read count across all T21 samples), (K) foldChange (base-
meanT21/basemeanD21), (L) log2FoldChange, (M) foldChange_adj (DESeq2 adjusted fold change),
(N) log2FoldChange_adj, (O) pval (p-value), (P) padj (Benjamini-Hochberg adjusted p-value).
DOI: 10.7554/eLife.16220.025
. Supplementary file 3. Fibroblast SOMAscan analysis. QPROT analysis of T21 versus D21 fibroblasts.
Columns include: (A) Chromosome, (B) Gene start coordinate, (C) Gene end coordinate, (D) Gene
strand, (E) Gene name, (F) RFUmean (average RFU across all samples), (G) RFUmeanD21 (average
RFU across all D21 samples), (H) RFUmeanT21 (average RFU across all T21samples), (I) foldChange
(RFUmeanT21/RFUmeanD21), (J) log2FoldChange, (K) Zstatistic (Z-score from QPROT), (L) FDRup
(FDR of upregulated proteins), (M) FDRdown (FDR of downregulated proteins).
DOI: 10.7554/eLife.16220.026
Major datasets
The following datasets were generated:
Author(s) Year Dataset title Dataset URL
Database, license,and accessibilityinformation
Sullivan KD, PandeyA, Jackson LP,Espinosa JM
2016 RNAseq from disomic and trisomicFibroblasts and Lymphoblasts
http://www.ncbi.nlm.nih.gov/geo/query/acc.cgi?acc=GSE79842
Publicly available atNCBI GeneExpression Omnibus(accession no:GSE79842)
Sullivan et al. eLife 2016;5:e16220. DOI: 10.7554/eLife.16220 24 of 28
Short report Genes and Chromosomes Human Biology and Medicine
Sullivan KD, PandeyA, Jackson LP,Espinosa JM
2016 shRNA cassette sequencing fromdisomic and trisomic fibroblastscultured in the presence of shRNAkinome library for 14 days
http://www.ncbi.nlm.nih.gov/geo/query/acc.cgi?acc=GSE79840
Publicly available atNCBI GeneExpression Omnibus(accession no:GSE79840)
Sullivan KD, PandeyA, Smith KP, Espi-nosa JM
2016 RNAseq from disomic and trisomicT cells and monocytes
http://www.ncbi.nlm.nih.gov/geo/query/acc.cgi?acc=GSE84531
Publicly available atNCBI GeneExpression Omnibus(accession no:GSE84531)
Liggett LA, SullivanKD, Pandey A
2016 RNAseq from Dp16 and controlmice
http://www.ncbi.nlm.nih.gov/geo/query/acc.cgi?acc=GSE84526
Publicly available atNCBI GeneExpression Omnibus(accession no:GSE84526)
ReferencesAhmed MM, Dhanasekaran AR, Tong S, Wiseman FK, Fisher EM, Tybulewicz VL, Gardiner KJ. 2013. Proteinprofiles in Tc1 mice implicate novel pathway perturbations in the Down syndrome brain. Human MolecularGenetics 22:1709–1724. doi: 10.1093/hmg/ddt017
Alexander M, Petri H, Ding Y, Wandel C, Khwaja O, Foskett N. 2016. Morbidity and medication in a largepopulation of individuals with Down syndrome compared to the general population. Developmental Medicineand Child Neurology 58:246–254. doi: 10.1111/dmcn.12868
Anders S, Pyl PT, Huber W. 2015. HTSeq–a Python framework to work with high-throughput sequencing data.Bioinformatics 31:166–169. doi: 10.1093/bioinformatics/btu638
Andrews S. 2010. FastQC: A quality control tool for high throughput sequence data. Http://www.bioinformatics.babraham.ac.uk/projects/fastqc/.
Anwar AJ, Walker JD, Frier BM. 1998. Type 1 diabetes mellitus and Down’s syndrome: prevalence, managementand diabetic complications. Diabetic Medicine 15:160–163. doi: 10.1002/(SICI)1096-9136(199802)15:2<160::AID-DIA537>3.0.CO;2-J
Arabi A, Wu S, Ridderstrale K, Bierhoff H, Shiue C, Fatyol K, Fahlen S, Hydbring P, Soderberg O, Grummt I,Larsson LG, Wright AP. 2005. c-Myc associates with ribosomal DNA and activates RNA polymerase Itranscription. Nature Cell Biology 7:303–310. doi: 10.1038/ncb1225
Barlow CF, Priebe CJ, Mulliken JB, Barnes PD, Mac Donald D, Folkman J, Ezekowitz RA. 1998. Spastic diplegiaas a complication of interferon Alfa-2a treatment of hemangiomas of infancy. Journal of Pediatrics 132:527–530. doi: 10.1016/S0022-3476(98)70034-4
Boon K, Caron HN, van Asperen R, Valentijn L, Hermus MC, van Sluis P, Roobeek I, Weis I, Voute PA, Schwab M,Versteeg R, , L Valentijn R, Asperen van, , I Roobeek P. Sluis van2001. N-myc enhances the expression of alarge set of genes functioning in ribosome biogenesis and protein synthesis. The EMBO Journal 20:1383–1393.doi: 10.1093/emboj/20.6.1383
Bratman SV, Horst KC, Carlson RW, Kapp DS. 2014. Solid malignancies in individuals with Down syndrome: acase presentation and literature review. Journal of the National Comprehensive Cancer Network 12:1537–1545.
Cerami EG, Gross BE, Demir E, Rodchenkov I, Babur O, Anwar N, Schultz N, Bader GD, Sander C. 2011. Pathwaycommons, a web resource for biological pathway data. Nucleic Acids Research 39:D685–D690. doi: 10.1093/nar/gkq1039
Choi H, Kim S, Fermin D, Tsou CC, Nesvizhskii AI. 2015. QPROT: Statistical method for testing differentialexpression using protein-level intensity data in label-free quantitative proteomics. Journal of Proteomics 129:121–126. doi: 10.1016/j.jprot.2015.07.036
Costa V, Angelini C, D’Apice L, Mutarelli M, Casamassimi A, Sommese L, Gallo MA, Aprile M, Esposito R, LeoneL, Donizetti A, Crispi S, Rienzo M, Sarubbi B, Calabro R, Picardi M, Salvatore P, Infante T, De Berardinis P,Napoli C, et al. 2011. Massive-scale RNA-Seq analysis of non ribosomal transcriptome in human trisomy 21.PLoS One 6:e18493. doi: 10.1371/journal.pone.0018493
Crow YJ, Manel N. 2015. Aicardi-goutieres syndrome and the type I interferonopathies. Nature ReviewsImmunology 15:429–440. doi: 10.1038/nri3850
Das I, Park JM, Shin JH, Jeon SK, Lorenzi H, Linden DJ, Worley PF, Reeves RH. 2013. Hedgehog agonist therapycorrects structural and cognitive deficits in a Down syndrome mouse model. Science Translational Medicine 5:201ra120. doi: 10.1126/scitranslmed.3005983
de Sola S, de la Torre R, Sanchez-Benavides G, Benejam B, Cuenca-Royo A, Del Hoyo L, Rodrıguez J, Catuara-Solarz S, Sanchez-Gutierrez J, Duenas-Espin I, Hernandez G, Pena-Casanova J, Langohr K, Videla S, Blehaut H,Farre M, Dierssen M, TESDAD Study Group. 2015. A new cognitive evaluation battery for Down syndrome andits relevance for clinical trials. Frontiers in Psychology 6:708. doi: 10.3389/fpsyg.2015.00708
Do LH, Mobley WC, Singhal N. 2015. Questioned validity of gene expression dysregulated domains in Down’ssyndrome. F1000Research 4:269. doi: 10.12688/f1000research.6735.1
Sullivan et al. eLife 2016;5:e16220. DOI: 10.7554/eLife.16220 25 of 28
Short report Genes and Chromosomes Human Biology and Medicine

Donner AJ, Ebmeier CC, Taatjes DJ, Espinosa JM. 2010. CDK8 is a positive regulator of transcriptionalelongation within the serum response network. Nature Structural & Molecular Biology 17:194–201. doi: 10.1038/nsmb.1752
Galbraith MD, Allen MA, Bensard CL, Wang X, Schwinn MK, Qin B, Long HW, Daniels DL, Hahn WC, Dowell RD,Espinosa JM. 2013. HIF1A employs CDK8-mediator to stimulate RNAPII elongation in response to hypoxia. Cell153:1327–1339. doi: 10.1016/j.cell.2013.04.048
Gold L, Walker JJ, Wilcox SK, Williams S. 2012. Advances in human proteomics at high scale with the SOMAscanproteomics platform. New Biotechnology 29:543–549. doi: 10.1016/j.nbt.2011.11.016
Grether JK, Nelson KB, Dambrosia JM, Phillips TM. 1999. Interferons and cerebral palsy. Journal of Pediatrics134:324–332. doi: 10.1016/S0022-3476(99)70458-0
Gupta R, Kim S, Taylor MW, Wong JB, McQuillan GM, McHutchison JG, Poynard T. 2012. Suppression ofribosomal protein synthesis and protein translation factors by Peg-interferon alpha/ribavirin in HCV patientsblood mononuclear cells (PBMC). Journal of Translational Medicine 10:54. doi: 10.1186/1479-5876-10-54
Hasle H, Friedman JM, Olsen JH, Rasmussen SA. 2016. Low risk of solid tumors in persons with Down syndrome.Genetics in Medicine. doi: 10.1038/gim.2016.23
Hathout Y, Brody E, Clemens PR, Cripe L, DeLisle RK, Furlong P, Gordish-Dressman H, Hache L, Henricson E,Hoffman EP, Kobayashi YM, Lorts A, Mah JK, McDonald C, Mehler B, Nelson S, Nikrad M, Singer B, Steele F,Sterling D, et al. 2015. Large-scale serum protein biomarker discovery in Duchenne muscular dystrophy. PNAS112:7153–7158. doi: 10.1073/pnas.1507719112
Hinnebusch AG. 2014. The scanning mechanism of eukaryotic translation initiation. Annual Review ofBiochemistry 83:779–812. doi: 10.1146/annurev-biochem-060713-035802
Huang C, Liu LY, Li ZF, Wang P, Ni L, Song LP, Xu DH, Song TS. 2008. Effects of small interfering RNAs targetingMAPK1 on gene expression profile in HeLa cells as revealed by microarray analysis. Cell Biology International32:1081–1090. doi: 10.1016/j.cellbi.2008.04.019
Iwamoto T, Yamada A, Yuasa K, Fukumoto E, Nakamura T, Fujiwara T, Fukumoto S. 2009. Influences ofinterferon-gamma on cell proliferation and interleukin-6 production in Down syndrome derived fibroblasts.Archives of Oral Biology 54:963–969. doi: 10.1016/j.archoralbio.2009.07.009
Iyer AM, van Scheppingen J, Milenkovic I, Anink JJ, Adle-Biassette H, Kovacs GG, Aronica E. 2014. mTORHyperactivation in Down syndrome hippocampus appears early during development. Journal ofNeuropathology & Experimental Neurology 73:671–683. doi: 10.1097/NEN.0000000000000083
Jabbari A, Dai Z, Xing L, Cerise JE, Ramot Y, Berkun Y, Sanchez GA, Goldbach-Mansky R, Christiano AM, ClynesR, Zlotogorski A. 2015. Reversal of alopecia areata following treatment with the JAK1/2 inhibitor baricitinib.EBioMedicine 2:351–355. doi: 10.1016/j.ebiom.2015.02.015
Johnson TC, Lerner MP, Lancz GJ. 1968. Inhibition of protein synthesis in noninfected L cells by partially purifiedinterferon preparations. Journal of Cell Biology 36:617–624. doi: 10.1083/jcb.36.3.617
Keystone EC, Taylor PC, Drescher E, Schlichting DE, Beattie SD, Berclaz PY, Lee CH, Fidelus-Gort RK, Luchi ME,Rooney TP, Macias WL, Genovese MC. 2015. Safety and efficacy of baricitinib at 24weeks in patients withrheumatoid arthritis who have had an inadequate response to methotrexate. Annals of the Rheumatic Diseases74:333–340. doi: 10.1136/annrheumdis-2014-206478
Kim D, Pertea G, Trapnell C, Pimentel H, Kelley R, Salzberg SL. 2013. TopHat2: accurate alignment oftranscriptomes in the presence of insertions, deletions and gene fusions. Genome Biology 14:R36. doi: 10.1186/gb-2013-14-4-r36
Kim S, Li Q, Dang CV, Lee LA. 2000. Induction of ribosomal genes and hepatocyte hypertrophy by adenovirus-mediated expression of c-Myc in vivo. PNAS 97:11198–11202. doi: 10.1073/pnas.200372597
Kramer A, Green J, Pollard J, Tugendreich S. 2014. Causal analysis approaches in ingenuity pathway analysis.Bioinformatics 30:523–530. doi: 10.1093/bioinformatics/btt703
Lee HC, Tan KL, Cheah PS, Ling KH. 2016. Potential role of JAK-STAT signaling pathway in the neurogenic-to-gliogenic shift in down syndrome brain. Neural Plasticity 2016:7434191. doi: 10.1155/2016/7434191
Letourneau A, Santoni FA, Bonilla X, Sailani MR, Gonzalez D, Kind J, Chevalier C, Thurman R, Sandstrom RS,Hibaoui Y, Garieri M, Popadin K, Falconnet E, Gagnebin M, Gehrig C, Vannier A, Guipponi M, Farinelli L, RobyrD, Migliavacca E, et al. 2014. Domains of genome-wide gene expression dysregulation in Down’s syndrome.Nature 508:345–350. doi: 10.1038/nature13200
Li H, Handsaker B, Wysoker A, Fennell T, Ruan J, Homer N, Marth G, Abecasis G, Durbin R, 1000 GenomeProject Data Processing Subgroup. 2009. The sequence alignment/map format and SAMtools. Bioinformatics25:2078–2079. doi: 10.1093/bioinformatics/btp352
Li Z, Yu T, Morishima M, Pao A, LaDuca J, Conroy J, Nowak N, Matsui S, Shiraishi I, Yu YE. 2007. Duplication ofthe entire 22.9 Mb human chromosome 21 syntenic region on mouse chromosome 16 causes cardiovascularand gastrointestinal abnormalities. Human Molecular Genetics 16:1359–1366. doi: 10.1093/hmg/ddm086
Lindvall C, Hou M, Komurasaki T, Zheng C, Henriksson M, Sedivy JM, Bjorkholm M, Teh BT, Nordenskjold M, XuD. 2003. Molecular characterization of human telomerase reverse transcriptase-immortalized human fibroblastsby gene expression profiling: activation of the epiregulin gene. Cancer Research 63:1743–1747.
Ling KH, Hewitt CA, Tan KL, Cheah PS, Vidyadaran S, Lai MI, Lee HC, Simpson K, Hyde L, Pritchard MA, SmythGK, Thomas T, Scott HS. 2014. Functional transcriptome analysis of the postnatal brain of the Ts1Cje mousemodel for Down syndrome reveals global disruption of interferon-related molecular networks. BMC Genomics15:624. doi: 10.1186/1471-2164-15-624
Love MI, Huber W, Anders S. 2014. Moderated estimation of fold change and dispersion for RNA-seq data withDESeq2. Genome Biology 15:550. doi: 10.1186/s13059-014-0550-8
Sullivan et al. eLife 2016;5:e16220. DOI: 10.7554/eLife.16220 26 of 28
Short report Genes and Chromosomes Human Biology and Medicine

Malinge S, Bliss-Moreau M, Kirsammer G, Diebold L, Chlon T, Gurbuxani S, Crispino JD. 2012. Increased dosageof the chromosome 21 ortholog Dyrk1a promotes megakaryoblastic leukemia in a murine model of downsyndrome. Journal of Clinical Investigation 122:948–962. doi: 10.1172/JCI60455
Malinge S, Chlon T, Dore LC, Ketterling RP, Tallman MS, Paietta E, Gamis AS, Taub JW, Chou ST, Weiss MJ,Crispino JD, Figueroa ME. 2013. Development of acute megakaryoblastic leukemia in down syndrome isassociated with sequential epigenetic changes. Blood 122:e33–43. doi: 10.1182/blood-2013-05-503011
Maroun LE, Heffernan TN, Hallam DM. 2000. Partial IFN-alpha/beta and IFN-gamma receptor knockout trisomy16 mouse fetuses show improved growth and cultured neuron viability. Journal of Interferon & CytokineResearch 20:197–203. doi: 10.1089/107999000312612
Maroun LE. 1978. Interferon-mediated effect on ribosomal RNA metabolism. Biochimica Et Biophysica Acta 517:109–114. doi: 10.1016/0005-2787(78)90038-2
Maroun LE. 1995. Anti-interferon immunoglobulins can improve the trisomy 16 mouse phenotype. Teratology51:329–335. doi: 10.1002/tera.1420510509
McGlasson S, Jury A, Jackson A, Hunt D. 2015. Type I interferon dysregulation and neurological disease. NatureReviews Neurology 11:515–523. doi: 10.1038/nrneurol.2015.143
McKeage K. 2015. Ruxolitinib: A review in polycythaemia vera. Drugs 75:1773–1781. doi: 10.1007/s40265-015-0470-2
Mehan MR, Williams SA, Siegfried JM, Bigbee WL, Weissfeld JL, Wilson DO, Pass HI, Rom WN, Muley T, MeisterM, Franklin W, Miller YE, Brody EN, Ostroff RM. 2014. Validation of a blood protein signature for non-small celllung cancer. Clinical Proteomics 11:32. doi: 10.1186/1559-0275-11-32
Moisan A, Lee YK, Zhang JD, Hudak CS, Meyer CA, Prummer M, Zoffmann S, Truong HH, Ebeling M, KiialainenA, Gerard R, Xia F, Schinzel RT, Amrein KE, Cowan CA. 2015. White-to-brown metabolic conversion of humanadipocytes by JAK inhibition. Nature Cell Biology 17:57–67. doi: 10.1038/ncb3075
Muller M, Briscoe J, Laxton C, Guschin D, Ziemiecki A, Silvennoinen O, Harpur AG, Barbieri G, Witthuhn BA,Schindler C. 1993. The protein tyrosine kinase JAK1 complements defects in interferon-alpha/beta and -gammasignal transduction. Nature 366:129–135. doi: 10.1038/366129a0
Padron E, Dezern A, Andrade-Campos M, Vaddi K, Scherle P, Zhang Q, Ma Y, Balasis ME, Tinsley S, Ramadan H,Zimmerman C, Steensma DP, Roboz GJ, Lancet JE, List AF, Sekeres MA, Komrokji RS., MyelodysplasticSyndrome Clinical Research Consortium. 2016. A multi-institution phase I trial of ruxolitinib in patients withchronic myelomonocytic leukemia (CMML). Clinical Cancer Research 22:3746–3754. doi: 10.1158/1078-0432.CCR-15-2781
Perluigi M, Di Domenico F, Butterfield DA. 2015. mTOR signaling in aging and neurodegeneration: At thecrossroad between metabolism dysfunction and impairment of autophagy. Neurobiology of Disease 84:39–49.doi: 10.1016/j.nbd.2015.03.014
Plosker GL. 2015. Ruxolitinib: a review of its use in patients with myelofibrosis. Drugs 75:297–308. doi: 10.1007/s40265-015-0351-8
Quintas-Cardama A, Vaddi K, Liu P, Manshouri T, Li J, Scherle PA, Caulder E, Wen X, Li Y, Waeltz P, Rupar M,Burn T, Lo Y, Kelley J, Covington M, Shepard S, Rodgers JD, Haley P, Kantarjian H, Fridman JS, et al. 2010.Preclinical characterization of the selective JAK1/2 inhibitor INCB018424: therapeutic implications for thetreatment of myeloproliferative neoplasms. Blood 115:3109–3117. doi: 10.1182/blood-2009-04-214957
Richardson SJ, Willcox A, Bone AJ, Morgan NG, Foulis AK. 2011. Immunopathology of the human pancreas intype-I diabetes. Seminars in Immunopathology 33:9–21. doi: 10.1007/s00281-010-0205-0
Roberts I, Izraeli S. 2014. Haematopoietic development and leukaemia in Down syndrome. British Journal ofHaematology 167:587–599. doi: 10.1111/bjh.13096
Scarpato M, Esposito R, Evangelista D, Aprile M, Ambrosio MR, Angelini C, Ciccodicola A, Costa V. 2014.AnaLysis of Expression on human chromosome 21, ALE-HSA21: a pilot integrated web resource. Database2014:bau009. doi: 10.1093/database/bau009
Schoggins JW, Wilson SJ, Panis M, Murphy MY, Jones CT, Bieniasz P, Rice CM. 2011. A diverse range of geneproducts are effectors of the type I interferon antiviral response. Nature 472:481–485. doi: 10.1038/nature09907
Shi JG, Chen X, Lee F, Emm T, Scherle PA, Lo Y, Punwani N, Williams WV, Yeleswaram S. 2014. Thepharmacokinetics, pharmacodynamics, and safety of baricitinib, an oral JAK 1/2 inhibitor, in healthy volunteers.Journal of Clinical Pharmacology 54:1354–1361. doi: 10.1002/jcph.354
Shuai K, Horvath CM, Huang LH, Qureshi SA, Cowburn D, Darnell JE. 1994. Interferon activation of thetranscription factor Stat91 involves dimerization through SH2-phosphotyrosyl peptide interactions. Cell 76:821–828. doi: 10.1016/0092-8674(94)90357-3
Slate DL, Shulman L, Lawrence JB, Revel M, Ruddle FH. 1978. Presence of human chromosome 21 alone issufficient for hybrid cell sensitivity to human interferon. Journal of Virology 25:319–325.
Sobey CG, Judkins CP, Sundararajan V, Phan TG, Drummond GR, Srikanth VK. 2015. Risk of major cardiovascularevents in people with Down syndrome. PloS One 10:e0137093. doi: 10.1371/journal.pone.0137093
Spaner DE, Wang G, McCaw L, Li Y, Disperati P, Cussen MA, Shi Y. 2016. Activity of the Janus kinase inhibitorruxolitinib in chronic lymphocytic leukemia: results of a phase II trial. Haematologica 101:e192–195. doi: 10.3324/haematol.2015.135418
Stahl N, Boulton TG, Farruggella T, Ip NY, Davis S, Witthuhn BA, Quelle FW, Silvennoinen O, Barbieri G,Pellegrini S. 1994. Association and activation of Jak-Tyk kinases by CNTF-LIF-OSM-IL-6 beta receptorcomponents. Science 263:92–95. doi: 10.1126/science.8272873
Sullivan et al. eLife 2016;5:e16220. DOI: 10.7554/eLife.16220 27 of 28
Short report Genes and Chromosomes Human Biology and Medicine

Stankiewicz MJ, Crispino JD. 2013. AKT collaborates with ERG and Gata1s to dysregulate megakaryopoiesisand promote AMKL. Leukemia 27:1339–1347. doi: 10.1038/leu.2013.33
Sullivan KD, Padilla-Just N, Henry RE, Porter CC, Kim J, Tentler JJ, Eckhardt SG, Tan AC, DeGregori J, EspinosaJM. 2012. ATM and MET kinases are synthetic lethal with nongenotoxic activation of p53. Nature ChemicalBiology 8:646–654. doi: 10.1038/nchembio.965
Sun L, Tian Z, Wang J. 2010. A direct cross-talk between interferon-g and sonic hedgehog signaling that leads tothe proliferation of neuronal precursor cells. Brain, Behavior, and Immunity 24:220–228. doi: 10.1016/j.bbi.2009.09.016
Tan YH, Schneider EL, Tischfield J, Epstein CJ, Ruddle FH. 1974a. Human chromosome 21 dosage: effect on theexpression of the interferon induced antiviral state. Science 186:61–63. doi: 10.1126/science.186.4158.61
Tan YH, Tischfield JA, Ruddle FH. 1974b. Proceedings: The genetics of the antiviral state in human cells.Cytogenetics and Cell Genetics 13:158–159. doi: 10.1159/000130262
Tanaka MH, Giro EM, Cavalcante LB, Pires JR, Apponi LH, Valentini SR, Spolidorio DM, Capela MV, Rossa C,Scarel-Caminaga RM. 2012. Expression of interferon-g, interferon-a and related genes in individuals with Downsyndrome and periodontitis. Cytokine 60:875–881. doi: 10.1016/j.cyto.2012.08.020
Taylor MW, Tsukahara T, Brodsky L, Schaley J, Sanda C, Stephens MJ, McClintick JN, Edenberg HJ, Li L, TavisJE, Howell C, Belle SH. 2007. Changes in gene expression during pegylated interferon and ribavirin therapy ofchronic hepatitis C virus distinguish responders from nonresponders to antiviral therapy. Journal of Virology 81:3391–3401. doi: 10.1128/JVI.02640-06
Tefferi A, Litzow MR, Pardanani A. 2011. Long-term outcome of treatment with ruxolitinib in myelofibrosis. TheNew England Journal of Medicine 365:1455–1457. doi: 10.1056/NEJMc1109555
Tisserand J, Khetchoumian K, Thibault C, Dembele D, Chambon P, Losson R. 2011. Tripartite motif 24 (Trim24/Tif1a) tumor suppressor protein is a novel negative regulator of interferon (IFN)/signal transducers andactivators of transcription (STAT) signaling pathway acting through retinoic acid receptor a (Rara) inhibition.Journal of Biological Chemistry 286:33369–33379. doi: 10.1074/jbc.M111.225680
Troca-Marın JA, Casanas JJ, Benito I, Montesinos ML. 2014. The Akt-mTOR pathway in Down’s syndrome: thepotential use of rapamycin/rapalogs for treating cognitive deficits. CNS & Neurological Disorders - DrugTargets 13:34–40. doi: 10.2174/18715273113126660184
Uphoff CC, Drexler HG. 2002. Detection of mycoplasma in leukemia-lymphoma cell lines using polymerase chainreaction. Leukemia 16:289–293. doi: 10.1038/sj.leu.2402365
van Riggelen J, Yetil A, Felsher DW. 2010. MYC as a regulator of ribosome biogenesis and protein synthesis.Nature Reviews Cancer 10:301–309. doi: 10.1038/nrc2819
Volk M, Maver A, Lovrecic L, Juvan P, Peterlin B. 2013. Expression signature as a biomarker for prenataldiagnosis of trisomy 21. PLoS One 8:e74184. doi: 10.1371/journal.pone.0074184
Waddell SJ, Popper SJ, Rubins KH, Griffiths MJ, Brown PO, Levin M, Relman DA. 2010. Dissecting interferon-induced transcriptional programs in human peripheral blood cells. PLoS One 5:e9753. doi: 10.1371/journal.pone.0009753
Walsh D, Mathews MB, Mohr I. 2013. Tinkering with translation: protein synthesis in virus-infected cells. ColdSpring Harbor Perspectives in Biology 5:a012351. doi: 10.1101/cshperspect.a012351
Wang J, Duncan D, Shi Z, Zhang B. 2013. WEB-based GEne SeT anaLysis toolkit (WebGestalt): update 2013.Nucleic Acids Research 41:W77–83. doi: 10.1093/nar/gkt439
Wang L, Wang S, Li W. 2012. RSeQC: quality control of RNA-seq experiments. Bioinformatics 28:2184–2185. doi:10.1093/bioinformatics/bts356
Wichers MC, Koek GH, Robaeys G, Verkerk R, Scharpe S, Maes M. 2005. IDO and interferon-alpha-induceddepressive symptoms: a shift in hypothesis from tryptophan depletion to neurotoxicity. Molecular Psychiatry10:538–544. doi: 10.1038/sj.mp.4001600
Wichers MC, Maes M. 2004. The role of indoleamine 2,3-dioxygenase (IDO) in the pathophysiology of interferon-alpha-induced depression. Journal of Psychiatry & Neuroscience 29:11–17.
Wiseman FK, Al-Janabi T, Hardy J, Karmiloff-Smith A, Nizetic D, Tybulewicz VL, Fisher EM, Strydom A. 2015. Agenetic cause of Alzheimer disease: mechanistic insights from Down syndrome. Nature Reviews Neuroscience16:564–574. doi: 10.1038/nrn3983
Worle H, Maass E, Kohler B, Treuner J. 1999. Interferon alpha-2a therapy in haemangiomas of infancy: spasticdiplegia as a severe complication. European Journal of Pediatrics 158:344. doi: 10.1007/s004310051089
Yao Y, Higgs BW, Richman L, White B, Jallal B. 2010. Use of type I interferon-inducible mRNAs aspharmacodynamic markers and potential diagnostic markers in trials with sifalimumab, an anti-IFNa antibody,in systemic lupus erythematosus. Arthritis Research & Therapy 12 Suppl 1:S6. doi: 10.1186/ar2887
Zhang B, Kirov S, Snoddy J. 2005. WebGestalt: an integrated system for exploring gene sets in various biologicalcontexts. Nucleic Acids Research 33:W741–748. doi: 10.1093/nar/gki475
Zitvogel L, Galluzzi L, Kepp O, Smyth MJ, Kroemer G. 2015. Type I interferons in anticancer immunity. NatureReviews Immunology 15:405–414. doi: 10.1038/nri3845
Sullivan et al. eLife 2016;5:e16220. DOI: 10.7554/eLife.16220 28 of 28
Short report Genes and Chromosomes Human Biology and Medicine