Embed Size (px)
Citation preview

An Open ended scheme investing inequity, arbitrage and debt
Triple the joy,Triple the benefitsof growth, income, and stability.
EDELWEISS EQUITY
SAVINGS FUND
The Scheme seeks to generate income by investing in a mix of debt & arbitrage opportunities,
and long term capital appreciation through equity & equity related instruments.
(Formerly known as Edelweiss Equity Savings Advantage Fund)
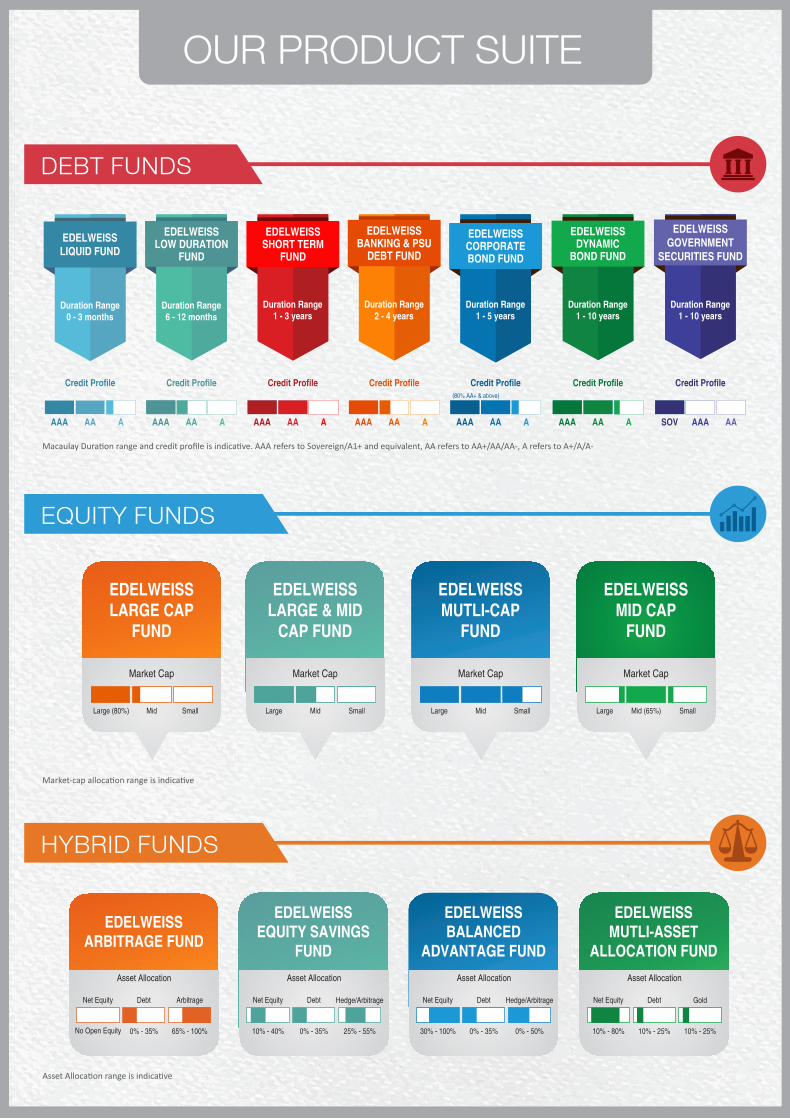
OUR PRODUCT SUITE
DEBT FUNDS
EQUITY FUNDS
HYBRID FUNDS
EDELWEISSLIQUID FUND
Duration Range0 - 3 months
EDELWEISSLOW DURATION
FUND
Duration Range6 - 12 months
EDELWEISSSHORT TERM
FUND
Duration Range1 - 3 years
EDELWEISSBANKING & PSU
DEBT FUND
Duration Range2 - 4 years
EDELWEISSCORPORATEBOND FUND
Duration Range1 - 5 years
EDELWEISSDYNAMIC
BOND FUND
Duration Range1 - 10 years
EDELWEISSGOVERNMENT
SECURITIES FUND
Duration Range1 - 10 years
SOV AAA AAAAA AA AAAA AA A
(80% AA+ & above)
AAA AA AAAA AA AAAA AA AAAA AA A
EDELWEISSLARGE CAP
FUND
Market Cap
Large (80%) Mid Small
EDELWEISSLARGE & MID
CAP FUND
Market Cap
Large Mid Small
EDELWEISSMUTLI-CAP
FUND
Market Cap
Large Mid Small
EDELWEISSMID CAP
FUND
Market Cap
Large Mid (65%) Small
EDELWEISSARBITRAGE FUND
Asset Allocation
Net Equity Debt Arbitrage
65% - 100%0% - 35%No Open Equity
EDELWEISSEQUITY SAVINGS
FUND
Asset Allocation
Net Equity Debt Hedge/Arbitrage
25% - 55%0% - 35%10% - 40%
EDELWEISSBALANCED
ADVANTAGE FUND
Asset Allocation
Net Equity Debt Hedge/Arbitrage
0% - 50%0% - 35%30% - 100%
EDELWEISSMUTLI-ASSET
ALLOCATION FUND
Asset Allocation
Net Equity Debt Gold
10% - 25%10% - 25%10% - 80%
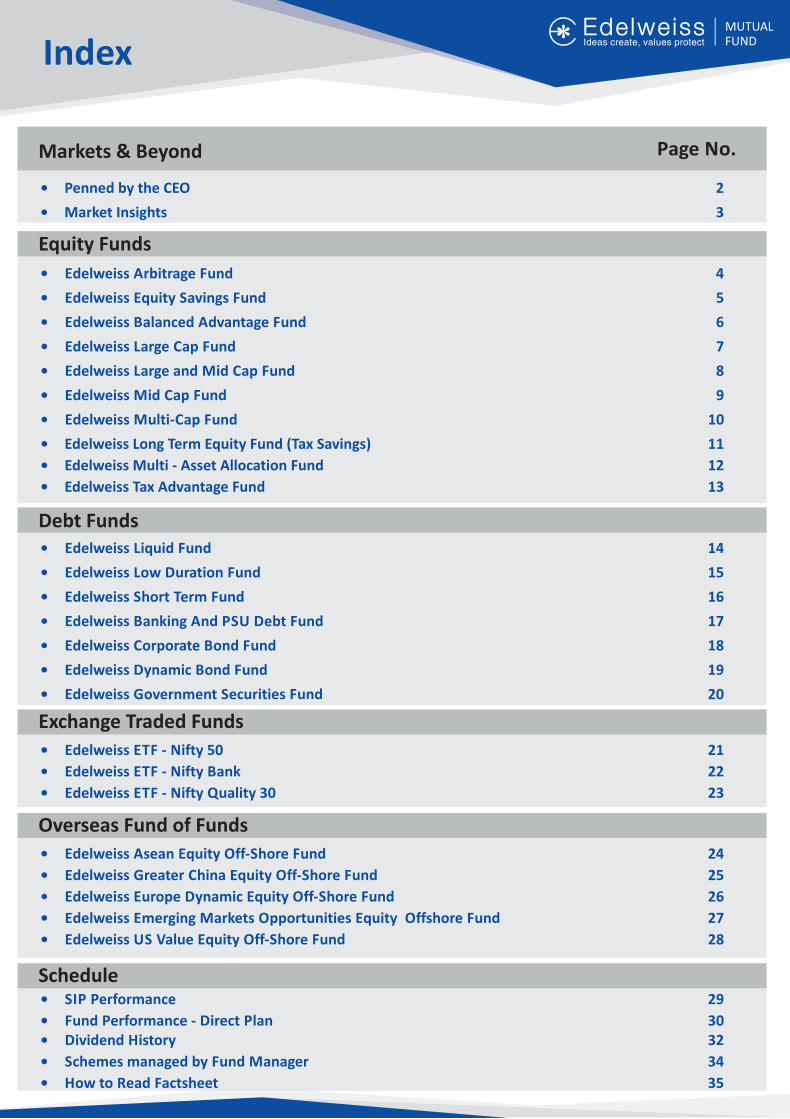
Index
Markets & Beyond
• Penned by the CEO 2
• Market Insights 3
• Edelweiss Arbitrage Fund 4
• Edelweiss Equity Savings Fund 5
• Edelweiss Balanced Advantage Fund 6
• Edelweiss Large Cap Fund 7
• Edelweiss Large and Mid Cap Fund 8
• Edelweiss Mid Cap Fund 9
• Edelweiss Multi-Cap Fund 10
• Edelweiss Long Term Equity Fund (Tax Savings) 11
• Edelweiss Multi - Asset Allocation Fund 12
• Edelweiss Tax Advantage Fund 13
Equity Funds
Page No.
• Edelweiss Liquid Fund 14
• Edelweiss Low Duration Fund 15
• Edelweiss Short Term Fund 16
• Edelweiss Banking And PSU Debt Fund 17
• Edelweiss Corporate Bond Fund 18
• Edelweiss Dynamic Bond Fund 19
• Edelweiss Government Securities Fund 20
Debt Funds
• Edelweiss ETF - Nifty 50 21
• Edelweiss ETF - Nifty Bank 22
• Edelweiss ETF - Nifty Quality 30 23
Exchange Traded Funds
• SIP Performance 29
• Fund Performance - Direct Plan 30• Dividend History 32
• Schemes managed by Fund Manager 34
• How to Read Factsheet 35
Schedule
• Edelweiss Asean Equity Off-Shore Fund 24
• Edelweiss Greater China Equity Off-Shore Fund 25
• Edelweiss Europe Dynamic Equity Off-Shore Fund 26
• Edelweiss Emerging Markets Opportunities Equity Offshore Fund 27
• Edelweiss US Value Equity Off-Shore Fund 28
Overseas Fund of Funds
Radhika Gupta
CEO, Edelweiss Asset Management Limited
Dear Investors and Advisors,
“It is not the strongest species that survive, nor the most intelligent, but the ones who are most prepared for change.” – Charles Darwin
As a financial year closes and another one opens, and as the investment planning for this year begins, we often ask, “What's going to be different this time?” While predictions have limited value, the one thing I do believe is that the coming year will be defined by volatility, at least in comparison to the year that passed. FY18, with the exception of the last few months, was an exceptionally quiet year for equity markets, the VIX, the gauge of volatility was at all-time lows, and we all settled into a sense of calm that is inevitably temporary.
In the 1990s, the US Army War College introduced an acronym called VUCA to describe the political state of the world post the Cold War. VUCA stands for Volatile, Uncertain, Complex, and Ambiguous, and over the last 25 years, has been a phrase used to describe the state of organizations today and to prepare leaders more effectively. As I look ahead at FY19, VUCA describes the investing environment we are in for.
Volatility is certainly going to be higher in equity markets, as earnings are playing catch-up with equity prices and also in bond markets, with the uncertainty around inflation. Uncertainty is also going to be a reality we grapple with this year, with number of state elections ahead of us, culminating in the Lok Sabha elections in 2019. Complexity will be further driven by global factors, particularly the rhetoric around trade wars and a potential paradigm shift towards localization, from globalization, as well as rising interest rates in the US. Ambiguity is at play, in our own MF industry, with the SEBI scheme mergers and classifications now unfolding, resulting in a number of changes in portfolios.
Now, whether it is a military environment, an organizational one, or our own investing environment, VUCA is not a problem that can be solved. It just is. Attempts to simplify complexity, or break volatility, uncertainty and ambiguity into smaller and smaller pieces in the attempt to predict outcomes or decode them will not make them go away. Perhaps, then, what we can do is be better prepared for the environment we are in, reverse it on its head, and make it our friend - a VUCA investing framework for FY19.
Step 1 is “Value”. The price of what you buy is important, because everything is valuable at the right price. This is more so in a volatile year, which will give us more opportunities to discover value, whether in the equity markets or bond markets. Now, while everyone agrees in hindsight that 2008 and 2013 offered outstanding value opportunities, the truth is very few people take them up. The mutual fund industry, thankfully, has created a wonderful tool in SIPs, to eliminate the challenges of market timing, and deliver value cost averaging in a simple and disciplined way. While investing via SIPs is timeless, in a year like FY19, it will be especially powerful.
“Understanding” is a critical Step 2. In a complex and uncertain world, understanding your investment goals, which are unique to you, defining them sharply, and sticking to them is vital. It is equally valuable to understand your own risk appetite, which is tested in volatile markets, and understand the different risk-return profiles of the debt and equity mutual fund offerings that exist. Finding the right match between your needs and the existing offerings is critical to a successful investment journey, and a good financial advisor, and there are many of them today, can help you bridge this beautifully.
Step 3 comes in “Clarity”. Clarity of what you are investing in today is extremely important in the context of scheme mergers and classifications. We at Edelweiss AMC, have emphasized the need for True to Label funds – buying what you see and seeing what you buy, to the extent of simplifying our scheme names to match the category labels defined by SEBI. Given that across the industry, schemes will change fundamental attributes, risk profiles, and past track records may become irrelevant, it is important to focus on clarity. Similarly, clarity in scheme features is important – for instance, SWPs are considered tax efficient, but be clear they help you defer tax, not avoid it entirely.
The last and final piece is “Asset Allocation” and I cannot emphasize how important it is. The right answer to most investment questions, including “is it the right time to invest in markets?”, is asset allocation. The best way to combat uncertainty and volatility is diversification, and asset allocation, by spreading risk across asset classes achieves that beautifully. The good news is that the MF industry today has a range of funds that address this problem systematically – balanced advantage funds, equity savings funds, and the new category of multi-asset funds.
A VUCA investing environment may make it appear that we are in for a rollercoaster. One of my favourite sayings by writer Maya Angelou is, “My mission in life is to not merely survive, but to thrive, and to do so, with some passion, some compassion, some humour and some style.” Chaos is reality, but to survive or to thrive, is a choice, and hopefully preparedness will help us achieve the latter.
On behalf of Edelweiss AMC, I wish you a prosperous FY19!
RegardsRadhika
Penned by the CEO
2
Information Technology : Digital drive - The race begins
Market Insights
3
60.0
54.0
48.0
42.0
36.0
30.0
25.0
20.0
15.0
10.0
5.0
0.0
(%)
(%)
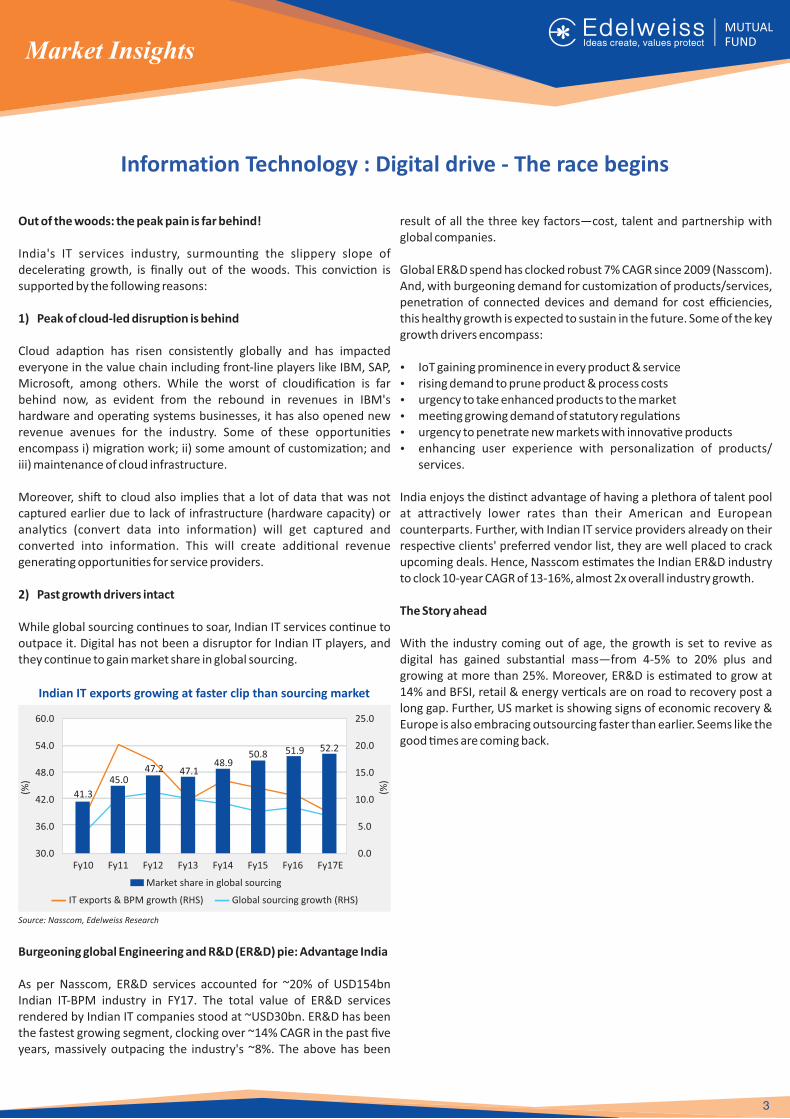
Fy10 Fy11 Fy12 Fy13 Fy14 Fy15 Fy16 Fy17E
41.3
45.047.2 47.1
48.950.8 51.9 52.2
Global sourcing growth (RHS)
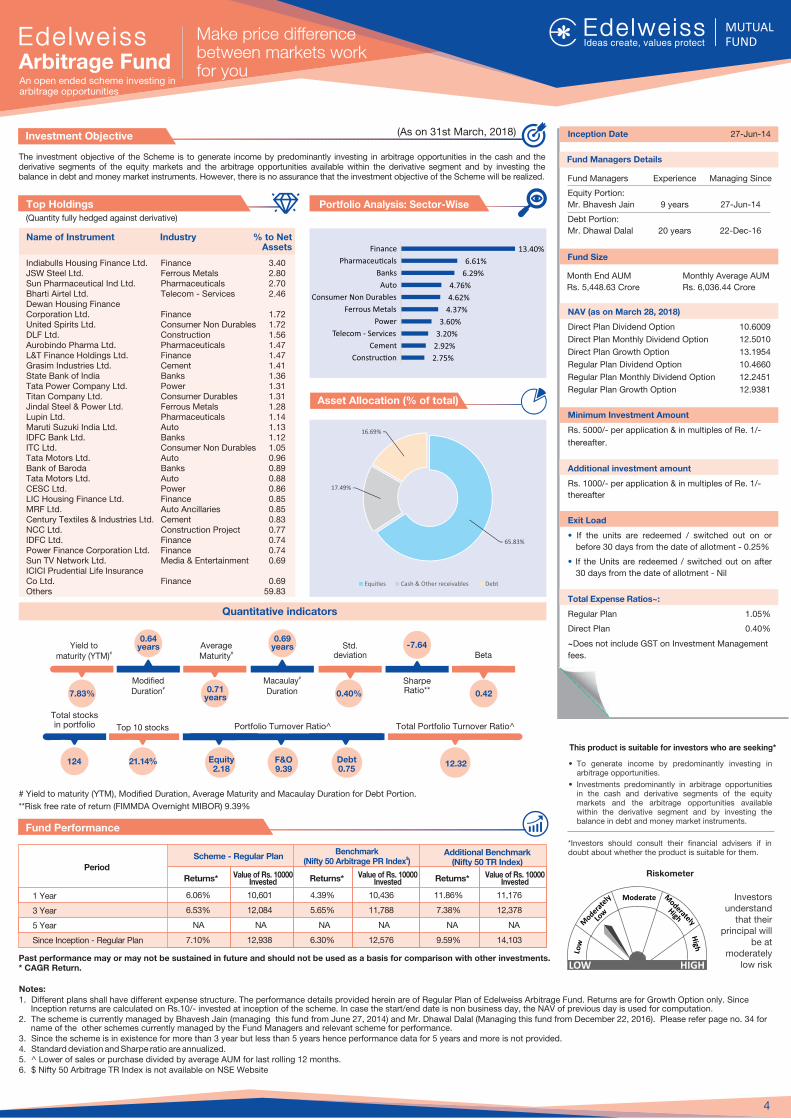
The investment objective of the Scheme is to generate income by predominantly investing in arbitrage opportunities in the cash and the derivative segments of the equity markets and the arbitrage opportunities available within the derivative segment and by investing the balance in debt and money market instruments. However, there is no assurance that the investment objective of the Scheme will be realized.
Investment Objective
Fund Performance
LOW HIGH
Riskometer
This product is suitable for investors who are seeking*
� To generate income by predominantly investing in arbitrage opportunities.
� Investments predominantly in arbitrage opportunities in the cash and derivative segments of the equity markets and the arbitrage opportunities available within the derivative segment and by investing the balance in debt and money market instruments.
*Investors should consult their financial advisers if in doubt about whether the product is suitable for them.
Notes:1. Different plans shall have different expense structure. The performance details provided herein are of of Returns are for Growth Option only. Since Regular Plan Edelweiss Arbitrage Fund.
Inception returns are calculated on Rs.10/- invested at inception of the scheme In case the start/end date is non business day, the NAV of previous day is used for computation.. 2. The scheme is currently managed by (managing this fund from June 27, 2014) and December 22 6 . Please refer page no. 34 for Bhavesh Jain Mr. Dhawal Dalal (Managing this fund from , 201 )
name of the other schemes currently managed by the Fund Managers and relevant scheme for performance.3. Since the scheme is in existence for more than 3 year but less than 5 years hence performance data for 5 years and more is not provided.4. Standard deviation and Sharpe ratio are annualized.5. ^ Lower of sales or purchase divided by average AUM for last rolling 12 months. 6. $ Nifty 50 Arbitrage TR Index is not available on NSE Website
Inception Date 27-Jun-14
NAV (as on March 28, 2018)
Direct Plan Dividend Option 10.6009
Direct Plan Monthly Dividend Option 12.5010
Direct Plan Growth Option 13.1954
Regular Plan Dividend Option 10.4660
Regular Plan Monthly Dividend Option 12.2451
Regular Plan Growth Option 12.9381
Minimum Investment Amount
Rs. 5000/- per application & in multiples of Re. 1/-
thereafter.
Additional investment amount
Rs. 1000/- per application & in multiples of Re. 1/-
thereafter
Exit Load
� If the units are redeemed / switched out on or
before 30 days from the date of allotment - 0.25%
� If the Units are redeemed / switched out on after
30 days from the date of allotment - Nil
Total Expense Ratios~:
Regular Plan 1.05%
Direct Plan 0.40%
~Does not include GST on Investment Management
fees.
Portfolio Analysis: Sector-Wise
Name of Instrument Industry % to Net Assets
Top Holdings
Scheme - Regular PlanBenchmark
$(Nifty 50 Arbitrage PR Index )Additional Benchmark
(Nifty 50 TR Index)Period
1 Year
3 Year
5 Year
Since Inception - Regular Plan
Returns* Returns*Value of Rs. 10000 Invested Returns*Value of Rs. 10000
InvestedValue of Rs. 10000
Invested
6.06% 10,601 4.39% 10,436 11.86% 11,176
6.53% 12,084 5.65% 11,788 7.38% 12,378
NA NA NA NA NA NA
7.10% 12,938 6.30% 12,576 9.59% 14,103
Fund Size
Month End AUM
Rs. 5,448.63 Crore
Monthly Average AUM
Rs. 6,036.44 Crore
# Yield to maturity (YTM), Modified Duration, Average Maturity and for Debt Portion.Macaulay Duration
**Risk free rate of return (FIMMDA Overnight MIBOR) 9.39%
Indiabulls Housing Finance Ltd. Finance 3.40JSW Steel Ltd. Ferrous Metals 2.80Sun Pharmaceutical Ind Ltd. Pharmaceuticals 2.70Bharti Airtel Ltd. Telecom - Services 2.46Dewan Housing Finance Corporation Ltd. Finance 1.72United Spirits Ltd. Consumer Non Durables 1.72DLF Ltd. Construction 1.56Aurobindo Pharma Ltd. Pharmaceuticals 1.47L&T Finance Holdings Ltd. Finance 1.47Grasim Industries Ltd. Cement 1.41State Bank of India Banks 1.36Tata Power Company Ltd. Power 1.31Titan Company Ltd. Consumer Durables 1.31Jindal Steel & Power Ltd. Ferrous Metals 1.28Lupin Ltd. Pharmaceuticals 1.14Maruti Suzuki India Ltd. Auto 1.13IDFC Bank Ltd. Banks 1.12ITC Ltd. Consumer Non Durables 1.05Tata Motors Ltd. Auto 0.96Bank of Baroda Banks 0.89Tata Motors Ltd. Auto 0.88CESC Ltd. Power 0.86LIC Housing Finance Ltd. Finance 0.85MRF Ltd. Auto Ancillaries 0.85Century Textiles & Industries Ltd. Cement 0.83NCC Ltd. Construction Project 0.77IDFC Ltd. Finance 0.74Power Finance Corporation Ltd. Finance 0.74Sun TV Network Ltd. Media & Entertainment 0.69ICICI Prudential Life Insurance Co Ltd. Finance 0.69Others 59.83
Fund Managers Details
Fund Managers Experience Managing Since
Equity Portion:
Mr. Bhavesh Jain 9 years 27-Jun-14
Debt Portion:
Mr. Dhawal Dalal 20 years 22-Dec-16
Asset Allocation (% of total)
4
Investors understand
that their principal will
be at moderately
low riskPast performance may or may not be sustained in future and should not be used as a basis for comparison with other investments. * CAGR Return.
Make price difference between markets work for youArbitrage Fund
An open ended scheme investing in arbitrage opportunities
Quantitative indicators
Total stocks in portfolio
124
Total Portfolio Turnover Ratio^Portfolio Turnover Ratio^
Equity2.18
F&O9.39
Debt0.75
12.32
Top 10 stocks
21.14%
(Quantity fully hedged against derivative)
(As on 31st March, 2018)
2.75%
2.92%
3.20%
3.60%
4.37%
4.62%
4.76%
6.29%
6.61%
13.40%
Construc�on
Cement
Telecom - Services
Power
Ferrous Metals
Consumer Non Durables
Auto
Banks
Pharmaceu�cals
Finance
65.83%
17.49%
16.69%
Equi�es Cash & Other receivables Debt
Yield to#maturity (YTM)
7.83%
Modified #Duration
0.64years Average
#Maturity
0.71years
Std. deviation
0.40%
Sharpe Ratio**
-7.64Beta
0.42
#MacaulayDuration
0.69years
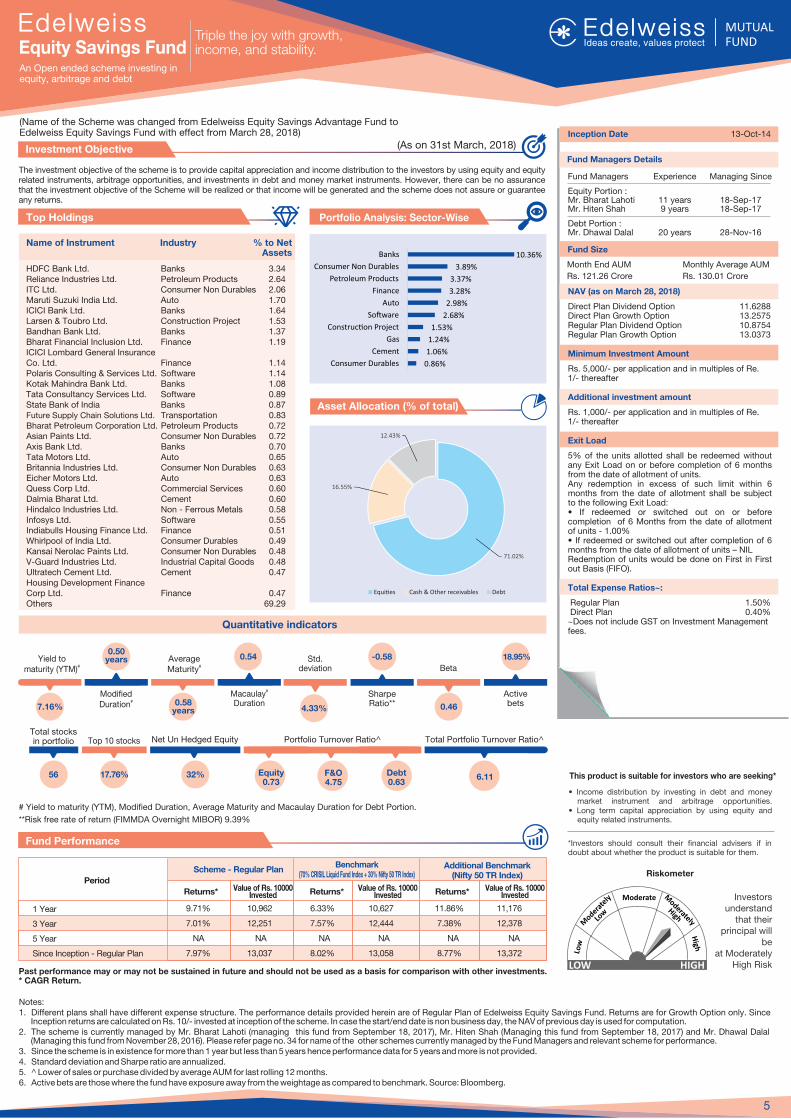
The investment objective of the scheme is to provide capital appreciation and income distribution to the investors by using equity and equity related instruments, arbitrage opportunities, and investments in debt and money market instruments. However, there can be no assurance that the investment objective of the Scheme will be realized or that income will be generated and the scheme does not assure or guarantee any returns.
Investment Objective
Fund Performance
LOW HIGH
Riskometer
This product is suitable for investors who are seeking*
� Income distribution by investing in debt and money market instrument and arbitrage opportunities.
� Long term capital appreciation by using equity and equity related instruments.
*Investors should consult their financial advisers if in doubt about whether the product is suitable for them.
Notes:1. Different plans shall have different expense structure. The performance details provided herein are of Regular Plan of Edelweiss Equity Savings Fund. Returns are for Growth Option only. Since
Inception returns are calculated on Rs. 10/- invested at inception of the scheme. In case the start/end date is non business day, the NAV of previous day is used for computation.2. The scheme is currently managed by Mr. Bharat Lahoti (managing this fund from September 18, 2017), Mr. Hiten Shah (Managing this fund from September 18, 2017) and Mr. Dhawal Dalal
(Managing this fund from November 28, 2016). Please refer page no. 34 for name of the other schemes currently managed by the Fund Managers and relevant scheme for performance.3. Since the scheme is in existence for more than 1 year but less than 5 years hence performance data for 5 years and more is not provided.4. Standard deviation and Sharpe ratio are annualized.5. ^ Lower of sales or purchase divided by average AUM for last rolling 12 months.6. Active bets are those where the fund have exposure away from the weightage as compared to benchmark. Source: Bloomberg.
Inception Date 13-Oct-14
NAV (as on March 28, 2018)
Direct Plan Dividend Option 11.6288Direct Plan Growth Option 13.2575Regular Plan Dividend Option 10.8754Regular Plan Growth Option 13.0373
Minimum Investment Amount
Rs. 5,000/- per application and in multiples of Re. 1/- thereafter
Additional investment amount
Rs. 1,000/- per application and in multiples of Re. 1/- thereafter
Exit Load
5% of the units allotted shall be redeemed without any Exit Load on or before completion of 6 months from the date of allotment of units.Any redemption in excess of such limit within 6 months from the date of allotment shall be subject to the following Exit Load:� If redeemed or switched out on or before completion of 6 Months from the date of allotment of units - 1.00%� If redeemed or switched out after completion of 6 months from the date of allotment of units � NILRedemption of units would be done on First in First out Basis (FIFO).
Total Expense Ratios~:
Regular Plan 1.50% Direct Plan 0.40%~Does not include GST on Investment Management fees.
Portfolio Analysis: Sector-Wise
Name of Instrument Industry % to Net Assets
Top Holdings
Scheme - Regular PlanBenchmark
(70% CRISIL Liquid Fund Index + 30% Nifty 50 TR Index)Additional Benchmark
(Nifty 50 TR Index)Period
1 Year
3 Year
5 Year
Since Inception - Regular Plan
Returns* Returns*Value of Rs. 10000 Invested Returns*Value of Rs. 10000
InvestedValue of Rs. 10000
Invested
9.71% 10,962 6.33% 10,627 11.86% 11,176
7.01% 12,251 7.57% 12,444 7.38% 12,378
NA NA NA NA NA NA
7.97% 13,037 8.02% 13,058 8.77% 13,372
Fund Size
Month End AUM
Rs. 121.26 Crore
Monthly Average AUM
Rs. 130.01 Crore
# Yield to maturity (YTM), Modified Duration, Average Maturity and for Debt Portion.Macaulay Duration
**Risk free rate of return (FIMMDA Overnight MIBOR) 9.39%
HDFC Bank Ltd. Banks 3.34Reliance Industries Ltd. Petroleum Products 2.64ITC Ltd. Consumer Non Durables 2.06Maruti Suzuki India Ltd. Auto 1.70ICICI Bank Ltd. Banks 1.64Larsen & Toubro Ltd. Construction Project 1.53Bandhan Bank Ltd. Banks 1.37Bharat Financial Inclusion Ltd. Finance 1.19ICICI Lombard General Insurance Co. Ltd. Finance 1.14Polaris Consulting & Services Ltd. Software 1.14Kotak Mahindra Bank Ltd. Banks 1.08Tata Consultancy Services Ltd. Software 0.89State Bank of India Banks 0.87Future Supply Chain Solutions Ltd. Transportation 0.83Bharat Petroleum Corporation Ltd. Petroleum Products 0.72Asian Paints Ltd. Consumer Non Durables 0.72Axis Bank Ltd. Banks 0.70Tata Motors Ltd. Auto 0.65Britannia Industries Ltd. Consumer Non Durables 0.63Eicher Motors Ltd. Auto 0.63Quess Corp Ltd. Commercial Services 0.60Dalmia Bharat Ltd. Cement 0.60Hindalco Industries Ltd. Non - Ferrous Metals 0.58Infosys Ltd. Software 0.55Indiabulls Housing Finance Ltd. Finance 0.51Whirlpool of India Ltd. Consumer Durables 0.49Kansai Nerolac Paints Ltd. Consumer Non Durables 0.48V-Guard Industries Ltd. Industrial Capital Goods 0.48Ultratech Cement Ltd. Cement 0.47Housing Development Finance Corp Ltd. Finance 0.47Others 69.29
Fund Managers Details
Fund Managers Experience Managing Since
Equity Portion :Mr. Bharat Lahoti 11 years 18-Sep-17Mr. Hiten Shah 9 years 18-Sep-17
Debt Portion :Mr. Dhawal Dalal 20 years 28-Nov-16
Asset Allocation (% of total)
5
Investors understand
that their principal will
beat Moderately
High RiskPast performance may or may not be sustained in future and should not be used as a basis for comparison with other investments. * CAGR Return.
Triple the joy with growth, income, and stability.Equity Savings Fund
An Open ended scheme investing in equity, arbitrage and debt
Quantitative indicators
Total stocks in portfolio
56
Portfolio Turnover Ratio^
Equity0.73
F&O4.75
Debt0.63
Total Portfolio Turnover Ratio^
6.11
Top 10 stocks
17.76%
Net Un Hedged Equity
32%
(As on 31st March, 2018)
0.86%
1.06%
1.24%
1.53%
2.68%
2.98%
3.28%
3.37%
3.89%
10.36%
Consumer Durables
Cement
Gas
Construc�on Project
So�ware
Auto
Finance
Petroleum Products
Consumer Non Durables
Banks
71.02%
16.55%
12.43%
Equi�es Cash & Other receivables Debt
(Name of the Scheme was changed from Edelweiss Equity Savings Advantage Fund to Edelweiss Equity Savings Fund with effect from March 28, 2018)
Yield to#
maturity (YTM)
7.16%
Modified #
Duration
0.50years Average
#Maturity
0.58years
Std. deviation
4.33%
Sharpe Ratio**
-0.58
Beta
0.46
Active bets
18.95%
#MacaulayDuration
0.54
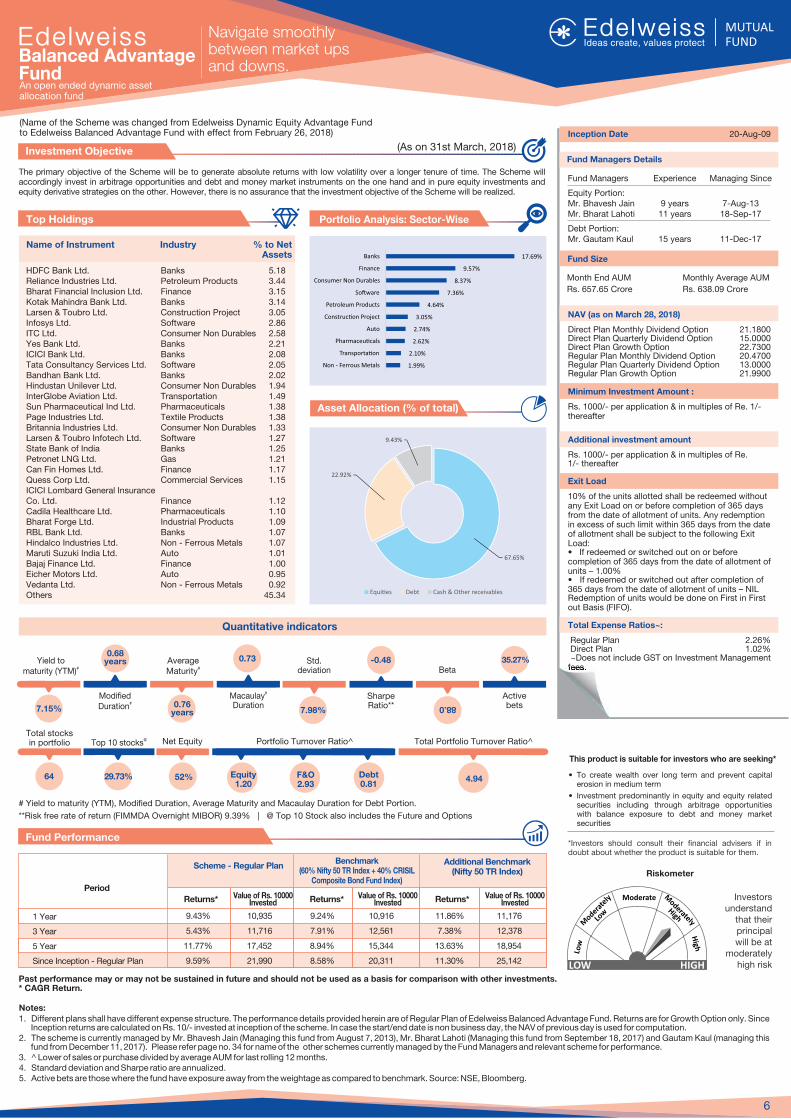
The primary objective of the Scheme will be to generate absolute returns with low volatility over a longer tenure of time. The Scheme will accordingly invest in arbitrage opportunities and debt and money market instruments on the one hand and in pure equity investments and equity derivative strategies on the other. However, there is no assurance that the investment objective of the Scheme will be realized.
Investment Objective
Fund Performance
This product is suitable for investors who are seeking*
� To create wealth over long term and prevent capital erosion in medium term
� Investment predominantly in equity and equity related securities including through arbitrage opportunities with balance exposure to debt and money market securities
*Investors should consult their financial advisers if in doubt about whether the product is suitable for them.
Notes:1. Different plans shall have different expense structure. The performance details provided herein are of Regular Plan of Edelweiss Balanced Advantage Fund. Returns are for Growth Option only. Since
Inception returns are calculated on Rs. 10/- invested at inception of the scheme. In case the start/end date is non business day, the NAV of previous day is used for computation.2. The scheme is currently managed by Mr. Bhavesh Jain (Managing this fund from August 7, 2013), Mr. Bharat Lahoti (Managing this fund from September 18, 2017) and Gautam Kaul (managing this
fund from December 11, 2017). Please refer page no. 34 for name of the other schemes currently managed by the Fund Managers and relevant scheme for performance.3. ^ Lower of sales or purchase divided by average AUM for last rolling 12 months. 4. Standard deviation and Sharpe ratio are annualized.5. Active bets are those where the fund have exposure away from the weightage as compared to benchmark. Source: NSE, Bloomberg.
Inception Date 20-Aug-09
NAV (as on March 28, 2018)
Direct Plan Monthly Dividend Option 21.1800Direct Plan Quarterly Dividend Option 15.0000Direct Plan Growth Option 22.7300Regular Plan Monthly Dividend Option 20.4700Regular Plan Quarterly Dividend Option 13.0000Regular Plan Growth Option 21.9900
Minimum Investment Amount :
Rs. 1000/- per application & in multiples of Re. 1/-thereafter
Additional investment amount
Rs. 1000/- per application & in multiples of Re.1/- thereafter
Exit Load
10% of the units allotted shall be redeemed without any Exit Load on or before completion of 365 days from the date of allotment of units. Any redemption in excess of such limit within 365 days from the date of allotment shall be subject to the following Exit Load: � If redeemed or switched out on or before completion of 365 days from the date of allotment of units � 1.00% � If redeemed or switched out after completion of 365 days from the date of allotment of units � NIL Redemption of units would be done on First in First out Basis (FIFO).
Total Expense Ratios~:
Regular Plan 2.26% Direct Plan 1.02% ~Does not include GST on Investment Management fees.
Portfolio Analysis: Sector-Wise
Name of Instrument Industry % to Net Assets
Top Holdings
Scheme - Regular PlanBenchmark Additional Benchmark
(Nifty 50 TR Index)
Period
1 Year
3 Year
5 Year
Since Inception - Regular Plan
Returns* Returns*Value of Rs. 10000 Invested Returns*Value of Rs. 10000
InvestedValue of Rs. 10000
Invested
9.43% 10,935 9.24% 10,916 11.86% 11,176
5.43% 11,716 7.91% 12,561 7.38% 12,378
11.77% 17,452 8.94% 15,344 13.63% 18,954
9.59% 21,990 8.58% 20,311 11.30% 25,142
Fund Size
Month End AUM
Rs. 657.65 Crore
Monthly Average AUM
Rs. 638.09 Crore
# Yield to maturity (YTM), Modified Duration, Average Maturity and for Debt Portion.Macaulay Duration
**Risk free rate of return (FIMMDA Overnight MIBOR) 9.39% | @ Top 10 Stock also includes the Future and Options
HDFC Bank Ltd. Banks 5.18Reliance Industries Ltd. Petroleum Products 3.44Bharat Financial Inclusion Ltd. Finance 3.15Kotak Mahindra Bank Ltd. Banks 3.14Larsen & Toubro Ltd. Construction Project 3.05Infosys Ltd. Software 2.86ITC Ltd. Consumer Non Durables 2.58Yes Bank Ltd. Banks 2.21ICICI Bank Ltd. Banks 2.08Tata Consultancy Services Ltd. Software 2.05Bandhan Bank Ltd. Banks 2.02Hindustan Unilever Ltd. Consumer Non Durables 1.94InterGlobe Aviation Ltd. Transportation 1.49Sun Pharmaceutical Ind Ltd. Pharmaceuticals 1.38Page Industries Ltd. Textile Products 1.38Britannia Industries Ltd. Consumer Non Durables 1.33Larsen & Toubro Infotech Ltd. Software 1.27State Bank of India Banks 1.25Petronet LNG Ltd. Gas 1.21Can Fin Homes Ltd. Finance 1.17Quess Corp Ltd. Commercial Services 1.15ICICI Lombard General Insurance Co. Ltd. Finance 1.12Cadila Healthcare Ltd. Pharmaceuticals 1.10Bharat Forge Ltd. Industrial Products 1.09RBL Bank Ltd. Banks 1.07Hindalco Industries Ltd. Non - Ferrous Metals 1.07Maruti Suzuki India Ltd. Auto 1.01Bajaj Finance Ltd. Finance 1.00Eicher Motors Ltd. Auto 0.95Vedanta Ltd. Non - Ferrous Metals 0.92Others 45.34
Fund Managers Details
Asset Allocation (% of total)
fees.
6
Past performance may or may not be sustained in future and should not be used as a basis for comparison with other investments. * CAGR Return.
(60% Nifty 50 TR Index + 40% CRISIL Composite Bond Fund Index)
LOW HIGH
Riskometer
Investors understand
that their principal will be at
moderately high risk
Fund Managers Experience Managing Since
Equity Portion:Mr. Bhavesh Jain 9 years 7-Aug-13 Mr. Bharat Lahoti 11 years 18-Sep-17
Debt Portion:Mr. Gautam Kaul 15 years 11-Dec-17
Quantitative indicators
Yield to#maturity (YTM)
Total Portfolio Turnover Ratio^
7.15%
Modified #Duration
0.68years Average
#Maturity
0.76years
Std. deviation
7.98%
Sharpe Ratio**
-0.48Beta
0.88
Total stocks in portfolio
64
Portfolio Turnover Ratio^
Equity1.20
F&O2.93
Debt0.81
4.94
Active bets
35.27%
@Top 10 stocks
29.73%
Net Equity
52%
(As on 31st March, 2018)
Navigate smoothly between market ups and downs.
Balanced Advantage FundAn open ended dynamic assetallocation fund
(Name of the Scheme was changed from Edelweiss Dynamic Equity Advantage Fund to Edelweiss Balanced Advantage Fund with effect from February 26, 2018)
1.99%
2.10%
2.62%
2.74%
3.05%
4.64%
7.36%
8.37%
9.57%
17.69%
Non - Ferrous Metals
Transporta�on
Pharmaceu�cals
Auto
Construc�on Project
Petroleum Products
So�ware
Consumer Non Durables
Finance
Banks
67.65%
22.92%
9.43%
Equi�es Debt Cash & Other receivables
#Macaulay Duration
0.73
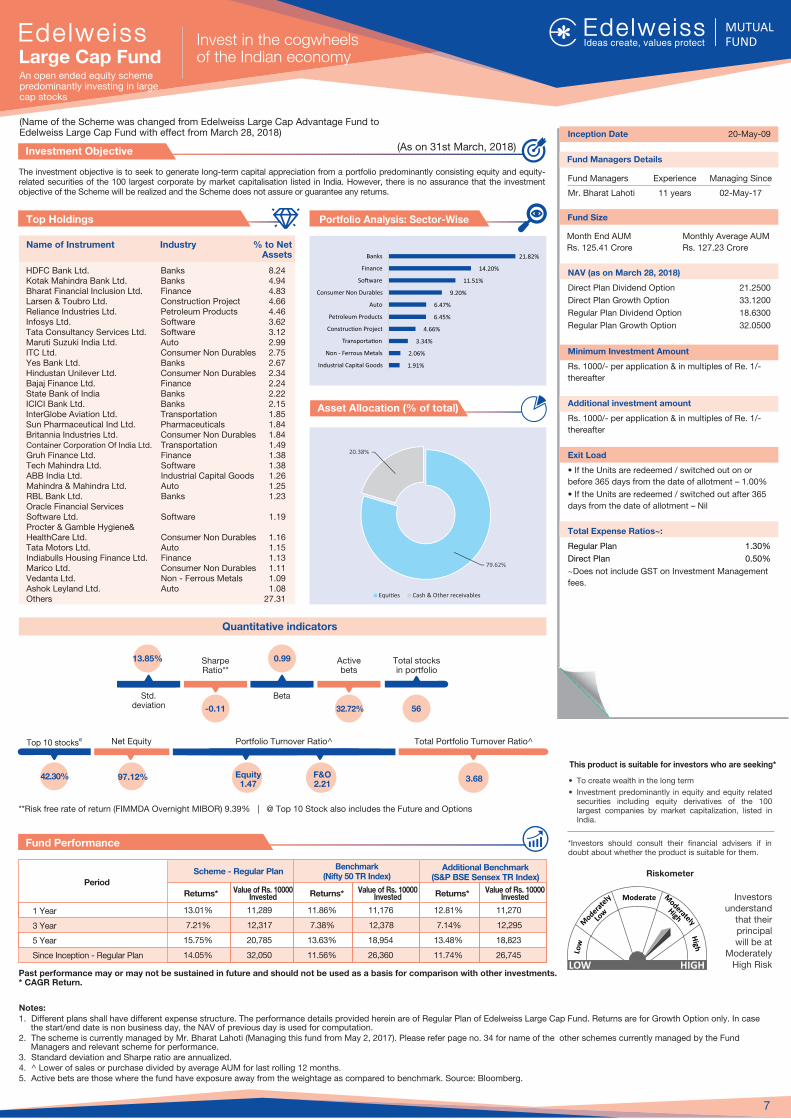
The investment objective is to seek to generate long-term capital appreciation from a portfolio predominantly consisting equity and equity-related securities of the 100 largest corporate by market capitalisation listed in India. However, there is no assurance that the investment objective of the Scheme will be realized and the Scheme does not assure or guarantee any returns.
Investment Objective
Fund Performance
This product is suitable for investors who are seeking*
� To create wealth in the long term
� Investment predominantly in equity and equity related securities including equity derivatives of the 100 largest companies by market capitalization, listed in India.
*Investors should consult their financial advisers if in doubt about whether the product is suitable for them.
Notes:1. Different plans shall have different expense structure. The performance details provided herein are of Regular Plan of Edelweiss Large Cap Fund. Returns are for Growth Option only. In case
the start/end date is non business day, the NAV of previous day is used for computation.2. The scheme is currently managed by Mr. Bharat Lahoti (Managing this fund from May 2, 2017). Please refer page no. 34 for name of the other schemes currently managed by the Fund
Managers and relevant scheme for performance.3. Standard deviation and Sharpe ratio are annualized.4. ^ Lower of sales or purchase divided by average AUM for last rolling 12 months. 5. Active bets are those where the fund have exposure away from the weightage as compared to benchmark. Source: Bloomberg.
Inception Date 20-May-09
NAV (as on March 28, 2018)
Direct Plan Dividend Option 21.2500
Direct Plan Growth Option 33.1200
Regular Plan Dividend Option 18.6300
Regular Plan Growth Option 32.0500
Minimum Investment Amount
Rs. 1000/- per application & in multiples of Re. 1/-
thereafter
Additional investment amount
Rs. 1000/- per application & in multiples of Re. 1/-
thereafter
Exit Load
� If the Units are redeemed / switched out on or
before 365 days from the date of allotment � 1.00%
� If the Units are redeemed / switched out after 365
days from the date of allotment � Nil
Total Expense Ratios~:
Regular Plan 1.30%
Direct Plan 0.50%
~Does not include GST on Investment Management
fees.
Portfolio Analysis: Sector-Wise
Name of Instrument Industry % to Net Assets
Top Holdings
Scheme - Regular PlanBenchmark
(Nifty 50 TR Index)Additional Benchmark
(S&P BSE Sensex TR Index)Period
1 Year
3 Year
5 Year
Since Inception - Regular Plan
Returns* Returns*Value of Rs. 10000 Invested Returns*Value of Rs. 10000
InvestedValue of Rs. 10000
Invested
13.01% 11,289 11.86% 11,176 12.81% 11,270
7.21% 12,317 7.38% 12,378 7.14% 12,295
15.75% 20,785 13.63% 18,954 13.48% 18,823
14.05% 32,050 11.56% 26,360 11.74% 26,745
Fund Size
Month End AUM
Rs. 125.41 Crore
Monthly Average AUM
Rs. 127.23 Crore
**Risk free rate of return (FIMMDA Overnight MIBOR) 9.39% | @ Top 10 Stock also includes the Future and Options
HDFC Bank Ltd. Banks 8.24Kotak Mahindra Bank Ltd. Banks 4.94Bharat Financial Inclusion Ltd. Finance 4.83Larsen & Toubro Ltd. Construction Project 4.66Reliance Industries Ltd. Petroleum Products 4.46Infosys Ltd. Software 3.62Tata Consultancy Services Ltd. Software 3.12Maruti Suzuki India Ltd. Auto 2.99ITC Ltd. Consumer Non Durables 2.75Yes Bank Ltd. Banks 2.67Hindustan Unilever Ltd. Consumer Non Durables 2.34Bajaj Finance Ltd. Finance 2.24State Bank of India Banks 2.22ICICI Bank Ltd. Banks 2.15InterGlobe Aviation Ltd. Transportation 1.85Sun Pharmaceutical Ind Ltd. Pharmaceuticals 1.84Britannia Industries Ltd. Consumer Non Durables 1.84Container Corporation Of India Ltd. Transportation 1.49Gruh Finance Ltd. Finance 1.38Tech Mahindra Ltd. Software 1.38ABB India Ltd. Industrial Capital Goods 1.26Mahindra & Mahindra Ltd. Auto 1.25RBL Bank Ltd. Banks 1.23Oracle Financial Services Software Ltd. Software 1.19Procter & Gamble Hygiene&HealthCare Ltd. Consumer Non Durables 1.16Tata Motors Ltd. Auto 1.15Indiabulls Housing Finance Ltd. Finance 1.13Marico Ltd. Consumer Non Durables 1.11Vedanta Ltd. Non - Ferrous Metals 1.09Ashok Leyland Ltd. Auto 1.08Others 27.31
Fund Managers Details
Fund Managers Experience Managing Since
Mr. Bharat Lahoti 11 years 02-May-17
Asset Allocation (% of total)
7
Past performance may or may not be sustained in future and should not be used as a basis for comparison with other investments. * CAGR Return.
Invest in the cogwheels of the Indian economyLarge Cap Fund
An open ended equity scheme predominantly investing in large cap stocks
LOW HIGH
Riskometer
Investors understand
that their principal will be at
Moderately High Risk
Quantitative indicators
Total Portfolio Turnover Ratio^Portfolio Turnover Ratio^
3.68
Std. deviation
13.85% Sharpe Ratio**
-0.11
Beta
0.99 Total stocks in portfolio
56
Active bets
32.72%
@Top 10 stocks
42.30%
Net Equity
97.12% Equity1.47
F&O2.21
(As on 31st March, 2018)
Equi�es Cash & Other receivables
1.91%
2.06%
3.34%
4.66%
6.45%
6.47%
9.20%
11.51%
14.20%
21.82%
Industrial Capital Goods
Non - Ferrous Metals
Transporta�on
Construc�on Project
Petroleum Products
Auto
Consumer Non Durables
So�ware
Finance
Banks
79.62%
20.38%
(Name of the Scheme was changed from Edelweiss Large Cap Advantage Fund to Edelweiss Large Cap Fund with effect from March 28, 2018)
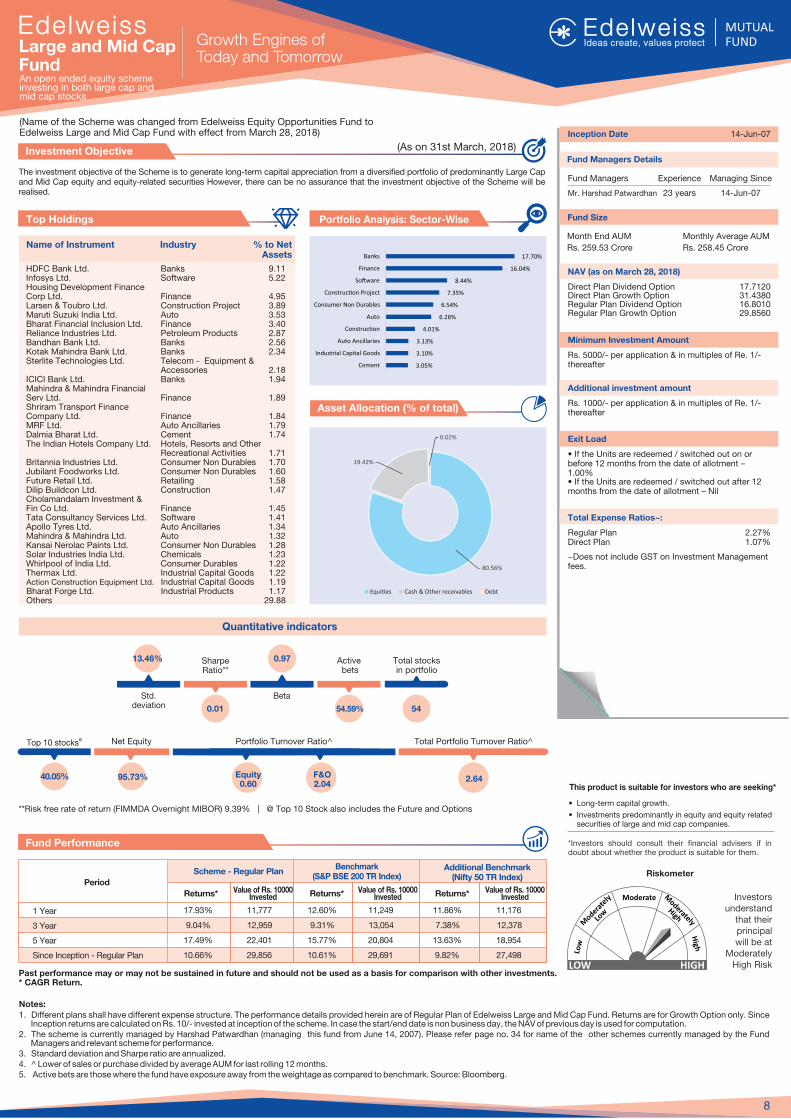
The investment objective of the Scheme is to generate long-term capital appreciation from a diversified portfolio of predominantly Large Cap and Mid Cap equity and equity-related securities However, there can be no assurance that the investment objective of the Scheme will be realised.
Investment Objective
Fund Performance
This product is suitable for investors who are seeking*
� Long-term capital growth.
� Investments predominantly in equity and equity related securities of large and mid cap companies.
*Investors should consult their financial advisers if in doubt about whether the product is suitable for them.
Notes:1. Different plans shall have different expense structure. The performance details provided herein are of Regular Plan of Edelweiss Large and Mid Cap Fund. Returns are for Growth Option only. Since
Inception returns are calculated on Rs. 10/- invested at inception of the scheme. In case the start/end date is non business day, the NAV of previous day is used for computation.2. The scheme is currently managed by Harshad Patwardhan (managing this fund from June 14, 2007). Please refer page no. 34 for name of the other schemes currently managed by the Fund
Managers and relevant scheme for performance.3. Standard deviation and Sharpe ratio are annualized.4. ^ Lower of sales or purchase divided by average AUM for last rolling 12 months. 5. Active bets are those where the fund have exposure away from the weightage as compared to benchmark. Source: Bloomberg.
Inception Date 14-Jun-07
NAV (as on March 28, 2018)
Direct Plan Dividend Option 17.7120Direct Plan Growth Option 31.4380Regular Plan Dividend Option 16.8010Regular Plan Growth Option 29.8560
Minimum Investment Amount
Rs. 5000/- per application & in multiples of Re. 1/- thereafter
Additional investment amount
Rs. 1000/- per application & in multiples of Re. 1/- thereafter
Exit Load
� If the Units are redeemed / switched out on or before 12 months from the date of allotment � 1.00%� If the Units are redeemed / switched out after 12 months from the date of allotment � Nil
Total Expense Ratios~:
Regular Plan 2.27%Direct Plan 1.07%
~Does not include GST on Investment Management fees.
Portfolio Analysis: Sector-Wise
Name of Instrument Industry % to Net Assets
Top Holdings
Scheme - Regular PlanBenchmark
(S&P BSE 200 TR Index)Additional Benchmark
(Nifty 50 TR Index)Period
1 Year
3 Year
5 Year
Since Inception - Regular Plan
Returns* Returns*Value of Rs. 10000 Invested Returns*Value of Rs. 10000
InvestedValue of Rs. 10000
Invested
17.93% 11,777 12.60% 11,249 11.86% 11,176
9.04% 12,959 9.31% 13,054 7.38% 12,378
17.49% 22,401 15.77% 20,804 13.63% 18,954
10.66% 29,856 10.61% 29,691 9.82% 27,498
Fund Size
**Risk free rate of return (FIMMDA Overnight MIBOR) 9.39% | @ Top 10 Stock also includes the Future and Options
HDFC Bank Ltd. Banks 9.11Infosys Ltd. Software 5.22Housing Development Finance Corp Ltd. Finance 4.95Larsen & Toubro Ltd. Construction Project 3.89Maruti Suzuki India Ltd. Auto 3.53Bharat Financial Inclusion Ltd. Finance 3.40Reliance Industries Ltd. Petroleum Products 2.87Bandhan Bank Ltd. Banks 2.56Kotak Mahindra Bank Ltd. Banks 2.34Sterlite Technologies Ltd. Telecom - Equipment & Accessories 2.18ICICI Bank Ltd. Banks 1.94Mahindra & Mahindra Financial Serv Ltd. Finance 1.89Shriram Transport Finance Company Ltd. Finance 1.84MRF Ltd. Auto Ancillaries 1.79Dalmia Bharat Ltd. Cement 1.74The Indian Hotels Company Ltd. Hotels, Resorts and Other Recreational Activities 1.71Britannia Industries Ltd. Consumer Non Durables 1.70Jubilant Foodworks Ltd. Consumer Non Durables 1.60Future Retail Ltd. Retailing 1.58Dilip Buildcon Ltd. Construction 1.47Cholamandalam Investment & Fin Co Ltd. Finance 1.45Tata Consultancy Services Ltd. Software 1.41Apollo Tyres Ltd. Auto Ancillaries 1.34Mahindra & Mahindra Ltd. Auto 1.32Kansai Nerolac Paints Ltd. Consumer Non Durables 1.28Solar Industries India Ltd. Chemicals 1.23Whirlpool of India Ltd. Consumer Durables 1.22Thermax Ltd. Industrial Capital Goods 1.22Action Construction Equipment Ltd. Industrial Capital Goods 1.19Bharat Forge Ltd. Industrial Products 1.17Others 29.88
Fund Managers Details
Fund Managers Experience Managing Since
Mr. Harshad Patwardhan 23 years 14-Jun-07
Asset Allocation (% of total)
8
Past performance may or may not be sustained in future and should not be used as a basis for comparison with other investments. * CAGR Return.
Large and Mid Cap FundAn open ended equity scheme investing in both large cap and mid cap stocks
LOW HIGH
Riskometer
Investors understand
that their principal will be at
Moderately High Risk
Quantitative indicators
Total Portfolio Turnover Ratio^Portfolio Turnover Ratio^
2.64
Std. deviation
13.46% Sharpe Ratio**
0.01
Beta
0.97 Total stocks in portfolio
54
Active bets
54.59%
@Top 10 stocks
40.05%
Net Equity
95.73% Equity0.60
F&O2.04
(As on 31st March, 2018)
Month End AUM
Rs. 259.53 Crore
Monthly Average AUM
Rs. 258.45 Crore
3.05%
3.10%
3.13%
4.01%
6.26%
6.54%
7.35%
8.44%
16.04%
17.70%
Cement
Industrial Capital Goods
Auto Ancillaries
Construc�on
Auto
Consumer Non Durables
Construc�on Project
So�ware
Finance
Banks
Equi�es Cash & Other receivables Debt
80.56%
19.42%
0.02%
(Name of the Scheme was changed from Edelweiss Equity Opportunities Fund to Edelweiss Large and Mid Cap Fund with effect from March 28, 2018)
Growth Engines of Today and Tomorrow
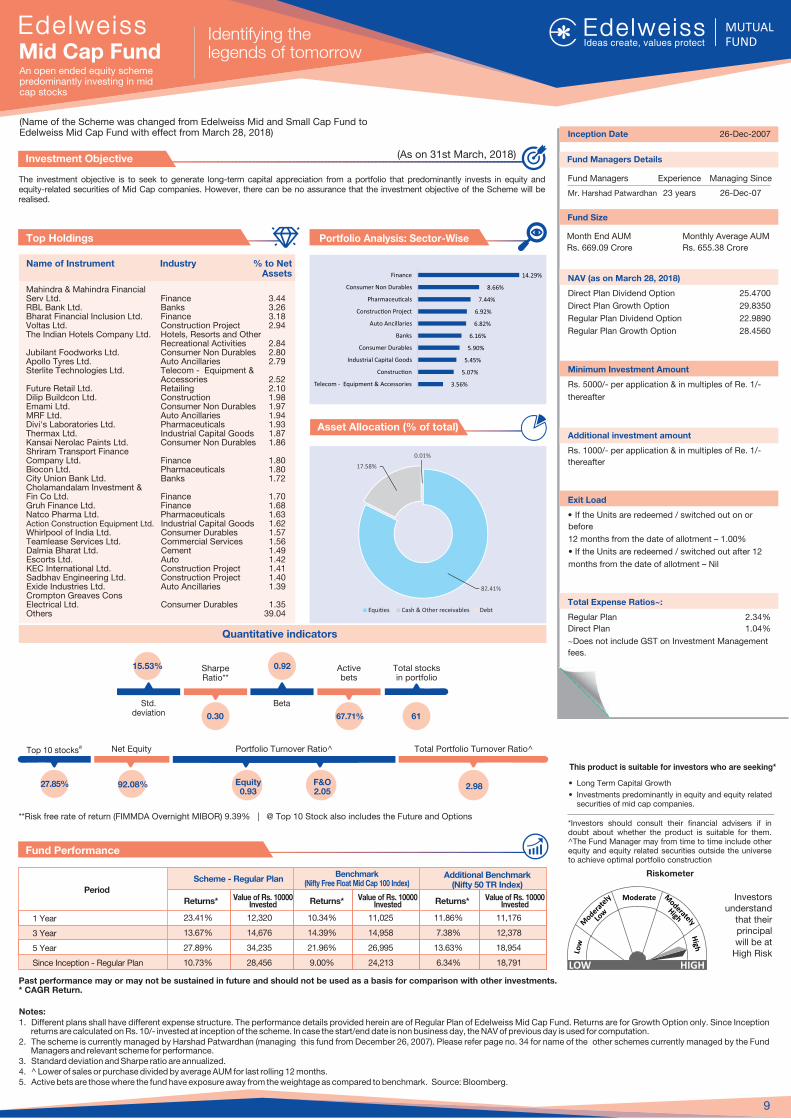
The investment objective is to seek to generate long-term capital appreciation from a portfolio that predominantly invests in equity and equity-related securities of Mid Cap companies. However, there can be no assurance that the investment objective of the Scheme will be realised.
Investment Objective
Fund Performance
This product is suitable for investors who are seeking*
� Long Term Capital Growth
� Investments predominantly in equity and equity related securities of mid cap companies.
*Investors should consult their financial advisers if in doubt about whether the product is suitable for them. ^The Fund Manager may from time to time include other equity and equity related securities outside the universe to achieve optimal portfolio construction
Notes:1. Different plans shall have different expense structure. The performance details provided herein are of Regular Plan of Edelweiss Mid Cap Fund. Returns are for Growth Option only. Since Inception
returns are calculated on Rs. 10/- invested at inception of the scheme. In case the start/end date is non business day, the NAV of previous day is used for computation.2. The scheme is currently managed by Harshad Patwardhan (managing this fund from December 26, 2007). Please refer page no. 34 for name of the other schemes currently managed by the Fund
Managers and relevant scheme for performance.3. Standard deviation and Sharpe ratio are annualized.4. ^ Lower of sales or purchase divided by average AUM for last rolling 12 months. 5. Active bets are those where the fund have exposure away from the weightage as compared to benchmark. Source: Bloomberg.
Inception Date 26-Dec-2007
NAV (as on March 28, 2018)
Direct Plan Dividend Option 25.4700
Direct Plan Growth Option 29.8350
Regular Plan Dividend Option 22.9890
Regular Plan Growth Option 28.4560
Minimum Investment Amount
Rs. 5000/- per application & in multiples of Re. 1/-
thereafter
Additional investment amount
Rs. 1000/- per application & in multiples of Re. 1/-
thereafter
Exit Load
� If the Units are redeemed / switched out on or
before
12 months from the date of allotment � 1.00%
� If the Units are redeemed / switched out after 12
months from the date of allotment � Nil
Total Expense Ratios~:
Regular Plan 2.34%
Direct Plan 1.04%
~Does not include GST on Investment Management
fees.
Portfolio Analysis: Sector-Wise
Name of Instrument Industry % to Net Assets
Top Holdings
Scheme - Regular PlanBenchmark Additional Benchmark
(Nifty 50 TR Index)Period
1 Year
3 Year
5 Year
Since Inception - Regular Plan
Returns* Returns*Value of Rs. 10000 Invested Returns*Value of Rs. 10000
InvestedValue of Rs. 10000
Invested
23.41% 12,320 10.34% 11,025 11.86% 11,176
13.67% 14,676 14.39% 14,958 7.38% 12,378
27.89% 34,235 21.96% 26,995 13.63% 18,954
10.73% 28,456 9.00% 24,213 6.34% 18,791
Fund Size
Month End AUM
Rs. 669.09 Crore
Monthly Average AUM
Rs. 655.38 Crore
**Risk free rate of return (FIMMDA Overnight MIBOR) 9.39% | @ Top 10 Stock also includes the Future and Options
Mahindra & Mahindra Financial Serv Ltd. Finance 3.44RBL Bank Ltd. Banks 3.26Bharat Financial Inclusion Ltd. Finance 3.18Voltas Ltd. Construction Project 2.94The Indian Hotels Company Ltd. Hotels, Resorts and Other Recreational Activities 2.84Jubilant Foodworks Ltd. Consumer Non Durables 2.80Apollo Tyres Ltd. Auto Ancillaries 2.79Sterlite Technologies Ltd. Telecom - Equipment & Accessories 2.52Future Retail Ltd. Retailing 2.10Dilip Buildcon Ltd. Construction 1.98Emami Ltd. Consumer Non Durables 1.97MRF Ltd. Auto Ancillaries 1.94Divi's Laboratories Ltd. Pharmaceuticals 1.93Thermax Ltd. Industrial Capital Goods 1.87Kansai Nerolac Paints Ltd. Consumer Non Durables 1.86Shriram Transport Finance Company Ltd. Finance 1.80Biocon Ltd. Pharmaceuticals 1.80City Union Bank Ltd. Banks 1.72Cholamandalam Investment & Fin Co Ltd. Finance 1.70Gruh Finance Ltd. Finance 1.68Natco Pharma Ltd. Pharmaceuticals 1.63Action Construction Equipment Ltd. Industrial Capital Goods 1.62Whirlpool of India Ltd. Consumer Durables 1.57Teamlease Services Ltd. Commercial Services 1.56Dalmia Bharat Ltd. Cement 1.49Escorts Ltd. Auto 1.42KEC International Ltd. Construction Project 1.41Sadbhav Engineering Ltd. Construction Project 1.40Exide Industries Ltd. Auto Ancillaries 1.39Crompton Greaves Cons Electrical Ltd. Consumer Durables 1.35Others 39.04
Fund Managers Details
Fund Managers Experience Managing Since
Mr. Harshad Patwardhan 23 years 26-Dec-07
Asset Allocation (% of total)
9
Past performance may or may not be sustained in future and should not be used as a basis for comparison with other investments. * CAGR Return.
Identifying the legends of tomorrowMid Cap Fund
An open ended equity scheme predominantly investing in mid cap stocks
(Nifty Free Float Mid Cap 100 Index)
LOW HIGH
Riskometer
Investors understand
that their principal will be at
High Risk
Quantitative indicators
Total Portfolio Turnover Ratio^Portfolio Turnover Ratio^
2.98
Std. deviation
15.53% Sharpe Ratio**
0.30
Beta
0.92 Total stocks in portfolio
61
Active bets
67.71%
@Top 10 stocks
27.85%
Net Equity
92.08% Equity0.93
F&O2.05
(As on 31st March, 2018)
Equi�es Cash & Other receivables Debt
3.56%
5.07%
5.45%
5.90%
6.16%
6.82%
6.92%
7.44%
8.66%
14.29%
Telecom - Equipment & Accessories
Construc�on
Industrial Capital Goods
Consumer Durables
Banks
Auto Ancillaries
Construc�on Project
Pharmaceu�cals
Consumer Non Durables
Finance
82.41%
17.58%
0.01%
(Name of the Scheme was changed from Edelweiss Mid and Small Cap Fund to Edelweiss Mid Cap Fund with effect from March 28, 2018)
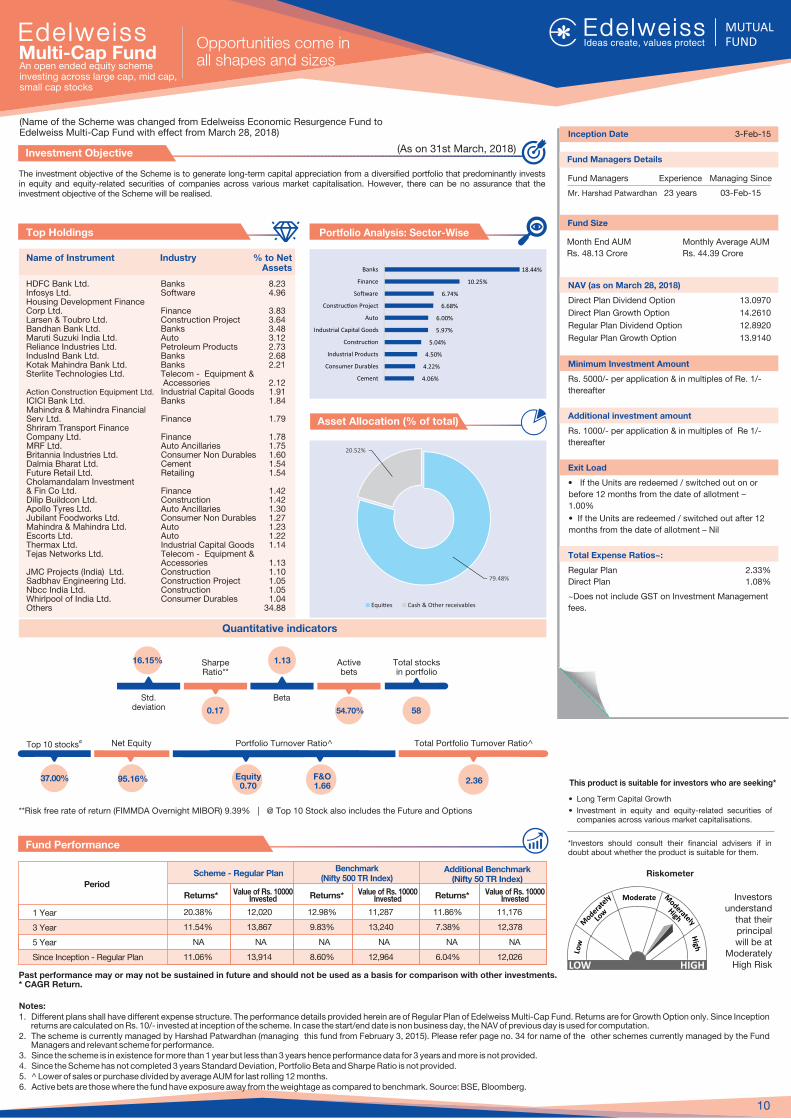
The investment objective of the Scheme is to generate long-term capital appreciation from a diversified portfolio that predominantly invests in equity and equity-related securities of companies across various market capitalisation. However, there can be no assurance that the investment objective of the Scheme will be realised.
Investment Objective
Fund Performance
This product is suitable for investors who are seeking*
� Long Term Capital Growth
� Investment in equity and equity-related securities of companies across various market capitalisations.
*Investors should consult their financial advisers if in doubt about whether the product is suitable for them.
Notes:1. Different plans shall have different expense structure. The performance details provided herein are of Regular Plan of Edelweiss Multi-Cap Fund. Returns are for Growth Option only. Since Inception
returns are calculated on Rs. 10/- invested at inception of the scheme. In case the start/end date is non business day, the NAV of previous day is used for computation.2. The scheme is currently managed by Harshad Patwardhan (managing this fund from February 3, 2015). Please refer page no. 34 for name of the other schemes currently managed by the Fund
Managers and relevant scheme for performance.3. Since the scheme is in existence for more than 1 year but less than 3 years hence performance data for 3 years and more is not provided.4. Since the Scheme has not completed 3 years Standard Deviation, Portfolio Beta and Sharpe Ratio is not provided.5. ^ Lower of sales or purchase divided by average AUM for last rolling 12 months. 6. Active bets are those where the fund have exposure away from the weightage as compared to benchmark. Source: BSE, Bloomberg.
Inception Date 3-Feb-15
NAV (as on March 28, 2018)
Direct Plan Dividend Option 13.0970
Direct Plan Growth Option 14.2610
Regular Plan Dividend Option 12.8920
Regular Plan Growth Option 13.9140
Minimum Investment Amount
Rs. 5000/- per application & in multiples of Re. 1/-
thereafter
Additional investment amount
Rs. 1000/- per application & in multiples of Re 1/-
thereafter
Exit Load
� If the Units are redeemed / switched out on or
before 12 months from the date of allotment �
1.00%
� If the Units are redeemed / switched out after 12
months from the date of allotment � Nil
Total Expense Ratios~:
Regular Plan 2.33%
Direct Plan 1.08%
~Does not include GST on Investment Management
fees.
Portfolio Analysis: Sector-Wise
Name of Instrument Industry % to Net Assets
Top Holdings
Scheme - Regular PlanBenchmark
(Nifty 500 TR Index)Additional Benchmark
(Nifty 50 TR Index)Period
1 Year
3 Year
5 Year
Since Inception - Regular Plan
Returns* Returns*Value of Rs. 10000 Invested Returns*Value of Rs. 10000
InvestedValue of Rs. 10000
Invested
20.38% 12,020 12.98% 11,287 11.86% 11,176
11.54% 13,867 9.83% 13,240 7.38% 12,378
NA NA NA NA NA NA
11.06% 13,914 8.60% 12,964 6.04% 12,026
Fund Size
Month End AUM
Rs. 48.13 Crore
Monthly Average AUM
Rs. 44.39 Crore
**Risk free rate of return (FIMMDA Overnight MIBOR) 9.39% | @ Top 10 Stock also includes the Future and Options
HDFC Bank Ltd. Banks 8.23Infosys Ltd. Software 4.96Housing Development Finance Corp Ltd. Finance 3.83Larsen & Toubro Ltd. Construction Project 3.64Bandhan Bank Ltd. Banks 3.48Maruti Suzuki India Ltd. Auto 3.12Reliance Industries Ltd. Petroleum Products 2.73IndusInd Bank Ltd. Banks 2.68Kotak Mahindra Bank Ltd. Banks 2.21Sterlite Technologies Ltd. Telecom - Equipment & Accessories 2.12Action Construction Equipment Ltd. Industrial Capital Goods 1.91ICICI Bank Ltd. Banks 1.84Mahindra & Mahindra Financial Serv Ltd. Finance 1.79Shriram Transport Finance Company Ltd. Finance 1.78MRF Ltd. Auto Ancillaries 1.75Britannia Industries Ltd. Consumer Non Durables 1.60Dalmia Bharat Ltd. Cement 1.54Future Retail Ltd. Retailing 1.54Cholamandalam Investment & Fin Co Ltd. Finance 1.42Dilip Buildcon Ltd. Construction 1.42Apollo Tyres Ltd. Auto Ancillaries 1.30Jubilant Foodworks Ltd. Consumer Non Durables 1.27Mahindra & Mahindra Ltd. Auto 1.23Escorts Ltd. Auto 1.22Thermax Ltd. Industrial Capital Goods 1.14Tejas Networks Ltd. Telecom - Equipment & Accessories 1.13JMC Projects (India) Ltd. Construction 1.10Sadbhav Engineering Ltd. Construction Project 1.05Nbcc India Ltd. Construction 1.05Whirlpool of India Ltd. Consumer Durables 1.04Others 34.88
Fund Managers Details
Fund Managers Experience Managing Since
Mr. Harshad Patwardhan 23 years 03-Feb-15
Asset Allocation (% of total)
10
Past performance may or may not be sustained in future and should not be used as a basis for comparison with other investments. * CAGR Return.
Multi-Cap FundAn open ended equity scheme investing across large cap, mid cap, small cap stocks
LOW HIGH
Riskometer
Investors understand
that their principal will be at
ModeratelyHigh Risk
Quantitative indicators
Total Portfolio Turnover Ratio^Portfolio Turnover Ratio^
2.36
Std. deviation
16.15% Sharpe Ratio**
0.17
Beta
1.13 Total stocks in portfolio
58
Active bets
54.70%
@Top 10 stocks
37.00%
Net Equity
95.16% Equity0.70
F&O1.66
(As on 31st March, 2018)
Equi�es Cash & Other receivables
4.06%
4.22%
4.50%
5.04%
5.97%
6.00%
6.68%
6.74%
10.25%
18.44%
Cement
Consumer Durables
Industrial Products
Construc�on
Industrial Capital Goods
Auto
Construc�on Project
So�ware
Finance
Banks
79.48%
20.52%
(Name of the Scheme was changed from Edelweiss Economic Resurgence Fund to Edelweiss Multi-Cap Fund with effect from March 28, 2018)
Opportunities come in all shapes and sizes
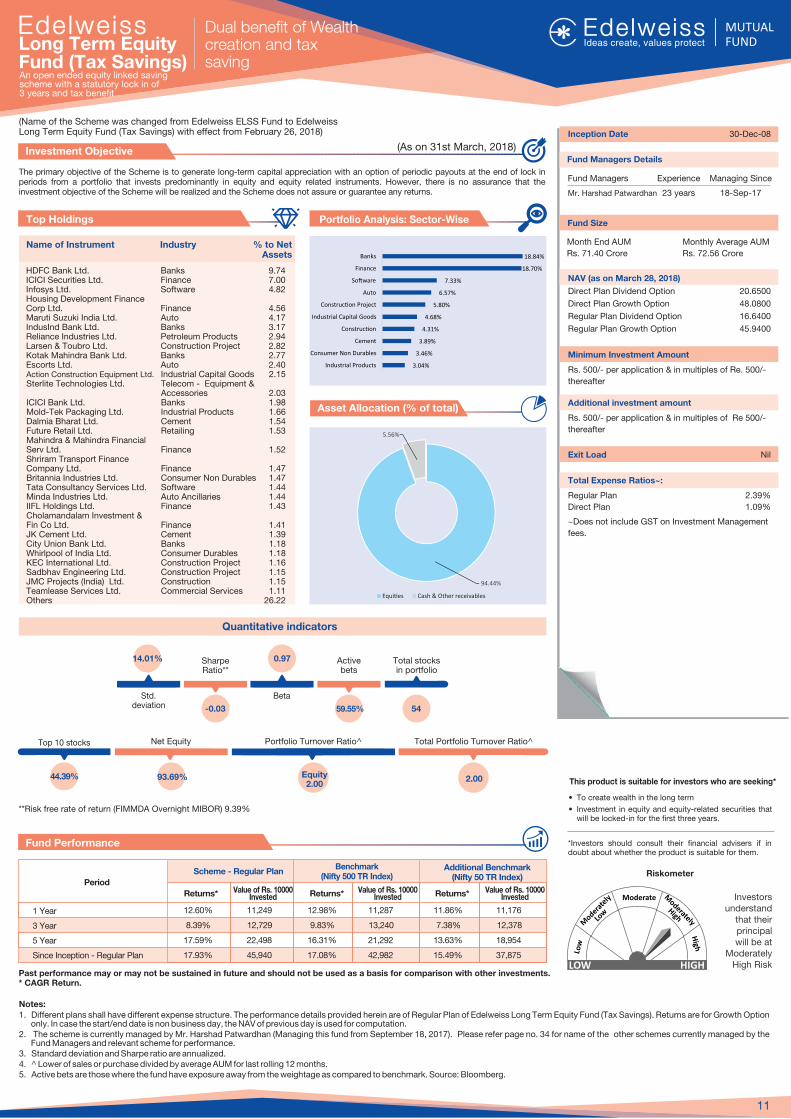
The primary objective of the Scheme is to generate long-term capital appreciation with an option of periodic payouts at the end of lock in periods from a portfolio that invests predominantly in equity and equity related instruments. However, there is no assurance that the investment objective of the Scheme will be realized and the Scheme does not assure or guarantee any returns.
Investment Objective
Fund Performance
This product is suitable for investors who are seeking*
� To create wealth in the long term
� Investment in equity and equity-related securities that will be locked-in for the first three years.
*Investors should consult their financial advisers if in doubt about whether the product is suitable for them.
Notes:1. Different plans shall have different expense structure. The performance details provided herein are of Regular Plan of Edelweiss Long Term Equity Fund (Tax Savings). Returns are for Growth Option
only. In case the start/end date is non business day, the NAV of previous day is used for computation.2. The scheme is currently managed by Mr. Harshad Patwardhan (Managing this fund from September 18, 2017). Please refer page no. 34 for name of the other schemes currently managed by the
Fund Managers and relevant scheme for performance.3. Standard deviation and Sharpe ratio are annualized.4. ^ Lower of sales or purchase divided by average AUM for last rolling 12 months. 5. Active bets are those where the fund have exposure away from the weightage as compared to benchmark. Source: Bloomberg.
Inception Date 30-Dec-08
NAV (as on March 28, 2018)
Direct Plan Dividend Option 20.6500
Direct Plan Growth Option 48.0800
Regular Plan Dividend Option 16.6400
Regular Plan Growth Option 45.9400
Minimum Investment Amount
Rs. Re. 500/- 500/- per application & in multiples of
thereafter
Additional investment amount
Rs. 500/- per application & in multiples of Re 500/-
thereafter
Exit Load Nil
Total Expense Ratios~:
Regular Plan 2.39%
Direct Plan 1.09%
~Does not include GST on Investment Management
fees.
Portfolio Analysis: Sector-Wise
Name of Instrument Industry % to Net Assets
Top Holdings
Scheme - Regular PlanBenchmark
(Nifty 500 TR Index)Additional Benchmark
(Nifty 50 TR Index)Period
1 Year
3 Year
5 Year
Since Inception - Regular Plan
Returns* Returns*Value of Rs. 10000 Invested Returns*Value of Rs. 10000
InvestedValue of Rs. 10000
Invested
12.60% 11,249 12.98% 11,287 11.86% 11,176
8.39% 12,729 9.83% 13,240 7.38% 12,378
17.59% 22,498 16.31% 21,292 13.63% 18,954
17.93% 45,940 17.08% 42,982 15.49% 37,875
Fund Size
Month End AUM
Rs. 71.40 Crore
Monthly Average AUM
Rs. 72.56 Crore
**Risk free rate of return (FIMMDA Overnight MIBOR) 9.39%
HDFC Bank Ltd. Banks 9.74ICICI Securities Ltd. Finance 7.00Infosys Ltd. Software 4.82Housing Development Finance Corp Ltd. Finance 4.56Maruti Suzuki India Ltd. Auto 4.17IndusInd Bank Ltd. Banks 3.17Reliance Industries Ltd. Petroleum Products 2.94Larsen & Toubro Ltd. Construction Project 2.82Kotak Mahindra Bank Ltd. Banks 2.77Escorts Ltd. Auto 2.40Action Construction Equipment Ltd. Industrial Capital Goods 2.15Sterlite Technologies Ltd. Telecom - Equipment & Accessories 2.03ICICI Bank Ltd. Banks 1.98Mold-Tek Packaging Ltd. Industrial Products 1.66Dalmia Bharat Ltd. Cement 1.54Future Retail Ltd. Retailing 1.53Mahindra & Mahindra Financial Serv Ltd. Finance 1.52Shriram Transport Finance Company Ltd. Finance 1.47Britannia Industries Ltd. Consumer Non Durables 1.47Tata Consultancy Services Ltd. Software 1.44Minda Industries Ltd. Auto Ancillaries 1.44IIFL Holdings Ltd. Finance 1.43Cholamandalam Investment & Fin Co Ltd. Finance 1.41JK Cement Ltd. Cement 1.39City Union Bank Ltd. Banks 1.18Whirlpool of India Ltd. Consumer Durables 1.18KEC International Ltd. Construction Project 1.16Sadbhav Engineering Ltd. Construction Project 1.15JMC Projects (India) Ltd. Construction 1.15Teamlease Services Ltd. Commercial Services 1.11Others 26.22
Fund Managers Details
Fund Managers Experience Managing Since
Mr. Harshad Patwardhan 23 years 18-Sep-17
Asset Allocation (% of total)
11
Past performance may or may not be sustained in future and should not be used as a basis for comparison with other investments. * CAGR Return.
Dual benefit of Wealthcreation and tax saving
Long Term Equity Fund (Tax Savings)An open ended equity linked saving scheme with a statutory lock in of 3 years and tax benefit
LOW HIGH
Riskometer
Investors understand
that their principal will be at
Moderately High Risk
Quantitative indicators
Total Portfolio Turnover Ratio^Portfolio Turnover Ratio^
2.00
Std. deviation
14.01% Sharpe Ratio**
-0.03
Beta
0.97 Total stocks in portfolio
54
Active bets
59.55%
Top 10 stocks
44.39%
Net Equity
93.69% Equity2.00
(As on 31st March, 2018)
Equi�es Cash & Other receivables
(Name of the Scheme was changed from Edelweiss ELSS Fund to Edelweiss Long Term Equity Fund (Tax Savings) with effect from February 26, 2018)
94.44%
5.56%
3.04%
3.46%
3.89%
4.31%
4.68%
5.80%
6.57%
7.33%
18.70%
18.84%
Industrial Products
Consumer Non Durables
Cement
Construc�on
Industrial Capital Goods
Construc�on Project
Auto
So�ware
Finance
Banks
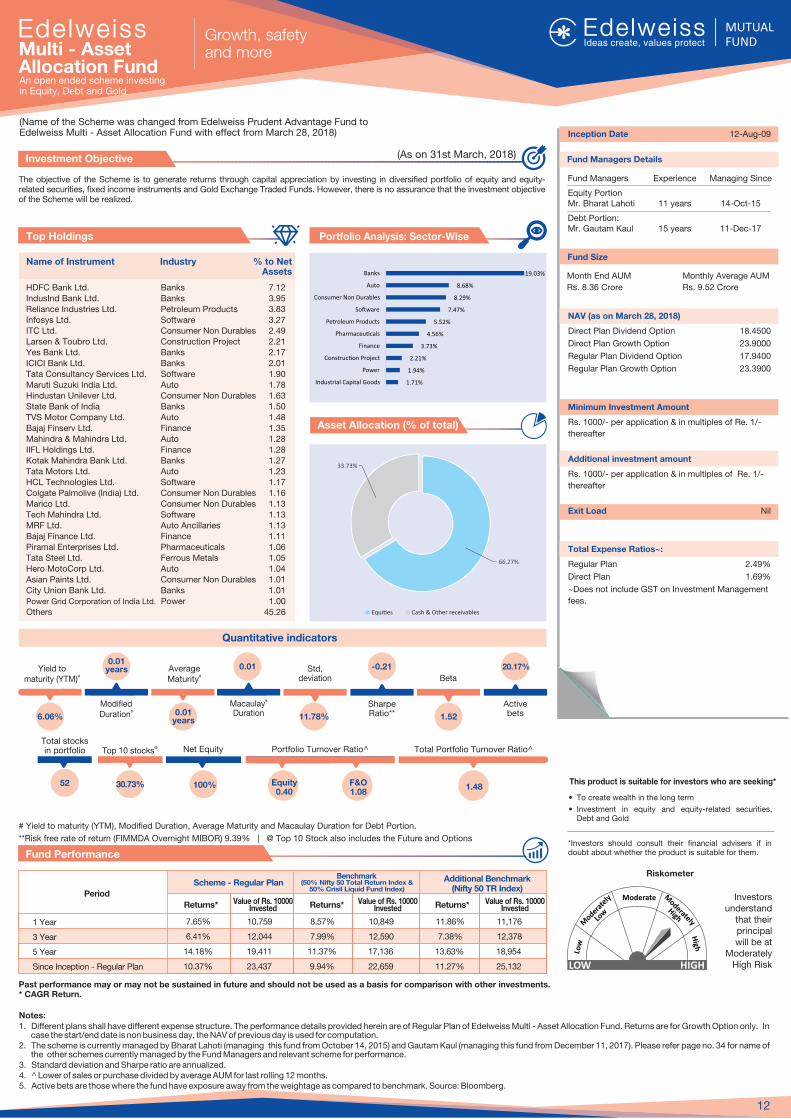
The objective of the Scheme is to generate returns through capital appreciation by investing in diversified portfolio of equity and equity-related securities, fixed income instruments and Gold Exchange Traded Funds. However, there is no assurance that the investment objective of the Scheme will be realized.
Investment Objective
Fund Performance
This product is suitable for investors who are seeking*
� To create wealth in the long term
� Investment in equity and equity-related securities, Debt and Gold
*Investors should consult their financial advisers if in doubt about whether the product is suitable for them.
Notes:1. Different plans shall have different expense structure. The performance details provided herein are of Regular Plan of Edelweiss Multi - Asset Allocation Fund. Returns are for Growth Option only. In
case the start/end date is non business day, the NAV of previous day is used for computation.2. The scheme is currently managed by Bharat Lahoti (managing this fund from October 14, 2015) and Gautam Kaul (managing this fund from December 11, 2017). Please refer page no. 34 for name of
the other schemes currently managed by the Fund Managers and relevant scheme for performance.3. Standard deviation and Sharpe ratio are annualized.4. ^ Lower of sales or purchase divided by average AUM for last rolling 12 months. 5. Active bets are those where the fund have exposure away from the weightage as compared to benchmark. Source: Bloomberg.
Inception Date 12-Aug-09
NAV (as on March 28, 2018)
Direct Plan Dividend Option 18.4500
Direct Plan Growth Option 23.9000
Regular Plan Dividend Option 17.9400
Regular Plan Growth Option 23.3900
Minimum Investment Amount
Rs. 1000/- per application & in multiples of Re. 1/-
thereafter
Additional investment amount
Rs. 1000/- per application & in multiples of Re. 1/-
thereafter
Exit Load Nil
Total Expense Ratios~:
Regular Plan 2.49%
Direct Plan 1.69%
~Does not include GST on Investment Management
fees.
Portfolio Analysis: Sector-Wise
Name of Instrument Industry % to Net Assets
Top Holdings
Scheme - Regular Plan Additional Benchmark(Nifty 50 TR Index)
Period
1 Year
3 Year
5 Year
Since Inception - Regular Plan
Returns* Returns*Value of Rs. 10000 Invested Returns*Value of Rs. 10000
InvestedValue of Rs. 10000
Invested
7.65% 10,759 8.57% 10,849 11.86% 11,176
6.41% 12,044 7.99% 12,590 7.38% 12,378
14.18% 19,411 11.37% 17,136 13.63% 18,954
10.37% 23,437 9.94% 22,659 11.27% 25,132
Fund Size
Month End AUM
Rs. 8.36 Crore
Monthly Average AUM
Rs. 9.52 Crore
# Yield to maturity (YTM), Modified Duration, Average Maturity and for Debt Portion.Macaulay Duration
**Risk free rate of return (FIMMDA Overnight MIBOR) 9.39% | @ Top 10 Stock also includes the Future and Options
HDFC Bank Ltd. Banks 7.12
IndusInd Bank Ltd. Banks 3.95
Reliance Industries Ltd. Petroleum Products 3.83
Infosys Ltd. Software 3.27
ITC Ltd. Consumer Non Durables 2.49
Larsen & Toubro Ltd. Construction Project 2.21
Yes Bank Ltd. Banks 2.17
ICICI Bank Ltd. Banks 2.01
Tata Consultancy Services Ltd. Software 1.90
Maruti Suzuki India Ltd. Auto 1.78
Hindustan Unilever Ltd. Consumer Non Durables 1.63
State Bank of India Banks 1.50
TVS Motor Company Ltd. Auto 1.48
Bajaj Finserv Ltd. Finance 1.35
Mahindra & Mahindra Ltd. Auto 1.28
IIFL Holdings Ltd. Finance 1.28
Kotak Mahindra Bank Ltd. Banks 1.27
Tata Motors Ltd. Auto 1.23
HCL Technologies Ltd. Software 1.17
Colgate Palmolive (India) Ltd. Consumer Non Durables 1.16
Marico Ltd. Consumer Non Durables 1.13
Tech Mahindra Ltd. Software 1.13
MRF Ltd. Auto Ancillaries 1.13
Bajaj Finance Ltd. Finance 1.11
Piramal Enterprises Ltd. Pharmaceuticals 1.06
Tata Steel Ltd. Ferrous Metals 1.05
Hero MotoCorp Ltd. Auto 1.04
Asian Paints Ltd. Consumer Non Durables 1.01
City Union Bank Ltd. Banks 1.01
Power Grid Corporation of India Ltd. Power 1.00
Others 45.26
Fund Managers Details
Fund Managers Experience Managing Since
Equity PortionMr. Bharat Lahoti 11 years 14-Oct-15
Debt Portion:Mr. Gautam Kaul 15 years 11-Dec-17
Asset Allocation (% of total)
12
Past performance may or may not be sustained in future and should not be used as a basis for comparison with other investments. * CAGR Return.
Multi - Asset Allocation FundAn open ended scheme investing in Equity, Debt and Gold
LOW HIGH
Riskometer
Investors understand
that their principal will be at
Moderately High Risk
Quantitative indicators
Total Portfolio Turnover Ratio^Total stocks in portfolio
52 1.48
Portfolio Turnover Ratio^@Top 10 stocks
30.73%
Net Equity
100% Equity0.40
F&O1.08
(As on 31st March, 2018)
Equi�es Cash & Other receivables
1.71%
1.94%
2.21%
3.73%
4.56%
5.52%
7.47%
8.29%
8.68%
19.03%
Industrial Capital Goods
Power
Construc�on Project
Finance
Pharmaceu�cals
Petroleum Products
So�ware
Consumer Non Durables
Auto
Banks
66.27%
33.73%
(Name of the Scheme was changed from Edelweiss Prudent Advantage Fund to Edelweiss Multi - Asset Allocation Fund with effect from March 28, 2018)
Benchmark(50% Nifty 50 Total Return Index &
50% Crisil Liquid Fund Index)
Yield to#
maturity (YTM)
6.06%
Modified #
Duration
0.01years Average
#Maturity
0.01years
Std. deviation
11.78%
Sharpe Ratio**
-0.21
Beta
1.52
Active bets
20.17%
#Macaulay Duration
0.01
Growth, safetyand more
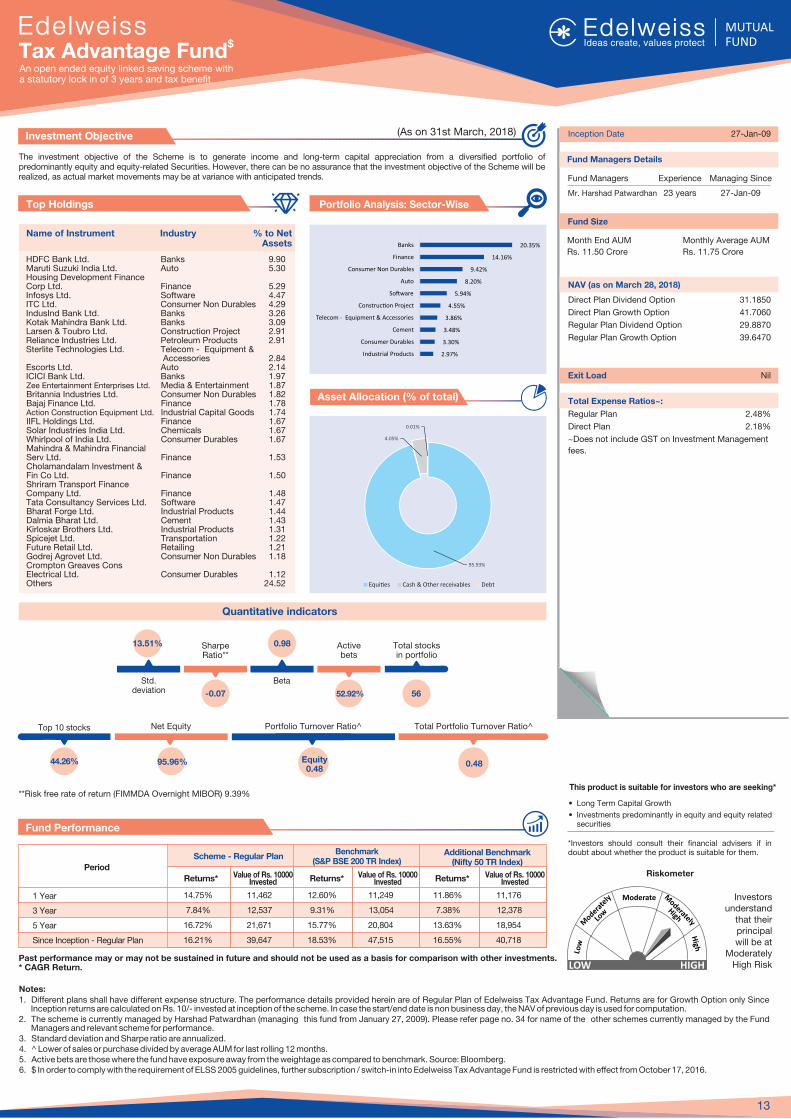
The investment objective of the Scheme is to generate income and long-term capital appreciation from a diversified portfolio of predominantly equity and equity-related Securities. However, there can be no assurance that the investment objective of the Scheme will be realized, as actual market movements may be at variance with anticipated trends.
Investment Objective
Fund Performance
Riskometer
This product is suitable for investors who are seeking*
� Long Term Capital Growth
� Investments predominantly in equity and equity related securities
*Investors should consult their financial advisers if in doubt about whether the product is suitable for them.
Notes:1. Different plans shall have different expense structure. The performance details provided herein are of of Regular Plan Edelweiss Tax Advantage Fund. Returns are for Growth Option only Since
Inception returns are calculated on Rs. 10/- invested at inception of the scheme. In case the start/end date is non business day, the NAV of previous day is used for computation.2. The scheme is currently managed by Harshad Patwardhan January 27 09 . 34 (managing this fund from , 20 ) Please refer page no. for name of the other schemes currently managed by the Fund
Managers and relevant scheme for performance.3. Standard deviation and Sharpe ratio are annualized.4. ^ Lower of sales or purchase divided by average AUM for last rolling 12 months. 5. Active bets are those where the fund have exposure away from the weightage as compared to benchmark. Source: Bloomberg. 6. $ In order to comply with the requirement of ELSS 2005 guidelines, further subscription / switch-in into Edelweiss Tax Advantage Fund is restricted with effect from October 17, 2016.
Inception Date 27-Jan-09
NAV (as on March 28, 2018)
Direct Plan Dividend Option 31.1850
Direct Plan Growth Option 41.7060
Regular Plan Dividend Option 29.8870
Regular Plan Growth Option 39.6470
Exit Load Nil
Total Expense Ratios~:
Regular Plan 2.48%
Direct Plan 2.18%
~Does not include GST on Investment Management
fees.
Portfolio Analysis: Sector-Wise
Name of Instrument Industry % to Net Assets
Top Holdings
Scheme - Regular PlanBenchmark
(S&P BSE 200 TR Index)Additional Benchmark
(Nifty 50 TR Index)Period
1 Year
3 Year
5 Year
Since Inception - Regular Plan
Returns* Returns*Value of Rs. 10000 Invested Returns*Value of Rs. 10000
InvestedValue of Rs. 10000
Invested
14.75% 11,462 12.60% 11,249 11.86% 11,176
7.84% 12,537 9.31% 13,054 7.38% 12,378
16.72% 21,671 15.77% 20,804 13.63% 18,954
16.21% 39,647 18.53% 47,515 16.55% 40,718
**Risk free rate of return (FIMMDA Overnight MIBOR) 9.39%
HDFC Bank Ltd. Banks 9.90Maruti Suzuki India Ltd. Auto 5.30Housing Development Finance Corp Ltd. Finance 5.29Infosys Ltd. Software 4.47ITC Ltd. Consumer Non Durables 4.29IndusInd Bank Ltd. Banks 3.26Kotak Mahindra Bank Ltd. Banks 3.09Larsen & Toubro Ltd. Construction Project 2.91Reliance Industries Ltd. Petroleum Products 2.91Sterlite Technologies Ltd. Telecom - Equipment & Accessories 2.84Escorts Ltd. Auto 2.14ICICI Bank Ltd. Banks 1.97Zee Entertainment Enterprises Ltd. Media & Entertainment 1.87Britannia Industries Ltd. Consumer Non Durables 1.82Bajaj Finance Ltd. Finance 1.78Action Construction Equipment Ltd. Industrial Capital Goods 1.74IIFL Holdings Ltd. Finance 1.67Solar Industries India Ltd. Chemicals 1.67Whirlpool of India Ltd. Consumer Durables 1.67Mahindra & Mahindra Financial Serv Ltd. Finance 1.53Cholamandalam Investment & Fin Co Ltd. Finance 1.50Shriram Transport Finance Company Ltd. Finance 1.48Tata Consultancy Services Ltd. Software 1.47Bharat Forge Ltd. Industrial Products 1.44Dalmia Bharat Ltd. Cement 1.43Kirloskar Brothers Ltd. Industrial Products 1.31Spicejet Ltd. Transportation 1.22Future Retail Ltd. Retailing 1.21Godrej Agrovet Ltd. Consumer Non Durables 1.18Crompton Greaves Cons Electrical Ltd. Consumer Durables 1.12Others 24.52
Fund Managers Details
Fund Managers Experience Managing Since
Mr. Harshad Patwardhan 23 years 27-Jan-09
Asset Allocation (% of total)
13
Investors understand
that their principal will be at
Moderately High Risk
Past performance may or may not be sustained in future and should not be used as a basis for comparison with other investments. * CAGR Return.
$Tax Advantage FundAn open ended equity linked saving scheme witha statutory lock in of 3 years and tax benefit
LOW HIGH
Quantitative indicators
Total Portfolio Turnover Ratio^Portfolio Turnover Ratio^
0.48
Std. deviation
13.51% Sharpe Ratio**
-0.07
Beta
0.98 Total stocks in portfolio
56
Active bets
52.92%
Top 10 stocks
44.26%
Net Equity
95.96% Equity0.48
(As on 31st March, 2018)
Fund Size
Month End AUM
Rs. 11.50 Crore
Monthly Average AUM
Rs. 11.75 Crore
Equi�es Cash & Other receivables Debt
95.93%
4.05%
0.01%
2.97%
3.30%
3.48%
3.86%
4.55%
5.94%
8.20%
9.42%
14.16%
20.35%
Industrial Products
Consumer Durables
Cement
Telecom - Equipment & Accessories
Construc�on Project
So�ware
Auto
Consumer Non Durables
Finance
Banks
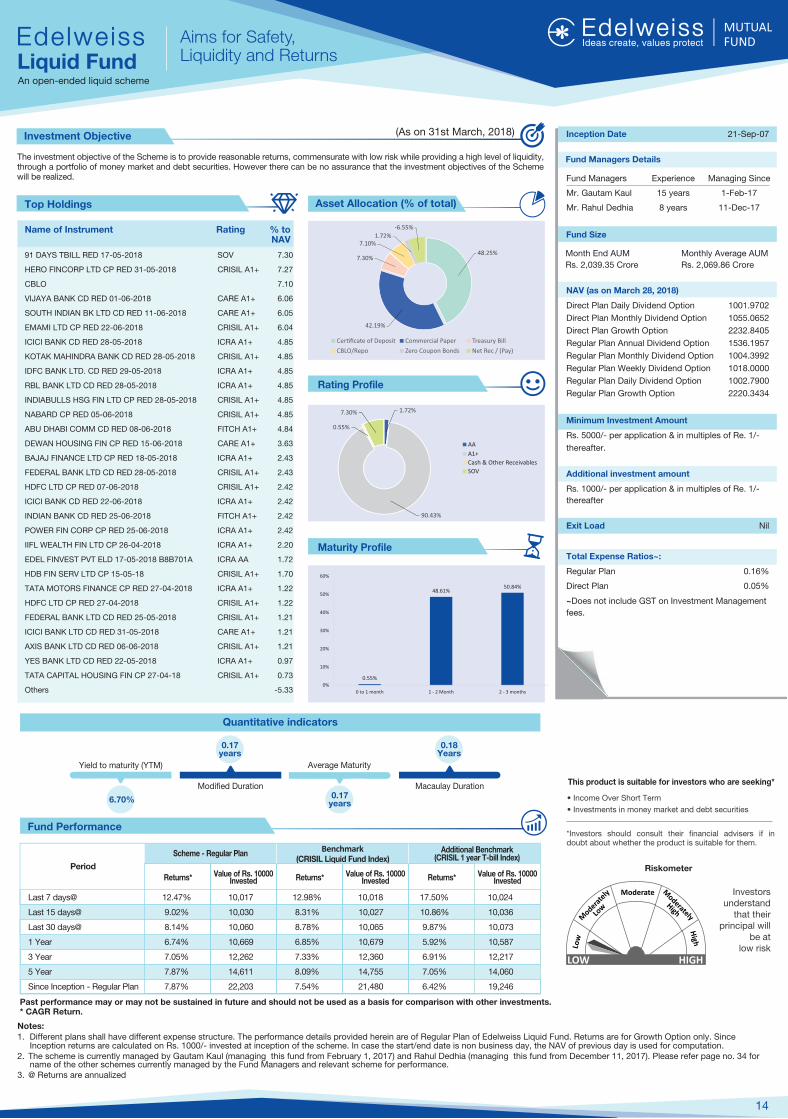
The investment objective of the Scheme is to provide reasonable returns, commensurate with low risk while providing a high level of liquidity, through a portfolio of money market and debt securities. However there can be no assurance that the investment objectives of the Scheme will be realized.
Investment Objective
Fund Performance
LOW HIGH
Riskometer
This product is suitable for investors who are seeking*
� Income Over Short Term
� Investments in money market and debt securities
*Investors should consult their financial advisers if in doubt about whether the product is suitable for them.
Notes:1. Different plans shall have different expense structure. The performance details provided herein are of Regular Plan of Liquid Fund. Edelweiss Returns are for Growth Option only. Since
Inception returns are calculated on Rs. 1000/- invested at inception of the scheme. In case the start/end date is non business day, the NAV of previous day is used for computation.2. The scheme is currently managed by Gautam Kaul (managing this fund from February 1, 2017) and Rahul Dedhia (managing this fund from December 11, 2017). 34Please refer page no. for
name of the other and relevant scheme for performance. schemes currently managed by the Fund Managers 3. @ Returns are annualized
Inception Date 21-Sep-07
NAV (as on March 28, 2018)
Direct Plan Daily Dividend Option 1001.9702
Direct Plan Monthly Dividend Option 1055.0652
Direct Plan Growth Option 2232.8405
Regular Plan Annual Dividend Option 1536.1957
Regular Plan Monthly Dividend Option 1004.3992
Regular Plan Weekly Dividend Option 1018.0000
Regular Plan Daily Dividend Option 1002.7900
Regular Plan Growth Option 2220.3434
Minimum Investment Amount
Rs. 5000/- per application & in multiples of Re. 1/-
thereafter.
Additional investment amount
Rs. 1000/- per application & in multiples of Re. 1/-
thereafter
Exit Load Nil
Total Expense Ratios~:
Regular Plan 0.16%
Direct Plan 0.05%
~Does not include GST on Investment Management
fees.
Rating Profile
Name of Instrument Rating % to NAV
Top Holdings
Fund Size
Monthly Average AUM
Rs. 2,069.86 Crore91 DAYS TBILL RED 17-05-2018 SOV 7.30
HERO FINCORP LTD CP RED 31-05-2018 CRISIL A1+ 7.27
CBLO 7.10
VIJAYA BANK CD RED 01-06-2018 CARE A1+ 6.06
SOUTH INDIAN BK LTD CD RED 11-06-2018 CARE A1+ 6.05
EMAMI LTD CP RED 22-06-2018 CRISIL A1+ 6.04
ICICI BANK CD RED 28-05-2018 ICRA A1+ 4.85
KOTAK MAHINDRA BANK CD RED 28-05-2018 CRISIL A1+ 4.85
IDFC BANK LTD. CD RED 29-05-2018 ICRA A1+ 4.85
RBL BANK LTD CD RED 28-05-2018 ICRA A1+ 4.85
INDIABULLS HSG FIN LTD CP RED 28-05-2018 CRISIL A1+ 4.85
NABARD CP RED 05-06-2018 CRISIL A1+ 4.85
ABU DHABI COMM CD RED 08-06-2018 FITCH A1+ 4.84
DEWAN HOUSING FIN CP RED 15-06-2018 CARE A1+ 3.63
BAJAJ FINANCE LTD CP RED 18-05-2018 ICRA A1+ 2.43
FEDERAL BANK LTD CD RED 28-05-2018 CRISIL A1+ 2.43
HDFC LTD CP RED 07-06-2018 CRISIL A1+ 2.42
ICICI BANK CD RED 22-06-2018 ICRA A1+ 2.42
INDIAN BANK CD RED 25-06-2018 FITCH A1+ 2.42
POWER FIN CORP CP RED 25-06-2018 ICRA A1+ 2.42
IIFL WEALTH FIN LTD CP 26-04-2018 ICRA A1+ 2.20
EDEL FINVEST PVT ELD 17-05-2018 B8B701A ICRA AA 1.72
HDB FIN SERV LTD CP 15-05-18 CRISIL A1+ 1.70
TATA MOTORS FINANCE CP RED 27-04-2018 ICRA A1+ 1.22
HDFC LTD CP RED 27-04-2018 CRISIL A1+ 1.22
FEDERAL BANK LTD CD RED 25-05-2018 CRISIL A1+ 1.21
ICICI BANK LTD CD RED 31-05-2018 CARE A1+ 1.21
AXIS BANK LTD CD RED 06-06-2018 CRISIL A1+ 1.21
YES BANK LTD CD RED 22-05-2018 ICRA A1+ 0.97
TATA CAPITAL HOUSING FIN CP 27-04-18 CRISIL A1+ 0.73
Others -5.33
Fund Managers Details
Fund Managers Experience Managing Since
Mr. Gautam Kaul 15 years 1-Feb-17
Mr. Rahul Dedhia 8 years 11-Dec-17
14
Investors understand
that their principal will
be at low risk
Asset Allocation (% of total)
Maturity Profile
Period
Scheme - Regular PlanBenchmark
(CRISIL Liquid Fund Index)
Returns* Returns*
Additional Benchmark(CRISIL 1 year T-bill Index)
Value of Rs. 10000 Invested
Value of Rs. 10000 InvestedReturns*Value of Rs. 10000
Invested
Last 7 days@
Last 15 days@
Last 30 days@
1 Year
3 Year
5 Year
Since Inception - Regular Plan
12.47% 10,017 12.98% 10,018 17.50% 10,024
9.02% 10,030 8.31% 10,027 10.86% 10,036
8.14% 10,060 8.78% 10,065 9.87% 10,073
6.74% 10,669 6.85% 10,679 5.92% 10,587
7.05% 12,262 7.33% 12,360 6.91% 12,217
7.87% 14,611 8.09% 14,755 7.05% 14,060
7.87% 22,203 7.54% 21,480 6.42% 19,246
Past performance may or may not be sustained in future and should not be used as a basis for comparison with other investments. * CAGR Return.
Aims for Safety, Liquidity and ReturnsLiquid Fund
An open-ended liquid scheme
Quantitative indicators
(As on 31st March, 2018)
Month End AUM
Rs. 2,039.35 Crore
AA
A1+
Cash & Other Receivables
SOV
48.25%
42.19%
7.30%
7.10%1.72%
-6.55%
Cer�ficate of Deposit Commercial Paper Treasury Bill
CBLO/Repo Zero Coupon Bonds Net Rec / (Pay)
1.72%
90.43%
0.55%
7.30%
0.55%
48.61%50.84%
0%
10%
20%
30%
40%
50%
60%
0 to 1 month 1 - 2 Month 2 - 3 months
Average MaturityYield to maturity (YTM)
6.70%
Modified Duration
0.17years
0.17years
Macaulay Duration
0.18Years
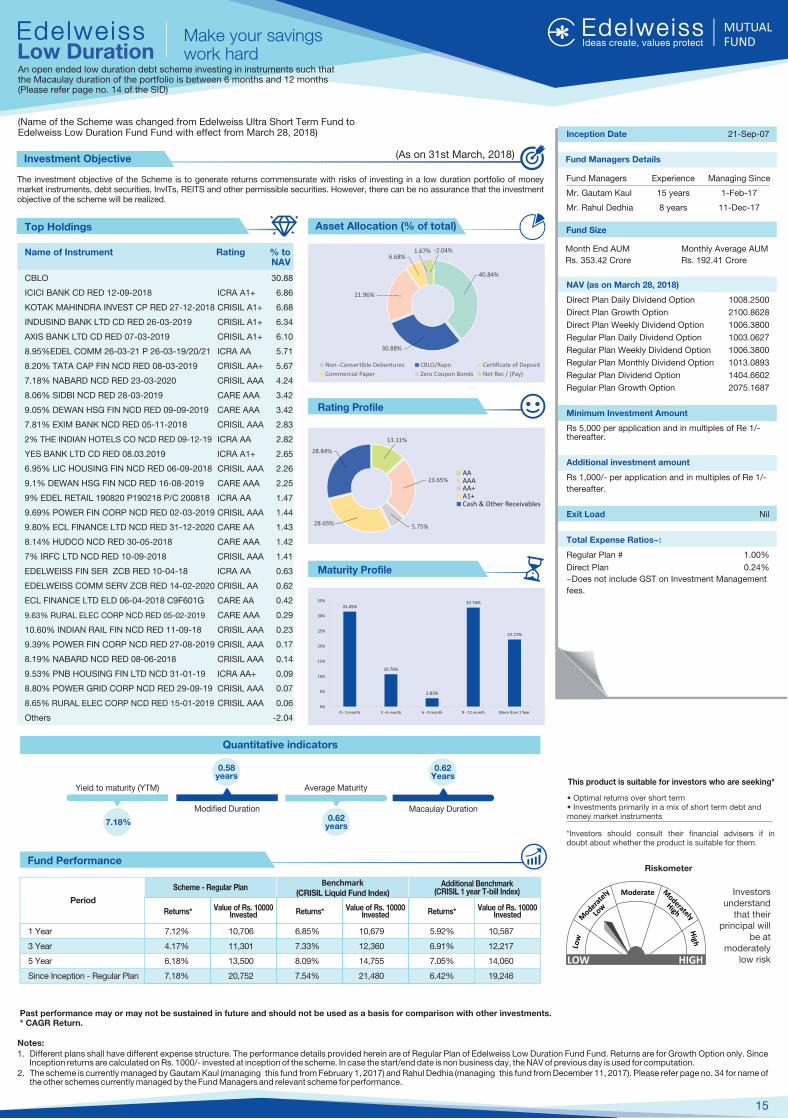
The investment objective of the Scheme is to generate returns commensurate with risks of investing in a low duration portfolio of money market instruments, debt securities, InvITs, REITS and other permissible securities. However, there can be no assurance that the investment objective of the scheme will be realized.
Investment Objective
Fund Performance
LOW HIGH
Riskometer
This product is suitable for investors who are seeking*
� Optimal returns over short term� Investments primarily in a mix of short term debt and money market instruments
*Investors should consult their financial advisers if in doubt about whether the product is suitable for them.
Notes:1. Different plans shall have different expense structure. The performance details provided herein are of of Edelweiss Low Duration Fund Fund. Regular Plan Returns are for Growth Option only. Since
Inception returns are calculated on Rs. 1000/- invested at inception of the scheme. In case the start/end date is non business day, the NAV of previous day is used for computation.2. The scheme is currently managed by (managing this fund from 1, 201 ) .Gautam Kaul February 7 and Rahul Dedhia (managing this fund from December 11, 2017) Please refer page no. 34 for name of
the other and relevant scheme for performance. schemes currently managed by the Fund Managers
Inception Date 21-Sep-07
NAV (as on March 28, 2018)
Direct Plan Daily Dividend Option 1008.2500
Direct Plan Growth Option 2100.8628
Direct Plan Weekly Dividend Option 1006.3800
Regular Plan Daily Dividend Option 1003.0627
Regular Plan Weekly Dividend Option 1006.3800
Regular Plan Monthly Dividend Option 1013.0893
Regular Plan Dividend Option 1404.6602
Regular Plan Growth Option 2075.1687
Minimum Investment Amount
Rs 5,000 per application and in multiples of Re 1/-thereafter.
Additional investment amount
Rs 1,000/- per application and in multiples of Re 1/-
thereafter.
Exit Load Nil
Total Expense Ratios~:
Regular Plan # 1.00%
Direct Plan 0.24%
~Does not include GST on Investment Management
fees.
Rating Profile
Name of Instrument Rating % to NAV
Top Holdings Fund Size
Monthly Average AUM
Rs. 192.41 Crore
CBLO 30.88
ICICI BANK CD RED 12-09-2018 ICRA A1+ 6.86
KOTAK MAHINDRA INVEST CP RED 27-12-2018 CRISIL A1+ 6.68
INDUSIND BANK LTD CD RED 26-03-2019 CRISIL A1+ 6.34
AXIS BANK LTD CD RED 07-03-2019 CRISIL A1+ 6.10
8.95%EDEL COMM 26-03-21 P 26-03-19/20/21 ICRA AA 5.71
8.20% TATA CAP FIN NCD RED 08-03-2019 CRISIL AA+ 5.67
7.18% NABARD NCD RED 23-03-2020 CRISIL AAA 4.24
8.06% SIDBI NCD RED 28-03-2019 CARE AAA 3.42
9.05% DEWAN HSG FIN NCD RED 09-09-2019 CARE AAA 3.42
7.81% EXIM BANK NCD RED 05-11-2018 CRISIL AAA 2.83
2% THE INDIAN HOTELS CO NCD RED 09-12-19 ICRA AA 2.82
YES BANK LTD CD RED 08.03.2019 ICRA A1+ 2.65
6.95% LIC HOUSING FIN NCD RED 06-09-2018 CRISIL AAA 2.26
9.1% DEWAN HSG FIN NCD RED 16-08-2019 CARE AAA 2.25
9% EDEL RETAIL 190820 P190218 P/C 200818 ICRA AA 1.47
9.69% POWER FIN CORP NCD RED 02-03-2019 CRISIL AAA 1.44
9.80% ECL FINANCE LTD NCD RED 31-12-2020 CARE AA 1.43
8.14% HUDCO NCD RED 30-05-2018 CARE AAA 1.42
7% IRFC LTD NCD RED 10-09-2018 CRISIL AAA 1.41
EDELWEISS FIN SER ZCB RED 10-04-18 ICRA AA 0.63
EDELWEISS COMM SERV ZCB RED 14-02-2020 CRISIL AA 0.62
ECL FINANCE LTD ELD 06-04-2018 C9F601G CARE AA 0.42
9.63% RURAL ELEC CORP NCD RED 05-02-2019 CARE AAA 0.29
10.60% INDIAN RAIL FIN NCD RED 11-09-18 CRISIL AAA 0.23
9.39% POWER FIN CORP NCD RED 27-08-2019 CRISIL AAA 0.17
8.19% NABARD NCD RED 08-06-2018 CRISIL AAA 0.14
9.53% PNB HOUSING FIN LTD NCD 31-01-19 ICRA AA+ 0.09
8.80% POWER GRID CORP NCD RED 29-09-19 CRISIL AAA 0.07
8.65% RURAL ELEC CORP NCD RED 15-01-2019 CRISIL AAA 0.06
Others -2.04
Fund Managers Details
Fund Managers Experience Managing Since
Mr. Gautam Kaul 15 years 1-Feb-17
Mr. Rahul Dedhia 8 years 11-Dec-17
15
Investors understand
that their principal will
be at moderately
low risk
Asset Allocation (% of total)
Maturity Profile
Period
Scheme - Regular PlanBenchmark
(CRISIL Liquid Fund Index)
Returns* Returns*
Additional Benchmark(CRISIL 1 year T-bill Index)
Value of Rs. 10000 Invested
Value of Rs. 10000 InvestedReturns*Value of Rs. 10000
Invested
1 Year
3 Year
5 Year
Since Inception - Regular Plan
7.12% 10,706 6.85% 10,679 5.92% 10,587
4.17% 11,301 7.33% 12,360 6.91% 12,217
6.18% 13,500 8.09% 14,755 7.05% 14,060
7.18% 20,752 7.54% 21,480 6.42% 19,246
Past performance may or may not be sustained in future and should not be used as a basis for comparison with other investments. * CAGR Return.
Make your savings work hardLow Duration
An open ended low duration debt scheme investing in instruments such that the Macaulay duration of the portfolio is between 6 months and 12 months(Please refer page no. 14 of the SID)
AAAAAAA+A1+Cash & Other Receivables
Quantitative indicators
(As on 31st March, 2018)
Month End AUM
Rs. 353.42 Crore
40.84%
30.88%
21.96%
6.68%1.67% -2.04%
Non -Conver�ble Debentures CBLO/Repo Cer�ficate of Deposit
Commercial Paper Zero Coupon Bonds Net Rec / (Pay)
13.11%
23.65%
5.75%28.65%
28.84%
31.45%
10.76%
2.83%
32.74%
22.21%
0%
5%
10%
15%
20%
25%
30%
35%
0 - 3 month 3 - 6 month 6 - 9 month 9 - 12 month More than 1 Year
(Name of the Scheme was changed from Edelweiss Ultra Short Term Fund to Edelweiss Low Duration Fund Fund with effect from March 28, 2018)
Average MaturityYield to maturity (YTM)
7.18%
Modified Duration
0.58years
0.62years
Macaulay Duration
0.62 Years
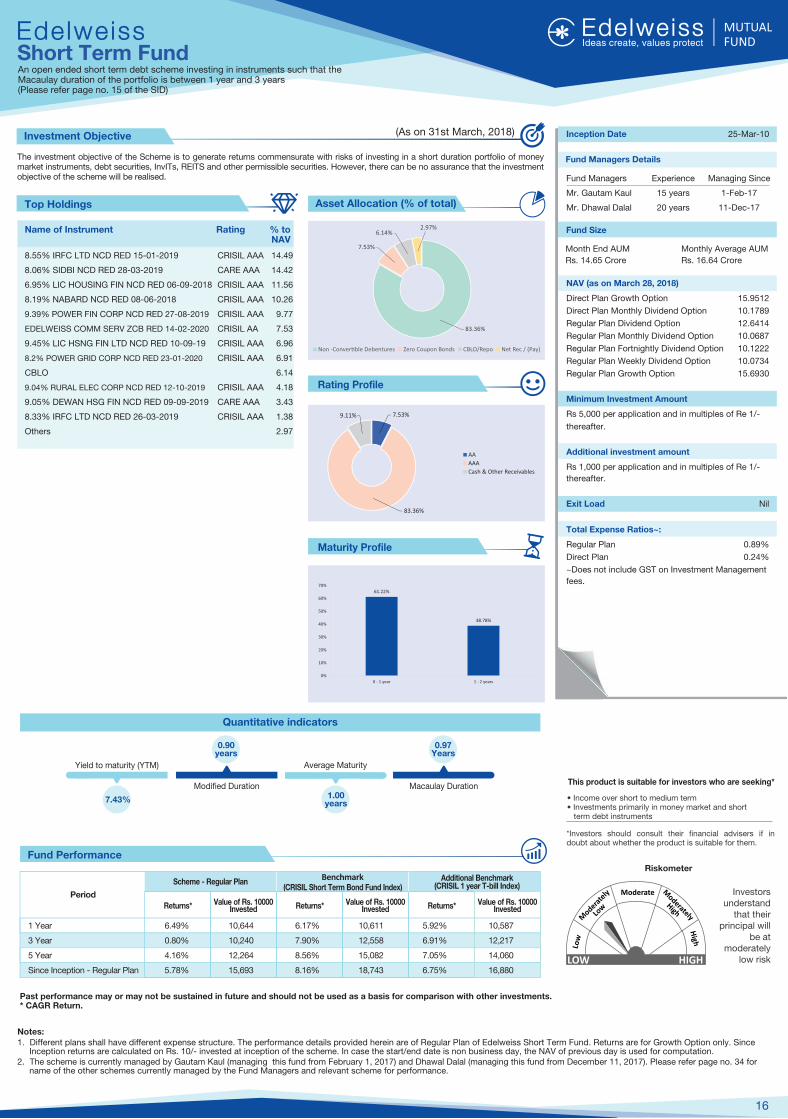
The investment objective of the Scheme is to generate returns commensurate with risks of investing in a short duration portfolio of money market instruments, debt securities, InvITs, REITS and other permissible securities. However, there can be no assurance that the investment objective of the scheme will be realised.
Investment Objective
This product is suitable for investors who are seeking*
� Income over short to medium term� Investments primarily in money market and short term debt instruments
*Investors should consult their financial advisers if in doubt about whether the product is suitable for them.
Notes:1. Different plans shall have different expense structure. The performance details provided herein are of Regular Plan of Edelweiss Short Term Fund. Returns are for Growth Option only. Since
Inception returns are calculated on Rs. 10/- invested at inception of the scheme. In case the start/end date is non business day, the NAV of previous day is used for computation.2. The scheme is currently managed by (managing this fund from 1, 201 ) and Dhawal Dalal (managing this fund from December 11, 2017). 34Gautam Kaul February 7 Please refer page no. for
name of the other and relevant scheme for performance. schemes currently managed by the Fund Managers
Inception Date 25-Mar-10
NAV (as on March 28, 2018)
Direct Plan Growth Option 15.9512
Direct Plan Monthly Dividend Option 10.1789
Regular Plan Dividend Option 12.6414
Regular Plan Monthly Dividend Option 10.0687
Regular Plan Fortnightly Dividend Option 10.1222
Regular Plan Weekly Dividend Option 10.0734
Regular Plan Growth Option 15.6930
Minimum Investment Amount
Rs 5,000 per application and in multiples of Re 1/-
thereafter.
Additional investment amount
Rs 1,000 per application and in multiples of Re 1/-
thereafter.
Exit Load Nil
Total Expense Ratios~:
Regular Plan 0.89%
Direct Plan 0.24%
~Does not include GST on Investment Management
fees.
Rating Profile
Name of Instrument Rating % to NAV
Top Holdings
Fund Size
Month End AUM
Rs. 14.65 Crore
Monthly Average AUM
Rs. 16.64 Crore8.55% IRFC LTD NCD RED 15-01-2019 CRISIL AAA 14.49
8.06% SIDBI NCD RED 28-03-2019 CARE AAA 14.42
6.95% LIC HOUSING FIN NCD RED 06-09-2018 CRISIL AAA 11.56
8.19% NABARD NCD RED 08-06-2018 CRISIL AAA 10.26
9.39% POWER FIN CORP NCD RED 27-08-2019 CRISIL AAA 9.77
EDELWEISS COMM SERV ZCB RED 14-02-2020 CRISIL AA 7.53
9.45% LIC HSNG FIN LTD NCD RED 10-09-19 CRISIL AAA 6.96
8.2% POWER GRID CORP NCD RED 23-01-2020 CRISIL AAA 6.91
CBLO 6.14
9.04% RURAL ELEC CORP NCD RED 12-10-2019 CRISIL AAA 4.18
9.05% DEWAN HSG FIN NCD RED 09-09-2019 CARE AAA 3.43
8.33% IRFC LTD NCD RED 26-03-2019 CRISIL AAA 1.38
Others 2.97
Fund Managers Details
Fund Managers Experience Managing Since
Mr. Gautam Kaul 15 years 1-Feb-17
Mr. Dhawal Dalal 20 years 11-Dec-17
16
Asset Allocation (% of total)
Maturity Profile
Past performance may or may not be sustained in future and should not be used as a basis for comparison with other investments. * CAGR Return.
Short Term FundAn open ended short term debt scheme investing in instruments such that theMacaulay duration of the portfolio is between 1 year and 3 years(Please refer page no. 15 of the SID)
Fund Performance
Period
Scheme - Regular PlanBenchmark
(CRISIL Short Term Bond Fund Index)
Returns* Returns*
Additional Benchmark(CRISIL 1 year T-bill Index)
Value of Rs. 10000 Invested
Value of Rs. 10000 InvestedReturns*Value of Rs. 10000
Invested
1 Year
3 Year
5 Year
Since Inception - Regular Plan
6.49% 10,644 6.17% 10,611 5.92% 10,587
0.80% 10,240 7.90% 12,558 6.91% 12,217
4.16% 12,264 8.56% 15,082 7.05% 14,060
5.78% 15,693 8.16% 18,743 6.75% 16,880LOW HIGH
Riskometer
Investors understand
that their principal will
be at moderately
low risk
Quantitative indicators
(As on 31st March, 2018)
AA
AAA
Cash & Other Receivables
83.36%
7.53%
6.14%2.97%
Non -Conver�ble Debentures Zero Coupon Bonds CBLO/Repo Net Rec / (Pay)
7.53%
83.36%
9.11%
61.22%
38.78%
0%
10%
20%
30%
40%
50%
60%
70%
0 - 1 year 1 - 2 years
Average MaturityYield to maturity (YTM)
7.43%
Modified Duration
0.90years
1.00years
Macaulay Duration
0.97Years
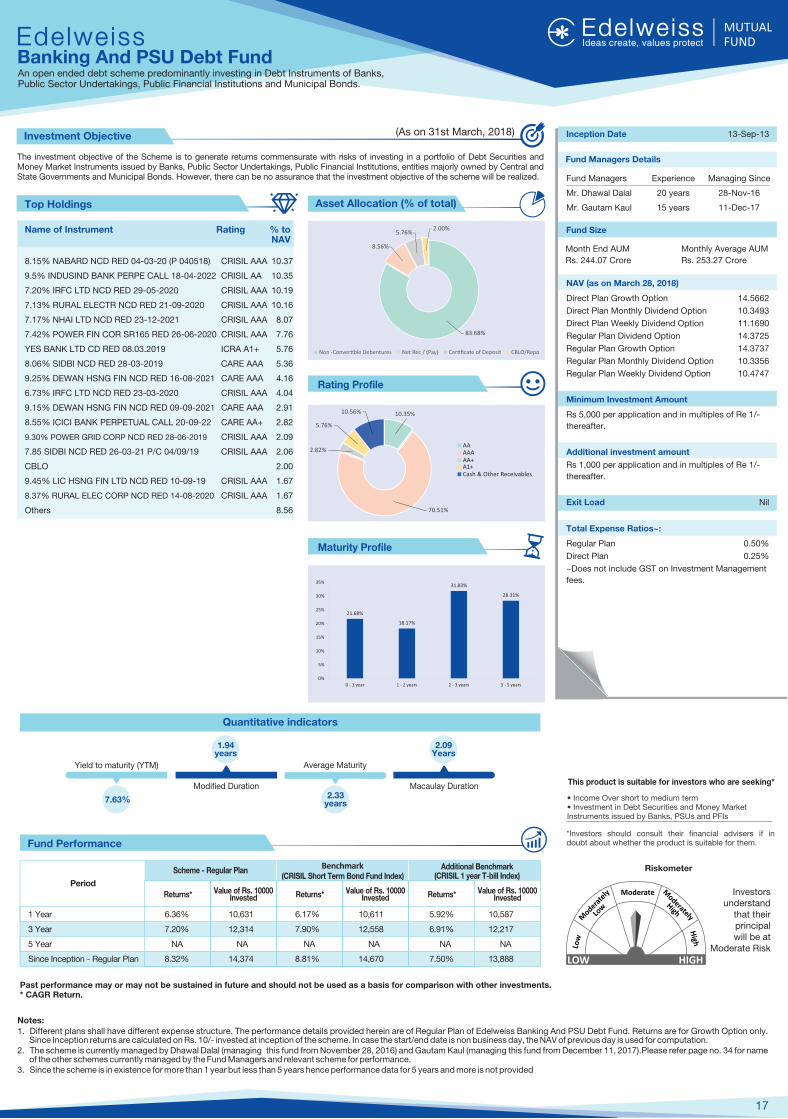
The investment objective of the Scheme is to generate returns commensurate with risks of investing in a portfolio of Debt Securities and Money Market Instruments issued by Banks, Public Sector Undertakings, Public Financial Institutions, entities majorly owned by Central and State Governments and Municipal Bonds. However, there can be no assurance that the investment objective of the scheme will be realized.
Investment Objective
LOW HIGH
Riskometer
This product is suitable for investors who are seeking*
� Income Over short to medium term� Investment in Debt Securities and Money Market Instruments issued by Banks, PSUs and PFIs
*Investors should consult their financial advisers if in doubt about whether the product is suitable for them.
Notes:1. Different plans shall have different expense structure. The performance details provided herein are of Regular Plan of Edelweiss Banking And PSU Debt Fund. Returns are for Growth Option only.
Since Inception returns are calculated on Rs. 10/- invested at inception of the scheme. In case the start/end date is non business day, the NAV of previous day is used for computation.2. The scheme is currently managed by Dhawal Dalal (managing this fund from November 28, 2016) and Gautam Kaul (managing this fund from December 11, 2017).Please refer page no. 34 for name
of the other schemes currently managed by the Fund Managers and relevant scheme for performance.3. Since the scheme is in existence for more than 1 year but less than 5 years hence performance data for 5 years and more is not provided
Rating Profile
Name of Instrument Rating % to NAV
Top Holdings
8.15% NABARD NCD RED 04-03-20 (P 040518) CRISIL AAA 10.37
9.5% INDUSIND BANK PERPE CALL 18-04-2022 CRISIL AA 10.35
7.20% IRFC LTD NCD RED 29-05-2020 CRISIL AAA 10.19
7.13% RURAL ELECTR NCD RED 21-09-2020 CRISIL AAA 10.16
7.17% NHAI LTD NCD RED 23-12-2021 CRISIL AAA 8.07
7.42% POWER FIN COR SR165 RED 26-06-2020 CRISIL AAA 7.76
YES BANK LTD CD RED 08.03.2019 ICRA A1+ 5.76
8.06% SIDBI NCD RED 28-03-2019 CARE AAA 5.36
9.25% DEWAN HSNG FIN NCD RED 16-08-2021 CARE AAA 4.16
6.73% IRFC LTD NCD RED 23-03-2020 CRISIL AAA 4.04
9.15% DEWAN HSNG FIN NCD RED 09-09-2021 CARE AAA 2.91
8.55% ICICI BANK PERPETUAL CALL 20-09-22 CARE AA+ 2.82
9.30% POWER GRID CORP NCD RED 28-06-2019 CRISIL AAA 2.09
7.85 SIDBI NCD RED 26-03-21 P/C 04/09/19 CRISIL AAA 2.06
CBLO 2.00
9.45% LIC HSNG FIN LTD NCD RED 10-09-19 CRISIL AAA 1.67
8.37% RURAL ELEC CORP NCD RED 14-08-2020 CRISIL AAA 1.67
Others 8.56
17
Investors understand
that their principal will be at
Moderate Risk
Asset Allocation (% of total)
Maturity Profile
Past performance may or may not be sustained in future and should not be used as a basis for comparison with other investments. * CAGR Return.
Banking And PSU Debt FundAn open ended debt scheme predominantly investing in Debt Instruments of Banks,Public Sector Undertakings, Public Financial Institutions and Municipal Bonds.
Fund Performance
Period
Scheme - Regular PlanBenchmark
(CRISIL Short Term Bond Fund Index)
Returns* Returns*
Additional Benchmark(CRISIL 1 year T-bill Index)
Value of Rs. 10000 Invested
Value of Rs. 10000 InvestedReturns*Value of Rs. 10000
Invested
1 Year
3 Year
5 Year
Since Inception - Regular Plan
6.36% 10,631 6.17% 10,611 5.92% 10,587
7.20% 12,314 7.90% 12,558 6.91% 12,217
NA NA NA NA NA NA
8.32% 14,374 8.81% 14,670 7.50% 13,888
Inception Date 13-Sep-13
NAV (as on March 28, 2018)
Direct Plan Growth Option 14.5662
Direct Plan Monthly Dividend Option 10.3493
Direct Plan Weekly Dividend Option 11.1690
Regular Plan Dividend Option 14.3725
Regular Plan Growth Option 14.3737
Regular Plan Monthly Dividend Option 10.3356
Regular Plan Weekly Dividend Option 10.4747
Minimum Investment Amount
Rs 5,000 per application and in multiples of Re 1/-
thereafter.
Additional investment amount
Rs 1,000 per application and in multiples of Re 1/-
thereafter.
Exit Load Nil
Total Expense Ratios~:
Regular Plan 0.50%
Direct Plan 0.25%
~Does not include GST on Investment Management
fees.
Fund Size
Month End AUM
Rs. 244.07 Crore
Monthly Average AUM
Rs. 253.27 Crore
Fund Managers Details
Fund Managers Experience Managing Since
Mr. Dhawal Dalal 20 years 28-Nov-16
Mr. Gautam Kaul 15 years 11-Dec-17
AAAAAAA+A1+Cash & Other Receivables
Quantitative indicators
(As on 31st March, 2018)
83.68%
8.56%
5.76%2.00%
Non -Conver�ble Debentures Net Rec / (Pay) Cer�ficate of Deposit CBLO/Repo
10.35%
70.51%
2.82%
5.76%
10.56%
21.68%
18.17%
31.83%
28.31%
0%
5%
10%
15%
20%
25%
30%
35%
0 - 1 year 1 - 2 years 2 - 3 years 3 - 5 years
Average MaturityYield to maturity (YTM)
7.63%
Modified Duration
1.94years
2.33years
Macaulay Duration
2.09Years
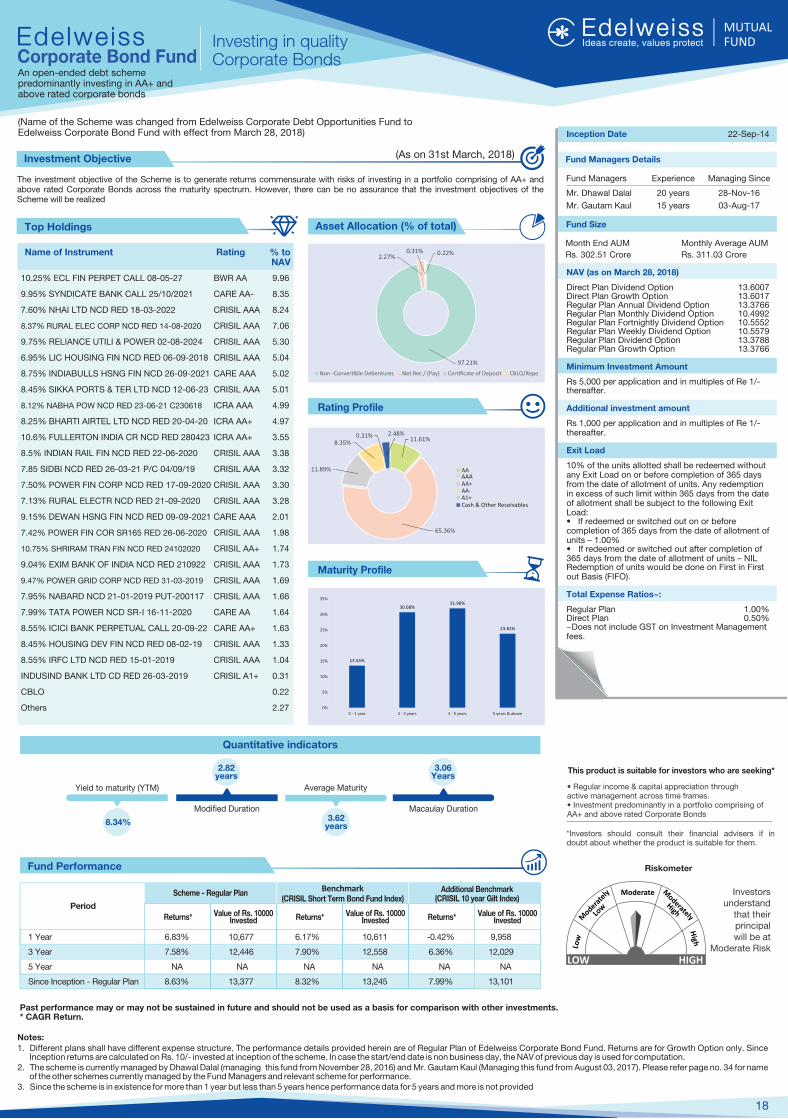
The investment objective of the Scheme is to generate returns commensurate with risks of investing in a portfolio comprising of AA+ and above rated Corporate Bonds across the maturity spectrum. However, there can be no assurance that the investment objectives of the Scheme will be realized
Investment Objective
This product is suitable for investors who are seeking*
� Regular income & capital appreciation through active management across time frames.� Investment predominantly in a portfolio comprising of AA+ and above rated Corporate Bonds
*Investors should consult their financial advisers if in doubt about whether the product is suitable for them.
Notes:1. Different plans shall have different expense structure. The performance details provided herein are of of Regular Plan Edelweiss Corporate Bond Fund. Returns are for Growth Option only. Since
Inception returns are calculated on Rs. 10/- invested at inception of the scheme. In case the start/end date is non business day, the NAV of previous day is used for computation.2. The scheme is currently managed by Dhawal Dalal November 28 6 Mr. Gautam Kaul August 03, 7 Please refer page no. 34 for name (managing this fund from , 201 ) and (Managing this fund from 201 ).
of the other schemes currently managed by the Fund Managers and relevant scheme for performance.3. Since the scheme is in existence for more than 1 year but less than 5 years hence performance data for 5 years and more is not provided
Inception Date 22-Sep-14
NAV (as on March 28, 2018)
Direct Plan Dividend Option 13.6007Direct Plan Growth Option 13.6017Regular Plan Annual Dividend Option 13.3766Regular Plan Monthly Dividend Option 10.4992Regular Plan Fortnightly Dividend Option 10.5552Regular Plan Weekly Dividend Option 10.5579Regular Plan Dividend Option 13.3788Regular Plan Growth Option 13.3766
Minimum Investment Amount
Rs 5,000 per application and in multiples of Re 1/-thereafter.
Additional investment amount
Rs 1,000 per application and in multiples of Re 1/- thereafter.
Exit Load
10% of the units allotted shall be redeemed without any Exit Load on or before completion of 365 days from the date of allotment of units. Any redemption in excess of such limit within 365 days from the date of allotment shall be subject to the following Exit Load: � If redeemed or switched out on or before completion of 365 days from the date of allotment of units � 1.00% � If redeemed or switched out after completion of 365 days from the date of allotment of units � NIL Redemption of units would be done on First in First out Basis (FIFO).
Total Expense Ratios~:
Regular Plan 1.00%Direct Plan 0.50%~Does not include GST on Investment Management fees.
Rating Profile
Name of Instrument Rating % to NAV
Top Holdings Fund Size
Month End AUM
Rs. 302.51 Crore
Monthly Average AUM
Rs. 311.03 Crore
10.25% ECL FIN PERPET CALL 08-05-27 BWR AA 9.96
9.95% SYNDICATE BANK CALL 25/10/2021 CARE AA- 8.35
7.60% NHAI LTD NCD RED 18-03-2022 CRISIL AAA 8.24
8.37% RURAL ELEC CORP NCD RED 14-08-2020 CRISIL AAA 7.06
9.75% RELIANCE UTILI & POWER 02-08-2024 CRISIL AAA 5.30
6.95% LIC HOUSING FIN NCD RED 06-09-2018 CRISIL AAA 5.04
8.75% INDIABULLS HSNG FIN NCD 26-09-2021 CARE AAA 5.02
8.45% SIKKA PORTS & TER LTD NCD 12-06-23 CRISIL AAA 5.01
8.12% NABHA POW NCD RED 23-06-21 C230618 ICRA AAA 4.99
8.25% BHARTI AIRTEL LTD NCD RED 20-04-20 ICRA AA+ 4.97
10.6% FULLERTON INDIA CR NCD RED 280423 ICRA AA+ 3.55
8.5% INDIAN RAIL FIN NCD RED 22-06-2020 CRISIL AAA 3.38
7.85 SIDBI NCD RED 26-03-21 P/C 04/09/19 CRISIL AAA 3.32
7.50% POWER FIN CORP NCD RED 17-09-2020 CRISIL AAA 3.30
7.13% RURAL ELECTR NCD RED 21-09-2020 CRISIL AAA 3.28
9.15% DEWAN HSNG FIN NCD RED 09-09-2021 CARE AAA 2.01
7.42% POWER FIN COR SR165 RED 26-06-2020 CRISIL AAA 1.98
10.75% SHRIRAM TRAN FIN NCD RED 24102020 CRISIL AA+ 1.74
9.04% EXIM BANK OF INDIA NCD RED 210922 CRISIL AAA 1.73
9.47% POWER GRID CORP NCD RED 31-03-2019 CRISIL AAA 1.69
7.95% NABARD NCD 21-01-2019 PUT-200117 CRISIL AAA 1.66
7.99% TATA POWER NCD SR-I 16-11-2020 CARE AA 1.64
8.55% ICICI BANK PERPETUAL CALL 20-09-22 CARE AA+ 1.63
8.45% HOUSING DEV FIN NCD RED 08-02-19 CRISIL AAA 1.33
8.55% IRFC LTD NCD RED 15-01-2019 CRISIL AAA 1.04
INDUSIND BANK LTD CD RED 26-03-2019 CRISIL A1+ 0.31
CBLO 0.22
Others 2.27
Fund Managers Details
Fund Managers Experience Managing Since
Mr. Dhawal Dalal 20 years 28-Nov-16
Mr. Gautam Kaul 15 years 03-Aug-17
18
Asset Allocation (% of total)
Maturity Profile
Past performance may or may not be sustained in future and should not be used as a basis for comparison with other investments. * CAGR Return.
Investing in quality Corporate BondsCorporate Bond Fund
An open-ended debt scheme predominantly investing in AA+ and above rated corporate bonds
Fund Performance
Period
Scheme - Regular PlanBenchmark
(CRISIL Short Term Bond Fund Index)
Returns* Returns*
Additional Benchmark(CRISIL 10 year Gilt Index)
Value of Rs. 10000 Invested
Value of Rs. 10000 InvestedReturns*Value of Rs. 10000
Invested
1 Year
3 Year
5 Year
Since Inception - Regular Plan
6.83% 10,677 6.17% 10,611 -0.42% 9,958
7.58% 12,446 7.90% 12,558 6.36% 12,029
NA NA NA NA NA NA
8.63% 13,377 8.32% 13,245 7.99% 13,101
LOW HIGH
Riskometer
Investors understand
that their principal will be at
Moderate Risk
AAAAAAA+AA-A1+
Quantitative indicators
(As on 31st March, 2018)
97.21%
2.27%0.31% 0.22%
Non -Conver�ble Debentures Net Rec / (Pay) Cer�ficate of Deposit CBLO/Repo
Cash & Other Receivables
11.61%
65.36%
11.89%
8.35%0.31% 2.48%
13.55%
30.68%31.96%
23.81%
0%
5%
10%
15%
20%
25%
30%
35%
0 - 1 year 2 - 3 years 3 - 5 years 5 years & above
(Name of the Scheme was changed from Edelweiss Corporate Debt Opportunities Fund to Edelweiss Corporate Bond Fund with effect from March 28, 2018)
Average MaturityYield to maturity (YTM)
8.34%
Modified Duration
2.82years
3.62years
Macaulay Duration
3.06Years
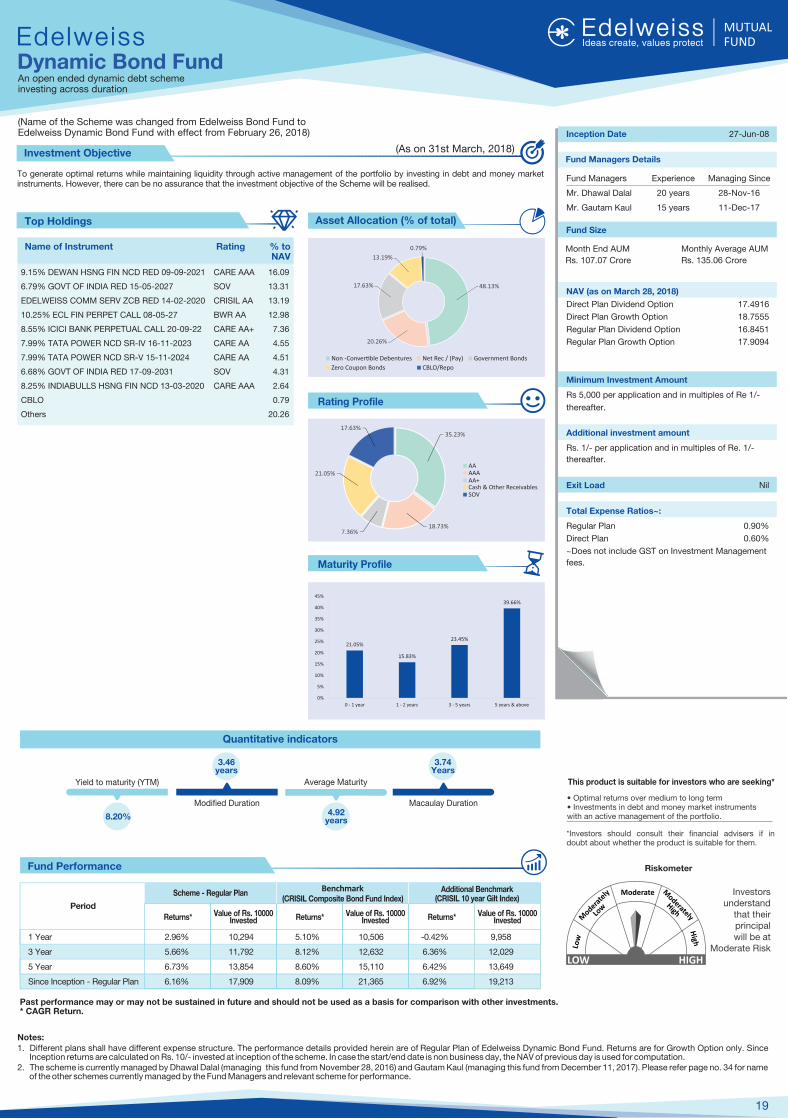
To generate optimal returns while maintaining liquidity through active management of the portfolio by investing in debt and money market instruments. However, there can be no assurance that the investment objective of the Scheme will be realised.
Investment Objective
This product is suitable for investors who are seeking*
� Optimal returns over medium to long term� Investments in debt and money market instruments with an active management of the portfolio.
*Investors should consult their financial advisers if in doubt about whether the product is suitable for them.
Notes:1. Different plans shall have different expense structure. The performance details provided herein are of of Regular Plan Edelweiss Dynamic Bond Fund. Returns are for Growth Option only. Since
Inception returns are calculated on Rs. 10/- invested at inception of the scheme. In case the start/end date is non business day, the NAV of previous day is used for computation.2. The scheme is currently managed by (managing this fund from , 201 ) and Gautam Kaul (managing this fund from December 11, 2017). 34Dhawal Dalal November 28 6 Please refer page no. for name
of the other and relevant scheme for performance. schemes currently managed by the Fund Managers
Inception Date 27-Jun-08
NAV (as on March 28, 2018)
Direct Plan Dividend Option 17.4916
Direct Plan Growth Option 18.7555
Regular Plan Dividend Option 16.8451
Regular Plan Growth Option 17.9094
Minimum Investment Amount
Rs 5,000 per application and in multiples of Re 1/-
thereafter.
Additional investment amount
Rs. 1/- per application and in multiples of Re. 1/-
thereafter.
Exit Load Nil
Total Expense Ratios~:
Regular Plan 0.90%
Direct Plan 0.60%
~Does not include GST on Investment Management
fees.
Rating Profile
Name of Instrument Rating % to NAV
Top HoldingsFund Size
Month End AUM
Rs. 107.07 Crore
Monthly Average AUM
Rs. 135.06 Crore
9.15% DEWAN HSNG FIN NCD RED 09-09-2021 CARE AAA 16.09
6.79% GOVT OF INDIA RED 15-05-2027 SOV 13.31
EDELWEISS COMM SERV ZCB RED 14-02-2020 CRISIL AA 13.19
10.25% ECL FIN PERPET CALL 08-05-27 BWR AA 12.98
8.55% ICICI BANK PERPETUAL CALL 20-09-22 CARE AA+ 7.36
7.99% TATA POWER NCD SR-IV 16-11-2023 CARE AA 4.55
7.99% TATA POWER NCD SR-V 15-11-2024 CARE AA 4.51
6.68% GOVT OF INDIA RED 17-09-2031 SOV 4.31
8.25% INDIABULLS HSNG FIN NCD 13-03-2020 CARE AAA 2.64
CBLO 0.79
Others 20.26
Fund Managers Details
Fund Managers Experience Managing Since
Mr. Dhawal Dalal 20 years 28-Nov-16
Mr. Gautam Kaul 15 years 11-Dec-17
19
Asset Allocation (% of total)
Maturity Profile
Past performance may or may not be sustained in future and should not be used as a basis for comparison with other investments. * CAGR Return.
Dynamic Bond FundAn open ended dynamic debt scheme investing across duration
Fund Performance
Period
Scheme - Regular PlanBenchmark
(CRISIL Composite Bond Fund Index)
Returns* Returns*
Additional Benchmark(CRISIL 10 year Gilt Index)
Value of Rs. 10000 Invested
Value of Rs. 10000 InvestedReturns*Value of Rs. 10000
Invested
1 Year
3 Year
5 Year
Since Inception - Regular Plan
2.96% 10,294 5.10% 10,506 -0.42% 9,958
5.66% 11,792 8.12% 12,632 6.36% 12,029
6.73% 13,854 8.60% 15,110 6.42% 13,649
6.16% 17,909 8.09% 21,365 6.92% 19,213
LOW HIGH
Riskometer
Investors understand
that their principal will be at
Moderate Risk
Quantitative indicators
(As on 31st March, 2018)
(Name of the Scheme was changed from Edelweiss Bond Fund to Edelweiss Dynamic Bond Fund with effect from February 26, 2018)
48.13%
20.26%
17.63%
13.19%
0.79%
Non -Conver�ble Debentures Net Rec / (Pay) Government Bonds
Zero Coupon Bonds CBLO/Repo
AAAAAAA+Cash & Other ReceivablesSOV
35.23%
18.73%7.36%
21.05%
17.63%
21.05%
15.83%
23.45%
39.66%
0%
5%
10%
15%
20%
25%
30%
35%
40%
45%
0 - 1 year 1 - 2 years 3 - 5 years 5 years & above
Average MaturityYield to maturity (YTM)
8.20%
Modified Duration
3.46years
4.92years
Macaulay Duration
3.74Years
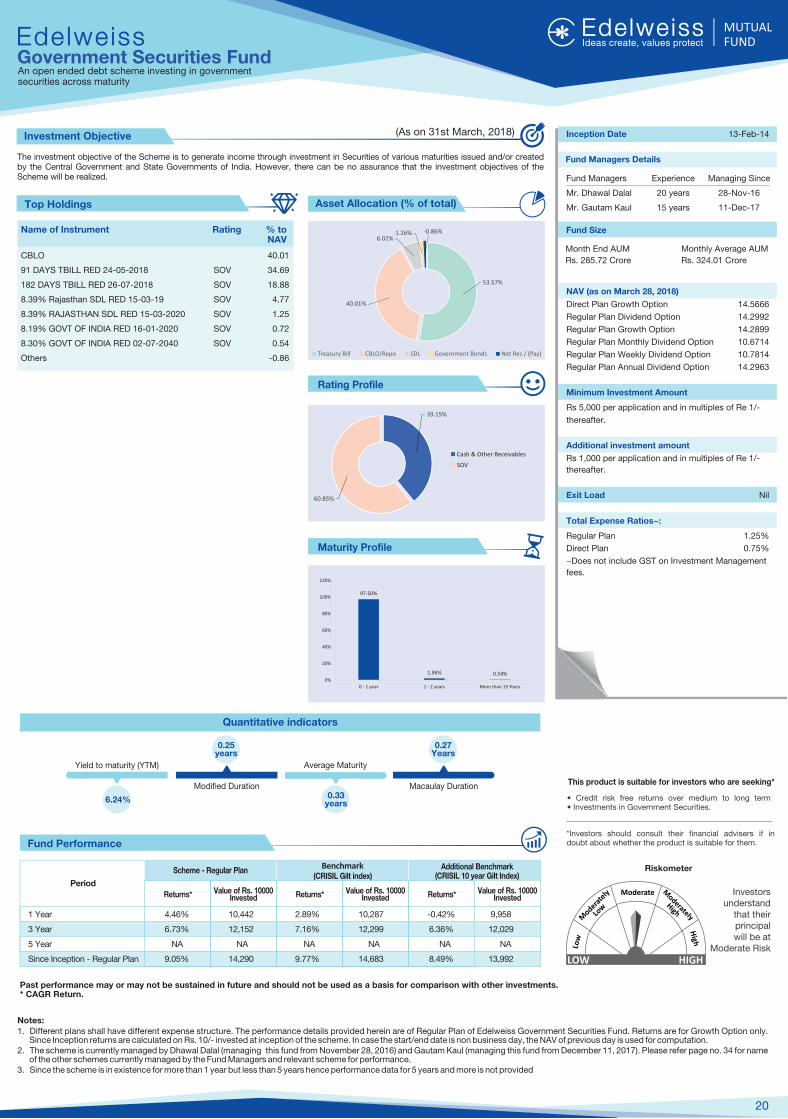
The investment objective of the Scheme is to generate income through investment in Securities of various maturities issued and/or created by the Central Government and State Governments of India. However, there can be no assurance that the investment objectives of the Scheme will be realized.
Investment Objective
This product is suitable for investors who are seeking*
� Credit risk free returns over medium to long term� Investments in Government Securities.
*Investors should consult their financial advisers if in doubt about whether the product is suitable for them.
Notes:1. Different plans shall have different expense structure. The performance details provided herein are of of Regular Plan Edelweiss Government Securities Fund. Returns are for Growth Option only.
Since Inception returns are calculated on Rs. 10/- invested at inception of the scheme. In case the start/end date is non business day, the NAV of previous day is used for computation.2. The scheme is currently managed by (managing this fund from , 201 )Dhawal Dalal November 28 6 and Gautam Kaul (managing this fund from December 11, 2017). Please refer page no. 34 for name
of the other schemes currently managed by the Fund Managers and relevant scheme for performance.3. Since the scheme is in existence for more than 1 year but less than 5 years hence performance data for 5 years and more is not provided
Inception Date 13-Feb-14
NAV (as on March 28, 2018)
Direct Plan Growth Option 14.5666
Regular Plan Dividend Option 14.2992
Regular Plan Growth Option 14.2899
Regular Plan Monthly Dividend Option 10.6714
Regular Plan Weekly Dividend Option 10.7814
Regular Plan Annual Dividend Option 14.2963
Minimum Investment Amount
Rs 5,000 per application and in multiples of Re 1/-
thereafter.
Additional investment amount
Rs 1,000 per application and in multiples of Re 1/-
thereafter.
Exit Load Nil
Total Expense Ratios~:
Regular Plan 1.25%
Direct Plan 0.75%
~Does not include GST on Investment Management
fees.
Rating Profile
Name of Instrument Rating % to NAV
Top Holdings
Fund Size
Month End AUM
Rs. 285.72 Crore
Monthly Average AUM
Rs. 324.01 CroreCBLO 40.01
91 DAYS TBILL RED 24-05-2018 SOV 34.69
182 DAYS TBILL RED 26-07-2018 SOV 18.88
8.39% Rajasthan SDL RED 15-03-19 SOV 4.77
8.39% RAJASTHAN SDL RED 15-03-2020 SOV 1.25
8.19% GOVT OF INDIA RED 16-01-2020 SOV 0.72
8.30% GOVT OF INDIA RED 02-07-2040 SOV 0.54
Others -0.86
Fund Managers Details
Fund Managers Experience Managing Since
Mr. Dhawal Dalal 20 years 28-Nov-16
Mr. Gautam Kaul 15 years 11-Dec-17
20
Asset Allocation (% of total)
Maturity Profile
Past performance may or may not be sustained in future and should not be used as a basis for comparison with other investments. * CAGR Return.
Government Securities FundAn open ended debt scheme investing in government securities across maturity
Fund Performance
Period
Scheme - Regular PlanBenchmark
(CRISIL Gilt index)
Returns* Returns*
Additional Benchmark(CRISIL 10 year Gilt Index)
Value of Rs. 10000 Invested
Value of Rs. 10000 InvestedReturns*Value of Rs. 10000
Invested
1 Year
3 Year
5 Year
Since Inception - Regular Plan
4.46% 10,442 2.89% 10,287 -0.42% 9,958
6.73% 12,152 7.16% 12,299 6.36% 12,029
NA NA NA NA NA NA
9.05% 14,290 9.77% 14,683 8.49% 13,992 LOW HIGH
Riskometer
Investors understand
that their principal will be at
Moderate Risk
Cash & Other Receivables
SOV
Quantitative indicators
(As on 31st March, 2018)
53.57%
40.01%
6.02%1.26% -0.86%
Treasury Bill CBLO/Repo SDL Government Bonds Net Rec / (Pay)
39.15%
60.85%
97.50%
1.96% 0.54%0%
20%
40%
60%
80%
100%
120%
0 - 1 year 1 - 2 years More than 15 Years
Average MaturityYield to maturity (YTM)
6.24%
Modified Duration
0.25years
0.33years
Macaulay Duration
0.27Years
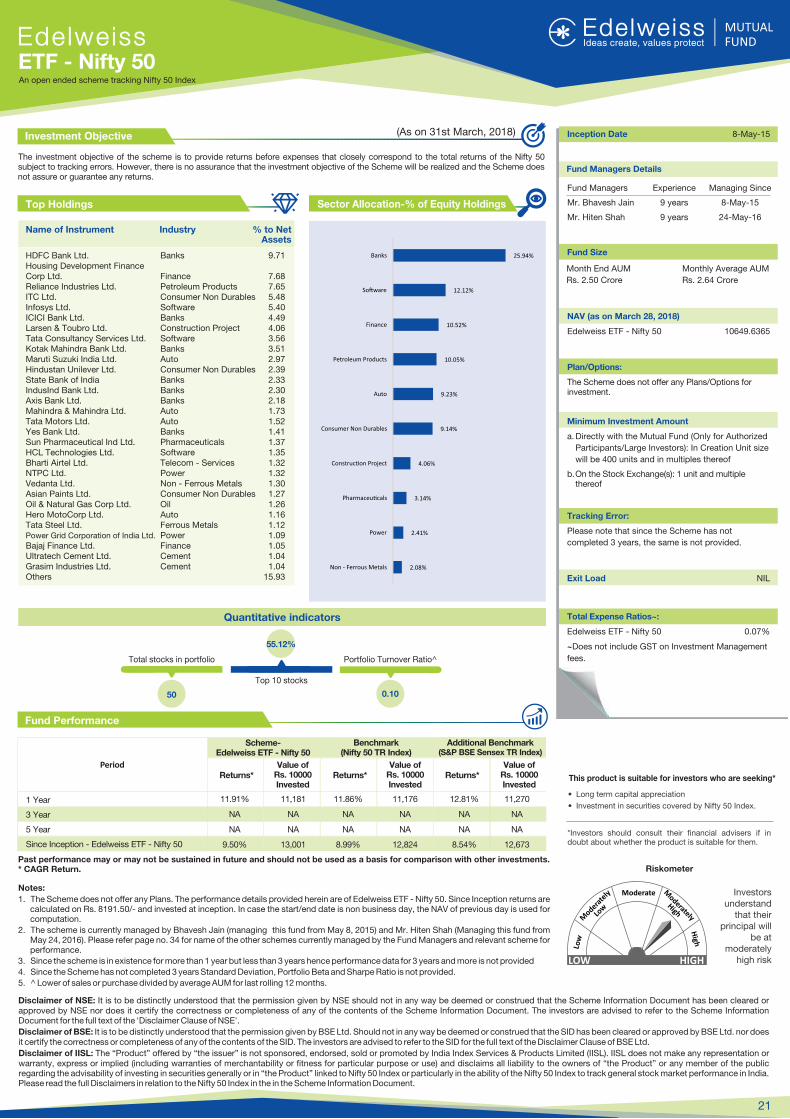
The investment objective of the scheme is to provide returns before expenses that closely correspond to the total returns of the Nifty 50 subject to tracking errors. However, there is no assurance that the investment objective of the Scheme will be realized and the Scheme does not assure or guarantee any returns.
Investment Objective
LOW HIGH
Riskometer
This product is suitable for investors who are seeking*
� Long term capital appreciation
� Investment in securities covered by Nifty 50 Index.
*Investors should consult their financial advisers if in doubt about whether the product is suitable for them.
Disclaimer of NSE: It is to be distinctly understood that the permission given by NSE should not in any way be deemed or construed that the Scheme Information Document has been cleared or approved by NSE nor does it certify the correctness or completeness of any of the contents of the Scheme Information Document. The investors are advised to refer to the Scheme Information Document for the full text of the 'Disclaimer Clause of NSE'.
Disclaimer of BSE: It is to be distinctly understood that the permission given by BSE Ltd. Should not in any way be deemed or construed that the SID has been cleared or approved by BSE Ltd. nor does it certify the correctness or completeness of any of the contents of the SID. The investors are advised to refer to the SID for the full text of the Disclaimer Clause of BSE Ltd.
Disclaimer of IISL: The �Product� offered by �the issuer� is not sponsored, endorsed, sold or promoted by India Index Services & Products Limited (IISL). IISL does not make any representation or warranty, express or implied (including warranties of merchantability or fitness for particular purpose or use) and disclaims all liability to the owners of �the Product� or any member of the public regarding the advisability of investing in securities generally or in �the Product� linked to Nifty 50 Index or particularly in the ability of the Nifty 50 Index to track general stock market performance in India. Please read the full Disclaimers in relation to the Nifty 50 Index in the in the Scheme Information Document.
Sector Allocation-% of Equity Holdings
Name of Instrument Industry % to Net Assets
Top Holdings
HDFC Bank Ltd. Banks 9.71Housing Development Finance Corp Ltd. Finance 7.68Reliance Industries Ltd. Petroleum Products 7.65ITC Ltd. Consumer Non Durables 5.48Infosys Ltd. Software 5.40ICICI Bank Ltd. Banks 4.49Larsen & Toubro Ltd. Construction Project 4.06Tata Consultancy Services Ltd. Software 3.56Kotak Mahindra Bank Ltd. Banks 3.51Maruti Suzuki India Ltd. Auto 2.97Hindustan Unilever Ltd. Consumer Non Durables 2.39State Bank of India Banks 2.33IndusInd Bank Ltd. Banks 2.30Axis Bank Ltd. Banks 2.18Mahindra & Mahindra Ltd. Auto 1.73Tata Motors Ltd. Auto 1.52Yes Bank Ltd. Banks 1.41Sun Pharmaceutical Ind Ltd. Pharmaceuticals 1.37HCL Technologies Ltd. Software 1.35Bharti Airtel Ltd. Telecom - Services 1.32NTPC Ltd. Power 1.32Vedanta Ltd. Non - Ferrous Metals 1.30Asian Paints Ltd. Consumer Non Durables 1.27Oil & Natural Gas Corp Ltd. Oil 1.26Hero MotoCorp Ltd. Auto 1.16Tata Steel Ltd. Ferrous Metals 1.12Power Grid Corporation of India Ltd. Power 1.09Bajaj Finance Ltd. Finance 1.05Ultratech Cement Ltd. Cement 1.04Grasim Industries Ltd. Cement 1.04Others 15.93
Fund Managers Details
Fund Managers Experience Managing Since
Mr. Bhavesh Jain 9 years 8-May-15
Mr. Hiten Shah 9 years 24-May-16
21
Investors understand
that their principal will
be at moderately
high risk
Past performance may or may not be sustained in future and should not be used as a basis for comparison with other investments. * CAGR Return.
Fund Performance
Scheme-Edelweiss ETF - Nifty 50
Returns*Period
Additional Benchmark(S&P BSE Sensex TR Index)
Benchmark(Nifty 50 TR Index)
1 Year
3 Year
5 Year
Since Inception - Edelweiss ETF - Nifty 50
Value of Rs. 10000 Invested
Value of Rs. 10000 Invested
Value of Rs. 10000 Invested
Returns*Returns*
Notes:
1. The Scheme does not offer any Plans. The performance details provided herein are of Edelweiss ETF - Nifty 50. Since Inception returns are calculated on Rs. 8191.50/- and invested at inception. In case the start/end date is non business day, the NAV of previous day is used for computation.
2. The scheme is currently managed by Bhavesh Jain (managing this fund from May 8, 2015) and Mr. Hiten Shah (Managing this fund from May 24, 2016). Please refer page no. 34 for name of the other schemes currently managed by the Fund Managers and relevant scheme for performance.
3. Since the scheme is in existence for more than 1 year but less than 3 years hence performance data for 3 years and more is not provided
4. Since the Scheme has not completed 3 years Standard Deviation, Portfolio Beta and Sharpe Ratio is not provided.
5. ^ Lower of sales or purchase divided by average AUM for last rolling 12 months.
Inception Date 8-May-15
NAV (as on March 28, 2018)
Edelweiss ETF - Nifty 50 10649.6365
Plan/Options:
The Scheme does not offer any Plans/Options for investment.
Minimum Investment Amount
a. Directly with the Mutual Fund (Only for Authorized
Participants/Large Investors): In Creation Unit size
will be 400 units and in multiples thereof
b. On the Stock Exchange(s): 1 unit and multiple thereof
Tracking Error:
Please note that since the Scheme has not
completed 3 years, the same is not provided.
Exit Load NIL
Total Expense Ratios~:
Edelweiss ETF - Nifty 50 0.07%
~Does not include GST on Investment Management
fees.
ETF - Nifty 50An open ended scheme tracking Nifty 50 Index
Quantitative indicators
Portfolio Turnover Ratio^Total stocks in portfolio
50
Top 10 stocks
55.12%
0.10
11.91% 11,181 11.86% 11,176 12.81% 11,270
NA NA NA NA NA NA
NA NA NA NA NA NA
9.50% 13,001 8.99% 12,824 8.54% 12,673
(As on 31st March, 2018)
Fund Size
Month End AUM
Rs. 2.50 Crore
Monthly Average AUM
Rs. 2.64 Crore
2.08%
2.41%
3.14%
4.06%
9.14%
9.23%
10.05%
10.52%
12.12%
25.94%
Non - Ferrous Metals
Power
Pharmaceu�cals
Construc�on Project
Consumer Non Durables
Auto
Petroleum Products
Finance
So�ware
Banks
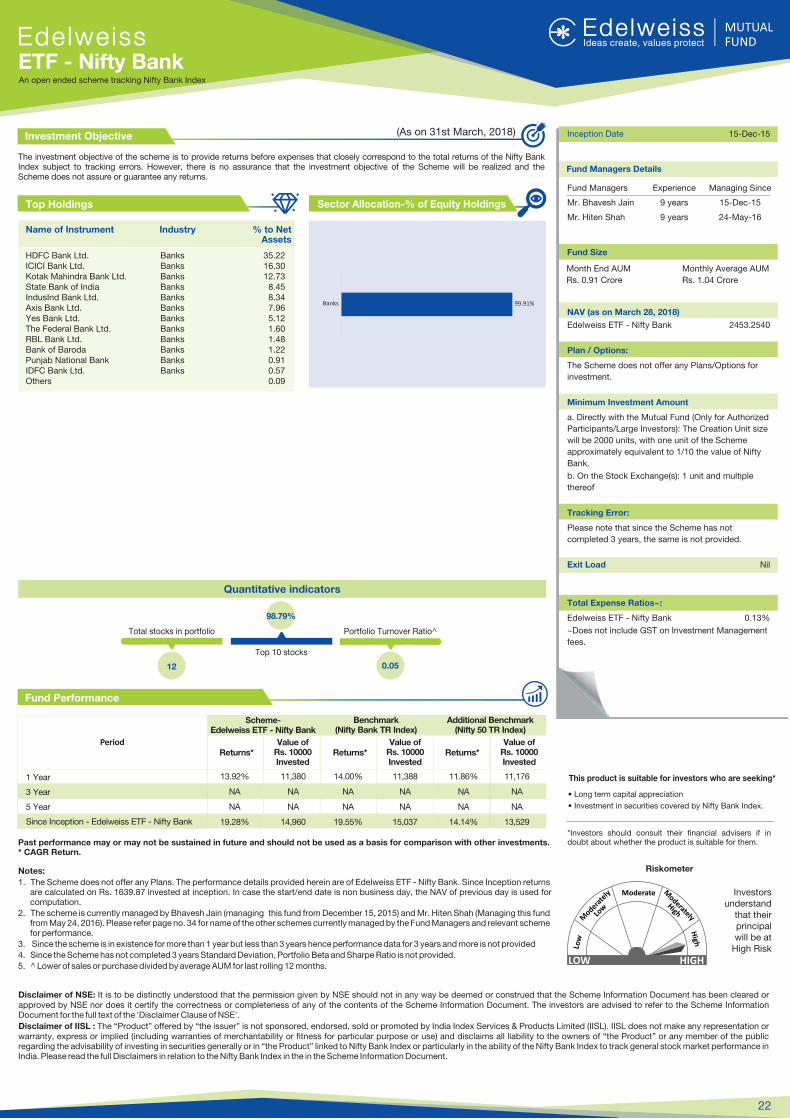
The investment objective of the scheme is to provide returns before expenses that closely correspond to the total returns of the Nifty Bank Index subject to tracking errors. However, there is no assurance that the investment objective of the Scheme will be realized and the Scheme does not assure or guarantee any returns.
Investment Objective
Fund Performance
LOW HIGH
Riskometer
This product is suitable for investors who are seeking*
� Long term capital appreciation
� Investment in securities covered by Nifty Bank Index.
*Investors should consult their financial advisers if in doubt about whether the product is suitable for them.
Disclaimer of NSE: It is to be distinctly understood that the permission given by NSE should not in any way be deemed or construed that the Scheme Information Document has been cleared or approved by NSE nor does it certify the correctness or completeness of any of the contents of the Scheme Information Document. The investors are advised to refer to the Scheme Information Document for the full text of the 'Disclaimer Clause of NSE'.
Disclaimer of IISL : The �Product� offered by �the issuer� is not sponsored, endorsed, sold or promoted by India Index Services & Products Limited (IISL). IISL does not make any representation or warranty, express or implied (including warranties of merchantability or fitness for particular purpose or use) and disclaims all liability to the owners of �the Product� or any member of the public regarding the advisability of investing in securities generally or in �the Product� linked to Nifty Bank Index or particularly in the ability of the Nifty Bank Index to track general stock market performance in India. Please read the full Disclaimers in relation to the Nifty Bank Index in the in the Scheme Information Document.
Sector Allocation-% of Equity Holdings
Name of Instrument Industry % to Net Assets
Top Holdings
HDFC Bank Ltd. Banks 35.22ICICI Bank Ltd. Banks 16.30Kotak Mahindra Bank Ltd. Banks 12.73State Bank of India Banks 8.45IndusInd Bank Ltd. Banks 8.34Axis Bank Ltd. Banks 7.96Yes Bank Ltd. Banks 5.12The Federal Bank Ltd. Banks 1.60RBL Bank Ltd. Banks 1.48Bank of Baroda Banks 1.22Punjab National Bank Banks 0.91IDFC Bank Ltd. Banks 0.57Others 0.09
Fund Managers Details
22
Investors understand
that their principal will be at
High Risk
Past performance may or may not be sustained in future and should not be used as a basis for comparison with other investments. * CAGR Return.
Scheme-Edelweiss ETF - Nifty Bank
Returns*Period
Additional Benchmark(Nifty 50 TR Index)
Benchmark(Nifty Bank TR Index)
1 Year
3 Year
5 Year
Since Inception - Edelweiss ETF - Nifty Bank
Value of Rs. 10000 Invested
Value of Rs. 10000 Invested
Value of Rs. 10000 Invested
Returns*Returns*
Notes:
1. The Scheme does not offer any Plans. The performance details provided herein are of Edelweiss ETF - Nifty Bank. Since Inception returns are calculated on Rs. 1639.87 invested at inception. In case the start/end date is non business day, the NAV of previous day is used for computation.
2. The scheme is currently managed by Bhavesh Jain (managing this fund from December 15, 2015) and Mr. Hiten Shah (Managing this fund from May 24, 2016). Please refer page no. 34 for name of the other schemes currently managed by the Fund Managers and relevant scheme for performance.
3. Since the scheme is in existence for more than 1 year but less than 3 years hence performance data for 3 years and more is not provided
4. Since the Scheme has not completed 3 years Standard Deviation, Portfolio Beta and Sharpe Ratio is not provided.
5. ^ Lower of sales or purchase divided by average AUM for last rolling 12 months.
Inception Date 15-Dec-15
NAV (as on March 28, 2018)
Edelweiss ETF - Nifty Bank 2453.2540
Plan / Options:
The Scheme does not offer any Plans/Options for
investment.
Minimum Investment Amount
a. Directly with the Mutual Fund (Only for Authorized
Participants/Large Investors): The Creation Unit size
will be 2000 units, with one unit of the Scheme
approximately equivalent to 1/10 the value of Nifty
Bank.
b. On the Stock Exchange(s): 1 unit and multiple
thereof
Tracking Error:
Please note that since the Scheme has not
completed 3 years, the same is not provided.
Exit Load Nil
Total Expense Ratios~:
Edelweiss ETF - Nifty Bank 0.13%
~Does not include GST on Investment Management
fees.
ETF - Nifty BankAn open ended scheme tracking Nifty Bank Index
Fund Managers Experience Managing Since
Mr. Bhavesh Jain 9 years 15-Dec-15
Mr. Hiten Shah 9 years 24-May-16
99.91% Banks
Quantitative indicators
Portfolio Turnover Ratio^Total stocks in portfolio
12
Top 10 stocks
98.79%
0.05
Fund Size
Month End AUM
Rs. 0.91 Crore
Monthly Average AUM
Rs. 1.04 Crore
13.92% 11,380 14.00% 11,388 11.86% 11,176
NA NA NA NA NA NA
NA NA NA NA NA NA
19.28% 14,960 19.55% 15,037 14.14% 13,529
(As on 31st March, 2018)
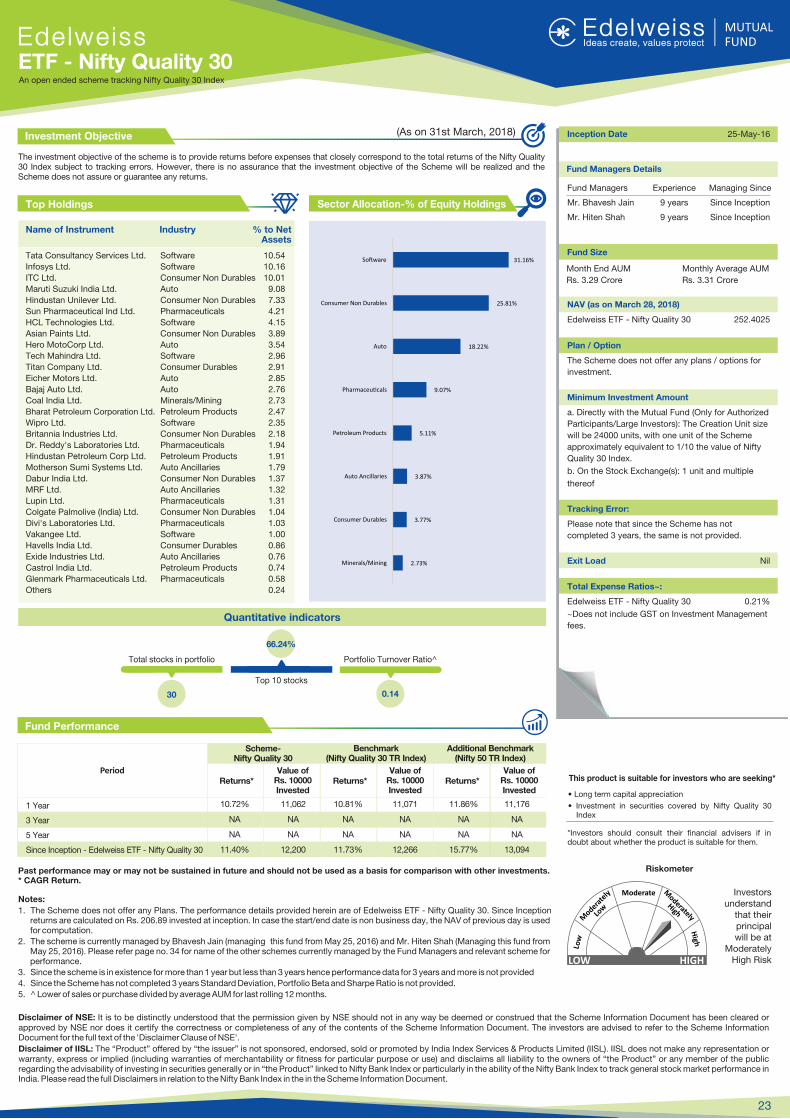
The investment objective of the scheme is to provide returns before expenses that closely correspond to the total returns of the Nifty Quality 30 Index subject to tracking errors. However, there is no assurance that the investment objective of the Scheme will be realized and the Scheme does not assure or guarantee any returns.
Investment Objective
Fund Performance
LOW HIGH
Riskometer
This product is suitable for investors who are seeking*
� Long term capital appreciation
� Investment in securities covered by Nifty Quality 30 Index
*Investors should consult their financial advisers if in doubt about whether the product is suitable for them.
Disclaimer of NSE: It is to be distinctly understood that the permission given by NSE should not in any way be deemed or construed that the Scheme Information Document has been cleared or approved by NSE nor does it certify the correctness or completeness of any of the contents of the Scheme Information Document. The investors are advised to refer to the Scheme Information Document for the full text of the 'Disclaimer Clause of NSE'.
Disclaimer of IISL: The �Product� offered by �the issuer� is not sponsored, endorsed, sold or promoted by India Index Services & Products Limited (IISL). IISL does not make any representation or warranty, express or implied (including warranties of merchantability or fitness for particular purpose or use) and disclaims all liability to the owners of �the Product� or any member of the public regarding the advisability of investing in securities generally or in �the Product� linked to Nifty Bank Index or particularly in the ability of the Nifty Bank Index to track general stock market performance in India. Please read the full Disclaimers in relation to the Nifty Bank Index in the in the Scheme Information Document.
Sector Allocation-% of Equity Holdings
Name of Instrument Industry % to Net Assets
Top Holdings
Tata Consultancy Services Ltd. Software 10.54
Infosys Ltd. Software 10.16
ITC Ltd. Consumer Non Durables 10.01
Maruti Suzuki India Ltd. Auto 9.08
Hindustan Unilever Ltd. Consumer Non Durables 7.33
Sun Pharmaceutical Ind Ltd. Pharmaceuticals 4.21
HCL Technologies Ltd. Software 4.15
Asian Paints Ltd. Consumer Non Durables 3.89
Hero MotoCorp Ltd. Auto 3.54
Tech Mahindra Ltd. Software 2.96
Titan Company Ltd. Consumer Durables 2.91
Eicher Motors Ltd. Auto 2.85
Bajaj Auto Ltd. Auto 2.76
Coal India Ltd. Minerals/Mining 2.73
Bharat Petroleum Corporation Ltd. Petroleum Products 2.47
Wipro Ltd. Software 2.35
Britannia Industries Ltd. Consumer Non Durables 2.18
Dr. Reddy's Laboratories Ltd. Pharmaceuticals 1.94
Hindustan Petroleum Corp Ltd. Petroleum Products 1.91
Motherson Sumi Systems Ltd. Auto Ancillaries 1.79
Dabur India Ltd. Consumer Non Durables 1.37
MRF Ltd. Auto Ancillaries 1.32
Lupin Ltd. Pharmaceuticals 1.31
Colgate Palmolive (India) Ltd. Consumer Non Durables 1.04
Divi's Laboratories Ltd. Pharmaceuticals 1.03
Vakangee Ltd. Software 1.00
Havells India Ltd. Consumer Durables 0.86
Exide Industries Ltd. Auto Ancillaries 0.76
Castrol India Ltd. Petroleum Products 0.74
Glenmark Pharmaceuticals Ltd. Pharmaceuticals 0.58
Others 0.24
Fund Managers Details
23
Investors understand
that their principal will be at
Moderately High Risk
Past performance may or may not be sustained in future and should not be used as a basis for comparison with other investments. * CAGR Return.
Scheme-Nifty Quality 30
Returns*Period
Additional Benchmark(Nifty 50 TR Index)
Benchmark(Nifty Quality 30 TR Index)
1 Year
3 Year
5 Year
Since Inception - Edelweiss ETF - Nifty Quality 30
Value of Rs. 10000 Invested
Value of Rs. 10000 Invested
Value of Rs. 10000 Invested
Returns*Returns*
Notes:
1. The Scheme does not offer any Plans. The performance details provided herein are of Edelweiss ETF - Nifty Quality 30. Since Inception returns are calculated on Rs. 206.89 invested at inception. In case the start/end date is non business day, the NAV of previous day is used for computation.
2. The scheme is currently managed by Bhavesh Jain (managing this fund from May 25, 2016) and Mr. Hiten Shah (Managing this fund from May 25, 2016). Please refer page no. 34 for name of the other schemes currently managed by the Fund Managers and relevant scheme for performance.
3. Since the scheme is in existence for more than 1 year but less than 3 years hence performance data for 3 years and more is not provided
4. Since the Scheme has not completed 3 years Standard Deviation, Portfolio Beta and Sharpe Ratio is not provided.
5. ^ Lower of sales or purchase divided by average AUM for last rolling 12 months.
Inception Date 25-May-16
NAV (as on March 28, 2018)
Edelweiss ETF - Nifty Quality 30 252.4025
Plan / Option
The Scheme does not offer any plans / options for
investment.
Minimum Investment Amount
a. Directly with the Mutual Fund (Only for Authorized
Participants/Large Investors): The Creation Unit size
will be 24000 units, with one unit of the Scheme
approximately equivalent to 1/10 the value of Nifty
Quality 30 Index.
b. On the Stock Exchange(s): 1 unit and multiple
thereof
Tracking Error:
Please note that since the Scheme has not
completed 3 years, the same is not provided.
Exit Load Nil
Total Expense Ratios~:
Edelweiss ETF - Nifty Quality 30 0.21%
~Does not include GST on Investment Management
fees.
ETF - Nifty Quality 30An open ended scheme tracking Nifty Quality 30 Index
Fund Managers Experience Managing Since
Mr. Bhavesh Jain 9 years Since Inception
Mr. Hiten Shah 9 years Since Inception
Quantitative indicators
Portfolio Turnover Ratio^Total stocks in portfolio
30
Top 10 stocks
66.24%
0.14
Fund Size
Month End AUM
Rs. 3.29 Crore
Monthly Average AUM
Rs. 3.31 Crore
10.72% 11,062 10.81% 11,071 11.86% 11,176
NA NA NA NA NA NA
NA NA NA NA NA NA
11.40% 12,200 11.73% 12,266 15.77% 13,094
(As on 31st March, 2018)
2.73%
3.77%
3.87%
5.11%
9.07%
18.22%
25.81%
31.16%
Minerals/Mining
Consumer Durables
Auto Ancillaries
Petroleum Products
Pharmaceu�cals
Auto
Consumer Non Durables
So�ware
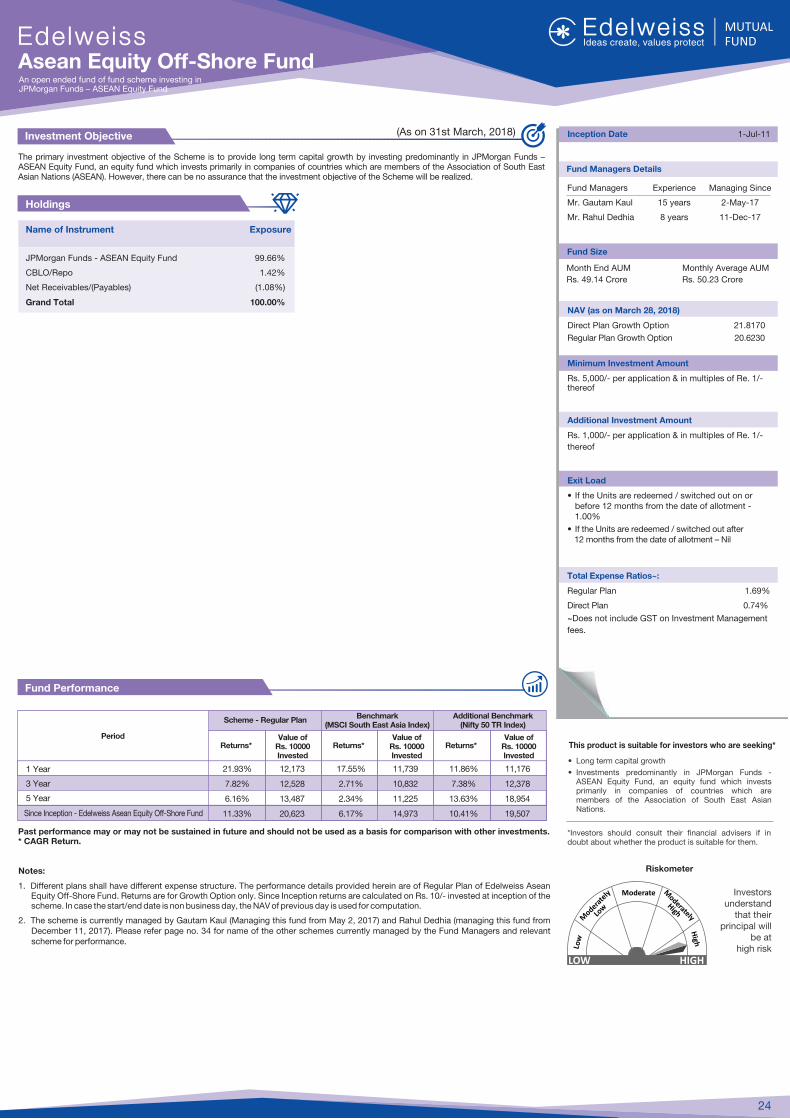
The primary investment objective of the Scheme is to provide long term capital growth by investing predominantly in JPMorgan Funds � ASEAN Equity Fund, an equity fund which invests primarily in companies of countries which are members of the Association of South East Asian Nations (ASEAN). However, there can be no assurance that the investment objective of the Scheme will be realized.
Investment Objective
Fund Performance
LOW HIGH
Riskometer
This product is suitable for investors who are seeking*
� Long term capital growth
� Investments predominantly in JPMorgan Funds - ASEAN Equity Fund, an equity fund which invests primarily in companies of countries which are members of the Association of South East Asian Nations.
*Investors should consult their financial advisers if in doubt about whether the product is suitable for them.
Name of Instrument Exposure
Holdings
JPMorgan Funds - ASEAN Equity Fund 99.66%
CBLO/Repo 1.42%
Net Receivables/(Payables) (1.08%)
Grand Total 100.00%
24
Investors understand
that their principal will
be at high risk
Past performance may or may not be sustained in future and should not be used as a basis for comparison with other investments. * CAGR Return.
Notes:
1. Different plans shall have different expense structure. The performance details provided herein are of of Regular Plan Edelweiss Asean Equity Off-Shore Fund. Returns are for Growth Option only. Since Inception returns are calculated on Rs. 10/- invested at inception of the scheme. In case the start/end date is non business day, the NAV of previous day is used for computation.
2. The scheme is currently managed by Gautam Kaul (Managing this fund from May 2, 2017) and Rahul Dedhia (managing this fund from December 11, 2017). Please refer page no. 34 for name of the other schemes currently managed by the Fund Managers and relevant scheme for performance.
Inception Date 1-Jul-11
NAV (as on March 28, 2018)
Direct Plan Growth Option 21.8170
Regular Plan Growth Option 20.6230
Minimum Investment Amount
Rs. 5,000/- per application & in multiples of Re. 1/- thereof
Additional Investment Amount
Rs. 1,000/- per application & in multiples of Re. 1/-
thereof
Exit Load
� If the Units are redeemed / switched out on or before 12 months from the date of allotment - 1.00%
� If the Units are redeemed / switched out after 12 months from the date of allotment � Nil
Total Expense Ratios~:
Regular Plan 1.69%
Direct Plan 0.74%
~Does not include GST on Investment Management
fees.
Period
Since Inception - Edelweiss Asean Equity Off-Shore Fund
1 Year
3 Year
5 Year
Returns* Returns* Returns*
Additional Benchmark(Nifty 50 TR Index)
Benchmark(MSCI South East Asia Index)
Value of Rs. 10000 Invested
Value of Rs. 10000 Invested
Value of Rs. 10000 Invested
Scheme - Regular Plan
Asean Equity Off-Shore FundAn open ended fund of fund scheme investing in JPMorgan Funds � ASEAN Equity Fund
Fund Size
Month End AUM
Rs. 49.14 Crore
Monthly Average AUM
Rs. 50.23 Crore
21.93% 12,173 17.55% 11,739 11.86% 11,176
7.82% 12,528 2.71% 10,832 7.38% 12,378
6.16% 13,487 2.34% 11,225 13.63% 18,954
11.33% 20,623 6.17% 14,973 10.41% 19,507
Fund Managers Details
Fund Managers Experience Managing Since
Mr. Gautam Kaul 15 years 2-May-17
Mr. Rahul Dedhia 8 years 11-Dec-17
(As on 31st March, 2018)
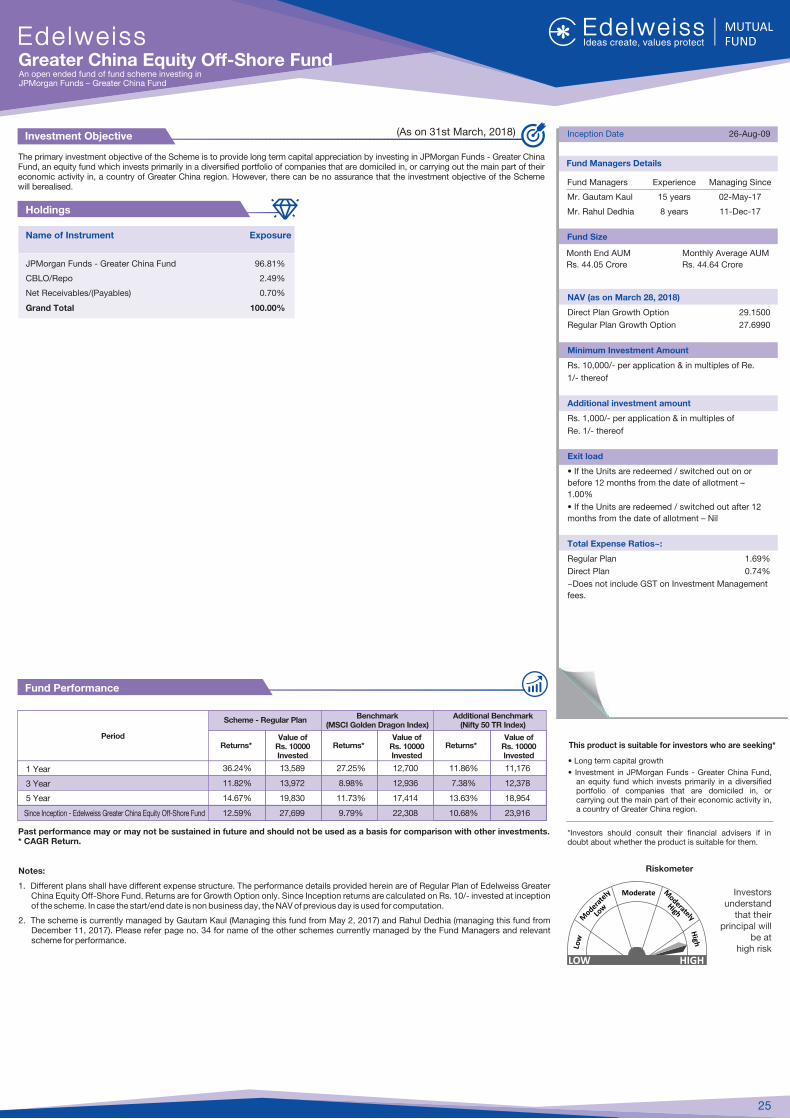
The primary investment objective of the Scheme is to provide long term capital appreciation by investing in JPMorgan Funds - Greater China Fund, an equity fund which invests primarily in a diversified portfolio of companies that are domiciled in, or carrying out the main part of their economic activity in, a country of Greater China region. However, there can be no assurance that the investment objective of the Scheme will berealised.
Investment Objective
Fund Performance
LOW HIGH
Riskometer
This product is suitable for investors who are seeking*
� Long term capital growth
� Investment in JPMorgan Funds - Greater China Fund, an equity fund which invests primarily in a diversified portfolio of companies that are domiciled in, or carrying out the main part of their economic activity in, a country of Greater China region.
*Investors should consult their financial advisers if in doubt about whether the product is suitable for them.
Name of Instrument Exposure
Holdings
JPMorgan Funds - Greater China Fund 96.81%
CBLO/Repo 2.49%
Net Receivables/(Payables) 0.70%
Grand Total 100.00%
Fund Managers Details
25
Investors understand
that their principal will
be at high risk
Past performance may or may not be sustained in future and should not be used as a basis for comparison with other investments. * CAGR Return.
Notes:
1. Different plans shall have different expense structure. The performance details provided herein are of of Regular Plan Edelweiss Greater China Equity Off-Shore Fund. Returns are for Growth Option only. Since Inception returns are calculated on Rs. 10/- invested at inception of the scheme. In case the start/end date is non business day, the NAV of previous day is used for computation.
2. The scheme is currently managed by Gautam Kaul (Managing this fund from May 2, 2017) and Rahul Dedhia (managing this fund from December 11, 2017). Please refer page no. 34 for name of the other schemes currently managed by the Fund Managers and relevant scheme for performance.
Inception Date 26-Aug-09
NAV (as on March 28, 2018)
Direct Plan Growth Option 29.1500
Regular Plan Growth Option 27.6990
Minimum Investment Amount
Rs. 10,000/- per application & in multiples of Re.
1/- thereof
Additional investment amount
Rs. 1,000/- per application & in multiples of
Re. 1/- thereof
Exit load
� If the Units are redeemed / switched out on or
before 12 months from the date of allotment �
1.00%
� If the Units are redeemed / switched out after 12
months from the date of allotment � Nil
Total Expense Ratios~:
Regular Plan 1.69%
Direct Plan 0.74%
~Does not include GST on Investment Management
fees.
Period
Since Inception - Edelweiss Greater China Equity Off-Shore Fund
1 Year
3 Year
5 Year
Returns* Returns* Returns*
Additional Benchmark(Nifty 50 TR Index)
Benchmark(MSCI Golden Dragon Index)
Value of Rs. 10000 Invested
Value of Rs. 10000 Invested
Value of Rs. 10000 Invested
Scheme - Regular Plan
Greater China Equity Off-Shore FundAn open ended fund of fund scheme investing in JPMorgan Funds � Greater China Fund
Fund Managers Experience Managing Since
Mr. Gautam Kaul 15 years 02-May-17
Mr. Rahul Dedhia 8 years 11-Dec-17
Fund Size
Month End AUM
Rs. 44.05 Crore
Monthly Average AUM
Rs. 44.64 Crore
36.24% 13,589 27.25% 12,700 11.86% 11,176
11.82% 13,972 8.98% 12,936 7.38% 12,378
14.67% 19,830 11.73% 17,414 13.63% 18,954
12.59% 27,699 9.79% 22,308 10.68% 23,916
(As on 31st March, 2018)

The primary investment objective of the Scheme is to seek to provide long term capital growth by investing predominantly in the JPMorgan Funds - Europe Dynamic Fund, an equity fund which invests primarily in an aggressively managed portfolio of European companies. However, there can be no assurance that the investment objective of the Scheme will be realized.
Investment Objective
Fund Performance
LOW HIGH
Riskometer
This product is suitable for investors who are seeking*
� Long term capital appreciation
� Investments predominantly in the JPMorgan Funds - Europe Dynamic Fund, an equity fund which invests primarily in an aggressively managed portfolio of European companies.
*Investors should consult their financial advisers if in doubt about whether the product is suitable for them.
Name of Instrument Exposure
Holdings
JP Morgan Funds- Europe Dynamic Fund 99.82%
CBLO/Repo 1.17%
Net Receivables/(Payables) (0.99%)
Grand Total 100.00%
26
Investors understand
that their principal will
be at high risk
Past performance may or may not be sustained in future and should not be used as a basis for comparison with other investments. * CAGR Return.
Notes:
1. Different plans shall have different expense structure. The performance details provided herein are of of Regular Plan Edelweiss Europe Dynamic Equity Off-Shore Fund. Returns are for Growth Option only. Since Inception returns are calculated on Rs. 10/- invested at inception of the scheme. In case the start/end date is non business day, the NAV of previous day is used for computation.
2. The scheme is currently managed by Gautam Kaul (Managing this fund from May 2, 2017) and Rahul Dedhia (managing this fund from December 11, 2017). Please refer page no. 34 for name of the other schemes currently managed by the Fund Managers and relevant scheme for performance.
3. Since the scheme is in existence for more than 1 year but less than 5 years hence performance data for 5 years and more is not provided
Inception Date 7-Feb-14
NAV (as on March 28, 2018)
Direct Plan Growth Option 11.4752
Regular Plan Growth Option 11.0335
Minimum Investment Amount
Rs. 5,000/- per application & in multiples of Re.
1/- thereafter
Additional investment amount
Rs. 1,000/- per application & in multiples of
Re. 1/- thereafter
Exit load
� If the Units are redeemed / switched out on or
before 12 months from the date of allotment �
1.00%
� If the Units are redeemed / switched out after 12
months from the date of allotment � Nil
Total Expense Ratios~:
Regular Plan 1.62%
Direct Plan 0.73%
~Does not include GST on Investment Management
fees.
Period
Since Inception - Edelweiss Europe Dynamic Equity Off-Shore Fund
1 Year
3 Year
5 Year
Returns* Returns* Returns*
Additional Benchmark(Nifty 50 TR Index)
Benchmark(MSCI Europe Index)
Value of Rs. 10000 Invested
Value of Rs. 10000 Invested
Value of Rs. 10000 Invested
Scheme - Regular Plan
Europe Dynamic Equity Off-Shore FundAn open ended fund of fund scheme investing in JPMorgan Funds � Europe Dynamic Fund
Fund Managers Details
Fund Managers Experience Managing Since
Mr. Gautam Kaul 15 years 02-May-17
Mr. Rahul Dedhia 8 years 11-Dec-17
Fund Size
Month End AUM
Rs. 20.49 Crore
Monthly Average AUM
Rs. 20.92 Crore
11.33% 11,123 12.02% 11,191 11.86% 11,176
3.69% 11,145 3.46% 11,073 7.38% 12,378
NA NA NA NA NA NA
2.41% 11,034 1.60% 10,681 14.58% 17,559
(As on 31st March, 2018)
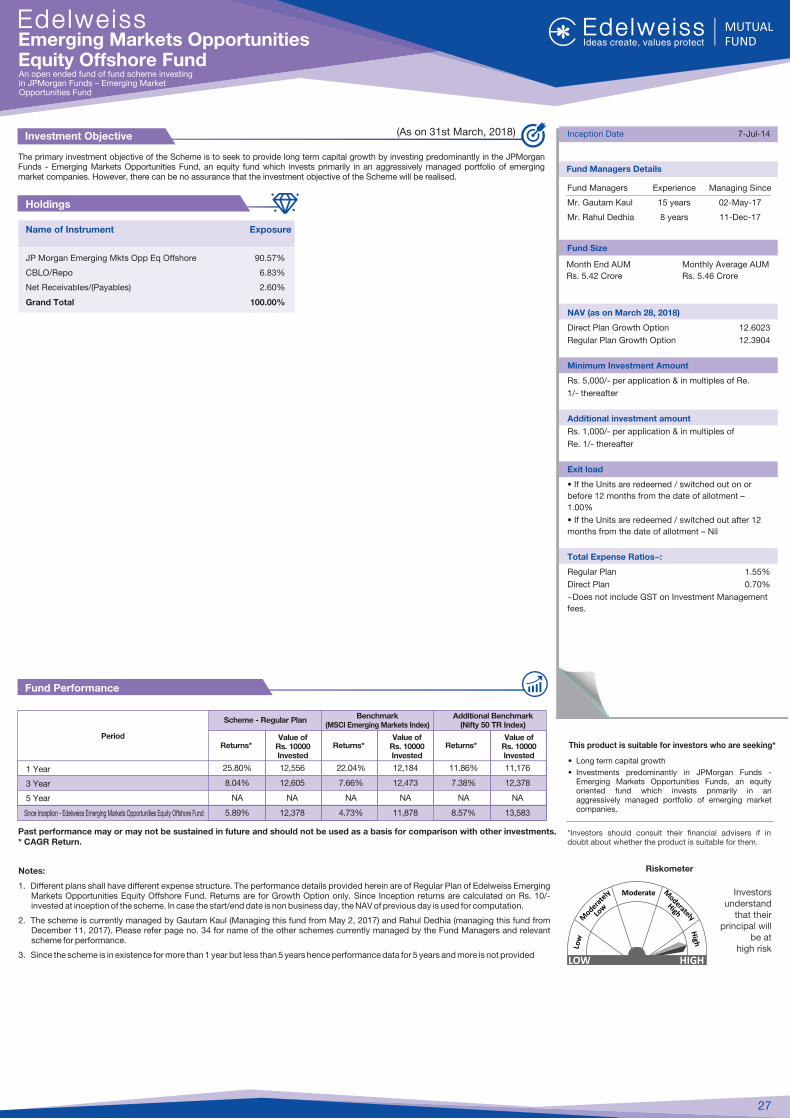
The primary investment objective of the Scheme is to seek to provide long term capital growth by investing predominantly in the JPMorgan Funds - Emerging Markets Opportunities Fund, an equity fund which invests primarily in an aggressively managed portfolio of emerging market companies. However, there can be no assurance that the investment objective of the Scheme will be realised.
Investment Objective
Fund Performance
LOW HIGH
Riskometer
This product is suitable for investors who are seeking*
� Long term capital growth
� Investments predominantly in JPMorgan Funds - Emerging Markets Opportunities Funds, an equity oriented fund which invests primarily in an aggressively managed portfolio of emerging market companies.
*Investors should consult their financial advisers if in doubt about whether the product is suitable for them.
Name of Instrument Exposure
Holdings
JP Morgan Emerging Mkts Opp Eq Offshore 90.57%
CBLO/Repo 6.83%
Net Receivables/(Payables) 2.60%
Grand Total 100.00%
27
Investors understand
that their principal will
be at high risk
Past performance may or may not be sustained in future and should not be used as a basis for comparison with other investments. * CAGR Return.
Notes:
1. Different plans shall have different expense structure. The performance details provided herein are of of Regular Plan Edelweiss Emerging Markets Opportunities Equity Offshore Fund. Returns are for Growth Option only. Since Inception returns are calculated on Rs. 10/- invested at inception of the scheme. In case the start/end date is non business day, the NAV of previous day is used for computation.
2. The scheme is currently managed by Gautam Kaul (Managing this fund from May 2, 2017) and Rahul Dedhia (managing this fund from December 11, 2017). Please refer page no. 34 for name of the other schemes currently managed by the Fund Managers and relevant scheme for performance.
3. Since the scheme is in existence for more than 1 year but less than 5 years hence performance data for 5 years and more is not provided
Inception Date 7-Jul-14
NAV (as on March 28, 2018)
Direct Plan Growth Option 12.6023
Regular Plan Growth Option 12.3904
Minimum Investment Amount
Rs. 5,000/- per application & in multiples of Re.
1/- thereafter
Additional investment amount
Rs. 1,000/- per application & in multiples of
Re. 1/- thereafter
Exit load
� If the Units are redeemed / switched out on or
before 12 months from the date of allotment �
1.00%
� If the Units are redeemed / switched out after 12
months from the date of allotment � Nil
Total Expense Ratios~:
Regular Plan 1.55%
Direct Plan 0.70%
~Does not include GST on Investment Management
fees.
Period
Since Inception - Edelweiss Emerging Markets Opportunities Equity Offshore Fund
1 Year
3 Year
5 Year
Returns* Returns* Returns*
Additional Benchmark(Nifty 50 TR Index)
Benchmark(MSCI Emerging Markets Index)
Value of Rs. 10000 Invested
Value of Rs. 10000 Invested
Value of Rs. 10000 Invested
Scheme - Regular Plan
Emerging Markets Opportunities Equity Offshore FundAn open ended fund of fund scheme investingin JPMorgan Funds � Emerging MarketOpportunities Fund
Fund Managers Details
Fund Managers Experience Managing Since
Mr. Gautam Kaul 15 years 02-May-17
Mr. Rahul Dedhia 8 years 11-Dec-17
Fund Size
Month End AUM
Rs. 5.42 Crore
Monthly Average AUM
Rs. 5.46 Crore
25.80% 12,556 22.04% 12,184 11.86% 11,176
8.04% 12,605 7.66% 12,473 7.38% 12,378
NA NA NA NA NA NA
5.89% 12,378 4.73% 11,878 8.57% 13,583
(As on 31st March, 2018)
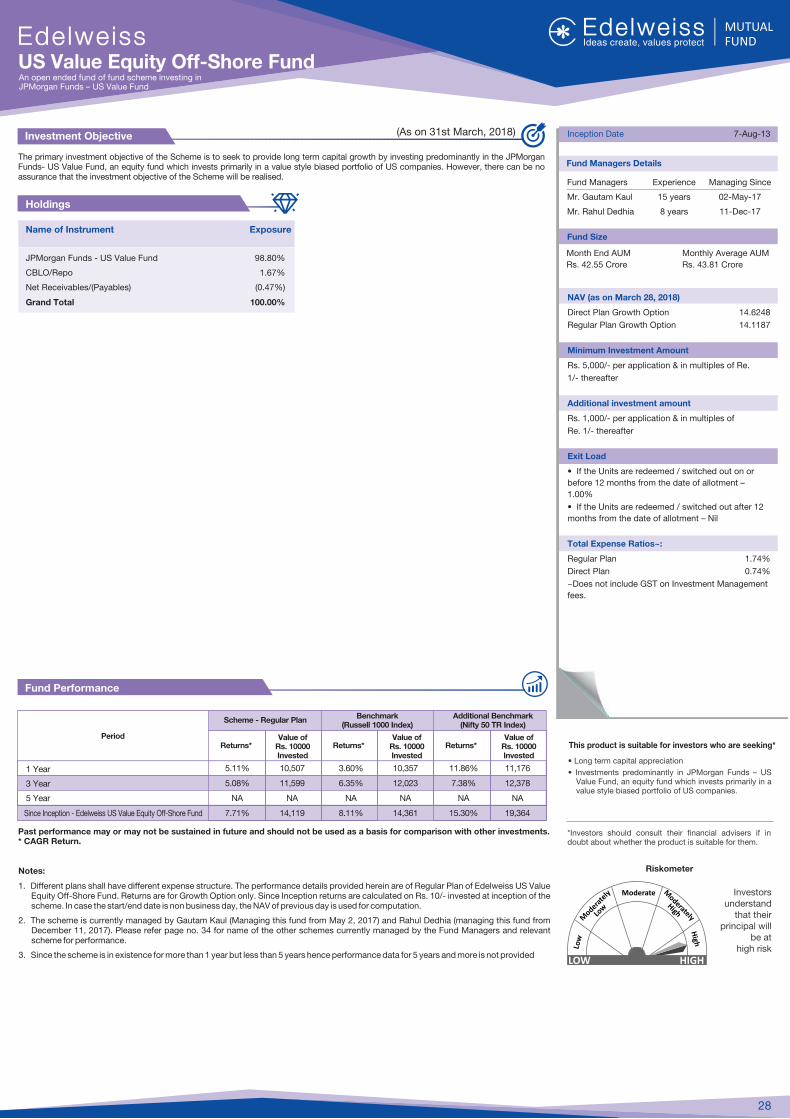
The primary investment objective of the Scheme is to seek to provide long term capital growth by investing predominantly in the JPMorgan Funds- US Value Fund, an equity fund which invests primarily in a value style biased portfolio of US companies. However, there can be no assurance that the investment objective of the Scheme will be realised.
Investment Objective
Fund Performance
LOW HIGH
Riskometer
This product is suitable for investors who are seeking*
� Long term capital appreciation
� Investments predominantly in JPMorgan Funds � US Value Fund, an equity fund which invests primarily in a value style biased portfolio of US companies.
*Investors should consult their financial advisers if in doubt about whether the product is suitable for them.
Name of Instrument Exposure
Holdings
JPMorgan Funds - US Value Fund 98.80%
CBLO/Repo 1.67%
Net Receivables/(Payables) (0.47%)
Grand Total 100.00%
Fund Managers Details
28
Investors understand
that their principal will
be at high risk
Past performance may or may not be sustained in future and should not be used as a basis for comparison with other investments. * CAGR Return.
Notes:
1. Different plans shall have different expense structure. The performance details provided herein are of Regular Plan of Edelweiss US Value Equity Off-Shore Fund. Returns are for Growth Option only. Since Inception returns are calculated on Rs. 10/- invested at inception of the scheme. In case the start/end date is non business day, the NAV of previous day is used for computation.
2. The scheme is currently managed by Gautam Kaul (Managing this fund from May 2, 2017) and Rahul Dedhia (managing this fund from December 11, 2017). Please refer page no. 34 for name of the other schemes currently managed by the Fund Managers and relevant scheme for performance.
3. Since the scheme is in existence for more than 1 year but less than 5 years hence performance data for 5 years and more is not provided
Inception Date 7-Aug-13
NAV (as on March 28, 2018)
Direct Plan Growth Option 14.6248
Regular Plan Growth Option 14.1187
Minimum Investment Amount
Rs. 5,000/- per application & in multiples of Re.
1/- thereafter
Additional investment amount
Rs. 1,000/- per application & in multiples of
Re. 1/- thereafter
Exit Load
� If the Units are redeemed / switched out on or
before 12 months from the date of allotment �
1.00%
� If the Units are redeemed / switched out after 12
months from the date of allotment � Nil
Total Expense Ratios~:
Regular Plan 1.74%
Direct Plan 0.74%
~Does not include GST on Investment Management
fees.
Period
Since Inception - Edelweiss US Value Equity Off-Shore Fund
1 Year
3 Year
5 Year
Returns* Returns* Returns*
Additional Benchmark(Nifty 50 TR Index)
Benchmark(Russell 1000 Index)
Value of Rs. 10000 Invested
Value of Rs. 10000 Invested
Value of Rs. 10000 Invested
Scheme - Regular Plan
US Value Equity Off-Shore FundAn open ended fund of fund scheme investing inJPMorgan Funds � US Value Fund
Fund Size
Month End AUM
Rs. 42.55 Crore
Monthly Average AUM
Rs. 43.81 Crore
5.11% 10,507 3.60% 10,357 11.86% 11,176
5.08% 11,599 6.35% 12,023 7.38% 12,378
NA NA NA NA NA NA
7.71% 14,119 8.11% 14,361 15.30% 19,364
Fund Managers Experience Managing Since
Mr. Gautam Kaul 15 years 02-May-17
Mr. Rahul Dedhia 8 years 11-Dec-17
(As on 31st March, 2018)
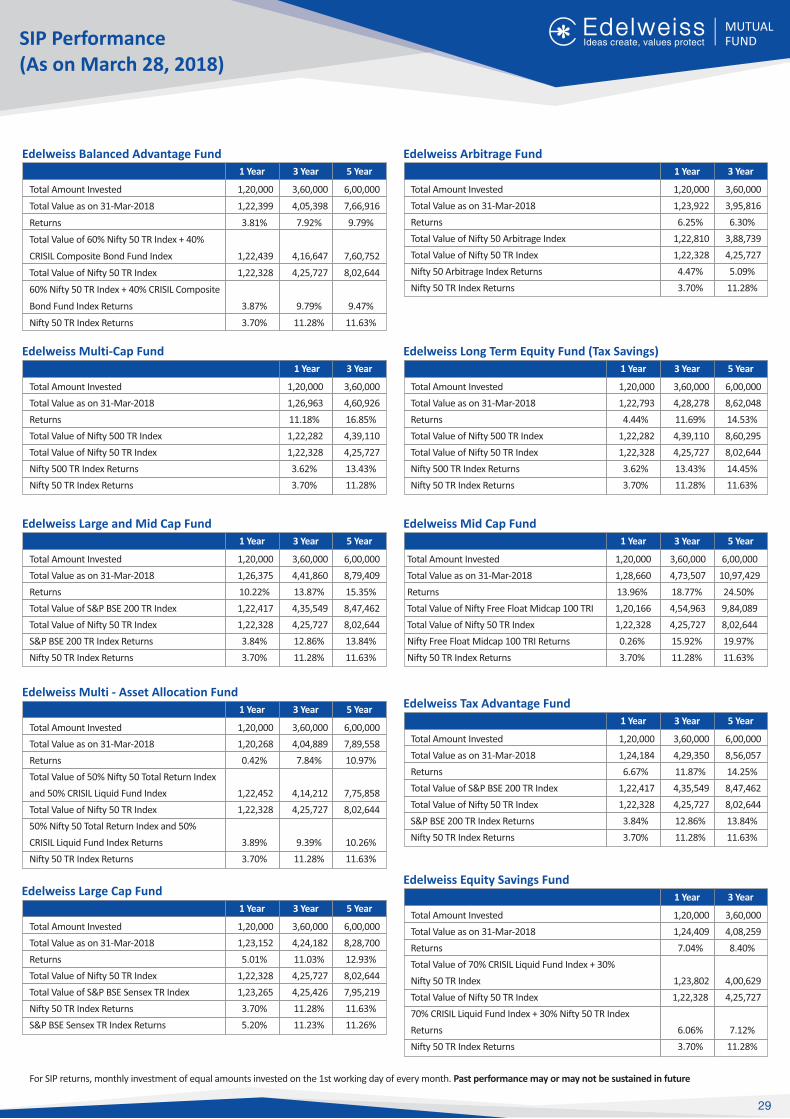
SIP Performance (As on March 28, 2018)
1 Year 3 Year 5 Year
Total Amount Invested 1,20,000 3,60,000 6,00,000
Total Value as on 31-Mar-2018 1,22,793 4,28,278 8,62,048
Returns 4.44% 11.69% 14.53%
Total Value of Nifty 500 TR Index 1,22,282 4,39,110 8,60,295
Total Value of Nifty 50 TR Index 1,22,328 4,25,727 8,02,644
Nifty 500 TR Index Returns 3.62% 13.43% 14.45%
Nifty 50 TR Index Returns 3.70% 11.28% 11.63%
Edelweiss Long Term Equity Fund (Tax Savings)
Edelweiss Balanced Advantage Fund
1 Year 3 Year 5 Year 1 Year 3 Year
Edelweiss Arbitrage Fund
Total Amount Invested 1,20,000 3,60,000
Total Value as on 31-Mar-2018 1,23,922 3,95,816
Returns 6.25% 6.30%
Total Value of Nifty 50 Arbitrage Index 1,22,810 3,88,739
Total Value of Nifty 50 TR Index 1,22,328 4,25,727
Nifty 50 Arbitrage Index Returns 4.47% 5.09%
Nifty 50 TR Index Returns 3.70% 11.28%
3 Year
Edelweiss Multi-Cap Fund
Total Amount Invested 1,20,000 3,60,000
Total Value as on 31-Mar-2018 1,26,963 4,60,926
Returns 11.18% 16.85%
Total Value of Nifty 500 TR Index 1,22,282 4,39,110
Total Value of Nifty 50 TR Index 1,22,328 4,25,727
Nifty 500 TR Index Returns 3.62% 13.43%
Nifty 50 TR Index Returns 3.70% 11.28%
1 Year
1 Year 3 Year 5 Year
Total Amount Invested 1,20,000 3,60,000 6,00,000
Total Value as on 31-Mar-2018 1,26,375 4,41,860 8,79,409
Returns 10.22% 13.87% 15.35%
Total Value of S&P BSE 200 TR Index 1,22,417 4,35,549 8,47,462
Total Value of Nifty 50 TR Index 1,22,328 4,25,727 8,02,644
S&P BSE 200 TR Index Returns 3.84% 12.86% 13.84%
Nifty 50 TR Index Returns 3.70% 11.28% 11.63%
Edelweiss Large and Mid Cap Fund
1 Year 3 Year 5 Year
Total Amount Invested 1,20,000 3,60,000 6,00,000
Total Value as on 31-Mar-2018 1,28,660 4,73,507 10,97,429
Returns 13.96% 18.77% 24.50%
Total Value of Nifty Free Float Midcap 100 TRI 1,20,166 4,54,963 9,84,089
Total Value of Nifty 50 TR Index 1,22,328 4,25,727 8,02,644
Nifty Free Float Midcap 100 TRI Returns 0.26% 15.92% 19.97%
Nifty 50 TR Index Returns 3.70% 11.28% 11.63%
Edelweiss Mid Cap Fund
1 Year 3 Year 5 Year
Total Amount Invested 1,20,000 3,60,000 6,00,000
Total Value as on 31-Mar-2018 1,20,268 4,04,889 7,89,558
Returns 0.42% 7.84% 10.97%
Total Value of 50% Nifty 50 Total Return Index
and 50% CRISIL Liquid Fund Index 1,22,452 4,14,212 7,75,858
Total Value of Nifty 50 TR Index 1,22,328 4,25,727 8,02,644
50% Nifty 50 Total Return Index and 50%
CRISIL Liquid Fund Index Returns 3.89% 9.39% 10.26%
Nifty 50 TR Index Returns 3.70% 11.28% 11.63%
Edelweiss Multi - Asset Allocation Fund
1 Year 3 Year 5 Year
Total Amount Invested 1,20,000 3,60,000 6,00,000
Total Value as on 31-Mar-2018 1,24,184 4,29,350 8,56,057
Returns 6.67% 11.87% 14.25%
Total Value of S&P BSE 200 TR Index 1,22,417 4,35,549 8,47,462
Total Value of Nifty 50 TR Index 1,22,328 4,25,727 8,02,644
S&P BSE 200 TR Index Returns 3.84% 12.86% 13.84%
Nifty 50 TR Index Returns 3.70% 11.28% 11.63%
Edelweiss Tax Advantage Fund
1 Year 3 Year 5 Year
Total Amount Invested 1,20,000 3,60,000 6,00,000
Total Value as on 31-Mar-2018 1,23,152 4,24,182 8,28,700
Returns 5.01% 11.03% 12.93%
Total Value of Nifty 50 TR Index 1,22,328 4,25,727 8,02,644
Total Value of S&P BSE Sensex TR Index 1,23,265 4,25,426 7,95,219
Nifty 50 TR Index Returns 3.70% 11.28% 11.63%
S&P BSE Sensex TR Index Returns 5.20% 11.23% 11.26%
Edelweiss Large Cap Fund1 Year 3 Year
Edelweiss Equity Savings Fund
Total Amount Invested 1,20,000 3,60,000
Total Value as on 31-Mar-2018 1,24,409 4,08,259
Returns 7.04% 8.40%
Total Value of 70% CRISIL Liquid Fund Index + 30%
Nifty 50 TR Index 1,23,802 4,00,629
Total Value of Nifty 50 TR Index 1,22,328 4,25,727
70% CRISIL Liquid Fund Index + 30% Nifty 50 TR Index
Returns 6.06% 7.12%
Nifty 50 TR Index Returns 3.70% 11.28%
Total Amount Invested 1,20,000 3,60,000 6,00,000
Total Value as on 31-Mar-2018 1,22,399 4,05,398 7,66,916
Returns 3.81% 7.92% 9.79%
Total Value of 60% Nifty 50 TR Index + 40%
CRISIL Composite Bond Fund Index 1,22,439 4,16,647 7,60,752
Total Value of Nifty 50 TR Index 1,22,328 4,25,727 8,02,644
60% Nifty 50 TR Index + 40% CRISIL Composite
Bond Fund Index Returns 3.87% 9.79% 9.47%
Nifty 50 TR Index Returns 3.70% 11.28% 11.63%
For SIP returns, monthly investment of equal amounts invested on the 1st working day of every month. Past performance may or may not be sustained in future
29
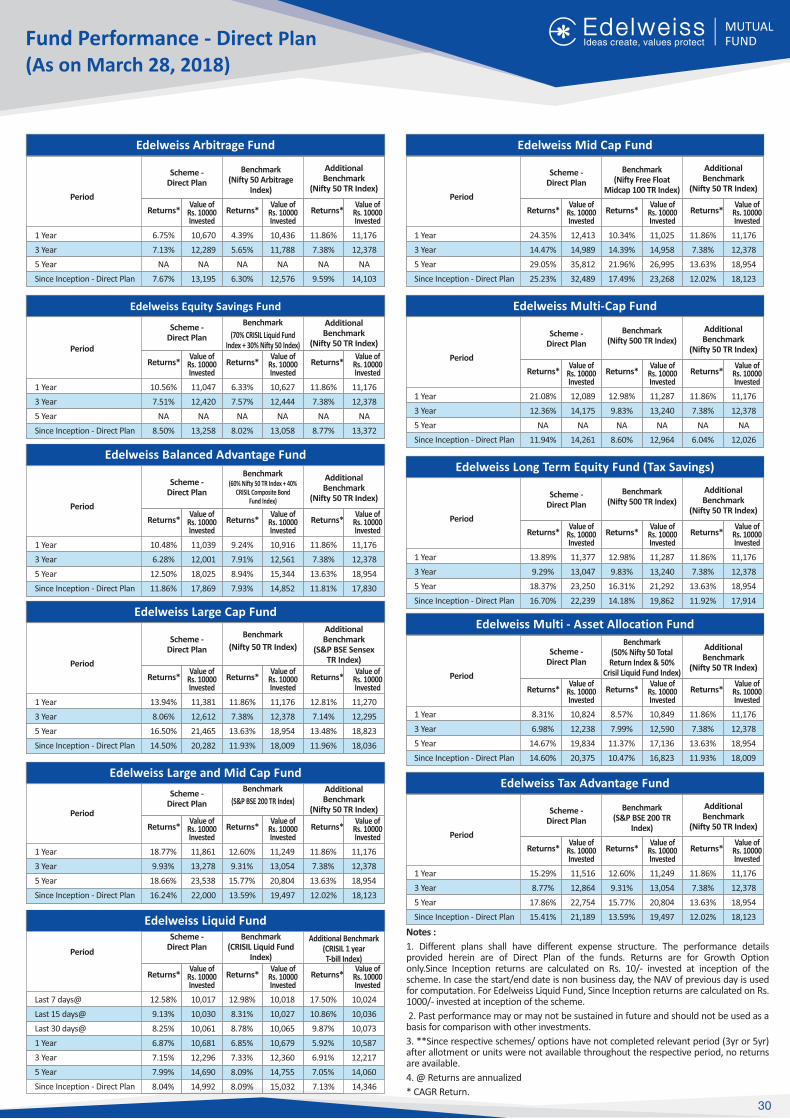
Fund Performance - Direct Plan (As on March 28, 2018)
Edelweiss Arbitrage Fund
Scheme - Direct Plan
Benchmark(Nifty 50 Arbitrage
Index)
Additional Benchmark
(Nifty 50 TR Index)Period
1 Year
3 Year
5 Year
Since Inception - Direct Plan
Returns* Returns*Value of
Rs. 10000 Invested
Value of Rs. 10000 Invested
Returns*Value of
Rs. 10000 Invested
6.75% 10,670 4.39% 10,436 11.86% 11,176
7.13% 12,289 5.65% 11,788 7.38% 12,378
NA NA NA NA NA NA
7.67% 13,195 6.30% 12,576 9.59% 14,103
Edelweiss Mid Cap Fund
Scheme - Direct Plan
Benchmark(Nifty Free Float
Midcap 100 TR Index)
Additional Benchmark
(Nifty 50 TR Index)Period
1 Year
3 Year
5 Year
Since Inception - Direct Plan
Returns* Returns*Value of
Rs. 10000 Invested
Value of Rs. 10000 Invested
Returns*Value of
Rs. 10000 Invested
24.35% 12,413 10.34% 11,025 11.86% 11,176
14.47% 14,989 14.39% 14,958 7.38% 12,378
29.05% 35,812 21.96% 26,995 13.63% 18,954
25.23% 32,489 17.49% 23,268 12.02% 18,123
Edelweiss Equity Savings Fund
Scheme - Direct Plan
Benchmark Additional Benchmark
(Nifty 50 TR Index)Period
1 Year
3 Year
5 Year
Since Inception - Direct Plan
Returns* Returns*Value of
Rs. 10000 Invested
Value of Rs. 10000 Invested
Returns*Value of
Rs. 10000 Invested
(70% CRISIL Liquid Fund Index + 30% Nifty 50 Index)
Edelweiss Balanced Advantage Fund
Scheme - Direct Plan
Benchmark Additional Benchmark
(Nifty 50 TR Index)Period
1 Year
3 Year
5 Year
Since Inception - Direct Plan
Returns* Returns*Value of
Rs. 10000 Invested
Value of Rs. 10000 Invested
Returns*Value of
Rs. 10000 Invested
(60% Nifty 50 TR Index + 40% CRISIL Composite Bond
Fund Index)
10.48% 11,039 9.24% 10,916 11.86% 11,176
6.28% 12,001 7.91% 12,561 7.38% 12,378
12.50% 18,025 8.94% 15,344 13.63% 18,954
11.86% 17,869 7.93% 14,852 11.81% 17,830
Edelweiss Large Cap Fund
Scheme - Direct Plan
BenchmarkAdditional Benchmark
(S&P BSE Sensex TR Index)Period
1 Year
3 Year
5 Year
Since Inception - Direct Plan
Returns* Returns*Value of
Rs. 10000 Invested
Value of Rs. 10000 Invested
Returns*Value of
Rs. 10000 Invested
(Nifty 50 TR Index)
13.94% 11,381 11.86% 11,176 12.81% 11,270
8.06% 12,612 7.38% 12,378 7.14% 12,295
16.50% 21,465 13.63% 18,954 13.48% 18,823
14.50% 20,282 11.93% 18,009 11.96% 18,036
Edelweiss Large and Mid Cap Fund
Period
1 Year
3 Year
5 Year
Since Inception - Direct Plan
Returns* Returns*Value of
Rs. 10000 Invested
Value of Rs. 10000 Invested
Returns*Value of
Rs. 10000 Invested
Edelweiss Multi-Cap Fund
Scheme - Direct Plan
Benchmark(Nifty 500 TR Index)
Additional Benchmark
(Nifty 50 TR Index)Period
1 Year
3 Year
5 Year
Since Inception - Direct Plan
Returns* Returns*Value of
Rs. 10000 Invested
Value of Rs. 10000 Invested
Returns*Value of
Rs. 10000 Invested
21.08% 12,089 12.98% 11,287 11.86% 11,176
12.36% 14,175 9.83% 13,240 7.38% 12,378
NA NA NA NA NA NA
11.94% 14,261 8.60% 12,964 6.04% 12,026
Edelweiss Long Term Equity Fund (Tax Savings)
Scheme - Direct Plan
Benchmark(Nifty 500 TR Index)
Additional Benchmark
(Nifty 50 TR Index)Period
1 Year
3 Year
5 Year
Since Inception - Direct Plan
Returns* Returns*Value of
Rs. 10000 Invested
Value of Rs. 10000 Invested
Returns*Value of
Rs. 10000 Invested
Edelweiss Multi - Asset Allocation Fund
Scheme - Direct Plan
Benchmark(50% Nifty 50 Total Return Index & 50%
Crisil Liquid Fund Index)
Additional Benchmark
(Nifty 50 TR Index)Period
1 Year
3 Year
5 Year
Since Inception - Direct Plan
Returns* Returns*Value of
Rs. 10000 Invested
Value of Rs. 10000 Invested
Returns*Value of
Rs. 10000 Invested
Edelweiss Tax Advantage Fund
Scheme - Direct Plan
Benchmark(S&P BSE 200 TR
Index)
Additional Benchmark
(Nifty 50 TR Index)Period
1 Year
3 Year
5 Year
Since Inception - Direct Plan
Returns* Returns*Value of
Rs. 10000 Invested
Value of Rs. 10000 Invested
Returns*Value of
Rs. 10000 Invested
Edelweiss Liquid FundScheme -
Direct PlanBenchmark
(CRISIL Liquid Fund Index)
Additional Benchmark(CRISIL 1 year T-bill Index)
Period
Returns* Returns*Value of
Rs. 10000 Invested
Value of Rs. 10000 Invested
Returns*Value of
Rs. 10000 Invested
Scheme - Direct Plan
Benchmark Additional Benchmark
(Nifty 50 TR Index)(S&P BSE 200 TR Index)
Last 7 days@
Last 15 days@
Last 30 days@
1 Year
3 Year
5 Year
Since Inception - Direct Plan
Notes :
1. Different plans shall have different expense structure. The performance details provided herein are of Direct Plan of the funds. Returns are for Growth Option only.Since Inception returns are calculated on Rs. 10/- invested at inception of the scheme. In case the start/end date is non business day, the NAV of previous day is used for computation. For Edelweiss Liquid Fund, Since Inception returns are calculated on Rs. 1000/- invested at inception of the scheme.
2. Past performance may or may not be sustained in future and should not be used as a basis for comparison with other investments.
3. **Since respective schemes/ options have not completed relevant period (3yr or 5yr) after allotment or units were not available throughout the respective period, no returns are available.
4. @ Returns are annualized
* CAGR Return.
10.56% 11,047 6.33% 10,627 11.86% 11,176
7.51% 12,420 7.57% 12,444 7.38% 12,378
NA NA NA NA NA NA
8.50% 13,258 8.02% 13,058 8.77% 13,372
13.89% 11,377 12.98% 11,287 11.86% 11,176
9.29% 13,047 9.83% 13,240 7.38% 12,378
18.37% 23,250 16.31% 21,292 13.63% 18,954
16.70% 22,239 14.18% 19,862 11.92% 17,914
8.31% 10,824 8.57% 10,849 11.86% 11,176
6.98% 12,238 7.99% 12,590 7.38% 12,378
14.67% 19,834 11.37% 17,136 13.63% 18,954
14.60% 20,375 10.47% 16,823 11.93% 18,009
18.77% 11,861 12.60% 11,249 11.86% 11,176
9.93% 13,278 9.31% 13,054 7.38% 12,378
18.66% 23,538 15.77% 20,804 13.63% 18,954
16.24% 22,000 13.59% 19,497 12.02% 18,123
15.29% 11,516 12.60% 11,249 11.86% 11,176
8.77% 12,864 9.31% 13,054 7.38% 12,378
17.86% 22,754 15.77% 20,804 13.63% 18,954
15.41% 21,189 13.59% 19,497 12.02% 18,123
12.58% 10,017 12.98% 10,018 17.50% 10,024
9.13% 10,030 8.31% 10,027 10.86% 10,036
8.25% 10,061 8.78% 10,065 9.87% 10,073
6.87% 10,681 6.85% 10,679 5.92% 10,587
7.15% 12,296 7.33% 12,360 6.91% 12,217
7.99% 14,690 8.09% 14,755 7.05% 14,060
8.04% 14,992 8.09% 15,032 7.13% 14,346
30
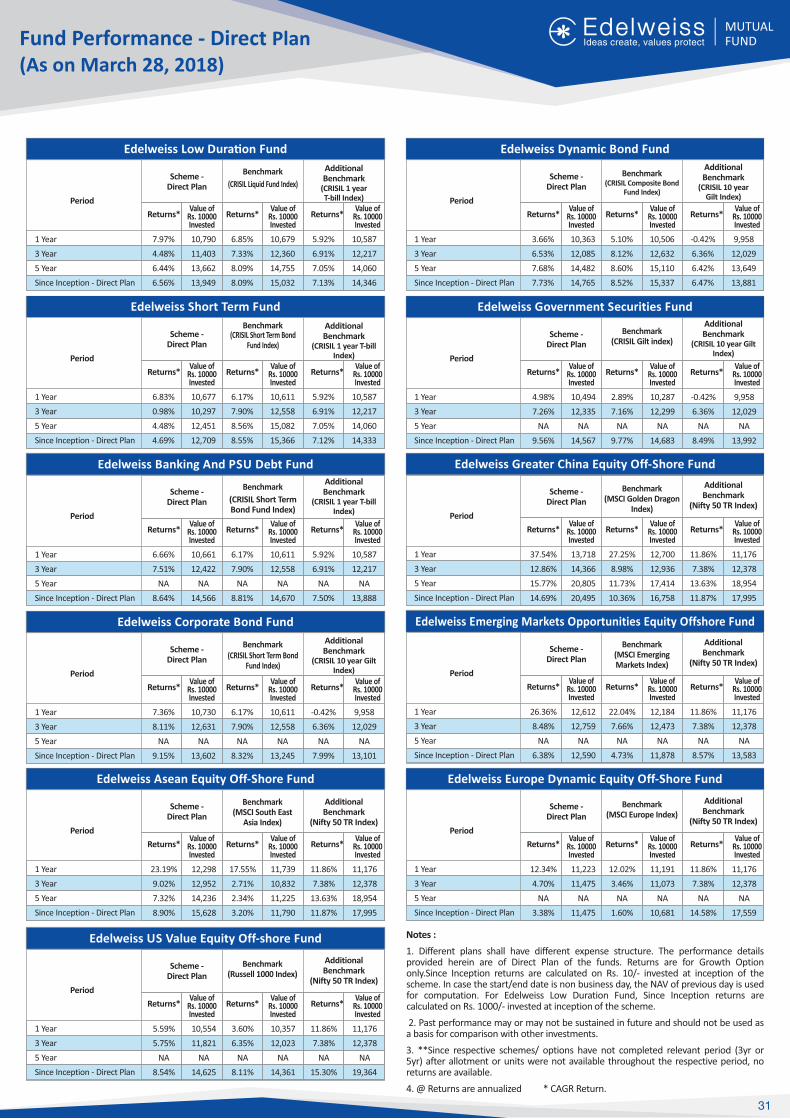
Edelweiss Low Dura�on Fund
Scheme - Direct Plan
Benchmark Additional Benchmark
(CRISIL 1 year T-bill Index)Period
1 Year
3 Year
5 Year
Since Inception - Direct Plan
Returns* Returns*Value of
Rs. 10000 Invested
Value of Rs. 10000 Invested
Returns*Value of
Rs. 10000 Invested
(CRISIL Liquid Fund Index)
7.97% 10,790 6.85% 10,679 5.92% 10,587
4.48% 11,403 7.33% 12,360 6.91% 12,217
6.44% 13,662 8.09% 14,755 7.05% 14,060
6.56% 13,949 8.09% 15,032 7.13% 14,346
Edelweiss Short Term Fund
Scheme - Direct Plan
Benchmark Additional Benchmark
(CRISIL 1 year T-bill Index)Period
1 Year
3 Year
5 Year
Since Inception - Direct Plan
Returns* Returns*Value of
Rs. 10000 Invested
6.83% 10,677 6.17% 10,611 5.92% 10,587
0.98% 10,297 7.90% 12,558 6.91% 12,217
4.48% 12,451 8.56% 15,082 7.05% 14,060
4.69% 12,709 8.55% 15,366 7.12% 14,333
Value of Rs. 10000 Invested
Returns*Value of
Rs. 10000 Invested
(CRISIL Short Term Bond Fund Index)
Edelweiss Banking And PSU Debt Fund
Scheme - Direct Plan
BenchmarkAdditional Benchmark
(CRISIL 1 year T-bill Index)
Period
1 Year
3 Year
5 Year
Since Inception - Direct Plan
Returns* Returns*Value of
Rs. 10000 Invested
Value of Rs. 10000 Invested
Returns*Value of
Rs. 10000 Invested
(CRISIL Short Term Bond Fund Index)
6.66% 10,661 6.17% 10,611 5.92% 10,587
7.51% 12,422 7.90% 12,558 6.91% 12,217
NA NA NA NA NA NA
8.64% 14,566 8.81% 14,670 7.50% 13,888
Edelweiss Corporate Bond Fund
Scheme - Direct Plan
Benchmark Additional Benchmark
(CRISIL 10 year Gilt Index)Period
1 Year
3 Year
5 Year
Since Inception - Direct Plan
Returns* Returns*Value of
Rs. 10000 Invested
Value of Rs. 10000 Invested
Returns*Value of
Rs. 10000 Invested
(CRISIL Short Term Bond Fund Index)
7.36% 10,730 6.17% 10,611 -0.42% 9,958
8.11% 12,631 7.90% 12,558 6.36% 12,029
NA NA NA NA NA NA
9.15% 13,602 8.32% 13,245 7.99% 13,101
Edelweiss Government Securities Fund
Scheme - Direct Plan
Benchmark(CRISIL Gilt index)
Additional Benchmark
(CRISIL 10 year Gilt Index)
Period
1 Year
3 Year
5 Year
Since Inception - Direct Plan
Returns* Returns*Value of
Rs. 10000 Invested
Value of Rs. 10000 Invested
Returns*Value of
Rs. 10000 Invested
4.98% 10,494 2.89% 10,287 -0.42% 9,958
7.26% 12,335 7.16% 12,299 6.36% 12,029
NA NA NA NA NA NA
9.56% 14,567 9.77% 14,683 8.49% 13,992
Fund Performance - Direct Plan (As on March 28, 2018)
Notes :
1. Different plans shall have different expense structure. The performance details provided herein are of Direct Plan of the funds. Returns are for Growth Option only.Since Inception returns are calculated on Rs. 10/- invested at inception of the scheme. In case the start/end date is non business day, the NAV of previous day is used for computation. For Edelweiss Low Duration Fund, Since Inception returns are calculated on Rs. 1000/- invested at inception of the scheme.
2. Past performance may or may not be sustained in future and should not be used as a basis for comparison with other investments.
3. **Since respective schemes/ options have not completed relevant period (3yr or 5yr) after allotment or units were not available throughout the respective period, no returns are available.
4. @ Returns are annualized * CAGR Return.
Edelweiss Dynamic Bond Fund
Scheme - Direct Plan
Benchmark(CRISIL Composite Bond
Fund Index)
Additional Benchmark
(CRISIL 10 year Gilt Index)Period
1 Year
3 Year
5 Year
Since Inception - Direct Plan
Returns* Returns*Value of
Rs. 10000 Invested
Value of Rs. 10000 Invested
Returns*Value of
Rs. 10000 Invested
3.66% 10,363 5.10% 10,506 -0.42% 9,958
6.53% 12,085 8.12% 12,632 6.36% 12,029
7.68% 14,482 8.60% 15,110 6.42% 13,649
7.73% 14,765 8.52% 15,337 6.47% 13,881
Edelweiss Greater China Equity Off-Shore Fund
Scheme - Direct Plan
Benchmark(MSCI Golden Dragon
Index)
Additional Benchmark
(Nifty 50 TR Index)Period
1 Year
3 Year
5 Year
Since Inception - Direct Plan
Returns* Returns*Value of
Rs. 10000 Invested
Value of Rs. 10000 Invested
Returns*Value of
Rs. 10000 Invested
37.54% 13,718 27.25% 12,700 11.86% 11,176
12.86% 14,366 8.98% 12,936 7.38% 12,378
15.77% 20,805 11.73% 17,414 13.63% 18,954
14.69% 20,495 10.36% 16,758 11.87% 17,995
Edelweiss Emerging Markets Opportunities Equity Offshore Fund
Scheme - Direct Plan
Benchmark(MSCI Emerging Markets Index)
Additional Benchmark
(Nifty 50 TR Index)Period
1 Year
3 Year
5 Year
Since Inception - Direct Plan
Returns* Returns*Value of
Rs. 10000 Invested
Value of Rs. 10000 Invested
Returns*Value of
Rs. 10000 Invested
26.36% 12,612 22.04% 12,184 11.86% 11,176
8.48% 12,759 7.66% 12,473 7.38% 12,378
NA NA NA NA NA NA
6.38% 12,590 4.73% 11,878 8.57% 13,583
Edelweiss Europe Dynamic Equity Off-Shore Fund
Scheme - Direct Plan
Benchmark(MSCI Europe Index)
Additional Benchmark
(Nifty 50 TR Index)Period
1 Year
3 Year
5 Year
Since Inception - Direct Plan
Returns* Returns*Value of
Rs. 10000 Invested
Value of Rs. 10000 Invested
Returns*Value of
Rs. 10000 Invested
12.34% 11,223 12.02% 11,191 11.86% 11,176
4.70% 11,475 3.46% 11,073 7.38% 12,378
NA NA NA NA NA NA
3.38% 11,475 1.60% 10,681 14.58% 17,559
Edelweiss Asean Equity Off-Shore Fund
Scheme - Direct Plan
Benchmark(MSCI South East
Asia Index)
Additional Benchmark
(Nifty 50 TR Index)Period
1 Year
3 Year
5 Year
Since Inception - Direct Plan
Returns* Returns*Value of
Rs. 10000 Invested
Value of Rs. 10000 Invested
Returns*Value of
Rs. 10000 Invested
23.19% 12,298 17.55% 11,739 11.86% 11,176
9.02% 12,952 2.71% 10,832 7.38% 12,378
7.32% 14,236 2.34% 11,225 13.63% 18,954
8.90% 15,628 3.20% 11,790 11.87% 17,995
31
Edelweiss US Value Equity Off-shore Fund
Scheme - Direct Plan
Benchmark(Russell 1000 Index)
Additional Benchmark
(Nifty 50 TR Index)Period
1 Year
3 Year
5 Year
Since Inception - Direct Plan
Returns* Returns*Value of
Rs. 10000 Invested
Value of Rs. 10000 Invested
Returns*Value of
Rs. 10000 Invested
5.59% 10,554 3.60% 10,357 11.86% 11,176
5.75% 11,821 6.35% 12,023 7.38% 12,378
NA NA NA NA NA NA
8.54% 14,625 8.11% 14,361 15.30% 19,364
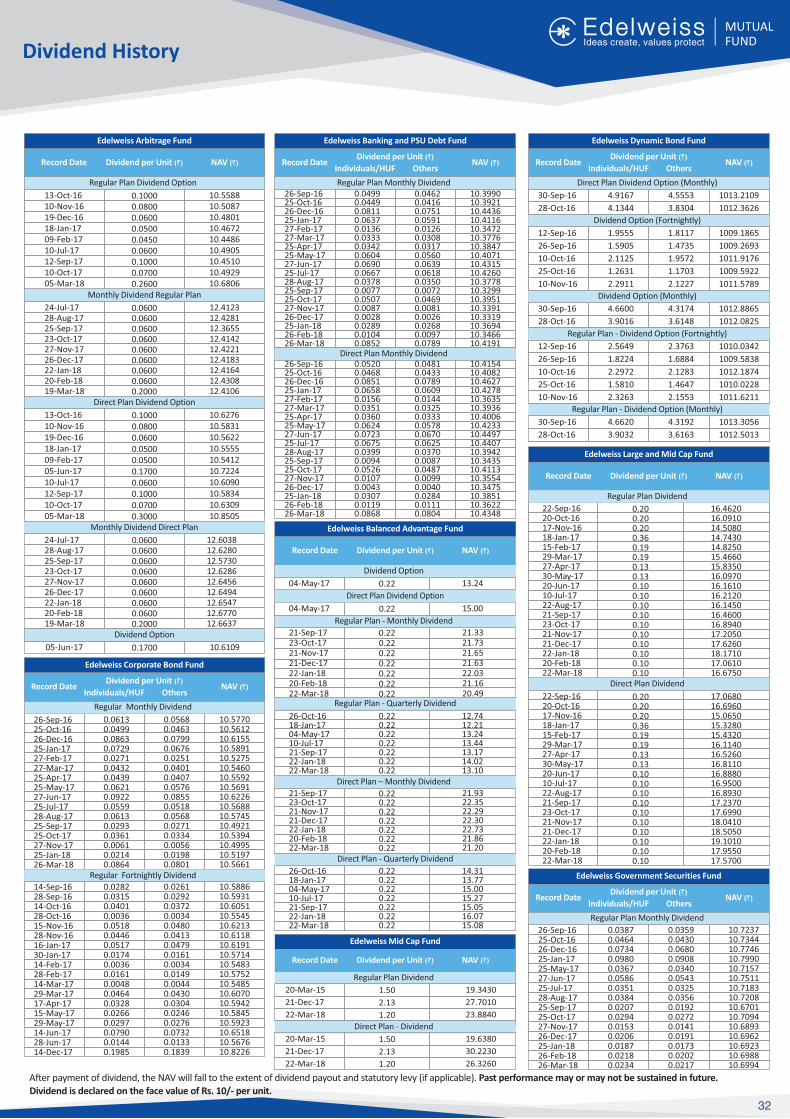
Edelweiss Dynamic Bond Fund
Direct Plan Dividend Option (Monthly)
Record Date NAV (`)Dividend per Unit (`)
Individuals/HUF Others
1013.2109
1012.3626
4.5553
3.8304
4.9167
4.1344
30-Sep-16
28-Oct-16
Record Date NAV (`)Dividend per Unit (`)
04-May-17 0.22 15.00
Direct Plan Dividend Option
Dividend Option
04-May-17 0.22 13.24
Regular Plan - Monthly Dividend
21-Sep-1723-Oct-1721-Nov-1721-Dec-1722-Jan-1820-Feb-1822-Mar-18
0.220.220.220.220.220.220.22
21.3321.7321.6521.6322.0321.1620.49
Dividend History
Edelweiss Arbitrage Fund
Regular Plan Dividend Option
Monthly Dividend Regular Plan
Direct Plan Dividend Option
Monthly Dividend Direct Plan
Dividend Option
05-Jun-17 10.6109
Edelweiss Balanced Advantage Fund
Direct Plan Dividend
Regular Plan Dividend
Edelweiss Large and Mid Cap Fund
Record Date NAV (`)Dividend per Unit (`)
13-Oct-1610-Nov-1619-Dec-1618-Jan-1709-Feb-1710-Jul-1712-Sep-1710-Oct-1705-Mar-18
0.10000.08000.06000.05000.04500.06000.10000.07000.2600
10.558810.508710.480110.467210.448610.490510.451010.492910.6806
0.10000.08000.06000.05000.05000.17000.06000.10000.07000.3000
24-Jul-1728-Aug-1725-Sep-1723-Oct-1727-Nov-1726-Dec-1722-Jan-1820-Feb-1819-Mar-18
0.06000.06000.06000.06000.06000.06000.06000.06000.2000
10.627610.583110.562210.555510.541210.722410.609010.583410.630910.8505
12.412312.428112.365512.414212.422112.418312.416412.430812.4106
0.1700
Edelweiss Banking and PSU Debt Fund
Regular Plan Monthly Dividend
Record Date NAV (`)Dividend per Unit (`)
Individuals/HUF Others
Direct Plan Monthly Dividend
Record Date NAV (`)Dividend per Unit (`)
Edelweiss Government Securities Fund
Regular Plan Monthly Dividend
Record Date NAV (`)Dividend per Unit (`)
Individuals/HUF Others
Dividend Option (Fortnightly)
1009.1865
1009.2693
1011.9176
1009.5922
1011.5789
1.8117
1.4735
1.9572
1.1703
2.1227
1.9555
1.5905
2.1125
1.2631
2.2911
12-Sep-16
26-Sep-16
10-Oct-16
25-Oct-16
10-Nov-16
Dividend Option (Monthly)
1012.8865
1012.0825
4.3174
3.6148
4.6600
3.9016
30-Sep-16
28-Oct-16
Regular Plan - Dividend Option (Fortnightly)
1010.0342
1009.5838
1012.1874
1010.0228
1011.6211
2.3763
1.6884
2.1283
1.4647
2.1553
2.5649
1.8224
2.2972
1.5810
2.3263
12-Sep-16
26-Sep-16
10-Oct-16
25-Oct-16
10-Nov-16
Regular Plan - Dividend Option (Monthly)
1013.3056
1012.5013
4.3192
3.6163
4.6620
3.9032
30-Sep-16
28-Oct-16
Edelweiss Corporate Bond Fund
Regular Monthly Dividend
Record Date NAV (`)Dividend per Unit (`)
Individuals/HUF Others
10.577010.561210.615510.589110.527510.546010.559210.569110.622610.568810.574510.492110.539410.499510.519710.5661
0.05680.04630.07990.06760.02510.04010.04070.05760.08550.05180.05680.02710.03340.00560.01980.0801
0.06130.04990.08630.07290.02710.04320.04390.06210.09220.05590.06130.02930.03610.00610.02140.0864
26-Sep-1625-Oct-1626-Dec-1625-Jan-1727-Feb-1727-Mar-1725-Apr-1725-May-1727-Jun-1725-Jul-1728-Aug-1725-Sep-1725-Oct-1727-Nov-1725-Jan-1826-Mar-18
Regular Fortnightly Dividend
10.399010.392110.443610.411610.347210.377610.384710.407110.431510.426010.377810.329910.395110.339110.331910.369410.346610.4191
0.04620.04160.07510.05910.01260.03080.03170.05600.06390.06180.03500.00720.04690.00810.00260.02680.00970.0789
0.04990.04490.08110.06370.01360.03330.03420.06040.06900.06670.03780.00770.05070.00870.00280.02890.01040.0852
26-Sep-1625-Oct-1626-Dec-1625-Jan-1727-Feb-1727-Mar-1725-Apr-1725-May-1727-Jun-1725-Jul-1728-Aug-1725-Sep-1725-Oct-1727-Nov-1726-Dec-1725-Jan-1826-Feb-1826-Mar-18
10.415410.408210.462710.427810.363510.393610.400610.423310.449710.440710.394210.343510.411310.355410.347510.385110.362210.4348
0.04810.04330.07890.06090.01440.03250.03330.05780.06700.06250.03700.00870.04870.00990.00400.02840.01110.0804
0.05200.04680.08510.06580.01560.03510.03600.06240.07230.06750.03990.00940.05260.01070.00430.03070.01190.0868
26-Sep-1625-Oct-1626-Dec-1625-Jan-1727-Feb-1727-Mar-1725-Apr-1725-May-1727-Jun-1725-Jul-1728-Aug-1725-Sep-1725-Oct-1727-Nov-1726-Dec-1725-Jan-1826-Feb-1826-Mar-18
Direct Plan – Monthly Dividend
Direct Plan - Quarterly Dividend
22-Sep-1620-Oct-1617-Nov-1618-Jan-1715-Feb-1729-Mar-1727-Apr-1730-May-1720-Jun-1710-Jul-1722-Aug-1721-Sep-1723-Oct-1721-Nov-1721-Dec-1722-Jan-1820-Feb-1822-Mar-18
0.200.200.200.360.190.190.130.130.100.100.100.100.100.100.100.100.100.10
16.462016.091014.508014.743014.825015.466015.835016.097016.161016.212016.145016.460016.894017.205017.626018.171017.061016.6750
32
After payment of dividend, the NAV will fall to the extent of dividend payout and statutory levy (if applicable). Past performance may or may not be sustained in future.Dividend is declared on the face value of Rs. 10/- per unit.
Regular Plan - Quarterly Dividend
Edelweiss Mid Cap Fund
Direct Plan - Dividend
20-Mar-15
21-Dec-17
22-Mar-18
1.50
2.13
1.20
19.6380
30.2230
26.3260
Regular Plan Dividend
20-Mar-15
21-Dec-17
22-Mar-18
1.50
2.13
1.20
19.3430
27.7010
23.8840
Record Date NAV (`)Dividend per Unit (`)
10.588610.593110.605110.554510.621310.611810.619110.571410.548310.575210.548510.607010.594210.584510.592310.651810.567610.8226
0.02610.02920.03720.00340.04800.04130.04790.01610.00340.01490.00440.04300.03040.02460.02760.07320.01330.1839
0.02820.03150.04010.00360.05180.04460.05170.01740.00360.01610.00480.04640.03280.02660.02970.07900.01440.1985
14-Sep-1628-Sep-1614-Oct-1628-Oct-1615-Nov-1628-Nov-1616-Jan-1730-Jan-1714-Feb-1728-Feb-1714-Mar-1729-Mar-1717-Apr-1715-May-1729-May-1714-Jun-1728-Jun-1714-Dec-17
22-Sep-1620-Oct-1617-Nov-1618-Jan-1715-Feb-1729-Mar-1727-Apr-1730-May-1720-Jun-1710-Jul-1722-Aug-1721-Sep-1723-Oct-1721-Nov-1721-Dec-1722-Jan-1820-Feb-1822-Mar-18
0.200.200.200.360.190.190.130.130.100.100.100.100.100.100.100.100.100.10
17.068016.696015.065015.328015.432016.114016.526016.811016.888016.950016.893017.237017.699018.041018.505019.101017.955017.5700
13-Oct-1610-Nov-1619-Dec-1618-Jan-1709-Feb-1705-Jun-1710-Jul-1712-Sep-1710-Oct-1705-Mar-18
24-Jul-1728-Aug-1725-Sep-1723-Oct-1727-Nov-1726-Dec-1722-Jan-1820-Feb-1819-Mar-18
0.06000.06000.06000.06000.06000.06000.06000.06000.2000
12.603812.628012.573012.628612.645612.649412.654712.677012.6637
26-Oct-1618-Jan-1704-May-1710-Jul-1721-Sep-1722-Jan-1822-Mar-18
0.220.220.220.220.220.220.22
14.3113.7715.0015.2715.0516.0715.08
21-Sep-1723-Oct-1721-Nov-1721-Dec-1722-Jan-1820-Feb-1822-Mar-18
0.220.220.220.220.220.220.22
21.9322.3522.2922.3022.7321.8621.20
10.723710.734410.774610.799010.715710.751110.718310.720810.670110.709410.689310.696210.692310.698810.6994
0.03590.04300.06800.09080.03400.05430.03250.03560.01920.02720.01410.01910.01730.02020.0217
0.03870.04640.07340.09800.03670.05860.03510.03840.02070.02940.01530.02060.01870.02180.0234
26-Sep-1625-Oct-1626-Dec-1625-Jan-1725-May-1727-Jun-1725-Jul-1728-Aug-1725-Sep-1725-Oct-1727-Nov-1726-Dec-1725-Jan-1826-Feb-1826-Mar-18
26-Oct-1618-Jan-1704-May-1710-Jul-1721-Sep-1722-Jan-1822-Mar-18
0.220.220.220.220.220.220.22
12.7412.2113.2413.4413.1714.0213.10
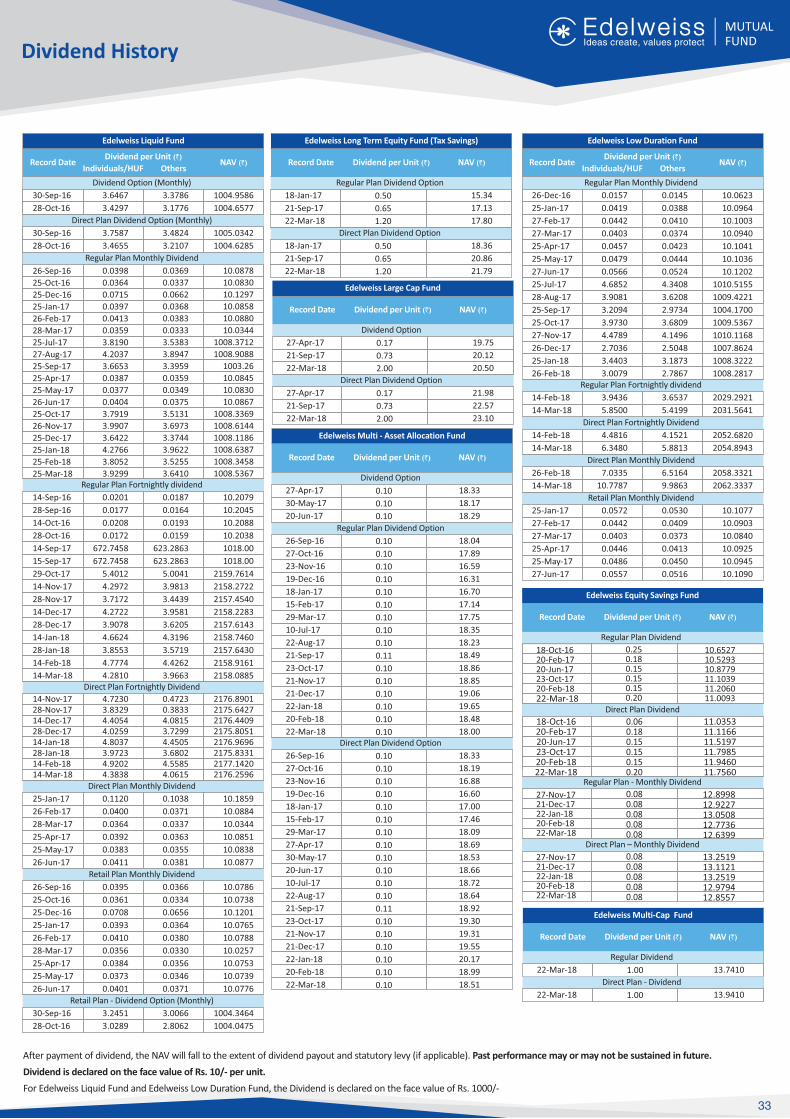
Retail Plan Monthly Dividend
10.1077
10.0903
10.0840
10.0925
10.0945
10.1090
0.0530
0.0409
0.0373
0.0413
0.0450
0.0516
0.0572
0.0442
0.0403
0.0446
0.0486
0.0557
25-Jan-17
27-Feb-17
27-Mar-17
25-Apr-17
25-May-17
27-Jun-17
Direct Plan Fortnightly Dividend
2052.6820
2054.8943
4.1521
5.8813
4.4816
6.3480
14-Feb-18
14-Mar-18
Direct Plan Monthly Dividend
2058.3321
2062.3337
6.5164
9.9863
7.0335
10.7787
26-Feb-18
14-Mar-18
Dividend History
Edelweiss Long Term Equity Fund (Tax Savings)
Direct Plan Dividend Option
18-Jan-17
21-Sep-17
22-Mar-18
0.50
0.65
1.20
18.36
20.86
21.79
Regular Plan Dividend Option
18-Jan-17
21-Sep-17
22-Mar-18
0.50
0.65
1.20
15.34
17.13
17.80
Record Date NAV (`)Dividend per Unit (`)
Edelweiss Liquid Fund
Record Date NAV (`)Dividend per Unit (`)
Individuals/HUF Others
Regular Plan Fortnightly dividend
10.2079
10.2045
10.2088
10.2038
1018.00
1018.00
2159.7614
2158.2722
2157.4540
2158.2283
2157.6143
2158.7460
2157.6430
2158.9161
2158.0885
0.0187
0.0164
0.0193
0.0159
623.2863
623.2863
5.0041
3.9813
3.4439
3.9581
3.6205
4.3196
3.5719
4.4262
3.9663
0.0201
0.0177
0.0208
0.0172
672.7458
672.7458
5.4012
4.2972
3.7172
4.2722
3.9078
4.6624
3.8553
4.7774
4.2810
14-Sep-16
28-Sep-16
14-Oct-16
28-Oct-16
14-Sep-17
15-Sep-17
29-Oct-17
14-Nov-17
28-Nov-17
14-Dec-17
28-Dec-17
14-Jan-18
28-Jan-18
14-Feb-18
14-Mar-18
Direct Plan Dividend Option (Monthly)
1005.0342
1004.6285
3.4824
3.2107
3.7587
3.4655
30-Sep-16
28-Oct-16
Dividend Option (Monthly)
1004.9586
1004.6577
3.3786
3.1776
3.6467
3.4297
30-Sep-16
28-Oct-16
Direct Plan Monthly Dividend
10.1859
10.0884
10.0344
10.0851
10.0838
10.0877
0.1038
0.0371
0.0337
0.0363
0.0355
0.0381
0.1120
0.0400
0.0364
0.0392
0.0383
0.0411
25-Jan-17
26-Feb-17
28-Mar-17
25-Apr-17
25-May-17
26-Jun-17
Retail Plan Monthly Dividend
10.0786
10.0738
10.1201
10.0765
10.0788
10.0257
10.0753
10.0739
10.0776
0.0366
0.0334
0.0656
0.0364
0.0380
0.0330
0.0356
0.0346
0.0371
0.0395
0.0361
0.0708
0.0393
0.0410
0.0356
0.0384
0.0373
0.0401
26-Sep-16
25-Oct-16
25-Dec-16
25-Jan-17
26-Feb-17
28-Mar-17
25-Apr-17
25-May-17
26-Jun-17
Retail Plan - Dividend Option (Monthly)
1004.3464
1004.0475
3.0066
2.8062
3.2451
3.0289
30-Sep-16
28-Oct-16
Regular Plan Monthly Dividend
Edelweiss Multi - Asset Allocation Fund
Dividend Option
27-Apr-17
30-May-17
20-Jun-17
0.10
0.10
0.10
18.33
18.17
18.29
Regular Plan Dividend Option
26-Sep-16
27-Oct-16
23-Nov-16
19-Dec-16
18-Jan-17
15-Feb-17
29-Mar-17
10-Jul-17
22-Aug-17
21-Sep-17
23-Oct-17
21-Nov-17
21-Dec-17
22-Jan-18
20-Feb-18
22-Mar-18
0.10
0.10
0.10
0.10
0.10
0.10
0.10
0.10
0.10
0.11
0.10
0.10
0.10
0.10
0.10
0.10
18.04
17.89
16.59
16.31
16.70
17.14
17.75
18.35
18.23
18.49
18.86
18.85
19.06
19.65
18.48
18.00Direct Plan Dividend Option
26-Sep-16
27-Oct-16
23-Nov-16
19-Dec-16
18-Jan-17
15-Feb-17
29-Mar-17
27-Apr-17
30-May-17
20-Jun-17
10-Jul-17
22-Aug-17
21-Sep-17
23-Oct-17
21-Nov-17
21-Dec-17
22-Jan-18
20-Feb-18
22-Mar-18
0.10
0.10
0.10
0.10
0.10
0.10
0.10
0.10
0.10
0.10
0.10
0.10
0.11
0.10
0.10
0.10
0.10
0.10
0.10
18.33
18.19
16.88
16.60
17.00
17.46
18.09
18.69
18.53
18.66
18.72
18.64
18.92
19.30
19.31
19.55
20.17
18.99
18.51
Record Date NAV (`)Dividend per Unit (`)
After payment of dividend, the NAV will fall to the extent of dividend payout and statutory levy (if applicable). Past performance may or may not be sustained in future.
Dividend is declared on the face value of Rs. 10/- per unit.
For Edelweiss Liquid Fund and Edelweiss Low Duration Fund, the Dividend is declared on the face value of Rs. 1000/-
Edelweiss Low Duration Fund
Regular Plan Monthly Dividend
Record Date NAV (`)Dividend per Unit (`)
Individuals/HUF Others
10.0623
10.0964
10.1003
10.0940
10.1041
10.1036
10.1202
1010.5155
1009.4221
1004.1700
1009.5367
1010.1168
1007.8624
1008.3222
1008.2817
0.0145
0.0388
0.0410
0.0374
0.0423
0.0444
0.0524
4.3408
3.6208
2.9734
3.6809
4.1496
2.5048
3.1873
2.7867
0.0157
0.0419
0.0442
0.0403
0.0457
0.0479
0.0566
4.6852
3.9081
3.2094
3.9730
4.4789
2.7036
3.4403
3.0079
26-Dec-16
25-Jan-17
27-Feb-17
27-Mar-17
25-Apr-17
25-May-17
27-Jun-17
25-Jul-17
28-Aug-17
25-Sep-17
25-Oct-17
27-Nov-17
26-Dec-17
25-Jan-18
26-Feb-18
Edelweiss Large Cap Fund
Direct Plan Dividend Option
27-Apr-17
21-Sep-17
22-Mar-18
0.17
0.73
2.00
21.98
22.57
23.10
Dividend Option
27-Apr-17
21-Sep-17
22-Mar-18
0.17
0.73
2.00
19.75
20.12
20.50
Record Date NAV (`)Dividend per Unit (`)
Direct Plan Fortnightly Dividend
33
Edelweiss Equity Savings Fund
Regular Plan Dividend
18-Oct-1620-Feb-1720-Jun-1723-Oct-1720-Feb-1822-Mar-18
0.250.180.150.150.150.20
10.652710.529310.877911.103911.206011.0093
Record Date NAV (`)Dividend per Unit (`)
Direct Plan Dividend
18-Oct-1620-Feb-1720-Jun-1723-Oct-1720-Feb-1822-Mar-18
0.060.180.150.150.150.20
11.035311.116611.519711.798511.946011.7560
Regular Plan - Monthly Dividend
27-Nov-1721-Dec-1722-Jan-1820-Feb-1822-Mar-18
0.080.080.080.080.08
12.899812.922713.050812.773612.6399
Direct Plan – Monthly Dividend
27-Nov-1721-Dec-1722-Jan-1820-Feb-1822-Mar-18
0.080.080.080.080.08
13.251913.112113.251912.979412.8557
Regular Plan Fortnightly dividend
2029.2921
2031.5641
3.6537
5.4199
3.9436
5.8500
14-Feb-18
14-Mar-18
2176.89012175.64272176.44092175.80512176.96962175.83312177.14202176.2596
0.47230.38334.08153.72994.45053.68024.55854.0615
4.72303.83294.40544.02594.80373.97234.92024.3838
14-Nov-1728-Nov-1714-Dec-1728-Dec-1714-Jan-1828-Jan-1814-Feb-1814-Mar-18
10.0878
10.0830
10.1297
10.0858
10.0880
10.0344
1008.3712
1008.9088
1003.26
10.0845
10.0830
10.0867
1008.3369
1008.6144
1008.1186
1008.6387
1008.3458
1008.5367
0.0369
0.0337
0.0662
0.0368
0.0383
0.0333
3.5383
3.8947
3.3959
0.0359
0.0349
0.0375
3.5131
3.6973
3.3744
3.9622
3.5255
3.6410
0.0398
0.0364
0.0715
0.0397
0.0413
0.0359
3.8190
4.2037
3.6653
0.0387
0.0377
0.0404
3.7919
3.9907
3.6422
4.2766
3.8052
3.9299
26-Sep-16
25-Oct-16
25-Dec-16
25-Jan-17
26-Feb-17
28-Mar-17
25-Jul-17
27-Aug-17
25-Sep-17
25-Apr-17
25-May-17
26-Jun-17
25-Oct-17
26-Nov-17
25-Dec-17
25-Jan-18
25-Feb-18
25-Mar-18
Edelweiss Multi-Cap Fund
Regular Dividend
22-Mar-18 1.00 13.7410
Record Date NAV (`)Dividend per Unit (`)
Direct Plan - Dividend
22-Mar-18 1.00 13.9410
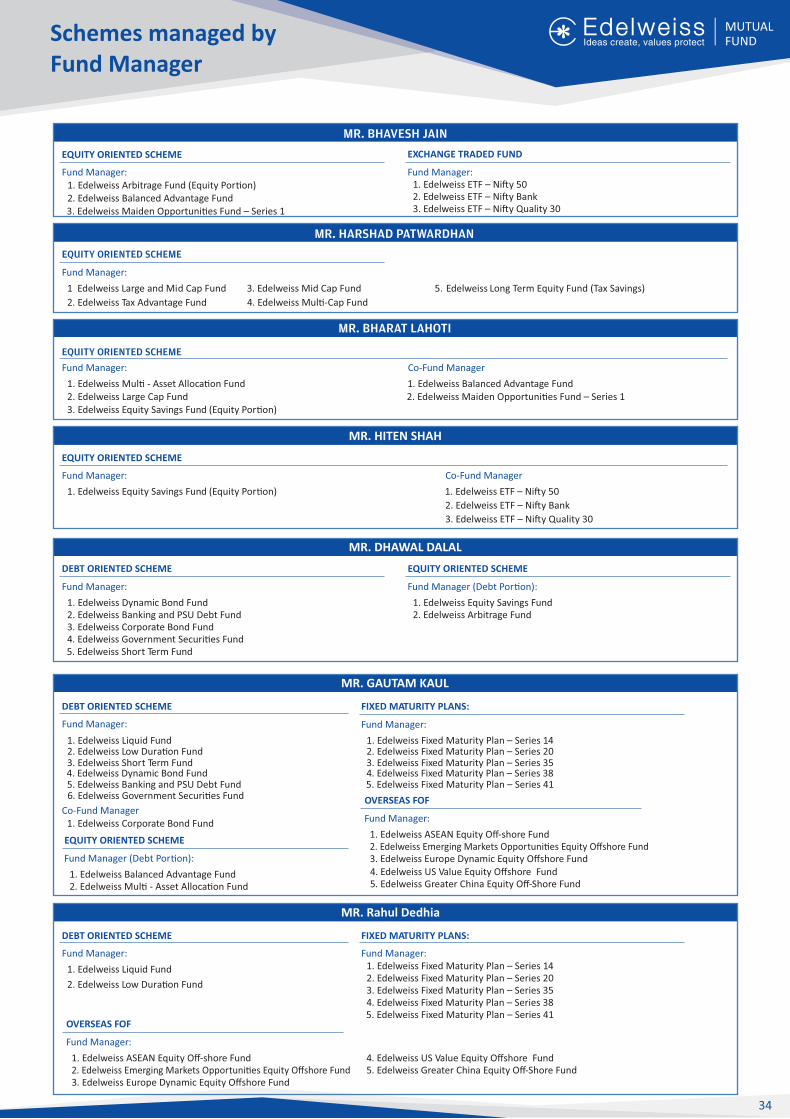
34
MR. BHAVESH JAIN
EQUITY ORIENTED SCHEME
Fund Manager:1. Edelweiss Arbitrage Fund (Equity Por�on)
. E2 delweiss Balanced Advantage Fund3. Edelweiss Maiden Opportuni�es Fund – Series 1
Fund Manager:1. Edelweiss ETF – Ni�y 502. Edelweiss ETF – Ni�y Bank3. Edelweiss ETF – Ni�y Quality 30
EXCHANGE TRADED FUND
Schemes managed by Fund Manager
Fund Manager:
1. Edelweiss Mul� - Asset Alloca�on Fund2. Edelweiss Large Cap Fund3. Edelweiss Equity Savings Fund (Equity Por�on)
MR. BHARAT LAHOTI
EQUITY ORIENTED SCHEME
Co-Fund Manager
1 delweiss Balanced Advantage Fund. E2. Edelweiss Maiden Opportuni�es Fund – Series 1
Fund Manager:
1. Edelweiss Dynamic Bond Fund2. Edelweiss Banking and PSU Debt Fund3. Edelweiss Corporate Bond Fund4. Edelweiss Government Securi�es Fund
Fund Manager (Debt Por�on):
1. Edelweiss Equity Savings Fund2. Edelweiss Arbitrage Fund
DEBT ORIENTED SCHEME
MR. DHAWAL DALAL
EQUITY ORIENTED SCHEME
MR. HITEN SHAH
EQUITY ORIENTED SCHEME
Co-Fund Manager
1. Edelweiss ETF – Ni�y 50
2. Edelweiss ETF – Ni�y Bank
3. Edelweiss ETF – Ni�y Quality 30
Fund Manager:
1. Edelweiss Equity Savings Fund (Equity Por�on)
Fund Manager:
1. Edelweiss Liquid Fund2. Edelweiss Low Dura�on Fund3. Edelweiss Short Term Fund
DEBT ORIENTED SCHEME
MR. GAUTAM KAUL
FIXED MATURITY PLANS:
Fund Manager:
1. Edelweiss Fixed Maturity Plan – Series 142. Edelweiss Fixed Maturity Plan – Series 203. Edelweiss Fixed Maturity Plan – Series 354. Edelweiss Fixed Maturity Plan – Series 385. Edelweiss Fixed Maturity Plan – Series 41
Co-Fund Manager1. Edelweiss Corporate Bond Fund
OVERSEAS FOF
Fund Manager:
1. Edelweiss ASEAN Equity Off-shore Fund2. Edelweiss Emerging Markets Opportuni�es Equity Offshore Fund3. Edelweiss Europe Dynamic Equity Offshore Fund4. Edelweiss US Value Equity Offshore Fund5. Edelweiss Greater China Equity Off-Shore Fund
MR. HARSHAD PATWARDHAN
EQUITY ORIENTED SCHEME
Fund Manager:
1 Edelweiss Large and Mid Cap Fund
2. Edelweiss Tax Advantage Fund
3. Edelweiss Mid Cap Fund
4. Edelweiss Mul�-Cap Fund
5. Edelweiss Long Term Equity Fund (Tax Savings)
Fund Manager:
1. Edelweiss Liquid Fund
2. Edelweiss Low Dura�on Fund
DEBT ORIENTED SCHEME
MR. Rahul Dedhia
FIXED MATURITY PLANS:
Fund Manager:1. Edelweiss Fixed Maturity Plan – Series 142. Edelweiss Fixed Maturity Plan – Series 203. Edelweiss Fixed Maturity Plan – Series 354. Edelweiss Fixed Maturity Plan – Series 385. Edelweiss Fixed Maturity Plan – Series 41
OVERSEAS FOF
Fund Manager:
1. Edelweiss ASEAN Equity Off-shore Fund 4. Edelweiss US Value Equity Offshore Fund
5. Edelweiss Short Term Fund
4. Edelweiss Dynamic Bond Fund5. Edelweiss Banking and PSU Debt Fund6. Edelweiss Government Securi�es Fund
Fund Manager (Debt Por�on):
1. Edelweiss Balanced Advantage Fund2. Edelweiss Mul� - Asset Alloca�on Fund
EQUITY ORIENTED SCHEME
2. Edelweiss Emerging Markets Opportuni�es Equity Offshore Fund 5. Edelweiss Greater China Equity Off-Shore Fund3. Edelweiss Europe Dynamic Equity Offshore Fund
HOW TO READ A FACTSHEET
Fund Manager : An employee of the asset management company such as a mutual fund or life insurer, who manages investments of the
scheme. He is usually part of a larger team of fund managers and research analysts.
Applica�on Amount for Fresh Subscrip�on : This is the minimum investment amount for a new investor in a mutual fund scheme.
Minimum Addi�onal Amount : This is the minimum investment amount for an exis�ng investor in a mutual fund scheme.
Yield to Maturity : The Yield to Maturity or the YTM is the rate of return an�cipated on a bond if held un�l maturity. YTM is expressed as an
annual rate. The YTM factors in the bond's current market price, par value, coupon interest rate and �me to maturity.
SIP : SIP or systema�c investment plan works on the principle of making periodic investments of a fixed sum. It works similar to a recurring
bank deposit. For instance, an investor may opt for an SIP that invests Rs 500 every 15th of the month in an equity fund for a period of three
years.
NAV : The NAV or the net asset value is the total asset value per unit of the mutual fund a�er deduc�ng all related and permissible expenses.
The NAV is calculated at the end of every business day. It is the value at which the investor enters or exits the mutual fund.
Benchmark : A group of securi�es, usually a market index, whose performance is used as a standard or benchmark to measure investment
performance of mutual funds, among other investments. Some typical benchmarks include the Ni�y, Sensex, BSE200, BSE500, 10-Year Gsec.
Entry Load : A mutual fund may have a sales charge or load at the �me of entry and/or exit to compensate the distributor/agent. Entry load is
charged at the �me an investor purchases the units of a mutual fund. The entry load is added to the prevailing NAV at the �me of investment.
For instance, if the NAV is Rs. 100 and the entry load is 1%, the investor will enter the fund at Rs 101.
Note: SEBI, vide circular dated June 30, 2009 has abolished entry load and mandated that the upfront commission to distributors will be paid
by the investor directly to the distributor, based on his assessment of various factors including the service rendered by the distributor
Exit Load : Exit load is charged at the �me an investor redeems the units of a mutual fund. The exit load is deducted from the prevailing NAV
at the �me of redemp�on. For instance, if the NAV is Rs 100 and the exit load is 1%, the redemp�on price would be Rs 99 Per Unit.
Modified Dura�on : Modified dura�on is the price sensi�vity and the percentage change in price for a unit change in yield
Standard Devia�on : Standard devia�on is a sta�s�cal measure of the range of an investment's performance. When a mutual fund has a high
standard devia�on, its means its range of performance is wide, implying greater vola�lity.
Sharpe Ra�o : The Sharpe Ra�o, named a�er its founder, the Nobel Laureate William Sharpe, is a measure of risk-adjusted returns. It is
calculated using standard devia�on and excess return to determine reward per unit of risk.
Beta : Beta is a measure of an investment's vola�lity vis-à-vis the market. Beta of less than 1 means that the security will be less vola�le than
the market. A beta of greater than 1 implies that the security's price will be more vola�le than the market.
AUM : AUM or assets under management refers to the recent / updated cumula�ve market value of investments managed by a mutual fund
or any investment firm.
Holdings : The holdings or the por�olio is a mutual fund's latest or updated reported statement of investments/securi�es. These are usually
displayed in terms of percentage to net assets or the rupee value or both. The objec�ve is to give investors an idea of where their money is
being invested by the fund manager.
Nature of Scheme : The investment objec�ve and underlying investments determine the nature of the mutual fund scheme. For instance, a
mutual fund that aims at genera�ng capital apprecia�on by inves�ng in stock markets is an equity fund or growth fund.Likewise, a mutual
fund that aims at capital preserva�on by inves�ng in debt markets is a debt fund or income fund. Each of these categories may have subcategories.
Ra�ng Profile : Mutual funds invest in securi�es a�er evalua�ng their creditworthiness as disclosed by the ra�ngs. A depic�on of the mutual
fund in various investments based on their ra�ngs becomes the ra�ng profile of the fund. Typically, this is a feature of debt funds.
35

Notes
36
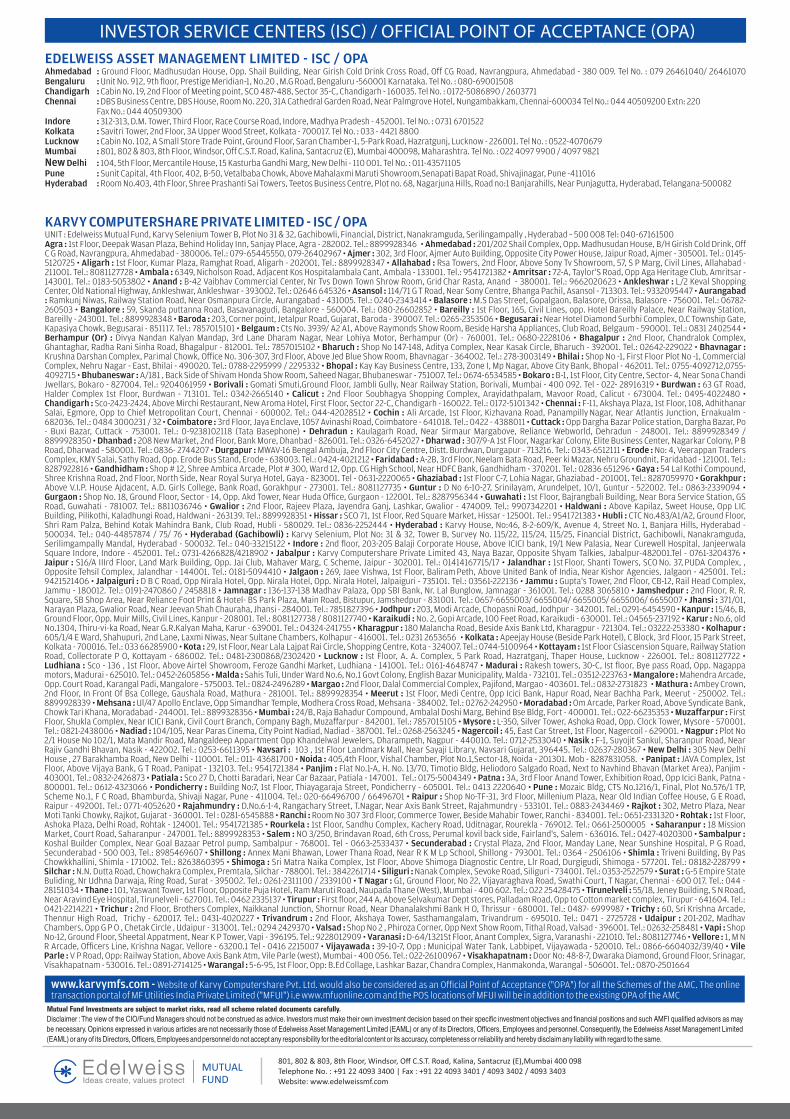
EDELWEISS ASSET MANAGEMENT LIMITED - ISC / OPAAhmedabad� : Ground Floor, Madhusudan House, Opp. Shail Building, Near Girish Cold Drink Cross Road, Off CG Road, Navrangpura, Ahmedabad - 380 009. Tel No. : 079 26461040/ 26461070Bengaluru� : Unit No. 912, 9th floor, Prestige Meridian-1, No.20 , M.G Road, Bengaluru -560001 Karnataka. Tel No. : 080-69001508Chandigarh � : Cabin No. 19, 2nd Floor of Meeting point, SCO 487-488, Sector 35-C, Chandigarh - 160035. Tel No. : 0172-5086890 / 2603771Chennai� : DBS Business Centre, DBS House, Room No. 220, 31A Cathedral Garden Road, Near Palmgrove Hotel, Nungambakkam, Chennai-600034 Tel No.: 044 40509200 Extn: 220 Fax No.: 044 40509300Indore� : 312-313, D.M. Tower, Third Floor, Race Course Road, Indore, Madhya Pradesh - 452001. Tel No. : 0731 6701522Kolkata� : Savitri Tower, 2nd Floor, 3A Upper Wood Street, Kolkata - 700017. Tel No. : 033 - 4421 8800Lucknow� : Cabin No. 102, A Small Store Trade Point, Ground Floor, Saran Chamber-1, 5-Park Road, Hazratgunj, Lucknow - 226001. Tel No. : 0522-4070679Mumbai� : 801, 802 & 803, 8th Floor, Windsor, Off C.S.T. Road, Kalina, Santacruz (E), Mumbai 400098, Maharashtra. Tel No. : 022 4097 9900 / 4097 9821
New Delhi� : 104, 5th Floor, Mercantile House, 15 Kasturba Gandhi Marg, New Delhi - 110 001. Tel No. : 011-43571105Pune : Sunit Capital, 4th Floor, 402, B-50, Vetalbaba Chowk, Above Mahalaxmi Maruti Showroom,Senapati Bapat Road, Shivajinagar, Pune -411016Hyderabad : Room No.403, 4th Floor, Shree Prashanti Sai Towers, Teetos Business Centre, Plot no. 68, Nagarjuna Hills, Road no:1 Banjarahills, Near Punjagutta, Hyderabad, Telangana-500082
KARVY COMPUTERSHARE PRIVATE LIMITED - ISC / OPAUNIT : Edelweiss Mutual Fund, Karvy Selenium Tower B, Plot No 31 & 32, Gachibowli, Financial, District, Nanakramguda, Serilingampally , Hyderabad – 500 008 Tel: 040-67161500Agra : Ahmedabad : 1st Floor, Deepak Wasan Plaza, Behind Holiday Inn, Sanjay Place, Agra - 282002. Tel.: 8899928346 • 201/202 Shail Complex, Opp. Madhusudan House, B/H Girish Cold Drink, Off C G Road, Navrangpura, Ahmedabad - 380006. Tel.: 079-65445550, 079-26402967 • 302, 3rd Floor, Ajmer Auto Building, Opposite City Power House, Jaipur Road, Ajmer - 305001. Tel.: 0145-Ajmer :5120725 • 1st Floor, Kumar Plaza, Ramghat Road, Aligarh - 202001. Tel.: 8899928347 • Rsa Towers, 2nd Floor, Above Sony Tv Showroom, 57, S P Marg, Civil Lines, Allahabad - Aligarh : Allahabad :211001. Tel.: 8081127728 • 6349, Nicholson Road, Adjacent Kos Hospitalambala Cant, Ambala - 133001. Tel.: 9541721382 • 72-A, Taylor'S Road, Opp Aga Heritage Club, Amritsar - Ambala : Amritsar : 143001. Tel.: 0183-5053802 • B-42 Vaibhav Commercial Center, Nr Tvs Down Town Shrow Room, Grid Char Rasta, Anand - 380001. Tel.: 9662020623 • L/2 Keval Shopping Anand : Ankleshwar : Center, Old National Highway, Ankleshwar, Ankleshwar - 393002. Tel.: 02646 645326 • 114/71 G T Road, Near Sony Centre, Bhanga Pachil, Asansol - 713303. Tel.: 9332095447 • Asansol : Aurangabad : Balasore : Ramkunj Niwas, Railway Station Road, Near Osmanpura Circle, Aurangabad - 431005. Tel.: 0240-2343414 • M.S Das Street, Gopalgaon, Balasore, Orissa, Balasore - 756001. Tel.: 06782-260503 • 59, Skanda puttanna Road, Basavanagudi, Bangalore - 560004. Tel.: 080-26602852 • 1st Floor, 165, Civil Lines, opp. Hotel Bareilly Palace, Near Railway Station, Bangalore : Bareilly : Bareilly - 243001. Tel.: 8899928348 • 203, Corner point, Jetalpur Road, Gujarat, Baroda - 390007. Tel.: 0265-2353506 • Near Hotel Diamond Surbhi Complex, O.C Township Gate, Baroda : Begusarai :Kapasiya Chowk, Begusarai - 851117. Tel.: 7857015101 • Cts No. 3939/ A2 A1, Above Raymonds Show Room, Beside Harsha Appliances, Club Road, Belgaum - 590001. Tel.: 0831 2402544 • Belgaum : Berhampur (Or) : Bhagalpur : Divya Nandan Kalyan Mandap, 3rd Lane Dharam Nagar, Near Lohiya Motor, Berhampur (Or) - 760001. Tel.: 0680-2228106 • 2nd Floor, Chandralok Complex, Ghantaghar, Radha Rani Sinha Road, Bhagalpur - 812001. Tel.: 7857015102 • Shop No 147-148, Aditya Complex, Near Kasak Circle, Bharuch - 392001. Tel.: 02642-229022 • Bharuch : Bhavnagar : Krushna Darshan Complex, Parimal Chowk, Office No. 306-307, 3rd Floor, Above Jed Blue Show Room, Bhavnagar - 364002. Tel.: 278-3003149 • Shop No -1, First Floor Plot No -1, Commercial Bhilai :Complex, Nehru Nagar - East, Bhilai - 490020. Tel.: 0788-2295999 / 2295332 • Kay Kay Business Centre, 133, Zone I, Mp Nagar, Above City Bank, Bhopal - 462011. Tel.: 0755-4092712,0755-Bhopal : 4092715 • A/181 , Back Side of Shivam Honda Show Room, Saheed Nagar, Bhubaneswar - 751007. Tel.: 0674-6534585 • B-1, 1st Floor, City Centre, Sector- 4, Near Sona Chandi Bhubaneswar : Bokaro :Jwellars, Bokaro - 827004. Tel.: 9204061959 • Gomati Smuti,Ground Floor, Jambli Gully, Near Railway Station, Borivali, Mumbai - 400 092. Tel - 022- 28916319 • 63 GT Road, Borivali : Burdwan :Halder Complex 1st Floor, Burdwan - 713101. Tel.: 0342-2665140 • 2nd Floor Soubhagya Shopping Complex, Arayidathpalam, Mavoor Road, Calicut - 673004. Tel.: 0495-4022480 • Calicut :Chandigarh : Chennai :Sco-2423-2424, Above Mirchi Restaurant, New Aroma Hotel, First Floor, Sector 22-C, Chandigarh - 160022. Tel.: 0172-5101342 • F-11, Akshaya Plaza, 1st Floor, 108, Adhithanar Salai, Egmore, Opp to Chief Metropolitan Court, Chennai - 600002. Tel.: 044-42028512 • Ali Arcade, 1st Floor, Kizhavana Road, Panampilly Nagar, Near Atlantis Junction, Ernakualm - Cochin :682036. Tel.: 0484 3000231 / 32 • 3rd Floor, Jaya Enclave, 1057 Avinashi Road, Coimbatore - 641018. Tel.: 0422 - 4388011 • Opp Dargha Bazar Police station, Dargha Bazar, Po Coimbatore : Cuttack :- Buxi Bazar, Cuttack - 753001. Tel.: 0-9238102118 (Tata Basephone) • Kaulagarh Road, Near Sirmaur Margabove, Reliance Webworld, Dehradun - 248001. Tel.: 8899928349 / Dehradun :8899928350 • 208 New Market, 2nd Floor, Bank More, Dhanbad - 826001. Tel.: 0326-6452027 • 307/9-A 1st Floor, Nagarkar Colony, Elite Business Center, Nagarkar Colony, P B Dhanbad : Dharwad :Road, Dharwad - 580001. Tel.: 0836- 2744207 • MWAV-16 Bengal Ambuja, 2nd Floor City Centre, Distt. Burdwan, Durgapur - 713216. Tel.: 0343-6512111 • No: 4, Veerappan Traders Durgapur : Erode :Complex, KMY Salai, Sathy Road, Opp. Erode Bus Stand, Erode - 638003. Tel.: 0424-4021212 • A-2B, 3rd Floor, Neelam Bata Road, Peer ki Mazar, Nehru Groundnit, Faridabad - 121001. Tel.: Faridabad :8287922816 • Shop # 12, Shree Ambica Arcade, Plot # 300, Ward 12, Opp. CG High School, Near HDFC Bank, Gandhidham - 370201. Tel.: 02836 651296 • 54 Lal Kothi Compound, Gandhidham : Gaya :Shree Krishna Road, 2nd Floor, North Side, Near Royal Surya Hotel, Gaya - 823001. Tel - 0631-2220065 • 1st Floor C-7, Lohia Nagar, Ghaziabad - 201001. Tel.: 8287059970 • Ghaziabad : Gorakhpur :Above V.I.P. House Ajdacent, A.D. Girls College, Bank Road, Gorakhpur - 273001. Tel.: 8081127735 • D No 6-10-27, Srinilayam, Arundelpet, 10/1, Guntur - 522002. Tel.: 0863-2339094 • Guntur :Gurgaon : Guwahati :Shop No. 18, Ground Floor, Sector - 14, Opp. Akd Tower, Near Huda Office, Gurgaon - 122001. Tel.: 8287956344 • 1st Floor, Bajrangbali Building, Near Bora Service Station, GS Road, Guwahati - 781007. Tel.: 8811036746 • 2nd Floor, Rajeev Plaza, Jayendra Ganj, Lashkar, Gwalior - 474009. Tel.: 9907342201 • Above Kapilaz, Sweet House, Opp LIC Gwalior : Haldwani :Building, Pilikothi, Kaladhungi Road, Haldwani - 263139. Tel.: 8899928351 • SCO 71, 1st Floor, Red Square Market, Hissar - 125001. Tel.: 9541721383 • CTC No.483/A1/A2, Ground Floor, Hissar : Hubli :Shri Ram Palza, Behind Kotak Mahindra Bank, Club Road, Hubli - 580029. Tel.: 0836-2252444 • Karvy House, No:46, 8-2-609/K, Avenue 4, Street No. 1, Banjara Hills, Hyderabad - Hyderabad :500034. Tel.: 040-44857874 / 75/ 76 • Karvy Selenium, Plot No: 31 & 32, Tower B, Survey No. 115/22, 115/24, 115/25, Financial District, Gachibowli, Nanakramguda, Hyderabad (Gachibowli) :Serilimgampally Mandal, Hyderabad - 500032. Tel.: 040-33215122 • 2nd floor, 203-205 Balaji Corporate House, Above ICICI bank, 19/1 New Palasia, Near Curewell Hospital, Janjeerwala Indore :Square Indore, Indore - 452001. Tel.: 0731-4266828/4218902 • Karvy Computershare Private Limited 43, Naya Bazar, Opposite Shyam Talkies, Jabalpur-482001.Tel - 0761-3204376 • Jabalpur :Jaipur : Jalandhar : S16/A IIIrd Floor, Land Mark Building, Opp. Jai Club, Mahaver Marg, C Scheme, Jaipur - 302001. Tel.: 01414167715/17 • 1st Floor, Shanti Towers, SCO No. 37, PUDA Complex, , Opposite Tehsil Complex, Jalandhar - 144001. Tel.: 0181-5094410 • 269, Jaee Vishwa, 1st Floor, Baliram Peth, Above United Bank of India, Near Kishor Agencies, Jalgaon - 425001. Tel.: Jalgaon :9421521406 • D B C Road, Opp Nirala Hotel, Opp. Nirala Hotel, Opp. Nirala Hotel, Jalpaiguri - 735101. Tel.: 03561-222136 • Gupta's Tower, 2nd Floor, CB-12, Rail Head Complex, Jalpaiguri : Jammu : Jammu - 180012. Tel.: 0191-2470860 / 2458818 • 136-137-138 Madhav Palaza, Opp SBI Bank, Nr. Lal Bunglow, Jamnagar - 361001. Tel.: 0288 3065810 • 2nd Floor, R. R. Jamnagar : Jamshedpur :Square, SB Shop Area, Near Reliance Foot Print & Hotel- BS Park Plaza, Main Road, Bistupur, Jamshedpur - 831001. Tel.: 0657-6655003/ 6655004/ 6655005/ 6655006/ 6655007 • 371/01, Jhansi : Narayan Plaza, Gwalior Road, Near Jeevan Shah Chauraha, Jhansi - 284001. Tel.: 7851827396 • 203, Modi Arcade, Chopasni Road, Jodhpur - 342001. Tel.: 0291-6454590 • 15/46, B, Jodhpur : Kanpur :Ground Floor, Opp. Muir Mills, Civil Lines, Kanpur - 208001. Tel.: 8081127738 / 8081127740 • No. 2, Gopi Arcade, 100 Feet Road, Karaikudi - 630001. Tel.: 04565-237192 • No.6, old Karaikudi : Karur :No.1304, Thiru-vi-ka Road, Near G.R.Kalyan Maha, Karur - 639001. Tel.: 04324-241755 • 180 Malancha Road, Beside Axis Bank Ltd, Kharagpur - 721304. Tel.: 03222-253380 • Kharagpur : Kolhapur :605/1/4 E Ward, Shahupuri, 2nd Lane, Laxmi Niwas, Near Sultane Chambers, Kolhapur - 416001. Tel.: 0231 2653656 • Apeejay House (Beside Park Hotel), C Block, 3rd Floor, 15 Park Street, Kolkata : Kolkata - 700016. Tel.: 033 66285900 • 29, Ist Floor, Near Lala Lajpat Rai Circle, Shopping Centre, Kota - 324007. Tel.: 0744-5100964 • 1st Floor Csiascension Square, Railway Station Kota : Kottayam : Road, Collectorate P O, Kottayam - 686002. Tel.: 0481-2300868/2302420 • Ist Floor, A. A. Complex, 5 Park Road, Hazratganj, Thaper House, Lucknow - 226001. Tel.: 8081127722 • Lucknow :Ludhiana : Madurai :Sco - 136 , 1st Floor, Above Airtel Showroom, Feroze Gandhi Market, Ludhiana - 141001. Tel.: 0161-4648747 • Rakesh towers, 30-C, Ist floor, Bye pass Road, Opp. Nagappa motors, Madurai - 625010. Tel.: 0452-2605856 • Sahis Tuli, Under Ward No.6, No.1 Govt Colony, English Bazar Municipality, Malda - 732101. Tel.: 03512-223763 • Mahendra Arcade, Malda : Mangalore : Opp. Court Road, Karangal Padi, Mangalore - 575003. Tel.: 0824-2496289 • 2nd Floor, Dalal Commercial Complex, Pajifond, Margao - 403601. Tel.: 0832-2731823 • Ambey Crown, Margao : Mathura :2nd Floor, In Front Of Bsa College, Gaushala Road, Mathura - 281001. Tel.: 8899928354 • 1st Floor, Medi Centre, Opp Icici Bank, Hapur Road, Near Bachha Park, Meerut - 250002. Tel.: Meerut : 8899928339 • Ul/47 Apollo Enclave, Opp Simandhar Temple, Modhera Cross Road, Mehsana - 384002. Tel.: 02762-242950 • Om Arcade, Parker Road, Above Syndicate Bank, Mehsana : Moradabad : Chowk Tari Khana, Moradabad - 244001. Tel.: 8899328356 • 24/B, Raja Bahadur Compound, Ambalal Doshi Marg, Behind Bse Bldg, Fort - 400001. Tel.: 022-66235353 • First Mumbai : Muzaffarpur : Floor, Shukla Complex, Near ICICI Bank, Civil Court Branch, Company Bagh, Muzaffarpur - 842001. Tel.: 7857015105 • L-350, Silver Tower, Ashoka Road, Opp. Clock Tower, Mysore - 570001. Mysore : Tel.: 0821-2438006 • 104/105, Near Paras Cinema, City Point Nadiad, Nadiad - 387001. Tel.: 0268-2563245 • 45, East Car Street, 1st Floor, Nagercoil - 629001. • Plot No Nadiad : Nagercoil : Nagpur : 2/1 House No 102/1, Mata Mandir Road, Mangaldeep Appartment Opp Khandelwal Jewelers, Dharampeth, Nagpur - 440010. Tel.: 0712-2533040 • F-1, Suyojit Sankul, Sharanpur Road, Near Nasik : Rajiv Gandhi Bhavan, Nasik - 422002. Tel.: 0253-6611395 • 103 , 1st Floor Landmark Mall, Near Sayaji Library, Navsari Gujarat, 396445. Tel.: 02637-280367 • 305 New Delhi Navsari : New Delhi : House , 27 Barakhamba Road, New Delhi - 110001. Tel.: 011- 43681700 • 405,4th Floor, Vishal Chamber, Plot No.1,Sector-18, Noida - 201301. Mob - 8287831058. • JAVA Complex, 1st Noida : Panipat : Floor, Above Vijaya Bank, G T Road, Panipat - 132103. Tel.: 9541721384 • Flat No.1-A, H. No. 13/70, Timotio Bldg, Heliodoro Salgado Road, Next to Navhind Bhavan (Market Area), Panjim - Panjim : 403001. Tel.: 0832-2426873 • Sco 27 D, Chotti Baradari, Near Car Bazaar, Patiala - 147001. Tel.: 0175-5004349 • 3A, 3rd Floor Anand Tower, Exhibition Road, Opp Icici Bank, Patna - Patiala : Patna : 800001. Tel.: 0612-4323066 • Building No:7, 1st Floor, Thiayagaraja Street, Pondicherry - 605001. Tel.: 0413 2220640 • Mozaic Bldg, CTS No.1216/1, Final, Plot No.576/1 TP, Pondicherry : Pune : Scheme No.1, F C Road, Bhamburda, Shivaji Nagar, Pune - 411004. Tel.: 020-66496700 / 66496701 • Shop No-TF-31, 3rd Floor, Millenium Plaza, Near Old Indian Coffee House, G E Road, Raipur : Raipur - 492001. Tel.: 0771-4052620 • D.No.6-1-4, Rangachary Street, T.Nagar, Near Axis Bank Street, Rajahmundry - 533101. Tel.: 0883-2434469 • 302, Metro Plaza, Near Rajahmundry : Rajkot : Moti Tanki Chowky, Rajkot, Gujarat - 360001. Tel : 0281-6545888 • Room No 307 3rd Floor, Commerce Tower, Beside Mahabir Tower, Ranchi - 834001. Tel.: 0651-2331320 • 1st Floor, Ranchi : Rohtak : Ashoka Plaza, Delhi Road, Rohtak - 124001. Tel.: 9541721385 • 1st Floor, Sandhu Complex, Kachery Road, Uditnagar, Rourekla - 769012. Tel.: 0661-2500005 • 18 Mission Rourkela : Saharanpur :Market, Court Road, Saharanpur - 247001. Tel.: 8899928353 • NO 3/250, Brindavan Road, 6th Cross, Perumal kovil back side, Fairland's, Salem - 636016. Tel.: 0427-4020300 • Salem : Sambalpur : Koshal Builder Complex, Near Goal Bazaar Petrol pump, Sambalpur - 768001. Tel - 0663-2533437 • Crystal Plaza, 2nd Floor, Manday Lane, Near Sunshine Hospital, P G Road, Secunderabad : Secunderabad - 500 003, Tel.: 8985469607 • Annex Mani Bhawan, Lower Thana Road, Near R K M Lp School, Shillong - 793001. Tel.: 0364 - 2506106 • Triveni Building, By Pas Shillong : Shimla : Chowkkhallini, Shimla - 171002. Tel.: 8263860395 • Sri Matra Naika Complex, 1st Floor, Above Shimoga Diagnostic Centre, Llr Road, Durgigudi, Shimoga - 577201. Tel.: 08182-228799 • Shimoga : Silchar : Siliguri : Surat : N.N. Dutta Road, Chowchakra Complex, Premtala, Silchar - 788001. Tel.: 3842261714 • Nanak Complex, Sevoke Road, Siliguri - 734001. Tel.: 0353-2522579 • G-5 Empire State Buliding, Nr Udhna Darwaja, Ring Road, Surat - 395002. Tel.: 0261-2311100 / 2339100 • G1, Ground Floor, No 22, Vijayaraghava Road, Swathi Court, T Nagar, Chennai - 600 017. Tel.: 044 - T Nagar :28151034 • 101, Yaswant Tower, 1st Floor, Opposite Puja Hotel, Ram Maruti Road, Naupada Thane (West), Mumbai - 400 602. Tel.: 022 25428475 • 55/18, Jeney Building, S N Road, Thane : Tirunelveli : Near Aravind Eye Hospital, Tirunelveli - 627001. Tel.: 0462 2335137 • First floor, 244 A, Above Selvakumar Dept stores, Palladam Road, Opp to Cotton market complex, Tirupur - 641604. Tel.: Tirupur : 0421-2214221 • 2nd Floor, Brothers Complex, Naikkanal Junction, Shornur Road, Near Dhanalakshmi Bank H O, Thrissur - 680001. Tel.: 0487- 6999987 • 60, Sri Krishna Arcade, Trichur : Trichy : Thennur High Road, Trichy - 620017. Tel.: 0431-4020227 • 2nd Floor, Akshaya Tower, Sasthamangalam, Trivandrum - 695010. Tel.: 0471 - 2725728 • 201-202, Madhav Trivandrum : Udaipur : Chambers, Opp G P O , Chetak Circle , Udaipur - 313001. Tel.: 0294 2429370 • Shop No 2 , Phiroza Corner, Opp Next Show Room, Tithal Road, Valsad - 396001. Tel.: 02632-258481 • Shop Valsad : Vapi : No-12, Ground Floor, Sheetal Appatment, Near K P Tower, Vapi - 396195. Tel.: 9228012909 • D-64/1321St Floor, Anant Complex, Sigra, Varanashi - 221010. Tel.: 8081127746 • 1, M N Varanasi : Vellore :R Arcade, Officers Line, Krishna Nagar, Vellore - 63200.1 Tel - 0416 2215007 • 39-10-7, Opp : Municipal Water Tank, Labbipet, Vijayawada - 520010. Tel.: 0866-6604032/39/40 • Vijayawada : Vile Parle : Visakhapatnam : V P Road, Opp: Railway Station, Above Axis Bank Atm, Vile Parle (west), Mumbai - 400 056. Tel.: 022-26100967 • Door No: 48-8-7, Dwaraka Diamond, Ground Floor, Srinagar, Visakhapatnam - 530016. Tel.: 0891-2714125 • 5-6-95, 1st Floor, Opp: B.Ed Collage, Lashkar Bazar, Chandra Complex, Hanmakonda, Warangal - 506001. Tel.: 0870-2501664Warangal :
www.karvymfs.com - Website of Karvy Computershare Pvt. Ltd. would also be considered as an Official Point of Acceptance ("OPA") for all the Schemes of the AMC. The online transaction portal of MF Utilities India Private Limited ("MFUI") i.e www.mfuonline.com and the POS locations of MFUI will be in addition to the existing OPA of the AMC
801, 802 & 803, 8th Floor, Windsor, Off C.S.T. Road, Kalina, Santacruz (E),Mumbai 400 098 Telephone No. : +91 22 4093 3400 | Fax : +91 22 4093 3401 / 4093 3402 / 4093 3403Website: www.edelweissmf.com
Mutual Fund Investments are subject to market risks, read all scheme related documents carefully.


![Unsteady Triple-Shock Configurations in High Speed Flows ......supersonic flow control in different gas media has been suggested [18]. Possibility of the control of a shape of triple-shock](https://img.pdfslide.us/doc/110x75/612d34bc1ecc515869420b69/unsteady-triple-shock-configurations-in-high-speed-flows-supersonic-flow.jpg)