Embed Size (px)
Citation preview
TABLE OF CONTENTS
1 NATIONAL CONTEXT 4
2 NATURAL HAZARDS 5
3 INDICATORS OF DISASTER RISK AND RISK MANAGEMENT 7
3.1 Disaster Deficit Index (DDI) 7 3.1.1 Reference parameters for the model 8 3.1.2 Estimation of the indicators 9
3.2 Local Disaster Index (LDI) 13
3.3 Prevalent Vulnerability Index (PVI) 17 3.3.1 Indicators of exposition and susceptibility 17 3.3.2 Indicators of socio-economic fragility 18 3.3.3 Indicators of resilience (lack of) 18 3.3.4 Estimation of indicators 19
3.4 Risk Management Index (RMI) 22 3.4.1 Institutional frame 23 3.4.2 Indicators of risk identification 23 3.4.3 Indicators of risk reduction 24 3.4.4 Indicators of disaster management 24 3.4.5 Indicators of governance and financial protection 25 3.4.6 Estimation of the indicators 25
4 CONCLUSIONS 30
5 BIBLIOGRAPHY 31
AI.1 SEISMIC HAZARD 33
AI.2 VOLCANIC HAZARD 34
AI.3 HYDROMETEOROLOGICAL HAZARDS 34
AI.3.1 HAZARD OF FLOODING 35
AI.4 HAZARD OF FOREST FIRES 36
INTRODUCTION Disaster risk is not only associated with the occurrence of intense physical phenomenon but also with the vulnerability conditions that favour or facilitate disaster when such phenomenon occur. Vulnerability is intimately related to social processes in disaster prone areas and is usually related to the fragility, susceptibility or lack of resilience of the population when faced with different hazards. In other words, disasters are socio-environmental by nature and their materialization is the result of the social construction of risk. Therefore, their reduction must be part of decision making processes. This is the case not only with post disaster reconstruction but also with public policy formulation and development planning. Due to this, institutional development must be strengthened and investment stimulated in vulnerability reduction in order to contribute to the sustainable development process in different countries. In order to improve disaster risk understanding and disaster risk management performance a transparent, representative and robust System of Indicators, easily understood by public policymakers, relatively easy to update periodically and that allow cluster and comparison between countries was developed by the Institute of Environmental Studies (IDEA in Spanish) of the National University of Colombia, Manizales. This System of Indicators was designed between 2003 and 2005 with the support of the Operation ATN/JF-7906/07-RG “Information and Indicators Program for Disaster Risk Management” of the Inter-American Development Bank (IDB). This System of Indicators had three specific objectives: i) improvement in the use and presentation of information on risk. This assists policymakers in identifying investment priorities to reduce risk (such as prevention and mitigation measures), and directs the post disaster recovery process; ii) to provide a way to measure key elements of vulnerability for countries facing natural phenomena. It also provides a way to identify national risk management capacities, as well as comparative data for evaluating the effects of policies and investments on risk management; and iii) application of this methodology should promote the exchange of technical information for public policy formulation and risk management programs throughout the region. The System of Indicators was developed to be useful not only for the countries but also for the Bank, facilitating the individual monitoring of each country and the comparison between the countries of the region. The first phase of the Program of Indicators IDB-IDEA involved the methodological development, the formulation of the indicators and the evaluation of twelve countries from 1985 to 2000. Subsequently two additional countries were evaluated with the support of the Regional Policy Dialogue on Natural Disasters. In 2008 a methodological review and the updating of the indicators for twelve countries was made in the framework of the Operation RG-T1579; ATN/MD-11238-RG. Indicators were updated to 2005 and for the most recent date according to information availability (2007 or 2008) for Argentina, Bolivia, Chile, Colombia, Ecuador, Jamaica, Mexico, Peru, Dominican Republic and Trinidad and
1
Tobago1. In addition, Barbados and Panama were included in the program. This report has been made using –with some adjustments that in each case are referenced– the methodologies formulated in the first phase of the Program of Indicators IDB-IDEA2 The System of Indicators abovementioned attempts risk and vulnerability benchmarking using relative indicators in order to facilitate access to relevant information by national level decision makers which facilitates the identification and proposal of effective disaster risk management policies and actions. Their underlying models seek to represent risk and risk management at a national scale, allowing the identification of its essential economic and social characteristics and a comparison of these aspects and the risk context in different countries. The System of Indicators proposed permits the benchmarking of the evaluations of each country in different periods. It assists the move toward a more analytically rigorous and data driven approach to risk management decision-making. This measurement approach enables: Representation of disaster risk at the national level, allowing the identification of key
issues relating to their characterization from an economic and social point of view. Risk management performance benchmarking of the different countries to determine
performance targets for improving management effectiveness. Due to a lack of parameters, the need to suggest some qualitative indicators measured on subjective scales is unavoidable. This is the case with risk management indicators. The weighting or pondering of some indices has been undertaken using expert opinion and informants at the national level. Analysis has been achieved using numerical techniques that are consistent from the theoretical and statistical perspectives.
Four components or composite indicators reflect the principal elements that represent vulnerability and show the advance of different countries in risk management. This is achieved in the following way: 1. The Disaster Deficit Index, DDI, measures country risk from a macro-economic and
financial perspective when faced with possible catastrophic events. This requires an estimation of critical impacts during a given exposure time and of the capacity of the country to face up to this situation financially.
2. The Local Disaster Index, LDI, identify the social and environmental risk that derives
from more recurrent lower level events which are often chronic at the local and sub
1 Last period, in general, is considered tentative or preliminary because usually, most recent values are not totally confirmed and it is common that some of them change, such as it has been verified in this updating with values that were used in the previous evaluation (2005). 2 More information and details of methodologies can be found in IDEA (2005). “System of Indicators of Disaster Risk and Risk Management: Main Technical Report”. Program of Indicators for Disaster Risk and Risksk Management IDB – IDEA, Universidad Nacional de Colombia, Manizales. http://idea.unalmzl.edu.co
2
national levels. These particularly affect the more socially and economically fragile population and generate a highly damaging impact on the country’s development.
3. The Prevalent Vulnerability Index, PVI, is made up of a series of indicators that
characterize prevailing vulnerability conditions reflected in exposure in prone areas, socioeconomic fragility and lack of resilience in general.
4. The Risk Management Index, RMI, brings together a group of indicators related to the
risk management performance of the country. These reflect the organizational, development, capacity and institutional action taken to reduce vulnerability and losses, to prepare for crisis and efficiently recover.
In this way, the System of Indicators covers different aspects of the risk problematic and takes into account aspects such as: potential damage and loss due to the probability of extreme events, recurrent disasters or losses, socio-environmental conditions that facilitate disasters, capacity for macroeconomic recovery, behaviour of key services, institutional capacity and the effectiveness of basic risk management instruments such as risk identification, prevention and mitigation measures, financial mechanisms and risk transfer, emergency response levels and preparedness and recovery capacity (Cardona 2008). Each index has a number of variables that are associated with it and empirically measured. The choice of variables was driven by a consideration of a number of factors including: country coverage, the soundness of the data, direct relevance to the phenomenon that the indicators are intended to measure, and quality. Wherever possible it is sought to use direct measures of the phenomena is wanted to capture. But in some cases, “proxies” had to be employed. In general it is sought variables with extensive country coverage but chose in some cases to make use of variables with narrow coverage if they measured critical aspects of risk that would otherwise be overlooked. This report presents only the updated or new results for the country and detailed methodological explanations are not included since they are not the scope of this report. Information related to the methodology and the previous results of the System of Indicators can be found at: http://idea.unalmzl.edu.co, where details on conceptual framework, methodological support, data treatment and statistical techniques used in the modelling are presented (Cardona et al 2003a/b; 2004 a/b).
3
SYSTEM OF INDICATORS FOR TRINIDAD AND TOBAGO
1 NATIONAL CONTEXT
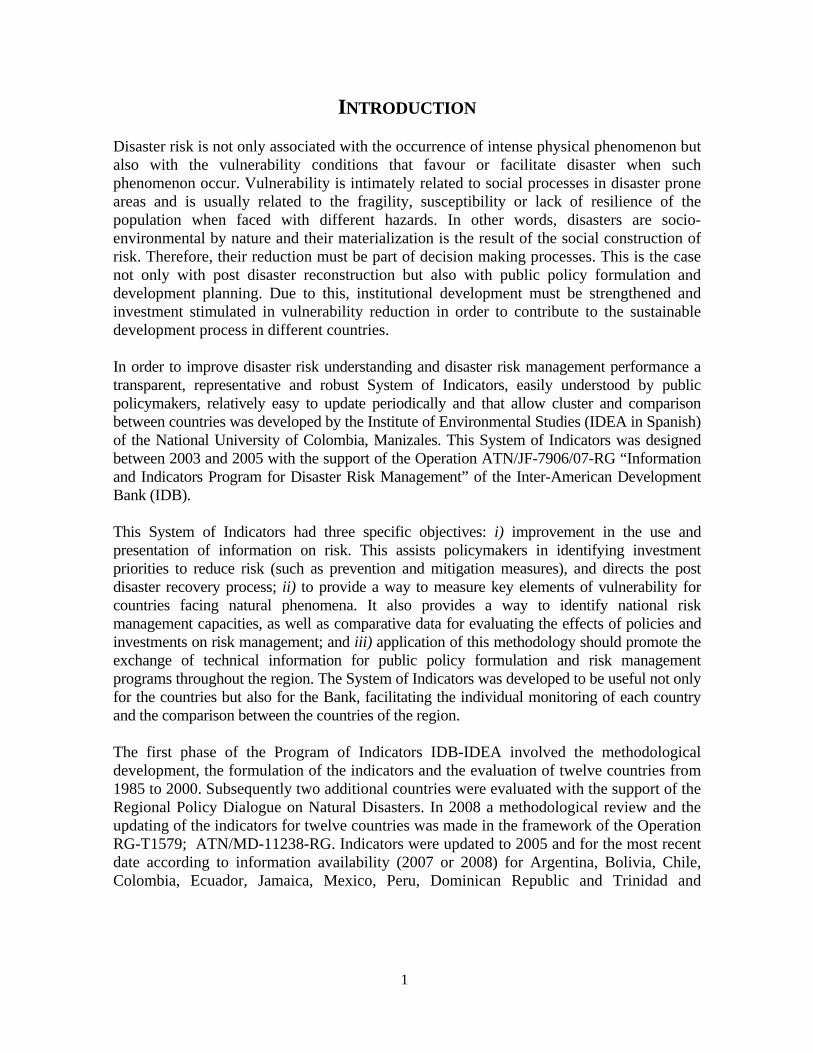
Trinidad and Tobago are southeasterly islands of the Antilles. At the closest point, Trinidad is just 11 kilometers (6.8 mi) of the Venezuelan coast. Covering an area of 5,128 km2 (1,980 sq mi), the country consists of the two main islands, Trinidad and Tobago, and numerous smaller landforms – including Chacachacare, Monos, Huevos, Gaspar Grande (or Gasparee), Little Tobago and St. Giles Island. Trinidad is 4,768 km2 (1,841 sq mi) in area (comprising 93.0% of the country's total area) with an average length of 80 km (50 mi) and an average width of 59 kilometers (37 mi). Tobago has an area of about 300 km2 (120 sq mi), or 5.8% of the country's area, is 41 km (25 mi) long and 12 km (7.5 mi) at its greatest width. Trinidad and Tobago’s Population (according to last census – 2000) is 1.262.366 inhabitants. The main and the most important city is Port of Spain (population is 49.031). Other big cities are San Fernando (55.419 inhabitants) and Arima (32.278 inhabitants). Figure 1 presents an estimative of population in millions inhabitants for the different provinces and their variation in 1990 and 2000.
2000 1990
0 2 4 6
City of Port of Spain
City of San Fernando
Borough of Arima
Borough of Point Fortin
St. George
Caroni
Nariva/Mayaro
St. Andrew/St. David
Victoria
St. Patrick
Tobago
x 10000Habitantes 0
Figure 1. Population of main territorial units (Source: CSO3)
Inhabitants x 100,000
With respect to its economy, GDP of Trinidad and Tobago is of the order of US$20.8 billion in 2007; its growth rate has been between 6% and 5% in 2005 and 2007. In this
3 Central Statistical Office –CSO - http:// www.cso.gov.tt/
4
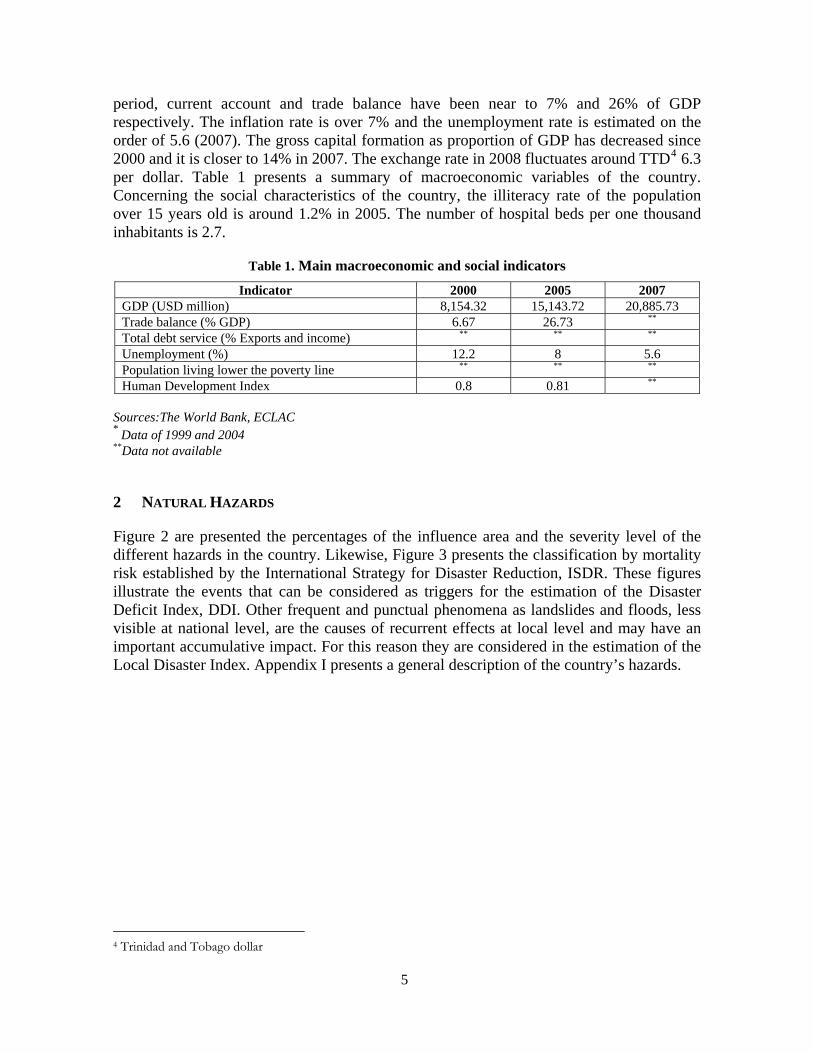
period, current account and trade balance have been near to 7% and 26% of GDP respectively. The inflation rate is over 7% and the unemployment rate is estimated on the order of 5.6 (2007). The gross capital formation as proportion of GDP has decreased since 2000 and it is closer to 14% in 2007. The exchange rate in 2008 fluctuates around TTD4 6.3 per dollar. Table 1 presents a summary of macroeconomic variables of the country. Concerning the social characteristics of the country, the illiteracy rate of the population over 15 years old is around 1.2% in 2005. The number of hospital beds per one thousand inhabitants is 2.7.
Table 1. Main macroeconomic and social indicators
Indicator 2000 2005 2007 GDP (USD million) 8,154.32 15,143.72 20,885.73 Trade balance (% GDP) 6.67 26.73 **
Total debt service (% Exports and income) ** ** **
Unemployment (%) 12.2 8 5.6 Population living lower the poverty line ** ** **
Human Development Index 0.8 0.81 **
Sources:The World Bank, ECLAC * Data of 1999 and 2004 **Data not available
2 NATURAL HAZARDS
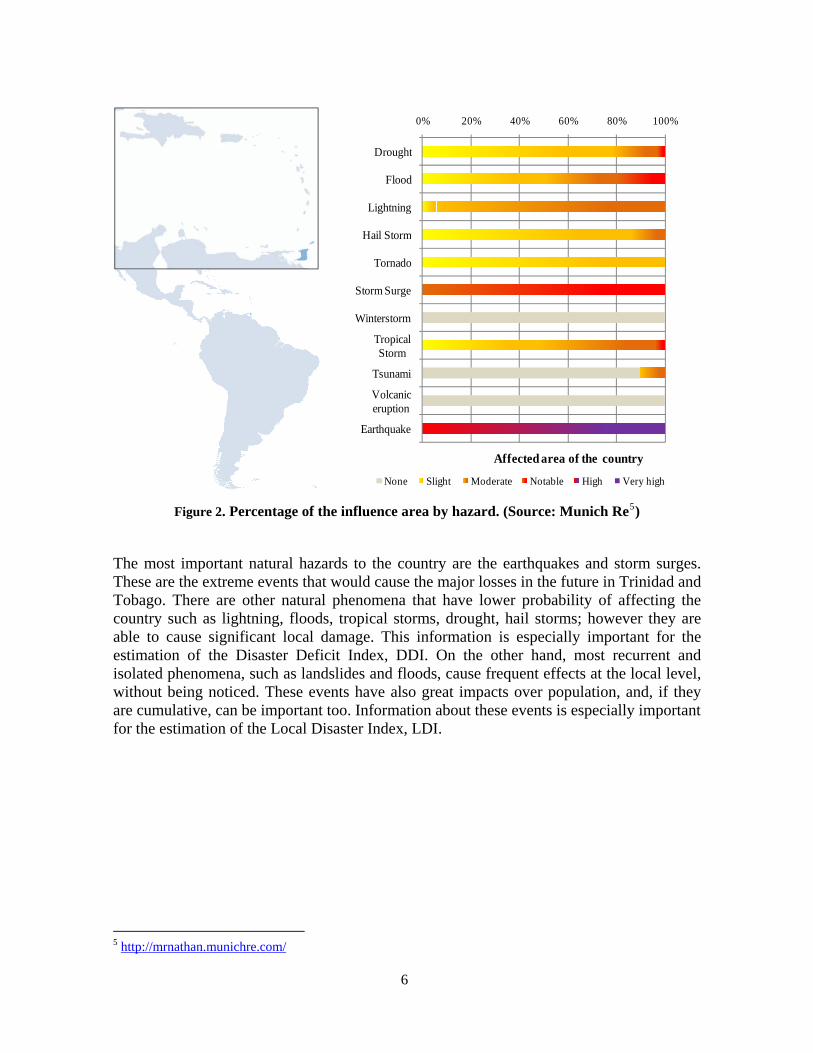
Figure 2 are presented the percentages of the influence area and the severity level of the different hazards in the country. Likewise, Figure 3 presents the classification by mortality risk established by the International Strategy for Disaster Reduction, ISDR. These figures illustrate the events that can be considered as triggers for the estimation of the Disaster Deficit Index, DDI. Other frequent and punctual phenomena as landslides and floods, less visible at national level, are the causes of recurrent effects at local level and may have an important accumulative impact. For this reason they are considered in the estimation of the Local Disaster Index. Appendix I presents a general description of the country’s hazards.
4 Trinidad and Tobago dollar
5
0% 20% 40% 60% 80% 100%
Earthquake
Volcanic eruption
Tsunami
Tropical Storm
Winterstorm
Storm Surge
Tornado
Hail Storm
Lightning
Flood
Drought
Affected area of the country
None Slight Moderate Notable High Very high
Figure 2. Percentage of the influence area by hazard. (Source: Munich Re5)
The most important natural hazards to the country are the earthquakes and storm surges. These are the extreme events that would cause the major losses in the future in Trinidad and Tobago. There are other natural phenomena that have lower probability of affecting the country such as lightning, floods, tropical storms, drought, hail storms; however they are able to cause significant local damage. This information is especially important for the estimation of the Disaster Deficit Index, DDI. On the other hand, most recurrent and isolated phenomena, such as landslides and floods, cause frequent effects at the local level, without being noticed. These events have also great impacts over population, and, if they are cumulative, can be important too. Information about these events is especially important for the estimation of the Local Disaster Index, LDI.
5 http://mrnathan.munichre.com/
6

0 1 2 3 4 5 6 7 8 9 10
Multiple mortality (absolute)
Cyclones (absolute)
Earthquakes (absolute)
Floods (absolute)
Landslides (absolute)
Multiple mortality (relative)
Cyclones (relative)
Earthquakes (relative)
Floods (relative)
Landslides (relative)
UnknownVery LowLowMedium LowMediumMedium HighHighVery HighImportantExtreme
Figure 3. Classification by mortality risk (Source ISDR 2009)
The mortality risk index established by the International Strategy for Disaster Reduction (ISDR), is based on hazard modelling (tropical cyclones, flooding, earthquakes and landslides), taking into account the frequency and severity of the hazard events, human exposure and vulnerability identification. The absolute mortality risk index refers to the average of deaths per year; the relative mortality risk index refers to the average of deaths in proportion to the national population. According to Figure 3, absolute values indicate that mortality risk is medium concentrated due to landslides and very low concentrated due to earthquakes. Likewise, relative mortality risk shows that landslides are classified as medium-high and earthquakes as medium.
3 INDICATORS OF DISASTER RISK AND RISK MANAGEMENT
A summary of the results obtained from the System of Indicators application for Trinidad and Tobago for the period 2001-2005 and later to 2005, as far as information allows, is presented in this section. These results are useful in order to analyze risk and risk management performance in the country, based on information supplied by different national institutions.
3.1 DISASTER DEFICIT INDEX (DDI) The DDI measures the economic loss that a particular country could suffer when a catastrophic event takes place, and the implications in terms of resources needed to address the situation. This index captures the relationship between the demand for contingent resources to cover the losses that the public sector must assume as result of its fiscal responsibility caused by the Maximum Considered Event (MCE) and the public sector’s economic resilience (ER). Losses caused by the MCE are calculated with a model that takes into account, on the one hand, different natural hazards, calculated in probabilistic terms according to historical registers of intensities of the phenomena-and, on the other, the current physical vulnerability that present the exposed elements to those phenomena. The ER is obtained from the estimation of the
7
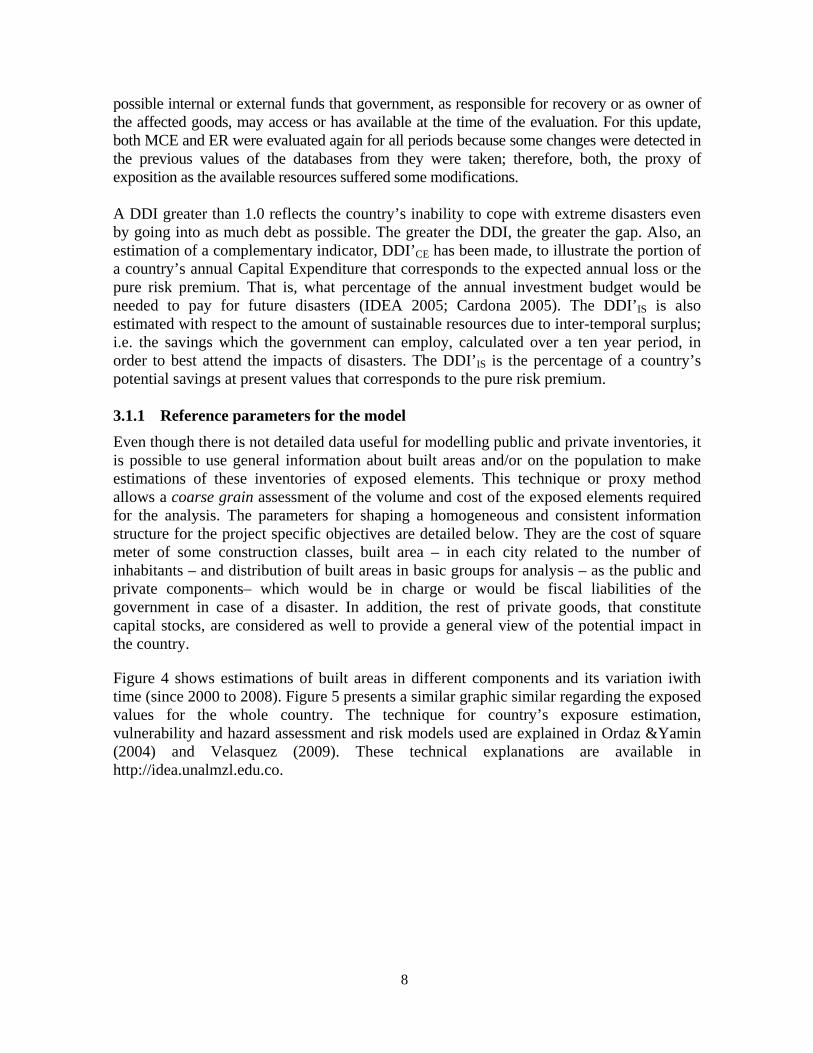
possible internal or external funds that government, as responsible for recovery or as owner of the affected goods, may access or has available at the time of the evaluation. For this update, both MCE and ER were evaluated again for all periods because some changes were detected in the previous values of the databases from they were taken; therefore, both, the proxy of exposition as the available resources suffered some modifications. A DDI greater than 1.0 reflects the country’s inability to cope with extreme disasters even by going into as much debt as possible. The greater the DDI, the greater the gap. Also, an estimation of a complementary indicator, DDI’CE has been made, to illustrate the portion of a country’s annual Capital Expenditure that corresponds to the expected annual loss or the pure risk premium. That is, what percentage of the annual investment budget would be needed to pay for future disasters (IDEA 2005; Cardona 2005). The DDI’IS is also estimated with respect to the amount of sustainable resources due to inter-temporal surplus; i.e. the savings which the government can employ, calculated over a ten year period, in order to best attend the impacts of disasters. The DDI’IS is the percentage of a country’s potential savings at present values that corresponds to the pure risk premium. 3.1.1 Reference parameters for the model Even though there is not detailed data useful for modelling public and private inventories, it is possible to use general information about built areas and/or on the population to make estimations of these inventories of exposed elements. This technique or proxy method allows a coarse grain assessment of the volume and cost of the exposed elements required for the analysis. The parameters for shaping a homogeneous and consistent information structure for the project specific objectives are detailed below. They are the cost of square meter of some construction classes, built area – in each city related to the number of inhabitants – and distribution of built areas in basic groups for analysis – as the public and private components– which would be in charge or would be fiscal liabilities of the government in case of a disaster. In addition, the rest of private goods, that constitute capital stocks, are considered as well to provide a general view of the potential impact in the country.
Figure 4 shows estimations of built areas in different components and its variation iwith time (since 2000 to 2008). Figure 5 presents a similar graphic similar regarding the exposed values for the whole country. The technique for country’s exposure estimation, vulnerability and hazard assessment and risk models used are explained in Ordaz &Yamin (2004) and Velasquez (2009). These technical explanations are available in http://idea.unalmzl.edu.co.
8
0
5
10
15
20
25
1995 2000 2005 2008
Áre
a (K
m2 )
Area Total Area Pública Area población ESEB
Figure 4. Total built areas by component in square km
02468
10121416
1995 2000 2005 2008
Mile
s de
mill
ones
de
USD
1820
Valor Total Valor Público Valor población ESEB
Figure 5. Exposed value by component in billion dollars
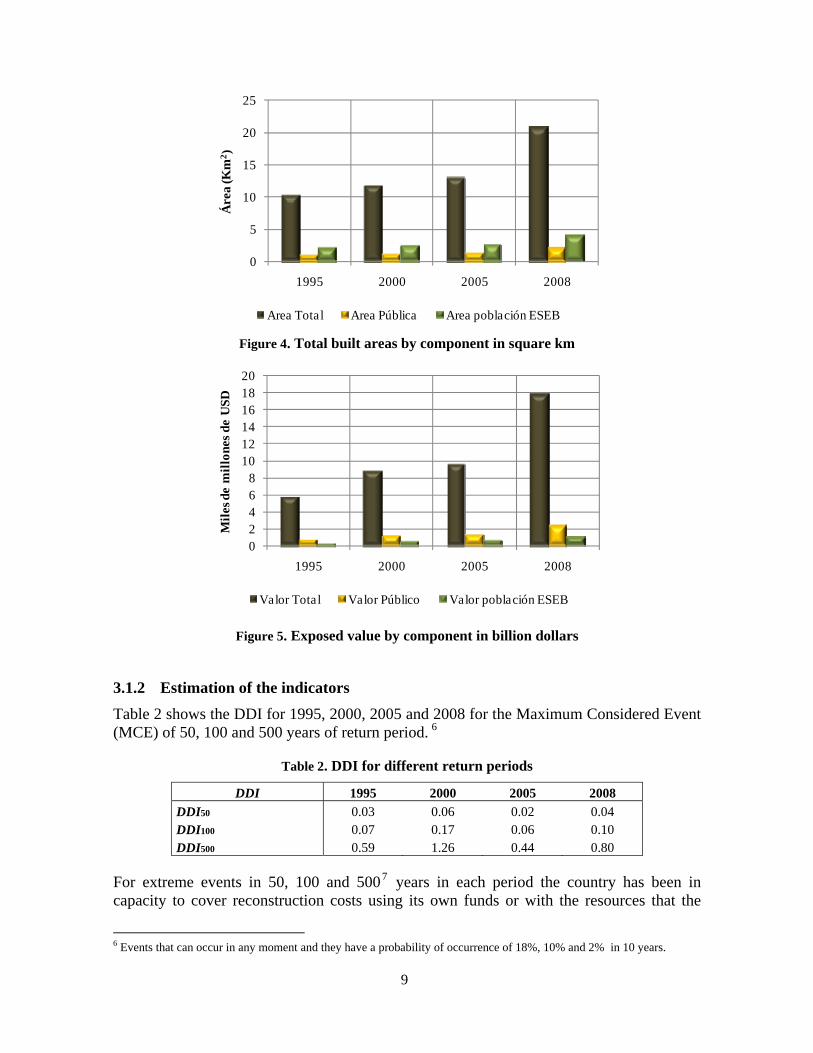
3.1.2 Estimation of the indicators Table 2 shows the DDI for 1995, 2000, 2005 and 2008 for the Maximum Considered Event (MCE) of 50, 100 and 500 years of return period. 6
Table 2. DDI for different return periods
DDI 1995 2000 2005 2008 DDI50 0.03 0.06 0.02 0.04 DDI100 0.07 0.17 0.06 0.10 DDI500 0.59 1.26 0.44 0.80
For extreme events in 50, 100 and 5007 years in each period the country has been in capacity to cover reconstruction costs using its own funds or with the resources that the
6 Events that can occur in any moment and they have a probability of occurrence of 18%, 10% and 2% in 10 years.
9
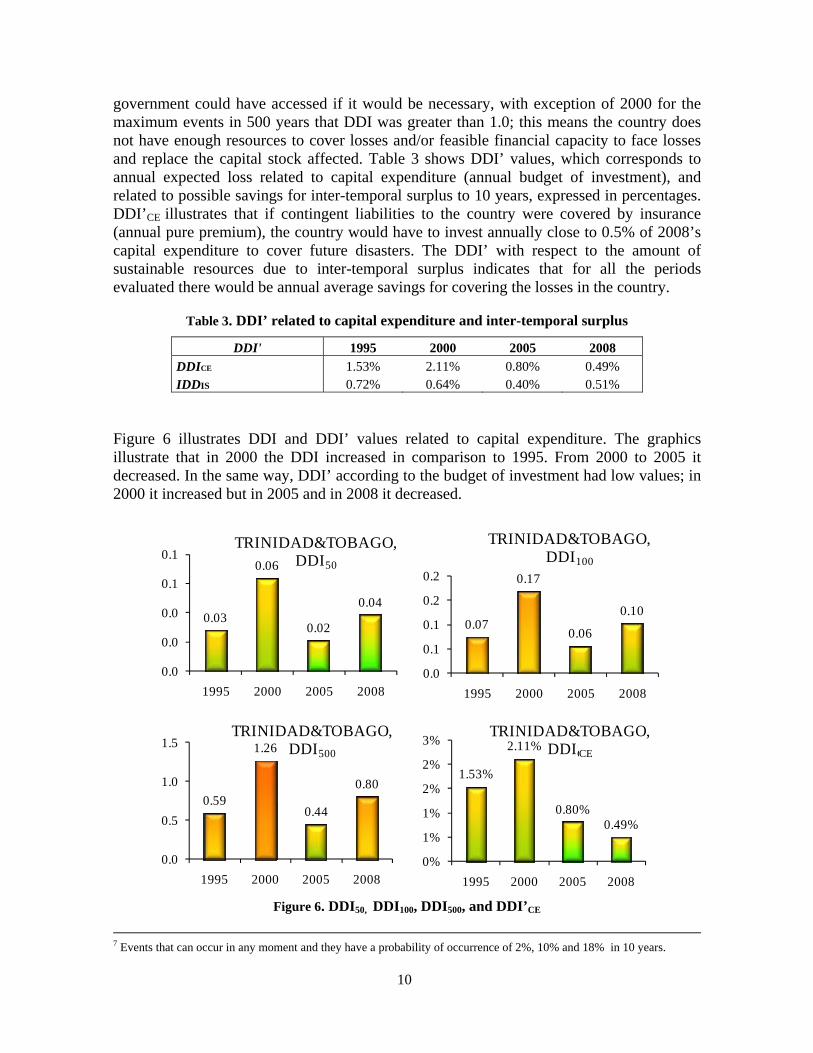
government could have accessed if it would be necessary, with exception of 2000 for the maximum events in 500 years that DDI was greater than 1.0; this means the country does not have enough resources to cover losses and/or feasible financial capacity to face losses and replace the capital stock affected. Table 3 shows DDI’ values, which corresponds to annual expected loss related to capital expenditure (annual budget of investment), and related to possible savings for inter-temporal surplus to 10 years, expressed in percentages. DDI’CE illustrates that if contingent liabilities to the country were covered by insurance (annual pure premium), the country would have to invest annually close to 0.5% of 2008’s capital expenditure to cover future disasters. The DDI’ with respect to the amount of sustainable resources due to inter-temporal surplus indicates that for all the periods evaluated there would be annual average savings for covering the losses in the country.
Table 3. DDI’ related to capital expenditure and inter-temporal surplus
DDI' 1995 2000 2005 2008 DDICE 1.53% 2.11% 0.80% 0.49% IDDIS 0.72% 0.64% 0.40% 0.51%
Figure 6 illustrates DDI and DDI’ values related to capital expenditure. The graphics illustrate that in 2000 the DDI increased in comparison to 1995. From 2000 to 2005 it decreased. In the same way, DDI’ according to the budget of investment had low values; in 2000 it increased but in 2005 and in 2008 it decreased.
0.03
0.06
0.02
0.04
0.0
0.0
0.0
0.1
0.1
1995 2000 2005 2008
TRINIDAD&TOBAGO, DDI50
0.07
0.17
0.06
0.10
0.0
0.1
0.1
0.2
0.2
1995 2000 2005 2008
DDI100
TRINIDAD&TOBAGO,
0.59
1.26
0.44
0.80
0.0
0.5
1.0
1.5
1995 2000 2005 2008
TRINIDAD&TOBAGO, DDI500
1.53%
2.11%
0.80%0.49%
0%
1%
1%
2%
2%
3%
1995 2000 2005 2008
TRINIDAD&TOBAGO, DDIGCCE
Figure 6. DDI50, DDI100, DDI500, and DDI’CE
7 Events that can occur in any moment and they have a probability of occurrence of 2%, 10% and 18% in 10 years.
10
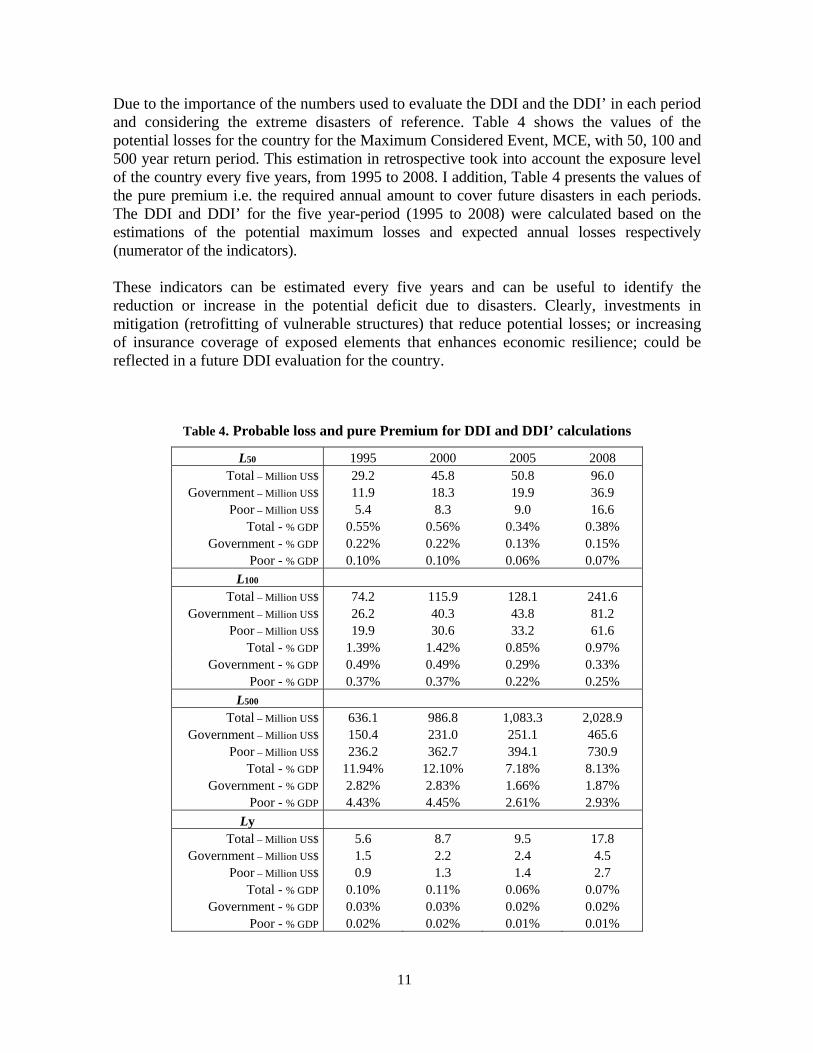
Due to the importance of the numbers used to evaluate the DDI and the DDI’ in each period and considering the extreme disasters of reference. Table 4 shows the values of the potential losses for the country for the Maximum Considered Event, MCE, with 50, 100 and 500 year return period. This estimation in retrospective took into account the exposure level of the country every five years, from 1995 to 2008. I addition, Table 4 presents the values of the pure premium i.e. the required annual amount to cover future disasters in each periods. The DDI and DDI’ for the five year-period (1995 to 2008) were calculated based on the estimations of the potential maximum losses and expected annual losses respectively (numerator of the indicators). These indicators can be estimated every five years and can be useful to identify the reduction or increase in the potential deficit due to disasters. Clearly, investments in mitigation (retrofitting of vulnerable structures) that reduce potential losses; or increasing of insurance coverage of exposed elements that enhances economic resilience; could be reflected in a future DDI evaluation for the country.
Table 4. Probable loss and pure Premium for DDI and DDI’ calculations
L50 1995 2000 2005 2008 Total – Million US$ 29.2 45.8 50.8 96.0
Government – Million US$ 11.9 18.3 19.9 36.9 Poor – Million US$ 5.4 8.3 9.0 16.6
Total - % GDP 0.55% 0.56% 0.34% 0.38% Government - % GDP 0.22% 0.22% 0.13% 0.15%
Poor - % GDP 0.10% 0.10% 0.06% 0.07% L100
Total – Million US$ 74.2 115.9 128.1 241.6 Government – Million US$ 26.2 40.3 43.8 81.2
Poor – Million US$ 19.9 30.6 33.2 61.6 Total - % GDP 1.39% 1.42% 0.85% 0.97%
Government - % GDP 0.49% 0.49% 0.29% 0.33% Poor - % GDP 0.37% 0.37% 0.22% 0.25%
L500 Total – Million US$ 636.1 986.8 1,083.3 2,028.9
Government – Million US$ 150.4 231.0 251.1 465.6 Poor – Million US$ 236.2 362.7 394.1 730.9
Total - % GDP 11.94% 12.10% 7.18% 8.13% Government - % GDP 2.82% 2.83% 1.66% 1.87%
Poor - % GDP 4.43% 4.45% 2.61% 2.93% Ly
Total – Million US$ 5.6 8.7 9.5 17.8 Government – Million US$ 1.5 2.2 2.4 4.5
Poor – Million US$ 0.9 1.3 1.4 2.7 Total - % GDP 0.10% 0.11% 0.06% 0.07%
Government - % GDP 0.03% 0.03% 0.02% 0.02% Poor - % GDP 0.02% 0.02% 0.01% 0.01%
11
Table 5 presents possible internal and external funds that the government needs to access at the time of the evaluation in order to face the losses in case of an extreme disaster. The sum of these available or usable possible funds corresponds to the economic resilience between 1995 and 2008 every five years. Based on these estimations (denominator of the indicator) the DDI was calculated for the different periods. The current results present some differences in comparison with those previously obtained in the first phase of the Program of Indicators IDB-IDEA for the preceding periods, due to, on one hand, improvements in the proxy of the exposed assets of the countries were made, and, on the other hand, some indicators related with funds related to the economic resilience were adjusted in the original databases. Likewise, in some cases new data and sources of information of the Economic Commission for Latin-America and the Caribbean (ECLAC) and the Inter-American Development Bank (Latin Macro Watch Country Tables) were used. Previous version (IDEA, 2005) had into account national government values and, within public corporations, non-financial public sector, nevertheless in some cases that information was incomplete. DDI for 2008 was calculated based on the most recent available information on exposed elements, references of the build areas and their cost values. They have been established according to still tentative data and statistical information that may change in the future. In addition, the economic resilience (denominator of the index) was estimated in terms of GDP for each fund taking as reference economic information available for 2006 and 2007 due to current gaps; i.e. information that have not yet been incorporated in the databases. This means that the recent results of DDI may vary once the data is consolidated.
12
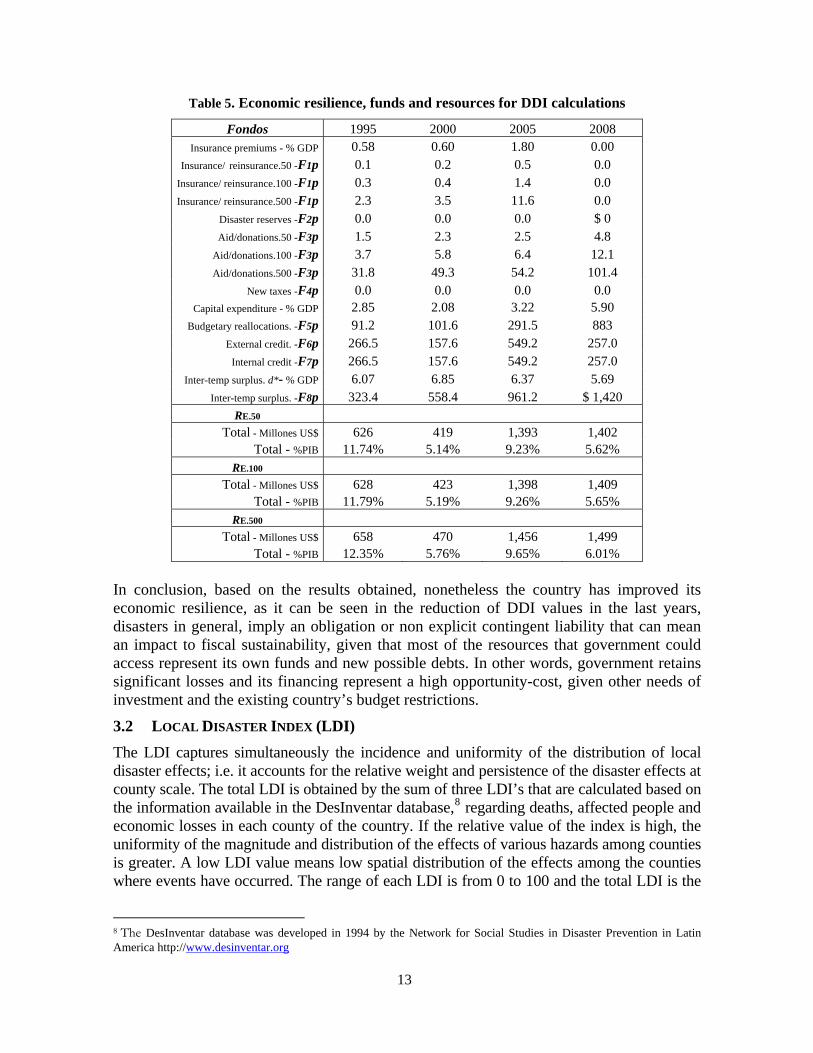
Table 5. Economic resilience, funds and resources for DDI calculations
Fondos 1995 2000 2005 2008 Insurance premiums - % GDP 0.58 0.60 1.80 0.00
Insurance/ reinsurance.50 -F1p 0.1 0.2 0.5 0.0 Insurance/ reinsurance.100 -F1p 0.3 0.4 1.4 0.0 Insurance/ reinsurance.500 -F1p 2.3 3.5 11.6 0.0
Disaster reserves -F2p 0.0 0.0 0.0 $ 0 Aid/donations.50 -F3p 1.5 2.3 2.5 4.8
Aid/donations.100 -F3p 3.7 5.8 6.4 12.1 Aid/donations.500 -F3p 31.8 49.3 54.2 101.4
New taxes -F4p 0.0 0.0 0.0 0.0 Capital expenditure - % GDP 2.85 2.08 3.22 5.90
Budgetary reallocations. -F5p 91.2 101.6 291.5 883 External credit. -F6p 266.5 157.6 549.2 257.0
Internal credit -F7p 266.5 157.6 549.2 257.0 Inter-temp surplus. d*- % GDP 6.07 6.85 6.37 5.69
Inter-temp surplus. -F8p 323.4 558.4 961.2 $ 1,420 RE.50
Total - Millones US$ 626 419 1,393 1,402 Total - %PIB 11.74% 5.14% 9.23% 5.62%
RE.100 Total - Millones US$ 628 423 1,398 1,409
Total - %PIB 11.79% 5.19% 9.26% 5.65% RE.500
Total - Millones US$ 658 470 1,456 1,499 Total - %PIB 12.35% 5.76% 9.65% 6.01%
In conclusion, based on the results obtained, nonetheless the country has improved its economic resilience, as it can be seen in the reduction of DDI values in the last years, disasters in general, imply an obligation or non explicit contingent liability that can mean an impact to fiscal sustainability, given that most of the resources that government could access represent its own funds and new possible debts. In other words, government retains significant losses and its financing represent a high opportunity-cost, given other needs of investment and the existing country’s budget restrictions.
3.2 LOCAL DISASTER INDEX (LDI) The LDI captures simultaneously the incidence and uniformity of the distribution of local disaster effects; i.e. it accounts for the relative weight and persistence of the disaster effects at county scale. The total LDI is obtained by the sum of three LDI’s that are calculated based on the information available in the DesInventar database,8 regarding deaths, affected people and economic losses in each county of the country. If the relative value of the index is high, the uniformity of the magnitude and distribution of the effects of various hazards among counties is greater. A low LDI value means low spatial distribution of the effects among the counties where events have occurred. The range of each LDI is from 0 to 100 and the total LDI is the
8 The DesInventar database was developed in 1994 by the Network for Social Studies in Disaster Prevention in Latin America http://www.desinventar.org
13
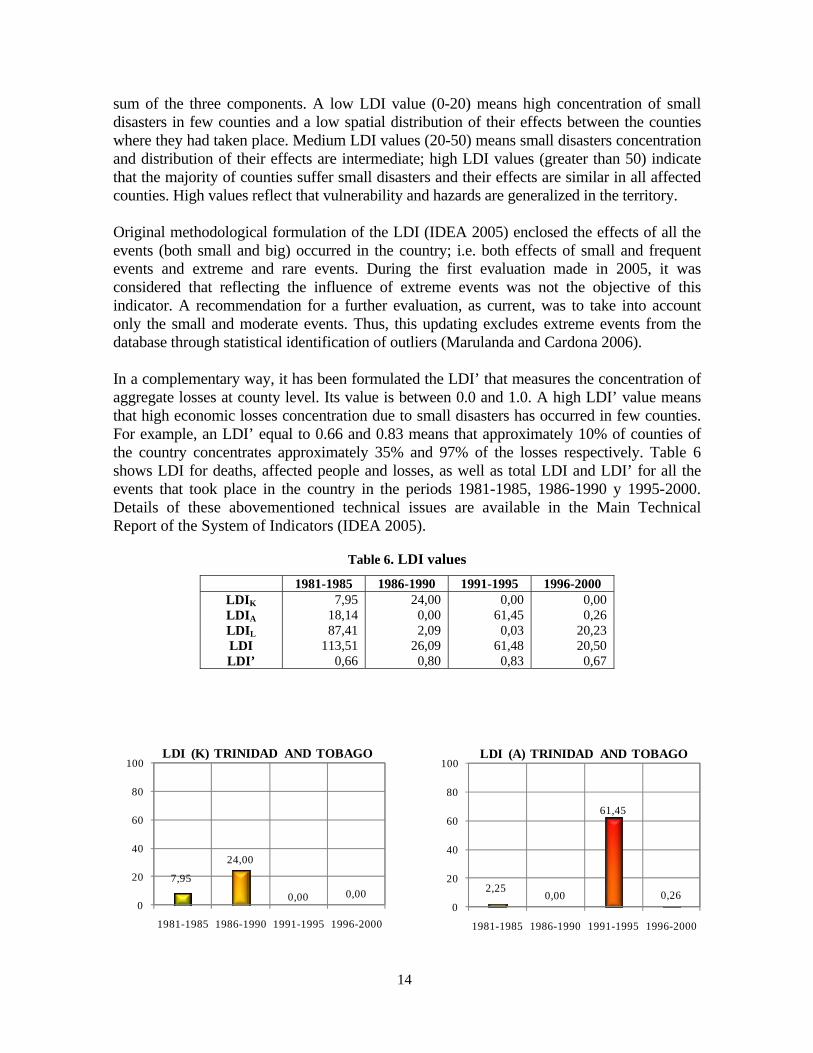
sum of the three components. A low LDI value (0-20) means high concentration of small disasters in few counties and a low spatial distribution of their effects between the counties where they had taken place. Medium LDI values (20-50) means small disasters concentration and distribution of their effects are intermediate; high LDI values (greater than 50) indicate that the majority of counties suffer small disasters and their effects are similar in all affected counties. High values reflect that vulnerability and hazards are generalized in the territory. Original methodological formulation of the LDI (IDEA 2005) enclosed the effects of all the events (both small and big) occurred in the country; i.e. both effects of small and frequent events and extreme and rare events. During the first evaluation made in 2005, it was considered that reflecting the influence of extreme events was not the objective of this indicator. A recommendation for a further evaluation, as current, was to take into account only the small and moderate events. Thus, this updating excludes extreme events from the database through statistical identification of outliers (Marulanda and Cardona 2006). In a complementary way, it has been formulated the LDI’ that measures the concentration of aggregate losses at county level. Its value is between 0.0 and 1.0. A high LDI’ value means that high economic losses concentration due to small disasters has occurred in few counties. For example, an LDI’ equal to 0.66 and 0.83 means that approximately 10% of counties of the country concentrates approximately 35% and 97% of the losses respectively. Table 6 shows LDI for deaths, affected people and losses, as well as total LDI and LDI’ for all the events that took place in the country in the periods 1981-1985, 1986-1990 y 1995-2000. Details of these abovementioned technical issues are available in the Main Technical Report of the System of Indicators (IDEA 2005).
Table 6. LDI values
1981-1985 1986-1990 1991-1995 1996-2000 LDIK 7,95 24,00 0,00 0,00 LDIA 18,14 0,00 61,45 0,26 LDIL 87,41 2,09 0,03 20,23 LDI 113,51 26,09 61,48 20,50 LDI’ 0,66 0,80 0,83 0,67
14
7,95
24,00
0,00 0,000
20
40
60
80
100
1981-1985 1986-1990 1991-1995 1996-2000
LDI (K) TRINIDAD AND TOBAGO
2,250,00
61,45
0,260
20
40
60
80
100
1981-1985 1986-1990 1991-1995 1996-2000
LDI (A) TRINIDAD AND TOBAGO
32,90
2,09 0,03
20,23
0
20
40
60
80
100
1981-1985 1986-1990 1991-1995 1996-2000
LDI (L) TRINIDAD AND TOBAGO
0,66
0,80 0,83
0,67
0,00
0,20
0,40
0,60
0,80
1,00
1981-1985 1986-1990 1991-1995 1996-2000
LDI' TRINIDAD AND TOBAGO
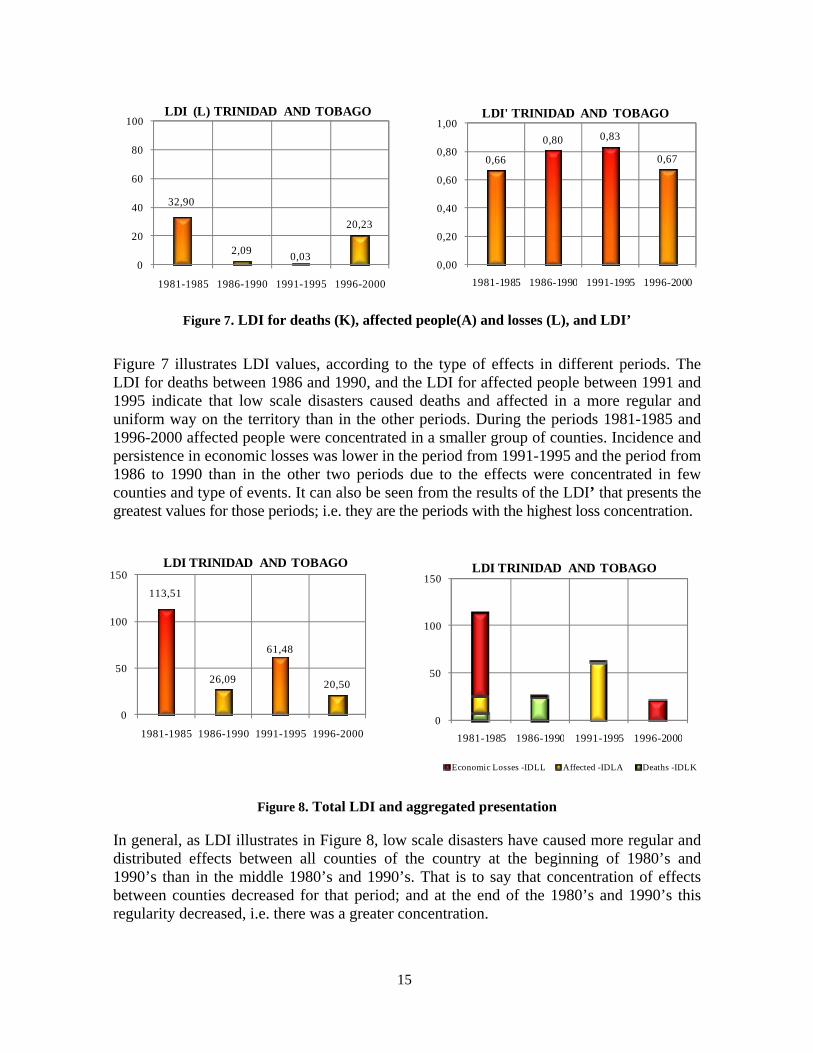
Figure 7. LDI for deaths (K), affected people(A) and losses (L), and LDI’
Figure 7 illustrates LDI values, according to the type of effects in different periods. The LDI for deaths between 1986 and 1990, and the LDI for affected people between 1991 and 1995 indicate that low scale disasters caused deaths and affected in a more regular and uniform way on the territory than in the other periods. During the periods 1981-1985 and 1996-2000 affected people were concentrated in a smaller group of counties. Incidence and persistence in economic losses was lower in the period from 1991-1995 and the period from 1986 to 1990 than in the other two periods due to the effects were concentrated in few counties and type of events. It can also be seen from the results of the LDI’ that presents the greatest values for those periods; i.e. they are the periods with the highest loss concentration.
113,51
26,09
61,48
20,50
0
50
100
150
1981-1985 1986-1990 1991-1995 1996-2000
LDI TRINIDAD AND TOBAGO
0
50
100
150
1981-1985 1986-1990 1991-1995 1996-2000
LDI TRINIDAD AND TOBAGO
Economic Losses -IDLL Affected -IDLA Deaths -IDLK
Figure 8. Total LDI and aggregated presentation
In general, as LDI illustrates in Figure 8, low scale disasters have caused more regular and distributed effects between all counties of the country at the beginning of 1980’s and 1990’s than in the middle 1980’s and 1990’s. That is to say that concentration of effects between counties decreased for that period; and at the end of the 1980’s and 1990’s this regularity decreased, i.e. there was a greater concentration.
15
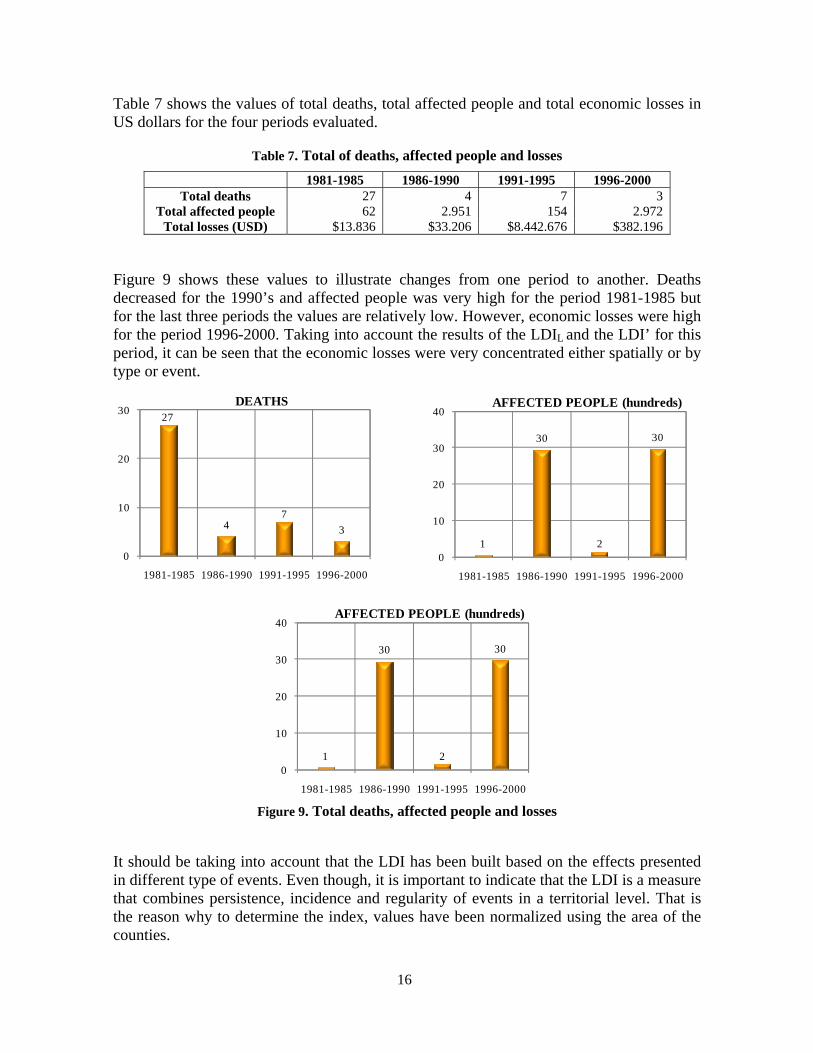
Table 7 shows the values of total deaths, total affected people and total economic losses in US dollars for the four periods evaluated.
Table 7. Total of deaths, affected people and losses
1981-1985 1986-1990 1991-1995 1996-2000 Total deaths 27 4 7 3
Total affected people 62 2.951 154 2.972 Total losses (USD) $13.836 $33.206 $8.442.676 $382.196
Figure 9 shows these values to illustrate changes from one period to another. Deaths decreased for the 1990’s and affected people was very high for the period 1981-1985 but for the last three periods the values are relatively low. However, economic losses were high for the period 1996-2000. Taking into account the results of the LDIL and the LDI’ for this period, it can be seen that the economic losses were very concentrated either spatially or by type or event.
27
47
3
0
10
20
30
1981-1985 1986-1990 1991-1995 1996-2000
DEATHS
1
30
2
30
0
10
20
30
40
1981-1985 1986-1990 1991-1995 1996-2000
AFFECTED PEOPLE (hundreds)
1
30
2
30
0
10
20
30
40
1981-1985 1986-1990 1991-1995 1996-2000
AFFECTED PEOPLE (hundreds)
Figure 9. Total deaths, affected people and losses
It should be taking into account that the LDI has been built based on the effects presented in different type of events. Even though, it is important to indicate that the LDI is a measure that combines persistence, incidence and regularity of events in a territorial level. That is the reason why to determine the index, values have been normalized using the area of the counties.
16
These indices are useful for economic analysts and sectoral officials, related to the promotion of rural and urban policy development, because they can detect the persistency and accumulation of effects of local disasters. They can stimulate the consideration of risk problems in territorial planning at the local level and the intervention and protection of hydrologic basins, and they can justify resource transfers to the local level with specific goals of risk management and the creation of social security nets. 3.3 PREVALENT VULNERABILITY INDEX (PVI) PVI characterizes predominating vulnerability conditions reflected in exposure in prone areas, socioeconomic fragility and lack of social resilience; aspects that favour the direct impact and the indirect and intangible impact in case of the occurrence of a hazard event. This index is a composite indicator that depicts comparatively a situation or pattern in a country and its causes or factors. This is so to the extent that the vulnerability conditions that underlie the notion of risk are, on the one hand, problems caused by inadequate economic growth and, on the other hand, deficiencies that may be intervened via adequate development processes. PVI reflects susceptibility due to the level of physical exposure of goods and people (PVIES) that favours direct impact in case of hazard events. It also reflects social and economic conditions that favour indirect and intangible impact (PVISF). And it reflects lack of capacity to anticipate, to absorb consequences, to efficiently respond and to recover (PVILR) (IDEA 2005; Cardona 2005). PVI varies between 0 and 100, a value of 80 means very high vulnerability, from 40 to 80 means high, from 20 to 40 is a medium value and less than 20 means low. In the new phase of the Program of Indicators, for the countries already evaluated, the PVI was calculated again for all the periods as various values of the databases that were not known, are currently available or have been modified as a result of revisions that were made after the previous evaluation of the index. Modifications in maximum and minimum reference values were also made for this new evaluation in order to standardize the values of the subindicators in a uniform manner for old and new countries evaluated. 3.3.1 Indicators of exposure and susceptibility
In the case of exposure and/or physical susceptibility, PVIES, the indicators that best represent this function are those that represent susceptible population, assets, investment, production, livelihoods, essential patrimony, and human activities. Other indicators of this type may be found with population, agricultural and urban growth and densification rates. These indicators are detailed below:
ES1. Population growth, avg. annual rate, % ES2. Urban growth, avg. annual rate, % ES3. Population density, people (5 Km2) ES4. Poverty-population below US$ 1 per day PPP ES5. Capital stock, million US$ dollar/1000 km2 ES6. Imports and exports of goods and services, % GDP ES7. Gross domestic fixed investment, % of GDP
17
ES8. Arable land and permanent crops, % land area. These indicators are variables that reflect a notion of susceptibility when faced with dangerous events, regardless of the nature or severity of these. “To be exposed and susceptible is a necessary condition for the existence of risk”. Despite the fact that in any strict sense it would be necessary to establish if the exposure is relevant when faced with each feasible type of event, it is possible to assert that certain variables comprise a comparatively adverse situation where we suppose that natural hazards exist as a permanent external factor, even without establishing precisely their characteristics. 3.3.2 Indicators of socio-economic fragility Socio-economic fragility, PVISF, may be represented by indicators such as poverty, human insecurity, dependency, illiteracy, social disparities, unemployment, inflation, debt and environmental deterioration. These are indicators that reflect relative weaknesses and conditions of deterioration that would increase the direct effects associated with dangerous phenomenon. Even though such effects are not necessarily accumulative and in some cases may be redundant or correlated, their influence is especially important at the social and economic levels. Those indicators are the following:
SF1. Human Poverty Index, HPI-1. SF2. Dependents as proportion of working age population SF3. Social disparity, concentration of income measured using Gini index. SF4. Unemployment, as % of total labour force. SF5. Inflation, food prices, annual % SF6. Dependency of GDP growth of agriculture, annual % SF7. Debt servicing, % of GDP. SF8. Human-induced Soil Degradation (GLASOD).
These indicators are variables that reflect, in general, an adverse and intrinsic 9 predisposition of society when faced with a dangerous phenomenon, regardless of the nature and intensity of these events. “The predisposition to be affected” is a vulnerability condition although in a strict sense it would be necessary to establish the relevance of this affirmation when faced with all and individual feasible types of hazard. Nevertheless, as is the case with exposure, it is possible to suggest that certain variables reflect a comparatively unfavourable situation, supposing that the natural hazards exist as a permanent external factor irrespective of their exact characteristics. 3.3.3 Indicators of resilience (lack of) The lack of resilience, PVILR, seen as a vulnerability factor, may be represented at all levels by means of the complementary or inverted10 treatment of a number of variables related to human development levels, human capital, economic redistribution, governance, financial protection, collective perceptions, preparedness to face crisis situations, and environmental
9 Also it is denominated as inherent vulnerability. It means, own socio-economic conditions of the communities that favour or facilitate the occurrence of effects on them. 10 The symbol [Inv] is used here to indicate a reverse or inverted dealing of the variable (¬R = 1- R).
18
protection. This collection of indicators on their own and particularly where they are disaggregated at the local level could help in the identification and orientation of actions that should be promoted, strengthened or prioritized in order to increase human security.
LR1. Human Development Index, HDI [Inv] LR2. Gender-related Development Index, GDI [Inv] LR3. Social expenditure; on pensions, health, and education, % of GDP [Inv] LR4. Governance Index (Kaufmann) [Inv] LR5. Insurance of infrastructure and housing, % of GD [Inv] LR6. Television sets per 1000 people [Inv] LR7. Hospital beds per 1000 people [Inv] LR8. Environmental Sustainability Index, ESI [Inv]
These indicators are variables that capture in a macro fashion the capacity to recover from or absorb the impact of dangerous phenomena, regardless of their nature and severity. “To not be in the capacity to” adequately face disasters is a vulnerability condition, although in a strict sense it is necessary to establish this with reference to all feasible types of hazard. Nevertheless, as with exposure and fragility, it is possible to admit that certain economic and social variables reflect a comparatively unfavourable situation supposing that natural hazards exist as permanent external factors without establishing their precise characteristics. 3.3.4 Estimation of indicators In general, PVI reflects susceptibility due to the degree of physical exposure of goods and people, PVIES,that favour the direct impact in case of hazard events. In the same way, it reflects conditions of socioeconomic fragility that favour the indirect and intangible impact, PVISF. Also, it reflects lack of capacity to absorb consequences, for efficient response and recovery, PVILR. Reduction of these kinds of factors, as the purpose of the human sustainable development process and explicit policies for risk reduction, is one of the aspects that should be emphasized. Table 8 shows the total PVI and its components related to exposure and susceptibility, socio-economic fragility and lack of resilience. It is important to point out that, for inclusion of subindicators which do not have a recent value, the same value was used in all periods, in order to avoid affecting relative value of indices and with the hope that in future the value of these subindicators will be published.
Table 8. PVI values
1995 2000 2005 2007PVIES 44,856 47,647 46,211 45,140PVIS F 29,157 25,904 21,181 20,475PVILR 60,899 60,731 64,880 64,896
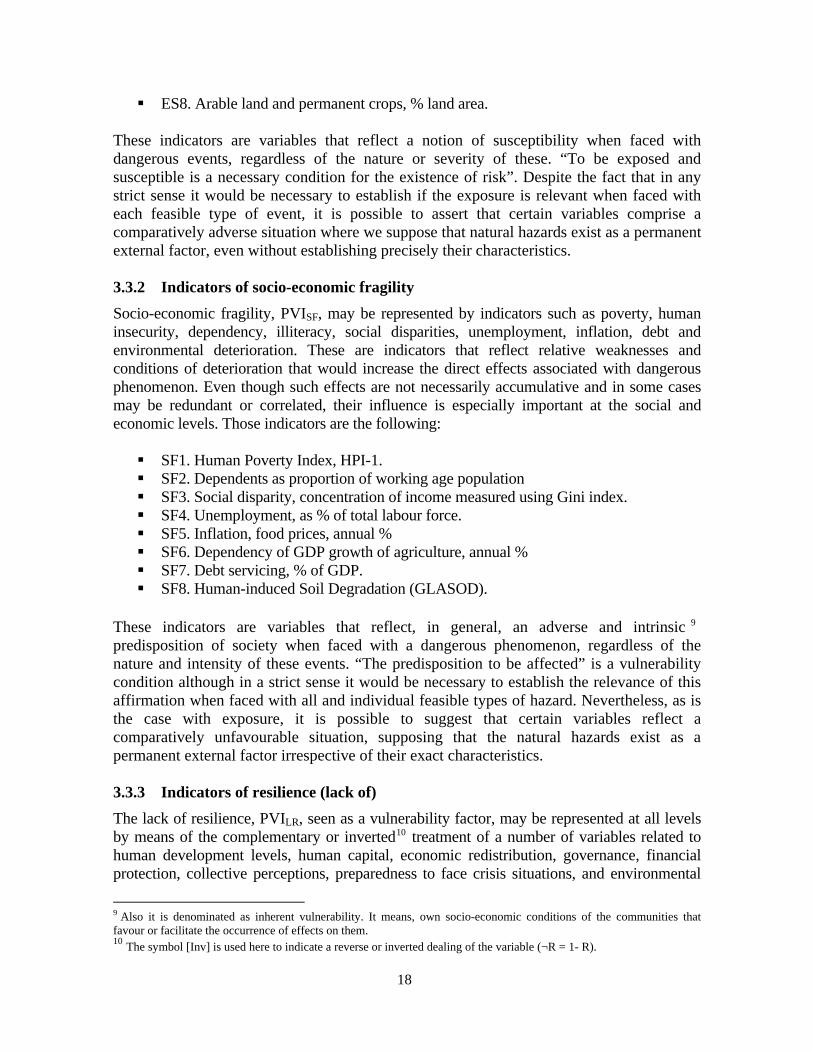
PVI 44,971 44,760 44,091 43,504 Figure 10 shows non scaled subindicators values that compose PVIES and their respective weights, which were obtained using Analytic Hierarchy Process (AHP).
19
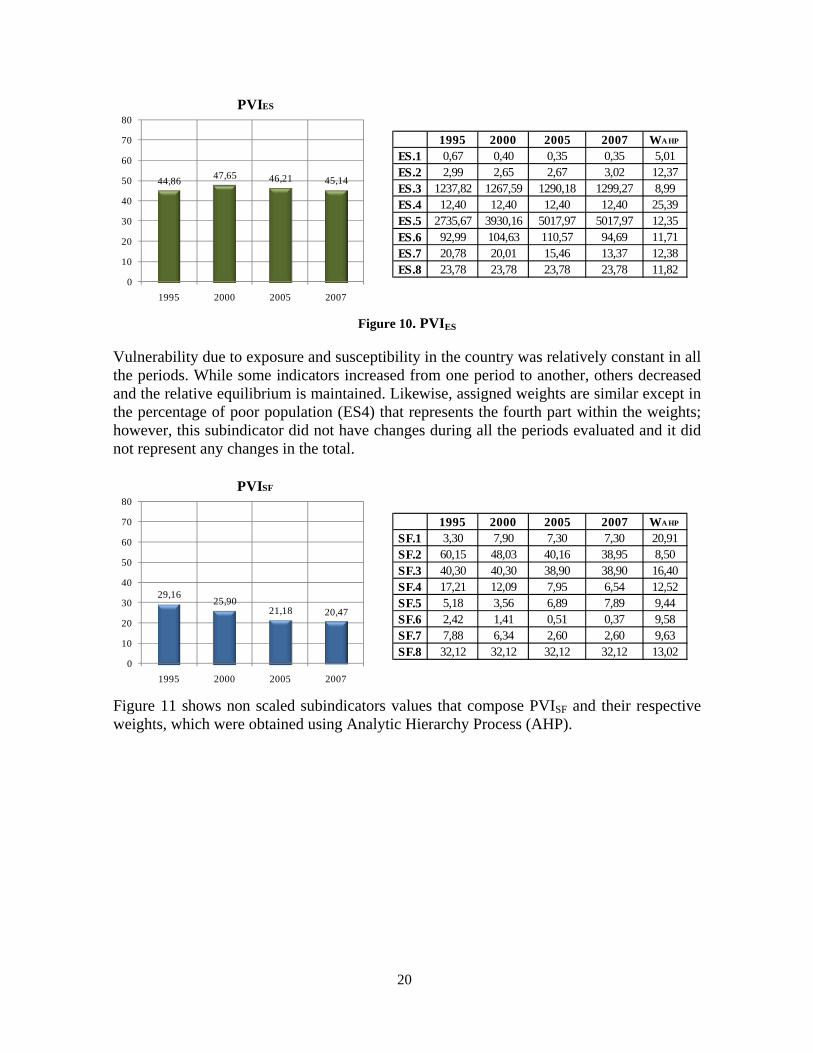
Figure 10. PVIES
44,86 47,65 46,21 45,14
0
10
20
30
40
50
60
70
80
1995 2000 2005 2007
PVIES
1995 2000 2005 2007 WA HP
ES.1 0,67 0,40 0,35 0,35 5,01ES.2 2,99 2,65 2,67 3,02 12,37ES.3 1237,82 1267,59 1290,18 1299,27 8,99ES.4 12,40 12,40 12,40 12,40 25,39ES.5 2735,67 3930,16 5017,97 5017,97 12,35ES.6 92,99 104,63 110,57 94,69 11,71ES.7 20,78 20,01 15,46 13,37 12,38ES.8 23,78 23,78 23,78 23,78 11,82
Vulnerability due to exposure and susceptibility in the country was relatively constant in all the periods. While some indicators increased from one period to another, others decreased and the relative equilibrium is maintained. Likewise, assigned weights are similar except in the percentage of poor population (ES4) that represents the fourth part within the weights; however, this subindicator did not have changes during all the periods evaluated and it did not represent any changes in the total.
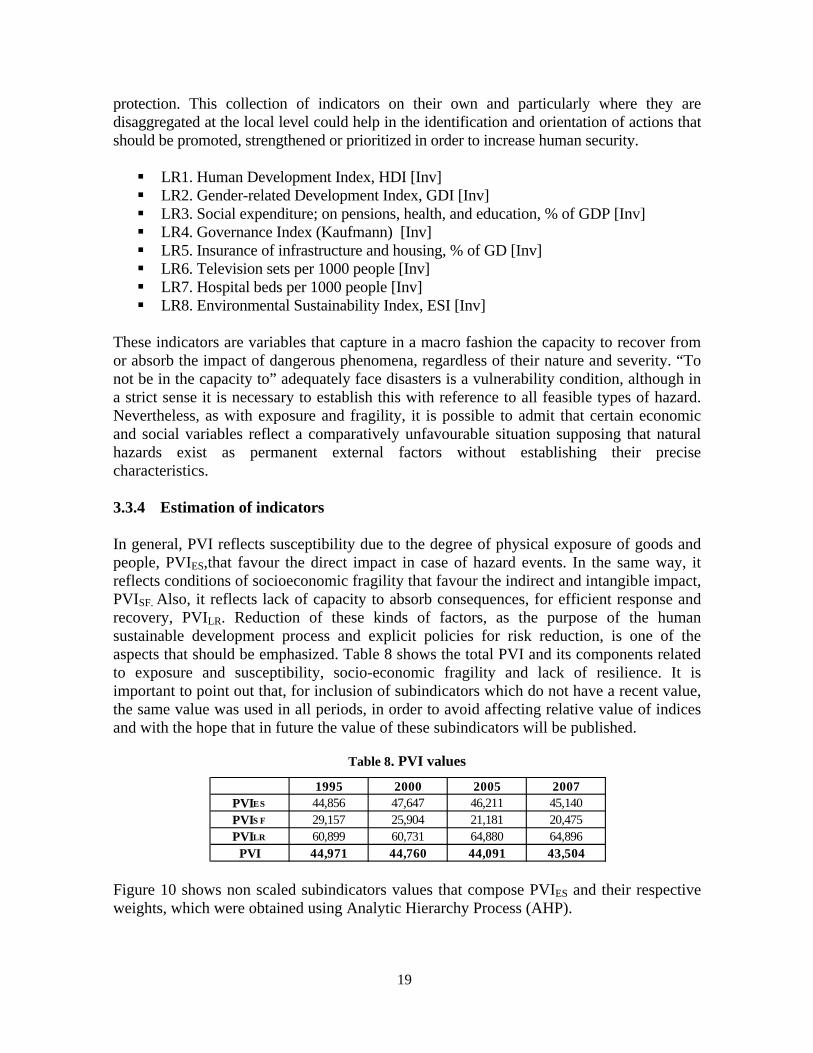
Figure 11 shows non scaled subindicators values that compose PVISF and their respective weights, which were obtained using Analytic Hierarchy Process (AHP).
29,1625,90
21,18 20,47
0
10
20
30
40
50
60
70
80
1995 2000 2005 2007
SFPVI
SF.8 32,12 32,12 32,12 32,12 13,02
1995 2000 2005 2007 WA HP
SF.1 3,30 7,90 7,30 7,30 20,91SF.2 60,15 48,03 40,16 38,95 8,50SF.3 40,30 40,30 38,90 38,90 16,40SF.4 17,21 12,09 7,95 6,54 12,52SF.5 5,18 3,56 6,89 7,89 9,44SF.6 2,42 1,41 0,51 0,37 9,58SF.7 7,88 6,34 2,60 2,60 9,63
20
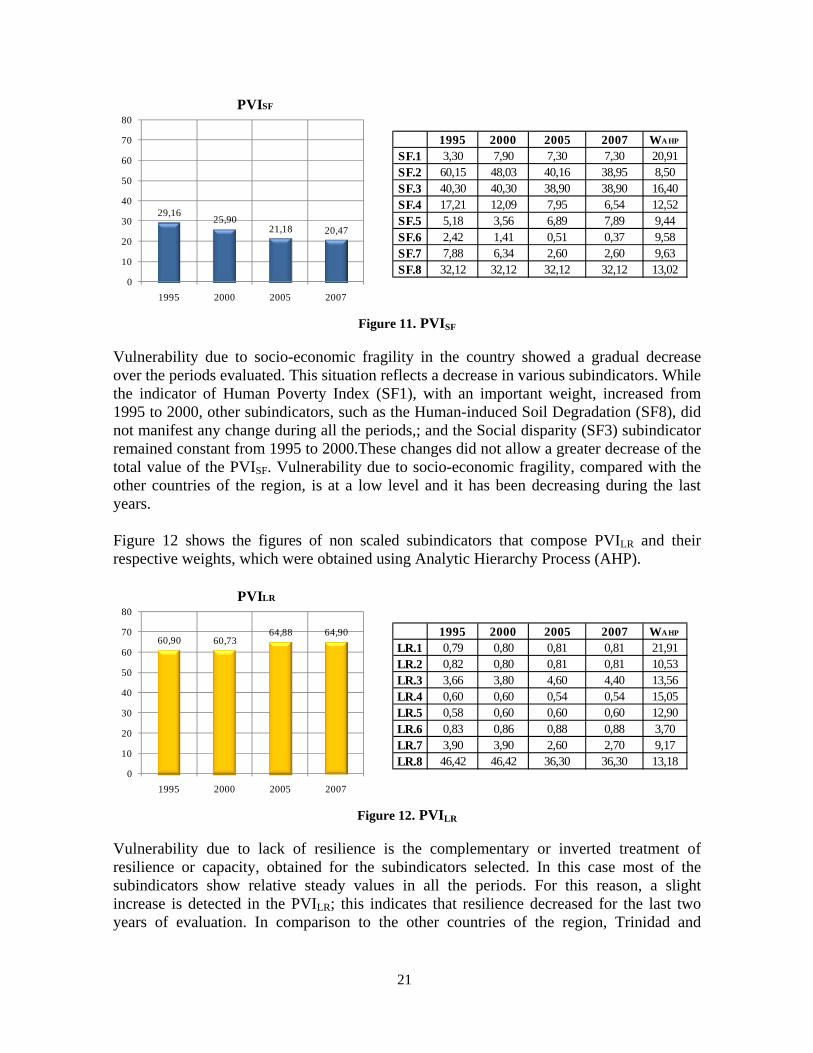
Figure 11. PVISF
29,1625,90
21,18 20,47
0
10
20
30
40
50
60
70
80
1995 2000 2005 2007
PVISF
1995 2000 2005 2007 WA HP
SF.1 3,30 7,90 7,30 7,30 20,91SF.2 60,15 48,03 40,16 38,95 8,50SF.3 40,30 40,30 38,90 38,90 16,40SF.4 17,21 12,09 7,95 6,54 12,52SF.5 5,18 3,56 6,89 7,89 9,44SF.6 2,42 1,41 0,51 0,37 9,58SF.7 7,88 6,34 2,60 2,60 9,63SF.8 32,12 32,12 32,12 32,12 13,02
Vulnerability due to socio-economic fragility in the country showed a gradual decrease over the periods evaluated. This situation reflects a decrease in various subindicators. While the indicator of Human Poverty Index (SF1), with an important weight, increased from 1995 to 2000, other subindicators, such as the Human-induced Soil Degradation (SF8), did not manifest any change during all the periods,; and the Social disparity (SF3) subindicator remained constant from 1995 to 2000.These changes did not allow a greater decrease of the total value of the PVISF. Vulnerability due to socio-economic fragility, compared with the other countries of the region, is at a low level and it has been decreasing during the last years. Figure 12 shows the figures of non scaled subindicators that compose PVILR and their respective weights, which were obtained using Analytic Hierarchy Process (AHP).
Figure 12. PVILR
60,90 60,7364,88 64,90
0
10
20
30
40
50
60
70
80
1995 2000 2005 2007
LRPVI
LR.8 46,42 46,42 36,30 36,30 13,18
1995 2000 2005 2007 WA HP
LR.1 0,79 0,80 0,81 0,81 21,91LR.2 0,82 0,80 0,81 0,81 10,53LR.3 3,66 3,80 4,60 4,40 13,56LR.4 0,60 0,60 0,54 0,54 15,05LR.5 0,58 0,60 0,60 0,60 12,90LR.6 0,83 0,86 0,88 0,88 3,70LR.7 3,90 3,90 2,60 2,70 9,17
Vulnerability due to lack of resilience is the complementary or inverted treatment of resilience or capacity, obtained for the subindicators selected. In this case most of the subindicators show relative steady values in all the periods. For this reason, a slight increase is detected in the PVILR; this indicates that resilience decreased for the last two years of evaluation. In comparison to the other countries of the region, Trinidad and
21

Tobago has medium-high vulnerability due to lack of resilience; the general indicator value is high and this is the indicator with the greatest contribution to the country’s vulnerability. Figure 13 shows total PVI obtained with average of its component indicators, and its aggregated presentation in order to illustrate their contributions.
Figure 13. PVI
44,97 44,76 44,09 43,50
0
10
20
30
40
50
60
70
80
1995 2000 2005 2007
PVI
44,86 47,65 46,21 45,14
29,16 25,90 21,18 20,47
60,90 60,73 64,88 64,90
0
20
40
60
80
100
120
140
160
1995 2000 2005 2007
PVI
FR
FS
ES
PVI figures illustrate that prevalent vulnerability is constant and do not have notable changes through the years. In 2005 and 2007 the index presented slight decreases due to the slight diminishing of exposure and susceptibility and social fragility. Comparing the three indicators, the lack of resilience is the indicator with the greatest contribution to prevalent vulnerability; a situation that occur also in other countries in the region. In general, this indicator has the main incidence in developing countries. PVI illustrates relationship between risk and development, either because the development model adopted reduces it or increases it. This aspect makes evident the convenience of explicit risk reduction measures; because development actions do not reduce vulnerability automatically. This evaluation can be useful to institutions related to housing and urban development, environment, agriculture, health and social care, economics and planning, to mention some.
3.4 RISK MANAGEMENT INDEX (RMI) The main objective of RMI is to measure the performance of risk management. This index is a qualitative measurement of risk based on pre-established levels (targets) or desirable referents (benchmarking) towards which risk management should be directed, according to its level of advance. For RMI formulation, four components or public policies are considered: risk identification (RI), risk reduction (RR), disaster management (DM) and governance and financial protection (FP). Estimation of each public policy takes into account six subindicators that characterize the performance of management in the country. Assessment of each subindicator is made using five performance levels: low, incipient, significant, outstanding and optimal, that corresponds
22
to a range from 1 to 5, where 1 is the lowest level and 5 the highest. This methodological focus allows using each reference level simultaneously with the “performance objective” and, thus, lets the comparison and identification of results or achievements, towards which governments should direct their efforts of formulation, implementation and evaluation of policies in each case. Once performance levels of each subindicator have been evaluated, through a non-lineal aggregation model, the value of each component of RMI is determined (IDEA 2005; Cardona 2005). The value of each composed element is between 0 and 100, where 0 is the minimum performance level and 100 is the maximum level. Total RMI is the average of the four composed indicators that represent each public policy. When the value of the RMI is high, the performance of risk management in the country is better. 3.4.1 Institutional framework
The Office of Disaster Preparedness and Management (ODPM) was established by Cabinet in January 2005, and is responsible for leading the national effort in protecting public health and safety; restoring essential government services; and providing emergency relief to those affected severely by hazards.
By its very mandate the ODPM is committed to formulating an all-hazard approach to emergency/risk management. This all-hazard approach encompasses a comprehensive framework that includes mitigation, preparedness, response and recovery.
This in and of itself identifies the agency as the principal player in leading the community‘s efforts in preparing for, responding to, and recovering from disasters. However, it must be reiterated that the ODPM is a coordinating entity calling attention to another key role, which is that of mobilising all the key players and resources to bring about the best possible approach to lessening loss of life, and damage to property. These key players include the protective services, all government‘s ministries and agencies, non-governmental organizations, community based organizations, faith based organizations, and the Red Cross. (Source: www.odpm.gov.tt)
3.4.2 Indicators of risk identification The identification of risk generally includes the need to understand individual perceptions and social representations and provide objective estimates. In order to intervene in risk it is necessary to recognize its existence11 , dimension it (measurement) and represent it, for example by means of models, maps and indices that are significant for society and decision makers. Methodologically, it includes the evaluation of hazards, the different aspects of vulnerability when faced with these hazards and estimations as regards the occurrence of possible consequences during a particular exposure time. The measurement of risk seen as a
11 That is to say, it has to be a problem for someone. Risk may exist but not perceived in its real dimensions by individuals, decision makers and society in general. To measure or dimension risk in an appropriate manner is to make it apparent and recognized, which in itself means that something has to be done about it. Without adequate identification of risk it is impossible to carry out anticipatory preventive actions.
23
basis for intervention is relevant when the population recognizes and understands that risk. The indicators that represent risk identification, RI, are the following:
RI1. Systematic disaster and loss inventory RI2. Hazard monitoring and forecasting RI3. Hazard evaluation and mapping RI4. Vulnerability and risk assessment RI5. Public information and community participation RI6. Training and education on risk management
3.4.3 Indicators of risk reduction Risk management aims particularly to reduce risk. In general, this requires the execution of structural and non structural prevention-mitigation measures. It is the act of anticipating with the aim of avoiding or diminishing the economic, social and environmental impact of potentially dangerous physical phenomena. It implies planning processes but, fundamentally, the execution of measures that modify existing risk conditions through corrective and prospective interventions of existing and potential future vulnerability, and hazard control when feasible. The indicators that represent risk reduction, RR, are the following:
RR1. Risk consideration in land use and urban planning RR2. Hydrological basin intervention and environmental protection RR3. Implementation of hazard-event control and protection techniques RR4. Housing improvement and human settlement relocation from prone-areas RR5. Updating and enforcement of safety standards and construction codes RR6. Reinforcement and retrofitting of public and private assets
3.4.4 Indicators of disaster management Disaster management should provide appropriate response and recovery post disaster and depends on the level of preparation of operational institutions and the community. This public policy searches to respond efficiently and appropriately when risk has been materialized and it has not been possible to impede the impact of dangerous phenomena. Effectiveness implies organization, capacity and operative planning of institutions and other diverse actors involved in disasters. The indicators that represent the capacity for disaster management, DM, are the following:
DM1. Organization and coordination of emergency operations DM2. Emergency response planning and implementation of warning systems DM3. Endowment of equipments, tools and infrastructure DM4. Simulation, updating and test of inter institutional response DM5. Community preparedness and training DM6. Rehabilitation and reconstruction planning
24
3.4.5 Indicators of governance and financial protection Governance and financial protection is fundamental for the sustainability of development and economic growth in a country. This implies, on the one hand, coordination between different social actors that necessarily are guided by different disciplinary approaches, values, interests and strategies. Effectiveness is related to the level of interdisciplinarity and integration of institutional actions and social participation. On the other hand, governance depends on an adequate allocation and use of financial resources for the management and implementation of appropriate strategies for the retention and transference of disaster losses. The indicators that represent governance and financial protection, FP, are the following:
FP1. Interinstitutional, multisectoral and decentralizing organization FP2. Reserve funds for institutional strengthening FP3. Budget allocation and mobilization FP4. Implementation of social safety nets and funds response FP5. Insurance coverage and loss transfer strategies of public assets. FP6. Housing and private sector insurance and reinsurance coverage
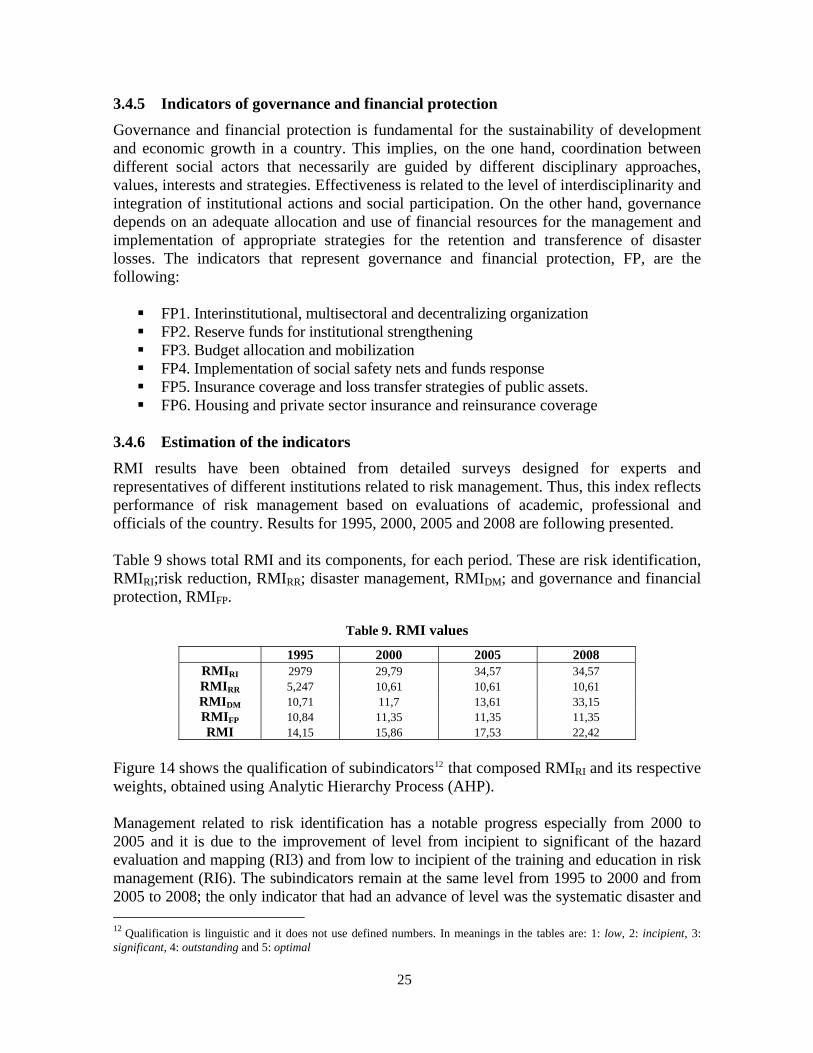
3.4.6 Estimation of the indicators RMI results have been obtained from detailed surveys designed for experts and representatives of different institutions related to risk management. Thus, this index reflects performance of risk management based on evaluations of academic, professional and officials of the country. Results for 1995, 2000, 2005 and 2008 are following presented. Table 9 shows total RMI and its components, for each period. These are risk identification, RMIRI;risk reduction, RMIRR; disaster management, RMIDM; and governance and financial protection, RMIFP.
Table 9. RMI values
1995 2000 2005 2008 RMIRI 2979 29,79 34,57 34,57 RMIRR 5,247 10,61 10,61 10,61 RMIDM 10,71 11,7 13,61 33,15 RMIFP 10,84 11,35 11,35 11,35 RMI 14,15 15,86 17,53 22,42
Figure 14 shows the qualification of subindicators12 that composed RMIRI and its respective weights, obtained using Analytic Hierarchy Process (AHP). Management related to risk identification has a notable progress especially from 2000 to 2005 and it is due to the improvement of level from incipient to significant of the hazard evaluation and mapping (RI3) and from low to incipient of the training and education in risk management (RI6). The subindicators remain at the same level from 1995 to 2000 and from 2005 to 2008; the only indicator that had an advance of level was the systematic disaster and
12 Qualification is linguistic and it does not use defined numbers. In meanings in the tables are: 1: low, 2: incipient, 3: significant, 4: outstanding and 5: optimal
25

loss inventory (RI1) was in an incipient performance level and it changed to a significant level, therefore, the weights are similar for all the subindicators and it probably that is the reason the change from 2005 to 2008 is not perceivable in the total indicator.
1995 2000 2005 2008 Weight
RI1 2 2 2 3 13.56 RI2 2 2 2 2 18.14 RI3 2 2 3 3 15.06 RI4 2 2 2 2 20.95 RI5 3 3 3 3 15.13 RI6 1 1 2 2 17.16
Figure 14. RMIRI
29,79 29,79
34,57 34,57
27
28
29
30
31
32
33
34
35
1995 2000 2005 2008
RMIRI
Figure 15 shows the qualification of subindicators that composed RMIRR and its respective weights, obtained using Analytic Hierarchy Process (AHP).
1995 2000 2005 2008 Weight
RR1 1 1 1 1 27.19 RR2 1 1 1 1 16.44 RR3 1 2 2 2 10.13 RR4 1 1 1 2 13.65 RR5 1 2 2 2 18.58 RR6 1 1 1 2 14.01
Figure 15. RMIRR
5,2511,07 11,07 11,07
0
10
20
30
40
50
60
70
1995 2000 2005 2008
RMIRR
Management related to risk reduction indicates that the country has not had progress during the years of evaluation. An advance can be perceived in 2000 due to the improvement from low to incipient in the performance level of implementation of hazard-event control and protection techniques (RR3) and updating and enforcement of safety standards and construction codes (RR5). In 2008 the indicators that presented a slight advance, that is, from a low level to an incipient level are the housing improvement and human settlement relocation from prone areas (RR4) and the reinforcement and retrofitting of public and private assets (RR6). The level of the total index is very low and it is necessary to have effecvtiveactions to improve the performance of the risk management in relation with the risk reduction. Figure 16 shows subindicators qualifications which composed RMIDM and its respective weights, obtained using Analytic Hierarchy Process (AHP).
26
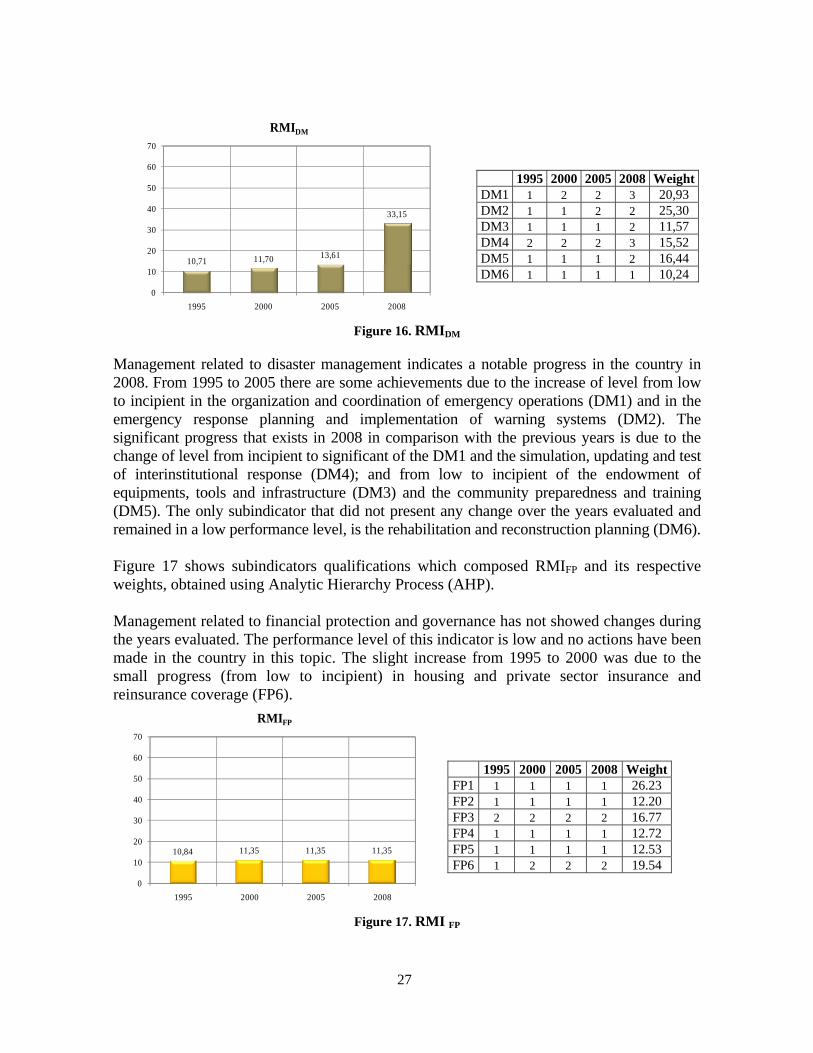
1995 2000 2005 2008 Weight
DM1 1 2 2 3 20,93 DM2 1 1 2 2 25,30 DM3 1 1 1 2 11,57 DM4 2 2 2 3 15,52 DM5 1 1 1 2 16,44 DM6 1 1 1 1 10,24
Figure 16. RMIDM
10,71 11,70 13,61
33,15
0
10
20
30
40
50
60
70
1995 2000 2005 2008
RMIDM
Management related to disaster management indicates a notable progress in the country in 2008. From 1995 to 2005 there are some achievements due to the increase of level from low to incipient in the organization and coordination of emergency operations (DM1) and in the emergency response planning and implementation of warning systems (DM2). The significant progress that exists in 2008 in comparison with the previous years is due to the change of level from incipient to significant of the DM1 and the simulation, updating and test of interinstitutional response (DM4); and from low to incipient of the endowment of equipments, tools and infrastructure (DM3) and the community preparedness and training (DM5). The only subindicator that did not present any change over the years evaluated and remained in a low performance level, is the rehabilitation and reconstruction planning (DM6). Figure 17 shows subindicators qualifications which composed RMIFP and its respective weights, obtained using Analytic Hierarchy Process (AHP). Management related to financial protection and governance has not showed changes during the years evaluated. The performance level of this indicator is low and no actions have been made in the country in this topic. The slight increase from 1995 to 2000 was due to the small progress (from low to incipient) in housing and private sector insurance and reinsurance coverage (FP6).
1995 2000 2005 2008 Weight
FP1 1 1 1 1 26.23 FP2 1 1 1 1 12.20 FP3 2 2 2 2 16.77 FP4 1 1 1 1 12.72 FP5 1 1 1 1 12.53 FP6 1 2 2 2 19.54
Figure 17. RMI FP
10,84 11,35 11,35 11,35
0
10
20
30
40
50
60
70
1995 2000 2005 2008
RMIFP
27
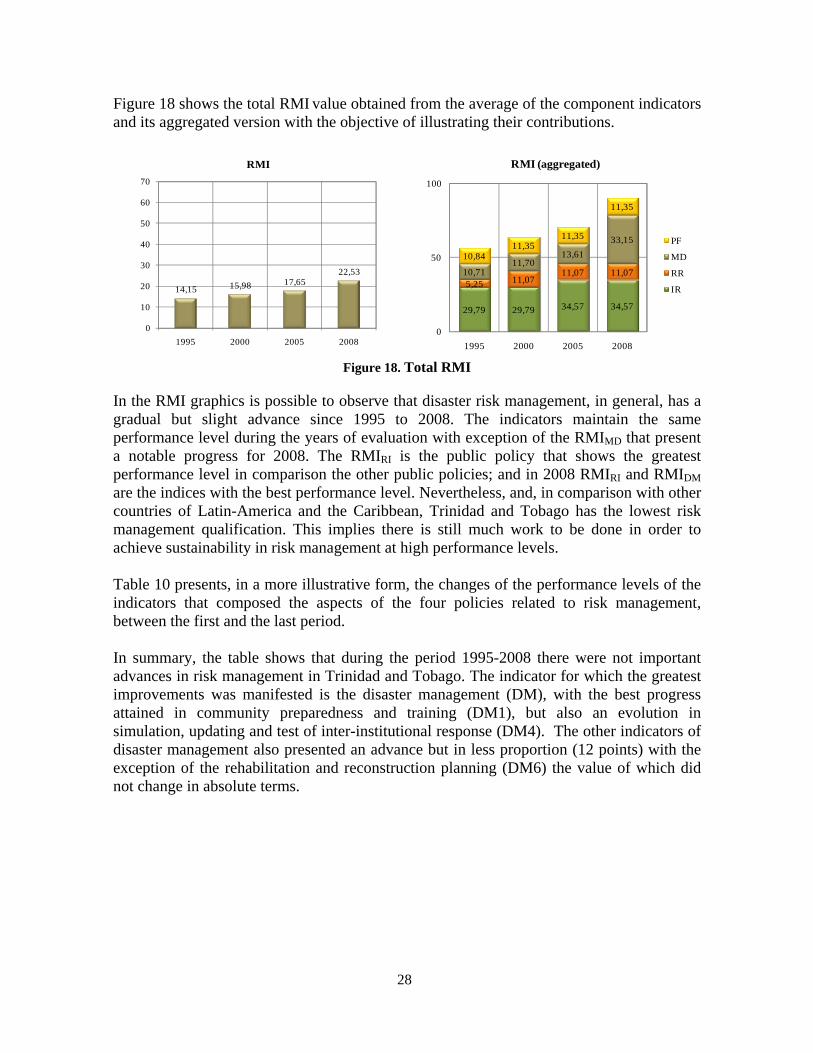
Figure 18 shows the total RMI value obtained from the average of the component indicators and its aggregated version with the objective of illustrating their contributions.
Figure 18. Total RMI
14,15 15,98 17,6522,53
0
10
20
30
40
50
60
70
1995 2000 2005 2008
RMI
29,79 29,79 34,57 34,57
5,25 11,0711,07 11,0710,71
11,7013,61
33,15
10,8411,35
11,35
11,35
0
50
100
1995 2000 2005 2008
RMI (aggregated)
PF
MD
RR
IR
In the RMI graphics is possible to observe that disaster risk management, in general, has a gradual but slight advance since 1995 to 2008. The indicators maintain the same performance level during the years of evaluation with exception of the RMIMD that present a notable progress for 2008. The RMIRI is the public policy that shows the greatest performance level in comparison the other public policies; and in 2008 RMIRI and RMIDM are the indices with the best performance level. Nevertheless, and, in comparison with other countries of Latin-America and the Caribbean, Trinidad and Tobago has the lowest risk management qualification. This implies there is still much work to be done in order to achieve sustainability in risk management at high performance levels. Table 10 presents, in a more illustrative form, the changes of the performance levels of the indicators that composed the aspects of the four policies related to risk management, between the first and the last period. In summary, the table shows that during the period 1995-2008 there were not important advances in risk management in Trinidad and Tobago. The indicator for which the greatest improvements was manifested is the disaster management (DM), with the best progress attained in community preparedness and training (DM1), but also an evolution in simulation, updating and test of inter-institutional response (DM4). The other indicators of disaster management also presented an advance but in less proportion (12 points) with the exception of the rehabilitation and reconstruction planning (DM6) the value of which did not change in absolute terms.
28
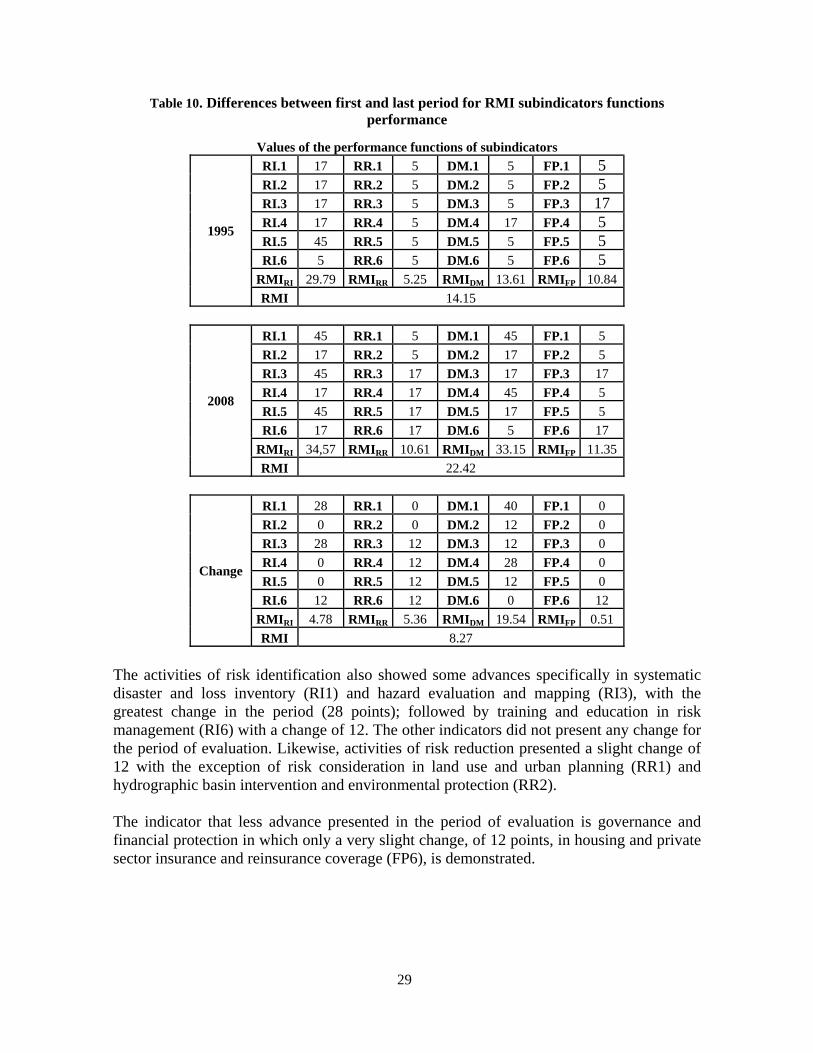
Table 10. Differences between first and last period for RMI subindicators functions performance
Values of the performance functions of subindicators
1995
RI.1 17 RR.1 5 DM.1 5 FP.1 5 RI.2 17 RR.2 5 DM.2 5 FP.2 5 RI.3 17 RR.3 5 DM.3 5 FP.3 17 RI.4 17 RR.4 5 DM.4 17 FP.4 5 RI.5 45 RR.5 5 DM.5 5 FP.5 5 RI.6 5 RR.6 5 DM.6 5 FP.6 5
RMIRI 29.79 RMIRR 5.25 RMIDM 13.61 RMIFP 10.84 RMI 14.15
2008
RI.1 45 RR.1 5 DM.1 45 FP.1 5 RI.2 17 RR.2 5 DM.2 17 FP.2 5 RI.3 45 RR.3 17 DM.3 17 FP.3 17 RI.4 17 RR.4 17 DM.4 45 FP.4 5 RI.5 45 RR.5 17 DM.5 17 FP.5 5 RI.6 17 RR.6 17 DM.6 5 FP.6 17
RMIRI 34,57 RMIRR 10.61 RMIDM 33.15 RMIFP 11.35 RMI 22.42
Change
RI.1 28 RR.1 0 DM.1 40 FP.1 0 RI.2 0 RR.2 0 DM.2 12 FP.2 0 RI.3 28 RR.3 12 DM.3 12 FP.3 0 RI.4 0 RR.4 12 DM.4 28 FP.4 0 RI.5 0 RR.5 12 DM.5 12 FP.5 0 RI.6 12 RR.6 12 DM.6 0 FP.6 12
RMIRI 4.78 RMIRR 5.36 RMIDM 19.54 RMIFP 0.51 RMI 8.27
The activities of risk identification also showed some advances specifically in systematic disaster and loss inventory (RI1) and hazard evaluation and mapping (RI3), with the greatest change in the period (28 points); followed by training and education in risk management (RI6) with a change of 12. The other indicators did not present any change for the period of evaluation. Likewise, activities of risk reduction presented a slight change of 12 with the exception of risk consideration in land use and urban planning (RR1) and hydrographic basin intervention and environmental protection (RR2). The indicator that less advance presented in the period of evaluation is governance and financial protection in which only a very slight change, of 12 points, in housing and private sector insurance and reinsurance coverage (FP6), is demonstrated.
29
4 CONCLUSIONS DDI illustrates economic implications of a major disaster, estimated on the basis of the potential of feasible extreme events; LDI identifies social and environmental risk as a result of the recurrence of small events; PVI accounts for susceptibility and aggravation factors of the direct effects of the disasters due to deficiencies in development; and RMI indicates what has been achieved and what needs to be done in order to improve risk management. And in the case of RMI, the country has not demonstrated notable advances during the periods of evaluation. From these results it is possible to conclude that in Trinidad and Tobago there was a decrease of DDI from 2000 to 2005 but at present the DDI is increasing. The PVI is from 1985 basically the same but with a slight reduction. Making the comparison of trends in indicators, it is possible to conclude that the system of indicators presents results generally consistent or appropriate to the reality of the country. In any case, it is important to disaggregate these indicators and identify areas where improvements can be made through actions, projects and specific activities by the central government with the participation of different sectoral agencies, municipalities and communities; and thus achieve further progress and greater sustainability. Decision makers and stakeholders, besides identifying weaknesses as reflected in the indicators, must take into account other characteristics that are not revealed or expressed by the evaluation presented. Indicators provide a situational analysis from which it is possible to extract a set of actions that must be done without details for a strategic plan, which should be the next step. The aim of the indicator system is to assist in the formulation of general recommendations for planning.
30
5 BIBLIOGRAPHY Birkmann, J. (ed.) (2006) Measuring vulnerability to hazards of natural origin. Towards disaster resilient
societies. United Nations University Press, Tokyo, New York (480 p.) Cardona, O.D. (2006). “A System of Indicators for Disaster Risk Management in the Americas” in Measuring
Vulnerability to Hazards of Natural Origin: Towards Disaster Resilient Societies, Editor J. Birkmann, United Nations University Press, Tokyo.
Cardona, O.D. (2009). “Disaster Risk and Vulnerability: Notions and Measurement of Human and
Environmental Insecurity” in Coping with Global Environmental Change, Disasters and Security - Threats, Challenges, Vulnerabilities and Risks, Editors: H.G. Brauch, U. Oswald Spring, C. Mesjasz, J. Grin, P. Kameri-Mbote, B. Chourou, P. Dunay, J. Birkmann: Hexagon Series on Human and Envi-ronmental Security and Peace, vol. 5 (Berlin – Heidelberg – New York: Springer-Verlag).
Cardona, O.D., J.E. Hurtado, G. Duque, A. Moreno, A.C. Chardon, L.S. Velásquez and S.D. Prieto. 2003a. La
Noción de Riesgo desde la Perspectiva de los Desastres: Marco Conceptual para su Gestión Integral. IDB/IDEA Program of Indicators for Disaster Risk Management, National University of Colombia, Manizales. Available at http://idea.unalmzl.edu.co
____________. 2003b. Indicadores para la Medición del Riesgo: Fundamentos para un Enfoque Metodológico.
IDB/IDEA Program of Indicators for Disaster Risk Management, National University of Colombia, Manizales. Available at http://idea.unalmzl.edu.co
____________. 2004a. Dimensionamiento Relativo del Riesgo y de la Gestión: Metodología Utilizando
Indicadores a Nivel Nacional. IDB/IDEA Program of Indicators for Disaster Risk Management, National University of Colombia, Manizales. Available at http://idea.unalmzl.edu.co
____________. 2004b. Resultados de la Aplicación del Sistema de Indicadores en Doce Países de las
Américas. IDB/IDEA Program of Indicators for Disaster Risk Management, National University of Colombia, Manizales. Available at http://idea.unalmzl.edu.co
____________. 2005. Sistema de indicadores para la gestión del riesgo de desastre: Informe técnico principal.
IDB/IDEA Program of Indicators for Disaster Risk Management, National University of Colombia, Manizales. Available at http://idea.unalmzl.edu.co
Cardona, O.D., Ordaz, M.G., Marulanda, M.C., & Barbat, A.H. (2008). Estimation of Probabilistic Seismic
Losses and the Public Economic Resilience—An Approach for a Macroeconomic Impact Evaluation, Journal of Earthquake Engineering, 12 (S2) 60-70, ISSN: 1363-2469 print / 1559-808X online, DOI: 10.1080/13632460802013511, Taylor & Francis, Philadelphia, PA.
Carreño, M.L, Cardona, O.D., Barbat, A.H. (2004). Metodología para la evaluación del desempeño de la gestión
del riesgo, Monografía CIMNE IS-51, Universidad Politécnica de Cataluña, Barcelona. ____________. (2005). Sistema de indicadores para la evaluación de riesgos, Monografía CIMNE IS-52,
Universidad Politécnica de Cataluña, Barcelona. ____________. (2007). A disaster risk management performance index, Journal of Natural Hazards, February
2007, DOI 10.1007/s11069-006-9008-y, 0921-030X (Print) 1573-0840 (Online), Vol. 41 N. 1, April, 1-20, Springer Netherlands.
____________. (2007). Urban seismic risk evaluation: A holistic approach, Journal of Natural Hazards, 40,
2007, 137-172. DOI 10.1007/s11069-006-0008-8. ISSN 0921-030X (Print) 1573-0840 (Online)
31
____________. (2007). Urban seismic risk evaluation: A holistic approach, Journal of Natural Hazards, 40, 137-172. DOI 10.1007/s11069-006-0008-8. ISSN 0921-030X (Print) 1573-0840 (Online), Springer Netherlands
____________. (2008). Application and robustness of the holistic approach for the seismic risk evaluation of
megacities, Innovation Practice Safety: Proceedings 14th World Conference on Earthquake Engineering, Beijing, China.
Carreño, M.L., Cardona, O.D., Marulanda M.C., & Barbat, A.H. (2009). “Holistic urban seismic risk
evaluation of megacities: Application and robustness” en The 1755 Lisbon Earthquake: Revisited. Series: Geotechnical, geological and Earthquake Engineering, Vol 7, Mendes-Victor, L.A.; Sousa Oliveira, C.S.; Azevedo, J.; Ribeiro, A. (Eds.), Springer.
IDEA – Instituto de Estudios Ambientales (2005). Indicadores de Riesgo de Desastre y de Gestión de Riesgos:
Informe Técnico Principal, edición en español e inglés, ISBN: 978-958-44-0220-2, Universidad Nacional de Colombia, Manizales. Available at: http://idea.unalmzl.edu.co
ISDR. 2009. Global Assessment Report on Disaster Risk Reduction (GAR). International Strategy fro
Disaster Reduction, Geneva. Marulanda, M.C. and O.D. Cardona 2006. Análisis del impacto de desastres menores y moderados a nivel
local en Colombia. ProVention Consortium, La RED. Available at: http://www.desinventar.org/sp/proyectos/articulos/ Marulanda, M.C., Cardona, O.D. & A. H. Barbat, (2008). “The Economic and Social Effects of Small Disasters:
Revision of the Local Disaster Index and the Case Study of Colombia”, in Megacities: Resilience and Social Vulnerability, Bohle, H.G., Warner, K. (Eds.) , SOURCE No. 10, United Nations University (EHS), Munich Re Foundation, Bonn.
____________. (2009). “Revealing the Impact of Small Disasters to the Economic and Social Development”, in
Coping with Global Environmental Change, Disasters and Security - Threats, Challenges, Vulnerabilities and Risks, Editors: H.G. Brauch, U. Oswald Spring, C. Mesjasz, J. Grin, P. Kameri-Mbote, B. Chourou, P. Dunay, J. Birkmann: Springer-Verlag (in press), Berlin - New York.
____________. (2009). Robustness of the holistic seismic risk evaluation in urban centers using the USRi,
Journal of Natural Hazards, DOI 10.1007/s 11069-008-9301-z, Vol 49 (3) (Junio):501-516, Springer Science+ Business.
Ordaz, M.G., and L.E. Yamín. 2004. Eventos máximos considerados (EMC) y estimación de pérdidas
probables para el cálculo del índice de déficit por desastre (IDD) en doce países de las Américas. IDB/IDEA Program of Indicators for Disaster Risk Management, National University of Colombia, Manizales. Available at http://idea.unalmzl.edu.co
Velásquez, C.A. 2009. Reformulación del modelo del Índice de Déficit por Desastre. Programa de
Indicadores de Riesgo de Desastre y Gestión de Riesgos BID-IDEA-ERN. Universidad Nacional de Colombia, sede Manizales. Disponible en: http://idea.unalmzl.edu.co
32
APPENDIX I
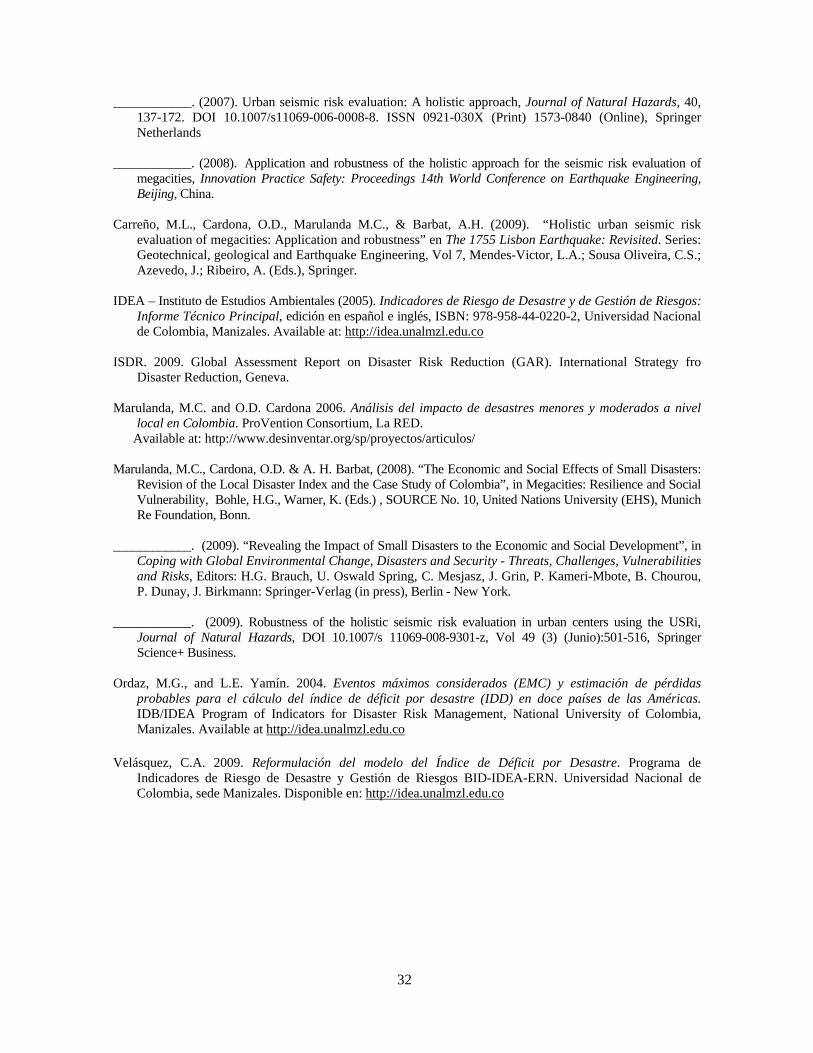
NATURAL HAZARDS OF THE COUNTRY AI.1 SEISMIC HAZARD Seismic events in the Eastern Caribbean are principally associated with a subduction zone at the junction of the Caribbean Plate and the North American Plate. The North American Plate dips from east to west beneath the Caribbean Plate along a north-south line just east of the main island arc. This leads to a moderate level of inter-plate seismicity. Superimposed on this is a pattern of intra-plate activity. 13 Trinidad and Tobago lies at the south-eastern corner of the Caribbean plate, close to the second most seismically active zone in the Eastern Caribbean. Tectonically it is a complex area because to the north there is subduction of Atlantic Ocean lithosphere beneath the eastern boundary of the Caribbean plate and to the west there is strike-slip motion between the southern Caribbean plate boundary and the South American plate. The transition between the two types of motion gives rise to different seismogenic zones with distinct characteristics. Generally background seismicity in the vicinity of Tobago is relatively low when compared with other zones in the Eastern Caribbean.14 Figure A.1. shows a seismic hazard map for Trinidad and Tobago with a 10% probability of exceedance in 50 years. In this map the peak ground acceleration (PGA) in Tobago is approximately 23%g in Tobago to 36%g in North-West Trinidad. Tectonic considerations suggest that a maximum-moment earthquake occurring directly under either land mass could generate accelerations as high as 0-6g; the probability of occurrence of such an event is estimated to be about 2 per cent in 50 years for Trinidad and about a tenth this risk for Tobago.
Figure A.1 Seismic hazard map. Source: University of the West Indies15
The largest earthquake on historical record directly affecting Trinidad and Tobago was the 1766 event. There have been eight earthquakes of magnitude greater than 6 between 1899
13 Organization of American States, OAS http://www.oas.org/pgdm 14 Office of Disaster Preparedness Management, ODPM. http://www.odpm.gov.tt 15 The University of the West Indies, Seismic Research Center. www.uwiseismic.com
33

and 1952 within 250 km of Trinidad. One of these on 23 January 1910 was of magnitude 7.2. The 1825 and 1954 earthquakes also caused severe damage. The former affected all the buildings in Port of Spain, which at that time, were a maximum of 2 stories and on unreinforced masonry. AI.2 VOLCANIC HAZARD Several of the islands of the Eastern Caribbean are volcanic in origin. The volcanoes there are considered to be either active or dormant. There are 19 'live' (likely to erupt again) volcanoes in the Eastern Caribbean. Every island from Grenada to Saba is subject to the direct threat of volcanic eruptions (see map below). Islands such as Grenada, St. Vincent, St. Lucia, Martinique, Dominica, Guadeloupe, Montserrat, Nevis, St. Kitts, St. Eustatius and Saba have 'live' volcanic centres, while other islands such as Anguilla, Antigua, Barbuda, Barbados, British Virgin Islands, most of the Grenadines and Trinidad & Tobago (which are not volcanic) are close to volcanic islands and are, therefore, subject to volcanic hazards such as severe ash fall and volcanically-generated tsunamis.16 AI.3 HYDROMETEOROLOGICAL HAZARDS The official hurricane season in the Greater Caribbean region begins the first of June and lasts through November 30, with 84 percent of all hurricanes occurring during August and September. The greatest risk in Mexico and the western Caribbean is at the beginning and end of the season, and in the eastern Caribbean during mid-season. The figures A.2 and A.3 show the tropical cyclone tracks for August and September in the Caribbean region. Every year over 100 tropical depressions or potential hurricanes are monitored, but an average of only ten reach tropical storm strength and six become hurricanes. These overall averages suggest that activity is uniform from year to year but historical records indicate a high degree of variance, with long periods of tranquility and activity. Hurricanes are by far the most frequent hazardous phenomena in the Caribbean. In the last 250 years the West Indies has been devastated by 3 volcanic eruptions, 8 earthquakes, and 21 major hurricanes. If tropical storms are also taken into account, the Greater Caribbean area has suffered from hundreds of such events. Trinidad and Tobago lies on the southern fringe of the Atlantic Hurricane Basin and is likely to be hit by a tropical cyclone at any time. Tobago though is more vulnerable despite the fact that it is only about 35 km to the northeast of Trinidad. Of the twenty-six (26) cyclones passing near the area, twenty-five (25) passed north of Tobago, sufficiently close to pose a threat to the island. (Daniel, Maharaj, De Souza, 2002) Recent history has also shown that cyclones, which are relatively far from the twin island state, can adversely affect Trinidad and Tobago. Hurricanes Iris (1995), Lenny (1999) and
16 Seismic Research Center, The University of the West Indies. http://www.uwiseismic.com
34
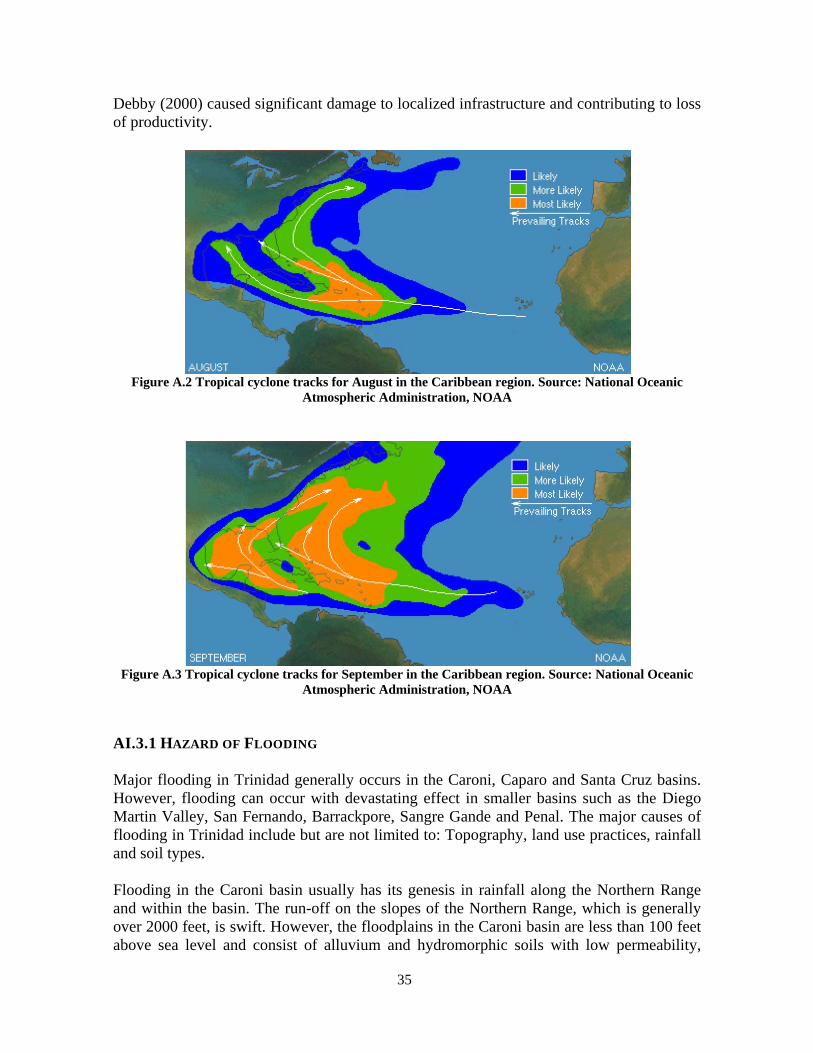
35
Debby (2000) caused significant damage to localized infrastructure and contributing to loss of productivity.
Figure A.2 Tropical cyclone tracks for August in the Caribbean region. Source: National Oceanic
Atmospheric Administration, NOAA
Figure A.3 Tropical cyclone tracks for September in the Caribbean region. Source: National Oceanic
Atmospheric Administration, NOAA AI.3.1 HAZARD OF FLOODING Major flooding in Trinidad generally occurs in the Caroni, Caparo and Santa Cruz basins. However, flooding can occur with devastating effect in smaller basins such as the Diego Martin Valley, San Fernando, Barrackpore, Sangre Gande and Penal. The major causes of flooding in Trinidad include but are not limited to: Topography, land use practices, rainfall and soil types. Flooding in the Caroni basin usually has its genesis in rainfall along the Northern Range and within the basin. The run-off on the slopes of the Northern Range, which is generally over 2000 feet, is swift. However, the floodplains in the Caroni basin are less than 100 feet above sea level and consist of alluvium and hydromorphic soils with low permeability,
which inhibit infiltration. The Caparo basin has a similar soil structure as the Caroni basin and in both basins, the land use practices on the slopes increases swift run-off into the flood plains into watercourses prone to siltation (CSO, 2007) AI.4 HAZARD OF FOREST FIRES Trinidad and Tobago has a well-defined dry season, which normally extends from January to May. Each dry season, numerous fires occur on hillsides, along roadways and throughout the country biological landscape. The number of fires and the extent of damages they cause, vary from year to year depending on the existing physical and environmental conditions of the land, and the severity of the dry season- essentially the amount and distribution of rainfall. The Forestry Division Trinidad and Tobago in its report on the 1998-1999 Fire season reports that for the period 1987- 1999, there were 4197 fires with 57,557 hectares of land burnt. This equates to an average of 321 fires per year, with 4428 hectares burnt, and an average fire size of 11 hectares. The majority causes of fires are malicious acts and the burning for agriculture. Approximately 54% of the areas burnt are reported as due to fires which have been maliciously set, while agriculture accounts for 17% of fires. The Forestry Division implements fire suppression and prevention activities and reforestation programs in the dry and wet seasons respectively. (NEMA, 2002)
36