Embed Size (px)
Citation preview
TriglycerideYtoYHigh-Density-Lipoprotein-Cholesterol RatioIs an Index of Heart Disease Mortality and of Incidence of
Type 2 Diabetes Mellitus in MenGloria Lena Vega, PhD,* Carolyn E. Barlow, MS,Þ Scott M. Grundy, MD, PhD,*
David Leonard, PhD,Þ and Laura F. DeFina, MDÞ
Background: High triglyceride (TG) and low high-density lipoproteincholesterol (HDL-C) impart risk for heart disease. This study examinesthe relationships of TG/HDL-C ratio to mortality from all causes, cor-onary heart disease (CHD), or cardiovascular disease (CVD).Subjects and Methods: Survival analysis was done in 39,447 mengrouped by TG/HDL-C ratio cut point of 3.5 and for metabolic syn-drome. National Death Index International Classification of Diseases(ICD-9 and ICD-10) codes were used for CVD and CHD deaths oc-curring from 1970 to 2008. Incidence of type 2 diabetes mellitus (DM)according to ratio was estimated in 22,215 men. Triglyceride/HDL-Cratio and cross-product of TG and fasting blood glucose (TyG index)were used in analysis.Results: Men were followed up for 581,194 person-years. Triglyceride/HDL-C ratio predicted CHD, CVD, and all-cause mortality after adjust-ment for established risk factors and nonYHDL-C. Mortality rates werehigher in individuals with a high ratio than in those with a low ratio. Fifty-five percent of men had metabolic syndrome that was also predictive ofCHD, CVD, and all-cause mortality. Annual incidence of DM was 2 timeshigher in men with high TG/HDL-C ratio than in those with a low ratio.Individuals with high TG/HDL-C ratio had a higher incidence of DMthan those with a low ratio. The TyG index was not equally predictive ofcauses of mortality to TG/HDL-C, but both were equally predictive ofdiabetes incidence.Conclusions: Triglyceride/HDL-C ratio predicts CHD and CVDmortality as well as or better than do metabolic syndrome in men. Also,a high ratio predisposes to DM. The TyG index does not predict CHD,CVD, or all-cause mortality equally well, but like TG/HDL-C ratio, itpredicts DM incidence.
Key Words: TG/HDL-C ratio, CVD mortality, CHD mortality
(J Investig Med 2014;62: 345Y349)
H igh levels of plasma triglycerides (TGs) are a risk factor forcardiovascular disease (CVD) regardless of high-density li-
poprotein cholesterol (HDL-C) levels.1,2 Hypertriglyceridemia isalso frequently associated with impaired fasting glucose, impaired
glucose tolerance, insulin resistance, type 2 diabetes mellitus(DM), and metabolic syndrome.3,4 Elevated TGs are commonlyassociated with a lipoprotein phenotype designated ‘‘atherogenicdyslipidemia’’5; this includes reduced HDL-C and increasednumber of small, dense, low-density lipoproteins.
A TG/HDL-C ratio of 3.5 or greater was reported byMcLaughlin et al.6 to be highly correlated with insulin resistanceand atherogenic dyslipidemia in men; this threshold was also as-sociated with metabolic syndrome. They proposed that the TG/HDL-C ratio provides a simple way to identify insulin-resistant,dyslipidemic patients who are likely to be at increased risk forCVD. More recently, the TG � fasting glucose (TyG index) hasbeen suggested as a new measure of insulin resistance7,8; thisindex was compared with the TG/HDL-C ratio and found to besimilarly correlated with insulin resistance.
In the current study, we examined the impact of the TG/HDL-C ratio, the TyG index, and the metabolic syndrome riskfactors on risk of mortality from coronary heart disease (CHD),CVD, and all causes in a cohort of nonobese and relatively healthymen participating in the Cooper Center Longitudinal Study(CCLS). In addition, the relative impact of TG/HDL-C ratio andTyG index as predictors of type 2 DM incidence was examined.
METHODSThe CCLS was originally designed to examine effects of
cardiorespiratory fitness on CVD or cancer incidence.9 TheCCLS participants were mostly college graduates (95% Amer-ican white or Europid) who were self-referred or referred bytheir employers for clinical evaluation. For the current analysis,data collected between 1970 and 2008 were used, and it in-cludes clinical history, physical examination, vital signs, plasmaconcentration of TGs, cholesterol, lipoprotein cholesterol, andfasting glucose. Analytical methods used have been detailedpreviously.10
A total of 39,447 men aged 20 to 90 years were included inthe survival analyses. Men were grouped by TG/HDL-C ratiousing a cut point of 3.5. Survival analysis was done in menfollowed from their baseline examination until the date of deathfor decedents or until December 31, 2008, for survivors. Theprimary source for mortality surveillance was The NationalDeath Index. Cardiovascular disease death was definedwith International Classification of Diseases, Ninth Revision(ICD-9) codes (390Y449.9) for deaths before 1999 or Interna-tional Classification of Diseases, 10th Revision (ICD-10) codes(I00YI78) for deaths occurring from 1999 to 2008. Briefly, thecode list covers diseases of the circulatory system (acute rheu-matic fever; chronic rheumatic fever; hypertension; ischemicheart disease; disease of pulmonary circulation; other forms ofheart disease; cerebrovascular disease; diseases of the arteries,arterioles, and capillaries; diseases of veins and lymphatics; andother diseases of the circulatory system). Coronary heart diseasedeath was defined with ICD-9 codes (410.0Y414.9 and 429.2)
ORIGINAL ARTICLE
Journal of Investigative Medicine & Volume 62, Number 2, February 2014 345
From the *Center for Human Nutrition, University of Texas SouthwesternMedical Center, the Veterans Affairs Medical Center at Dallas; and †TheCooper Institute, Dallas, TX.Received July 3, 2013, and in revised form August 6, 2013.Accepted for publication August 6, 2013.Reprints: Gloria Lena Vega, PhD, University of Texas Southwestern Medical
Center, 5323 Harry Hines Blvd, Dallas, TX 75390; or Laura F. DeFina,MD, Center for Human Nutrition, The Cooper Institute, 12330 PrestonRd, Dallas, TX 75230. E-mail: [email protected];[email protected] study was supported in part by grant UL1TR000451 from the NationalCenter for Advancing Translational Sciences, National Institutes of Health(to S.M.G. and G.L.V.)
Copyright * 2014 by The American Federation for Medical ResearchISSN: 1081-5589DOI: 10.231/JIM.0000000000000044
Copyright © 2014 American Federation for Medical Research. Unauthorized reproduction of this article is prohibited.
on February 28, 2020 by guest. P
rotected by copyright.http://jim
.bmj.com
/J Investig M
ed: first published as 10.2310/JIM.0000000000000044 on 15 D
ecember 2015. D
ownloaded from
for deaths before 1999 or ICD-10 codes I20YI26 for deathsoccurring from 1999 to 2008. The list includes angina pectoris,acute myocardial infarction and subsequent complications, is-chemic heart diseases, and pulmonary embolism. Hazard ratios(HRs) were estimated for those with a high ratio of TGs toHDL-C, and results were also compared with the HR estimatedfor individuals with a high TyG index. The cut point for the TyGindex was determined as described in the statistical section.
The CCLS is approved annually by the institutional reviewboard at The Cooper Institute. All participants provided signedinformed consent for participation in the CCLS. The data aremaintained by The Cooper Institute.
Descriptive parameters are summarized as means T SDs.Log transformations were done for parameters with skewed dis-tributions before data modeling. Cut points for high or low levelsof parameters were defined using Adult Treatment Panel III cri-teria for metabolic syndrome.11,12 Accordingly, high plasma TGwas 150 mg/dL or greater, low HDL-C was less than 40 mg/dL,high blood pressure was 130/85 mm Hg or greater, high fastingblood glucose was 100 mg/dL or greater, high nonYHDL-C was160 mg/dL or greater, and high waist girth was 102 cm or greater.Thresholds for TG/HDL-C were selected to maximize the like-lihood ratio W2 statistic between those with and without metabolicsyndrome.11,12 The estimated ratio was 3.5, identical to that pro-posed by McLaughlin et al.6 Analysis of variance was usedto compare parameter means at baseline between low and highTG/HDL-C ratio groups. The TyG was calculated, and its relationto mortality was compared with the association of the ratio of TGsto HDL-C. The TyG index cut points were determined in the samemanner as the cut points for the TG/HDL-C ratio. The cut pointdividing high and low TyG index was 15,346 mg2. This valuewassimilar to that found byAbbasi and Reaven.7Metabolic syndromerisk factors included the ATP III criteria of 3 of 5 risks (high TG,low HDL-C, elevated fasting blood glucose, increased bloodpressure, and/or increased waist girth).4 Cox proportional hazardregressions were used to estimate crude and adjusted HRs.Attained age was used as the time scale in the proportionalhazards models so that potentially nonlinear age effects wouldbe absorbed into the baseline hazard function.
Incidence of type 2 DM was estimated for men grouped ac-cording to TG/HDL-C ratios. These analyses were conducted among22,215 individuals who had more than 1 fasting plasma glucosemeasurement as well as measures of plasma TG and HDL-C aspreviously detailed.10 Subjects were subgrouped at baseline accordingto fasting plasma glucose categories of normoglycemia (fastingglucose 70Y99 mg/dL), mild hyperglycemia (100Y109 mg/dL), andintermediate hyperglycemia (110Y125 mg/dL). For the estimationof incidence of type 2 DM, data were analyzed as detailed previ-ously.10 Incidence was determined for subgroups of TG/HDL-C orTyG cut points. Briefly, time to incident DM was calculated asthe difference in examination year between the first clinic visit andthe earliest clinic visit at which the individual had a blood glucoselevel greater than 125.9 mg/dL or a reported diagnosis of type2 DM. Exponential survival models were applied to the intervalcensored data to estimate incidence rates in the glucose subgroupsand to compare glucose subgroups within sexes. SAS/STAT soft-ware (Cary, NC), version 9.2, was used for all analyses. Finally,the usefulness of the TyG index in prediction of all-cause mor-tality and in the incidence of type 2 diabetes was compared withthe TG/HDL-C ratio.
RESULTSMen were followed up for 581,194 person-years. Overall,
at baseline, 1% of men reported history of type 2 diabetes, and16% reported personal history of hypertension; 2% had history
of myocardial infarction, and 17% reported to be currentsmokers. Subjects were subgrouped by cut points of TG/HDL-Cof 3.5 (Table 1). Men with high ratio (TG/HDL-C Q3.5) had ahigher prevalence of obesity defined by body mass index (BMI)or by waist girth. They also had a higher prevalence of highfasting plasma glucose, TGs, and nonYHDL-C; reduced HDL-C;and increased blood pressure (Table 1).
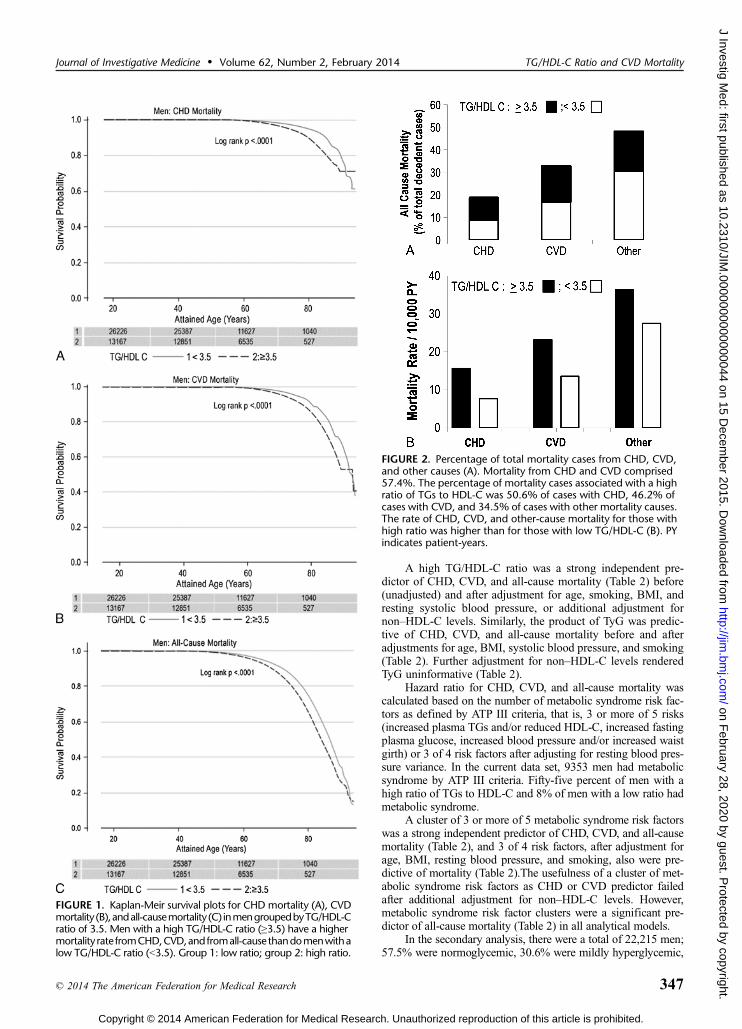
Two thousand seven hundred fifty three men died over theperiod of observation. Kaplan-Meier plots for CHD mortality,CVD mortality, and all-cause mortality are shown in Figures 1AYC,respectively. These data show that CHD and CVD mortalitywas significantly higher in those with high TG/HDL-C ratio than inthose with a low ratio. Significant differences alsowere noted for all-cause mortality.
The percentage of decedent cases with CHD and CVDcomprised 57.4%, and the remainder died of other causes(Fig. 2A). Among decedents from CHD, CVD, and other causes,50.6%, 46.2%, and 34.5% had mortality associated with a highratio of TGs to HDL-C, respectively (Fig. 2A). Those with a highratio of TGs to HDL-C had higher mortality rates per 10,000person-years than individuals with a low ratio (Fig. 2B).
TABLE 1. Subject Demography and Clinical Characteristics
TG/HDL-C Ratio
G3.5 Q3.5
Mean T SD
n 26,261 13,186Follow-up, y 14.7 T 7.9 14.8 T 7.6Age, y 44.3 T 10.0 45.5 T 9.3*BMI, kg/m2 26.0 T 3.6 28.6 T 4.2*% BMI 930 kg/m2 11.0 28.0Waist girth, cm 90.3 T 15.7 98.1 T 16.6Elevated waist girth, % 14.0 37.0Fasting plasma glucose,mg/dL
98.5 T 13.1 104.7 T 25.8*
Plasma glucoseQ100 mg/dL, %
39.0 53.0*
Plasma TG median,† mg/dL 91 (69Y117) 201 (164Y261)*% Plasma TG Q150 mg/dL 5.0 84.0*HDL-C, mg/dL 50.7 T 11.3 36.5 T 7.3*Reduced HDL-C, % 14.0 69.0*TG/HDL-C ratio 1.91 T 0.78 7.20 T 16.80*NonYHDL-C, mg/dL 150.0 T 36.9 184.2 T 41.3*NonYHDL-C Q160 mg/dL, % 36.0 71.0Systolic blood pressure,mm Hg
120.8 T 13.2 124.0 T 13.7*
Systolic blood pressureQ130 mmHg, %
24.0 33.0*
Diastolic blood pressure,mm Hg
80.6 T 9.5 83.8 T 9.7*
Diastolic blood pressureQ85 mmHg, %
30 42*
% Smokers 15 21*% DM 1 2*% Hypertension 13 22*% Metabolic syndrome (ATP III) 8 55*
*Significantly different from parameters in groups with low TG/HDL-C ratio, P G 0.0001.
†Median (25thY75th percentile).
Vega et al Journal of Investigative Medicine & Volume 62, Number 2, February 2014
346 * 2014 The American Federation for Medical Research
Copyright © 2014 American Federation for Medical Research. Unauthorized reproduction of this article is prohibited.
on February 28, 2020 by guest. P
rotected by copyright.http://jim
.bmj.com
/J Investig M
ed: first published as 10.2310/JIM.0000000000000044 on 15 D
ecember 2015. D
ownloaded from
A high TG/HDL-C ratio was a strong independent pre-dictor of CHD, CVD, and all-cause mortality (Table 2) before(unadjusted) and after adjustment for age, smoking, BMI, andresting systolic blood pressure, or additional adjustment fornonYHDL-C levels. Similarly, the product of TyG was predic-tive of CHD, CVD, and all-cause mortality before and afteradjustments for age, BMI, systolic blood pressure, and smoking(Table 2). Further adjustment for nonYHDL-C levels renderedTyG uninformative (Table 2).
Hazard ratio for CHD, CVD, and all-cause mortality wascalculated based on the number of metabolic syndrome risk fac-tors as defined by ATP III criteria, that is, 3 or more of 5 risks(increased plasma TGs and/or reduced HDL-C, increased fastingplasma glucose, increased blood pressure and/or increased waistgirth) or 3 of 4 risk factors after adjusting for resting blood pres-sure variance. In the current data set, 9353 men had metabolicsyndrome by ATP III criteria. Fifty-five percent of men with ahigh ratio of TGs to HDL-C and 8% of men with a low ratio hadmetabolic syndrome.
A cluster of 3 or more of 5 metabolic syndrome risk factorswas a strong independent predictor of CHD, CVD, and all-causemortality (Table 2), and 3 of 4 risk factors, after adjustment forage, BMI, resting blood pressure, and smoking, also were pre-dictive of mortality (Table 2).The usefulness of a cluster of met-abolic syndrome risk factors as CHD or CVD predictor failedafter additional adjustment for nonYHDL-C levels. However,metabolic syndrome risk factor clusters were a significant pre-dictor of all-cause mortality (Table 2) in all analytical models.
In the secondary analysis, there were a total of 22,215 men;57.5% were normoglycemic, 30.6% were mildly hyperglycemic,
FIGURE 1. Kaplan-Meir survival plots for CHD mortality (A), CVDmortality (B),andall-causemortality (C) inmengroupedbyTG/HDL-Cratio of 3.5. Men with a high TG/HDL-C ratio (Q3.5) have a highermortality rate fromCHD,CVD,and fromall-cause thandomenwithalow TG/HDL-C ratio (G3.5). Group 1: low ratio; group 2: high ratio.
FIGURE 2. Percentage of total mortality cases from CHD, CVD,and other causes (A). Mortality from CHD and CVD comprised57.4%. The percentage of mortality cases associated with a highratio of TGs to HDL-C was 50.6% of cases with CHD, 46.2% ofcases with CVD, and 34.5% of cases with other mortality causes.The rate of CHD, CVD, and other-cause mortality for those withhigh ratio was higher than for those with low TG/HDL-C (B). PYindicates patient-years.
Journal of Investigative Medicine & Volume 62, Number 2, February 2014 TG/HDL-C Ratio and CVD Mortality
* 2014 The American Federation for Medical Research 347
Copyright © 2014 American Federation for Medical Research. Unauthorized reproduction of this article is prohibited.
on February 28, 2020 by guest. P
rotected by copyright.http://jim
.bmj.com
/J Investig M
ed: first published as 10.2310/JIM.0000000000000044 on 15 D
ecember 2015. D
ownloaded from
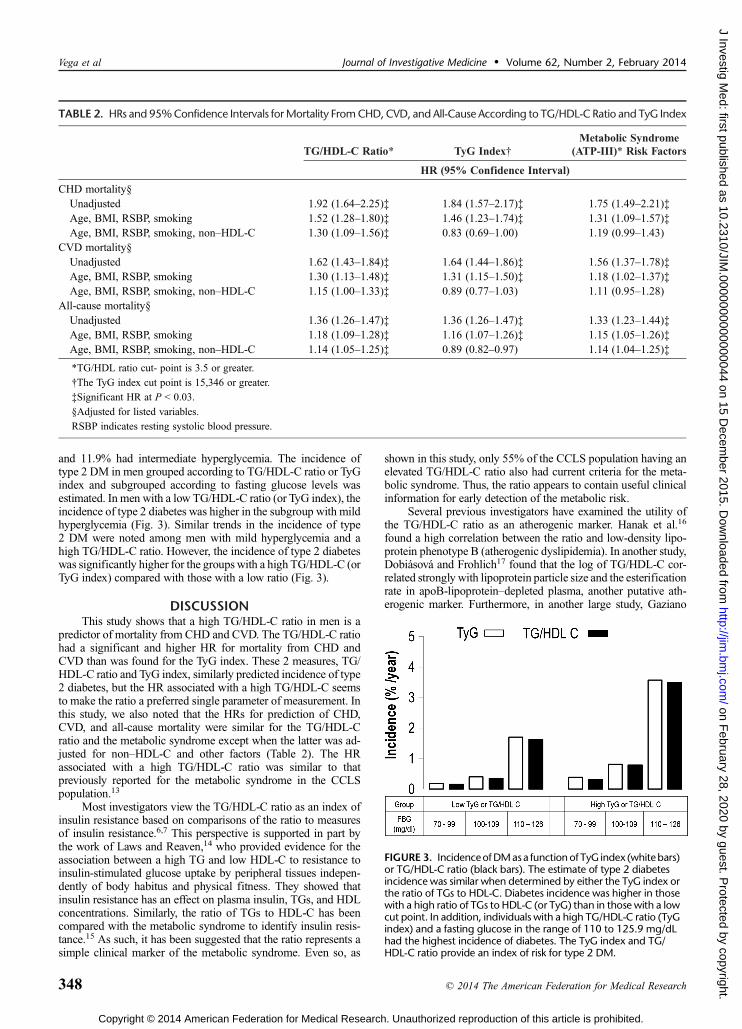
and 11.9% had intermediate hyperglycemia. The incidence oftype 2 DM in men grouped according to TG/HDL-C ratio or TyGindex and subgrouped according to fasting glucose levels wasestimated. In men with a low TG/HDL-C ratio (or TyG index), theincidence of type 2 diabetes was higher in the subgroup with mildhyperglycemia (Fig. 3). Similar trends in the incidence of type2 DM were noted among men with mild hyperglycemia and ahigh TG/HDL-C ratio. However, the incidence of type 2 diabeteswas significantly higher for the groups with a high TG/HDL-C (orTyG index) compared with those with a low ratio (Fig. 3).
DISCUSSIONThis study shows that a high TG/HDL-C ratio in men is a
predictor of mortality from CHD and CVD. The TG/HDL-C ratiohad a significant and higher HR for mortality from CHD andCVD than was found for the TyG index. These 2 measures, TG/HDL-C ratio and TyG index, similarly predicted incidence of type2 diabetes, but the HR associated with a high TG/HDL-C seemsto make the ratio a preferred single parameter of measurement. Inthis study, we also noted that the HRs for prediction of CHD,CVD, and all-cause mortality were similar for the TG/HDL-Cratio and the metabolic syndrome except when the latter was ad-justed for nonYHDL-C and other factors (Table 2). The HRassociated with a high TG/HDL-C ratio was similar to thatpreviously reported for the metabolic syndrome in the CCLSpopulation.13
Most investigators view the TG/HDL-C ratio as an index ofinsulin resistance based on comparisons of the ratio to measuresof insulin resistance.6,7 This perspective is supported in part bythe work of Laws and Reaven,14 who provided evidence for theassociation between a high TG and low HDL-C to resistance toinsulin-stimulated glucose uptake by peripheral tissues indepen-dently of body habitus and physical fitness. They showed thatinsulin resistance has an effect on plasma insulin, TGs, and HDLconcentrations. Similarly, the ratio of TGs to HDL-C has beencompared with the metabolic syndrome to identify insulin resis-tance.15 As such, it has been suggested that the ratio represents asimple clinical marker of the metabolic syndrome. Even so, as
shown in this study, only 55% of the CCLS population having anelevated TG/HDL-C ratio also had current criteria for the meta-bolic syndrome. Thus, the ratio appears to contain useful clinicalinformation for early detection of the metabolic risk.
Several previous investigators have examined the utility ofthe TG/HDL-C ratio as an atherogenic marker. Hanak et al.16
found a high correlation between the ratio and low-density lipo-protein phenotype B (atherogenic dyslipidemia). In another study,Dobiasova and Frohlich17 found that the log of TG/HDL-C cor-related strongly with lipoprotein particle size and the esterificationrate in apoB-lipoproteinYdepleted plasma, another putative ath-erogenic marker. Furthermore, in another large study, Gaziano
TABLE 2. HRs and 95%Confidence Intervals forMortality FromCHD,CVD, and All-Cause According to TG/HDL-C Ratio and TyG Index
TG/HDL-C Ratio* TyG Index†Metabolic Syndrome
(ATP-III)* Risk Factors
HR (95% Confidence Interval)
CHD mortality§Unadjusted 1.92 (1.64Y2.25)‡ 1.84 (1.57Y2.17)‡ 1.75 (1.49Y2.21)‡Age, BMI, RSBP, smoking 1.52 (1.28Y1.80)‡ 1.46 (1.23Y1.74)‡ 1.31 (1.09Y1.57)‡Age, BMI, RSBP, smoking, nonYHDL-C 1.30 (1.09Y1.56)‡ 0.83 (0.69Y1.00) 1.19 (0.99Y1.43)
CVD mortality§Unadjusted 1.62 (1.43Y1.84)‡ 1.64 (1.44Y1.86)‡ 1.56 (1.37Y1.78)‡Age, BMI, RSBP, smoking 1.30 (1.13Y1.48)‡ 1.31 (1.15Y1.50)‡ 1.18 (1.02Y1.37)‡Age, BMI, RSBP, smoking, nonYHDL-C 1.15 (1.00Y1.33)‡ 0.89 (0.77Y1.03) 1.11 (0.95Y1.28)
All-cause mortality§Unadjusted 1.36 (1.26Y1.47)‡ 1.36 (1.26Y1.47)‡ 1.33 (1.23Y1.44)‡Age, BMI, RSBP, smoking 1.18 (1.09Y1.28)‡ 1.16 (1.07Y1.26)‡ 1.15 (1.05Y1.26)‡Age, BMI, RSBP, smoking, nonYHDL-C 1.14 (1.05Y1.25)‡ 0.89 (0.82Y0.97) 1.14 (1.04Y1.25)‡
*TG/HDL ratio cut- point is 3.5 or greater.
†The TyG index cut point is 15,346 or greater.
‡Significant HR at P G 0.03.
§Adjusted for listed variables.
RSBP indicates resting systolic blood pressure.
FIGURE 3. IncidenceofDMasa functionof TyG index (whitebars)or TG/HDL-C ratio (black bars). The estimate of type 2 diabetesincidence was similar when determined by either the TyG index orthe ratio of TGs to HDL-C. Diabetes incidence was higher in thosewith a high ratio of TGs to HDL-C (or TyG) than in those with a lowcut point. In addition, individuals with a high TG/HDL-C ratio (TyGindex) and a fasting glucose in the range of 110 to 125.9 mg/dLhad the highest incidence of diabetes. The TyG index and TG/HDL-C ratio provide an index of risk for type 2 DM.
Vega et al Journal of Investigative Medicine & Volume 62, Number 2, February 2014
348 * 2014 The American Federation for Medical Research
Copyright © 2014 American Federation for Medical Research. Unauthorized reproduction of this article is prohibited.
on February 28, 2020 by guest. P
rotected by copyright.http://jim
.bmj.com
/J Investig M
ed: first published as 10.2310/JIM.0000000000000044 on 15 D
ecember 2015. D
ownloaded from
et al.18 found that the ratio of TGs to HDL was a strong predictorof myocardial infarction. In accord, Salazar et al.19 reported thatan elevated TG/HDL-C ratio is as effective as the metabolic syn-drome for predicting the development of CVD. Other studies sug-gest the potential use of the TG/HDL-C ratio as an atherogenicmarker. For example, Urbina et al.20 found that the TG/HDL-Cratio is associated with arterial stiffness in younger persons.
Despite these claims of utility of the TG/HDL-C for identi-fying a higher risk state, Kannel et al.21 questioned whether thisratio is better than the total cholesterol/HDL-C ratio for definingrisk for CHD. For the Framingham Heart Study population, theseworkers found that the TG/HDL-C correlated with insulin resis-tance (estimated by homeostasis model assessmentYinsulin re-sistance) only moderately. Furthermore, these ratios had power topredict CHD only slightly better than did the total cholesterol/HDL-C ratio.
Despite its limitations, the TG/HDL-C ratio has severaladvantages. A high ratio is suggestive of insulin resistance andmetabolic syndrome. Its presence should alert the clinician to thelikelihood of a metabolic disorder. A careful evaluation for the pre-sence of the metabolic syndrome is indicated. A high ratio is also arisk factor for CVD. Its presence should lead to a full Framinghamrisk scoring to determine absolute risk. Although there is overlapbetween the TG/HDL-C ratio and the metabolic syndrome, almosthalf of persons with a high ratio did not have the syndrome. There-fore, it independently points to greater risk for CVD. At the sametime, the finding of a high ratio calls for more attention to indi-vidual metabolic risk factors such as abdominal obesity, hyper-tension, and dysglycemia.
The finding of a high TG/HDL-C ratio is not a replacementfor the metabolic syndrome in clinical practice. Rather, it is asimple number to serve as an alert that a patient is both at in-creased metabolic risk and cardiovascular risk. Its presenceshould lead to a more intensive evaluation for these 2 types ofrisk and, if necessary, to more intensive clinical intervention. Itis also important to recognize that TG/HDL-C ratio predictsCHD and CVD mortality for those who have a high ratio in-dependently of the presence of metabolic syndrome and of type2 DM as shown in the current study.
ACKNOWLEDGMENTSThe authors thank Dr Kenneth H. Cooper for establishing
the CCLS, the Cooper Clinic physicians and technicians forcollection of baseline data, and The Cooper Institute’s datamanagement team for database maintenance.
REFERENCES
1. Hokanson JE, Austin MA. Plasma triglyceride level is a risk factor forcardiovascular disease independent of high-density lipoproteincholesterol level: a meta-analysis of population-based prospectivestudies. J Cardiovasc Risk. 1996;3(2):213Y219.
2. Sarwar N, Danesh J, Eiriksdottir G, et al. Triglycerides and the risk ofcoronary heart disease: 10,158 incident cases among 262,525participants in 29 Western prospective studies [published online aheadof print December 26, 2006]. Circulation. 2007;115(4):450Y458.
3. Ginsberg HN, Zhang YL, Hernandez-Ono A. Regulation of plasmatriglycerides in insulin resistance and diabetes [review]. Arch Med Res.2005;36(3):232Y240.
4. Grundy SM, Cleeman JI, Daniels SR, et al. American HeartAssociation; National Heart, Lung, and Blood Institute. Diagnosis andmanagement of the metabolic syndrome: an American HeartAssociation/National Heart, Lung, and Blood Institute scientificstatement [published online ahead of print September 12, 2005]
[published correction appears in Circulation 2005;112(17):e297, e298][review]. Circulation. 2005;112(17):2735Y2752.
5. Grundy SM. Hypertriglyceridemia, atherogenic dyslipidemia, and themetabolic syndrome [review]. Am J Cardiol. 1998;81(4A):18BY25B.
6. McLaughlin T, Reaven G, Abbasi F, et al. Is there a simple way toidentify insulin-resistant individuals at increased risk of cardiovasculardisease? Am J Cardiol. 2005;96(3):399Y404.
7. Abbasi F, Reaven GM. Comparison of two methods using plasmatriglyceride concentration as a surrogate estimate of insulin action innondiabetic subjects: triglycerides � glucose versus triglyceride/high-density lipoprotein cholesterol [published online ahead of printMay 31, 2011]. Metabolism. 2011;60(12):1673Y1676.
8. Guerrero-Romero F, Simental-Mendia LE, Gonzalez-Ortiz M, et al. Theproduct of triglycerides and glucose, a simple measure of insulinsensitivity. Comparison with the euglycemic-hyperinsulinemic clamp.J Clin Endocrinol Metab. 2010;95(7):3347Y3351.
9. Blair SN, Kohl HW 3rd, Paffenbarger RS Jr, et al. Physical fitness andall-cause mortality. A prospective study of healthy men and women.JAMA. 1989;262(17):2395Y2401.
10. DeFina LF, Vega GL, Leonard D, et al. Fasting glucose, obesity, andmetabolic syndrome as predictors of type 2 diabetes: the Cooper CenterLongitudinal Study. J Investig Med. 2012;60(8):1164Y1168.
11. American Heart Association; National Heart, Lung, and Blood Institute,Grundy SM, Cleeman JI, Daniels SR, et al. Diagnosis and managementof the metabolic syndrome. An American Heart Association/NationalHeart, Lung, and Blood Institute scientific statement. Executivesummary. Cardiol Rev. 2005;13(6):322Y327.
12. Grundy SM. Metabolic syndrome: a multiplex cardiovascular riskfactor. J Clin Endocrinol Metab. 2007;92:399Y404.
13. Church TS, Thompson AM, Katzmarzyk PT, et al. Metabolic syndromeand diabetes, alone and in combination, as predictors of cardiovasculardisease mortality among men. Diabetes Care. 2009;32(7):1289Y1294.
14. Laws A, Reaven GM. Evidence for an independent relationship betweeninsulin resistance and fasting plasma HDL-cholesterol, triglyceride andinsulin concentrations. J Intern Med. 1992;231(1):25Y30.
15. Salazar MR, Carbajal HA, Espeche WG, et al. Comparison of theabilities of the plasma triglyceride/high-density lipoprotein cholesterolratio and the metabolic syndrome to identify insulin resistance. DiabVasc Dis Res. 2013;10(4):346Y352.
16. Hanak V, Munoz J, Teague J, et al. Accuracy of the triglyceride tohigh-density lipoprotein cholesterol ratio for prediction of thelow-density lipoprotein phenotype B. Am J Cardiol.2004;94(2):219Y222.
17. Dobiasova M, Frohlich J. The plasma parameter log (TG/HDL-C) as anatherogenic index: correlation with lipoprotein particle size andesterification rate in apoB-lipoproteinYdepleted plasma (FER(HDL)).Clin Biochem. 2001;34(7):583Y588.
18. Gaziano JM, Hennekens CH, O’Donnell CJ, et al. Fasting triglycerides,high-density lipoprotein, and risk of myocardial infarction.Circulation. 1997;96(8):2520Y2525.
19. Salazar MR, Carbajal HA, Espeche WG, et al. Identifyingcardiovascular disease risk and outcome: use of the plasma triglyceride/high-density lipoprotein cholesterol concentration ratio versusmetabolic syndrome criteria. J Intern Med. 2013;273:595Y601.
20. Urbina EM, Khoury PR, McCoy CE, et al. Triglyceride to HDL-C ratioand increased arterial stiffness in children, adolescents, and youngadults. Pediatrics. 2013;131(4):e1082Ye1089.
21. Kannel WB, Vasan RS, Keyes MJ, et al. Usefulness of thetriglycerideYhigh-density lipoprotein versus thecholesterol-high-density lipoprotein ratio for predicting insulinresistance and cardiometabolic risk (from the Framingham OffspringCohort). Am J Cardiol. 2008;101(4):497Y501.
Journal of Investigative Medicine & Volume 62, Number 2, February 2014 TG/HDL-C Ratio and CVD Mortality
* 2014 The American Federation for Medical Research 349
Copyright © 2014 American Federation for Medical Research. Unauthorized reproduction of this article is prohibited.
on February 28, 2020 by guest. P
rotected by copyright.http://jim
.bmj.com
/J Investig M
ed: first published as 10.2310/JIM.0000000000000044 on 15 D
ecember 2015. D
ownloaded from

![archive.org ul...‹³³þ³þ³þ³þ³þþ׳³þþ r³þÛ³þÖ] öè³³þ³þ³þ³þ³þ³þ³þþÛ³þ×Ò ³³³³³³³³³³³³³³³³³³³³³³³³](https://img.pdfslide.us/doc/110x75/6091112732f06670ed34df6f/ul-a-r-.jpg)


![Z µ v E Á } l W ^ ] o ] Ç v o Ç ] v >^dD · 2021. 1. 10. · > ] v Ç u Þ Û Þ ? 5 ë Þ ± Þ ? 5 Û Þ ? 6 ë Þ ? 5 Þ Û 6 Þ ? 6 Û ë Þ ? 5 ë Þ Þ Û Þ > 5 ? 5 Û](https://img.pdfslide.us/doc/110x75/60ad1446d0fb8f532e22e374/z-v-e-l-w-o-v-o-v-dd-2021-1-10-v-u-.jpg)