Embed Size (px)
Citation preview
ICLASS 2012, 12th
Triennial International Conference on Liquid Atomization and Spray Systems, Heidelberg, Germany, September 2-6, 2012
Quantifying Statistical Measures of Diesel Spray Soot Characteristics using
Laser-Induced Incandescence
Jaclyn E. Johnson*, Seung Hyun Yoon, Seong-Young Lee, and Jeffrey D. Naber
Michigan Technological University
Mechanical Engineering – Engineering Mechanics Department
Houghton, Michigan, USA
Abstract
Increased understanding is needed with respect to soot formation from high pressure diesel sprays as emis-
sions standards become increasingly stringent and require complex methods for its reduction. Understanding
soot formation and its spatial distributions is necessary to advance fundamental spray combustion knowledge.
Given that the underlying nature of high pressure combusting diesel sprays results in turbulent mixing and com-
bustion, significant variation in the location of soot and its structure is observed even when the conditions of the
test are closely controlled. In this work, diesel spray soot characteristics are studied in a constant volume optical-
ly accessible combustion vessel through the application of laser-induced incandescence (LII). Studies are per-
formed using a piezoelectric high pressure common rail injector with a high cetane (CN=56.5) diesel fuel at an
injection pressure of 620 bar. Combusting sprays are examined at a part load charge-gas condition of 11.6 kg/m3
density, 1300 K temperature, and in 21% oxygen and 15% oxygen (simulating 38% exhaust gas recirculation)
environments. Images are acquired at 1.0 ms after start of injection in 21% oxygen and 1.5 ms after start of injec-
tion in 15% oxygen. Tests are repeated 14 times at each condition to provide a statistically significant sample.
Images are compared, with average images and images of the ratio of the local standard deviation to the average,
or local coefficient of variation, also considered to understand structure variations test to test. The results are
quantified for total soot intensity and location of first soot. From this the required number of samples for a 95%
confidence interval and 5% allowed error are determined.
Introduction
Diesel combustion is largely spray and mixing controlled, and understanding the spatial soot formation
within the combustion chamber is imperative to provide an improved understanding of soot formation and emis-
sions as a function of charge-gas conditions. Laser-induced incandescence (LII) is an optical laser diagnostic that
enables qualitative visualization of soot concentrations. This methodology has been used by various investigators
to provide visual information on soot formation, and, when used in conjunction with laser extinction, quantita-
tive indication of soot levels can be determined [1-4]. In this diagnostic, a high power pulsed laser beam at 532
nm is used to excite the soot particles by depositing energy from the laser beam, which heats the particles, and
their subsequent incandescence is measured with an intensified camera [5-6]. Due to the turbulent and transient
nature of the combusting spray process, there are large shot to shot variations in the observed LII signal. The
goal of this paper is to characterize this variability through visual and quantitative comparisons. This consists of
characterization of statistics including number of samples for a given allowed error, consideration of standard
deviation, coefficient of variation, and average value for quantified values of intensity and location of first soot.
Additionally, a visual comparison of images is undertaken, along with discussion on average and local coeffi-
cient of variation images.
Experimental Setup
Experiments were conducted in the optically accessible constant volume chamber shown in Figure 1. The
vessel has an approximately 1 liter internal volume with six face-ports housing three sapphire windows, a spark
plug – dual fan port, a diesel fuel injector port (Figure 1), and one blank port. Additionally, there are eight access
ports on the combustion vessel (CV) cube vertices containing a pressure transducer, inlet and exhaust valves, and
blank ports. A preburn procedure is used to produce representative diesel engine conditions in the combustion
chamber including oxygen level (simulating air – 21% O2 or 38% EGR – 15% O2), pressure, temperature, and
density [7-9]. This process involves spark igniting a fuel-lean acetylene, hydrogen, oxygen and nitrogen gaseous
mixture which yields a precombustion event and pressure rise, followed by a subsequent cool-down. Pressure is
monitored during the cool-down and at the desired pressure (temperature) condition, fuel injection is triggered
and combustion of the diesel liquid fuel ensues. Full details on this combustion vessel and its operation and use
are provided in [10-12].
*Corresponding author: [email protected]
ICLASS 2012, 12th
Triennial International Conference on Liquid Atomization and Spray Systems, Heidelberg, Germany, September 2-6, 2012
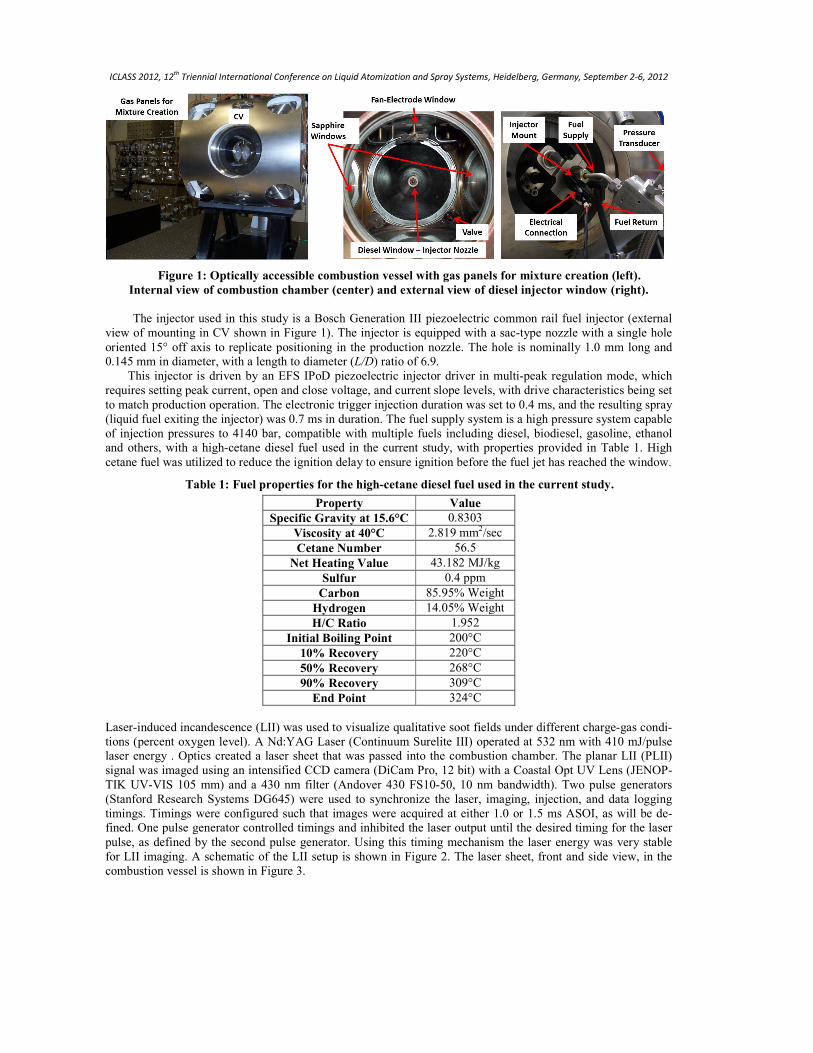
Figure 1: Optically accessible combustion vessel with gas panels for mixture creation (left).
Internal view of combustion chamber (center) and external view of diesel injector window (right).
The injector used in this study is a Bosch Generation III piezoelectric common rail fuel injector (external
view of mounting in CV shown in Figure 1). The injector is equipped with a sac-type nozzle with a single hole
oriented 15° off axis to replicate positioning in the production nozzle. The hole is nominally 1.0 mm long and
0.145 mm in diameter, with a length to diameter (L/D) ratio of 6.9.
This injector is driven by an EFS IPoD piezoelectric injector driver in multi-peak regulation mode, which
requires setting peak current, open and close voltage, and current slope levels, with drive characteristics being set
to match production operation. The electronic trigger injection duration was set to 0.4 ms, and the resulting spray
(liquid fuel exiting the injector) was 0.7 ms in duration. The fuel supply system is a high pressure system capable
of injection pressures to 4140 bar, compatible with multiple fuels including diesel, biodiesel, gasoline, ethanol
and others, with a high-cetane diesel fuel used in the current study, with properties provided in Table 1. High
cetane fuel was utilized to reduce the ignition delay to ensure ignition before the fuel jet has reached the window.
Table 1: Fuel properties for the high-cetane diesel fuel used in the current study.
Property Value
Specific Gravity at 15.6°C 0.8303
Viscosity at 40°C 2.819 mm2/sec
Cetane Number 56.5
Net Heating Value 43.182 MJ/kg
Sulfur 0.4 ppm
Carbon 85.95% Weight
Hydrogen 14.05% Weight
H/C Ratio 1.952
Initial Boiling Point 200°C
10% Recovery 220°C
50% Recovery 268°C
90% Recovery 309°C
End Point 324°C
Laser-induced incandescence (LII) was used to visualize qualitative soot fields under different charge-gas condi-
tions (percent oxygen level). A Nd:YAG Laser (Continuum Surelite III) operated at 532 nm with 410 mJ/pulse
laser energy . Optics created a laser sheet that was passed into the combustion chamber. The planar LII (PLII)
signal was imaged using an intensified CCD camera (DiCam Pro, 12 bit) with a Coastal Opt UV Lens (JENOP-
TIK UV-VIS 105 mm) and a 430 nm filter (Andover 430 FS10-50, 10 nm bandwidth). Two pulse generators
(Stanford Research Systems DG645) were used to synchronize the laser, imaging, injection, and data logging
timings. Timings were configured such that images were acquired at either 1.0 or 1.5 ms ASOI, as will be de-
fined. One pulse generator controlled timings and inhibited the laser output until the desired timing for the laser
pulse, as defined by the second pulse generator. Using this timing mechanism the laser energy was very stable
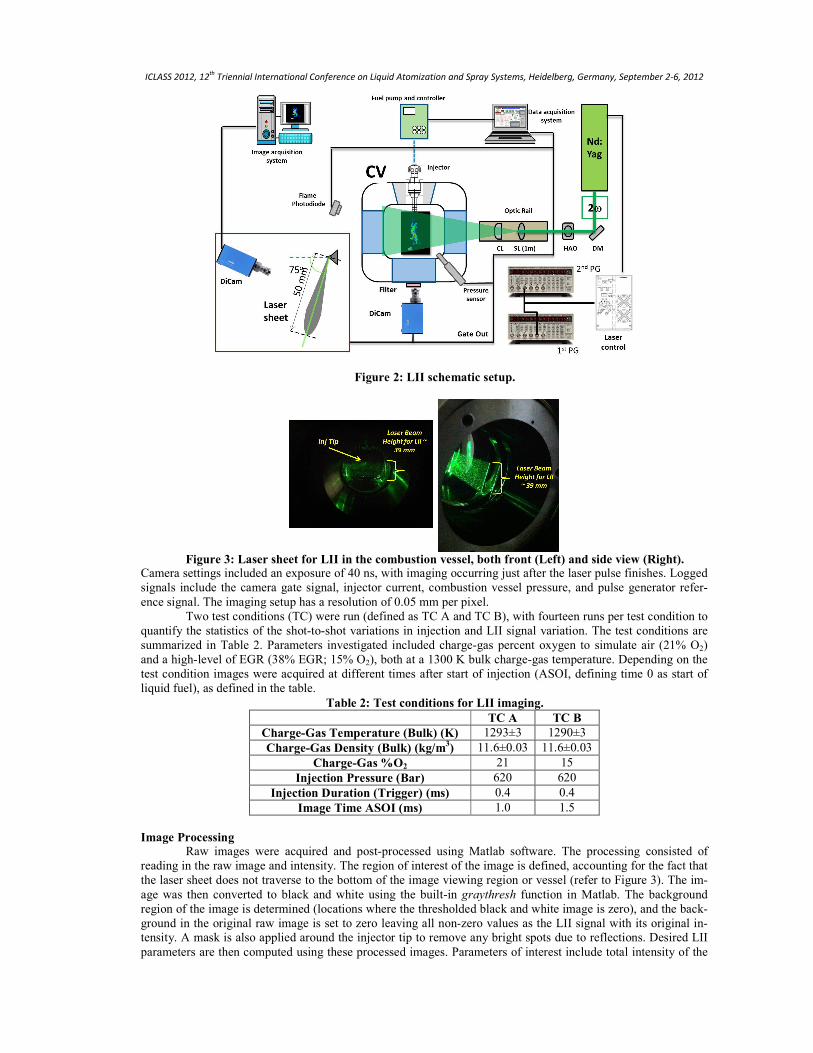
for LII imaging. A schematic of the LII setup is shown in Figure 2. The laser sheet, front and side view, in the
combustion vessel is shown in Figure 3.
ICLASS 2012, 12th
Triennial International Conference on Liquid Atomization and Spray Systems, Heidelberg, Germany, September 2-6, 2012
Figure 2: LII schematic setup.
Figure 3: Laser sheet for LII in the combustion vessel, both front (Left) and side view (Right).
Camera settings included an exposure of 40 ns, with imaging occurring just after the laser pulse finishes. Logged
signals include the camera gate signal, injector current, combustion vessel pressure, and pulse generator refer-
ence signal. The imaging setup has a resolution of 0.05 mm per pixel.
Two test conditions (TC) were run (defined as TC A and TC B), with fourteen runs per test condition to
quantify the statistics of the shot-to-shot variations in injection and LII signal variation. The test conditions are
summarized in Table 2. Parameters investigated included charge-gas percent oxygen to simulate air (21% O2)
and a high-level of EGR (38% EGR; 15% O2), both at a 1300 K bulk charge-gas temperature. Depending on the
test condition images were acquired at different times after start of injection (ASOI, defining time 0 as start of
liquid fuel), as defined in the table.
Table 2: Test conditions for LII imaging.
TC A TC B
Charge-Gas Temperature (Bulk) (K) 1293±3 1290±3
Charge-Gas Density (Bulk) (kg/m3) 11.6±0.03 11.6±0.03
Charge-Gas %O2 21 15
Injection Pressure (Bar) 620 620
Injection Duration (Trigger) (ms) 0.4 0.4
Image Time ASOI (ms) 1.0 1.5
Image Processing
Raw images were acquired and post-processed using Matlab software. The processing consisted of
reading in the raw image and intensity. The region of interest of the image is defined, accounting for the fact that
the laser sheet does not traverse to the bottom of the image viewing region or vessel (refer to Figure 3). The im-
age was then converted to black and white using the built-in graythresh function in Matlab. The background
region of the image is determined (locations where the thresholded black and white image is zero), and the back-
ground in the original raw image is set to zero leaving all non-zero values as the LII signal with its original in-
tensity. A mask is also applied around the injector tip to remove any bright spots due to reflections. Desired LII
parameters are then computed using these processed images. Parameters of interest include total intensity of the
ICLASS 2012, 12th
Triennial International Conference on Liquid Atomization and Spray Systems, Heidelberg, Germany, September 2-6, 2012
LII signal and location of first soot. Total intensity is determined by summing all of the pixel intensities in the
image (background pixels are set to zero and therefore do not contribute). An intensity profile is determined
from the injector tip downstream the combusting spray plume LII signal to determine location of first soot. The
spray plume is orientated vertically and in one pixel increments the intensity is summed horizontally across the
LII signal to provide an intensity distribution of soot from the injector tip downstream. This intensity distribution
profile is used to define location of first soot, by taking the cumulative sum of the integrated intensity profile,
finding the first location, relative to the injector tip, where this cumulative sum of the intensity distribution ex-
ceeds a set, constant threshold of 500,000 counts. Images over the fourteen tests were also averaged to provide
an average image. Finally, each image was smoothed using 3x3 pixel average (0.15x0.15 mm), and the standard
deviation pixel to pixel over all fourteen images was determined to define the local standard deviation image,
which was divided by the local average image to compute a local coefficient of variation image.
Results and Discussion
Results are separated by test condition with each of the fourteen LII images displayed for visualization.
Based on the orientation of the image and camera, the laser sheet passes through the images from left to right.
The average image is also shown in the results section over the fourteen images, along with the local coefficient
of variation image. The image processing results are then quantified and defined for total intensity and location
of first soot, including a statistical analysis of the results in terms of mean, standard deviation, and coefficient of
variation (COV), the ratio of the standard deviation to the mean represented as a percentage. Also determined is
the 95% confidence interval of the measurement, calculated from
sNCI
σ96.1%95
±= , (1)
where CI95% is the 95% confidence interval, σ is the standard deviation, and Ns is the total number of samples, 14
in this case. Also presented is a statistical analysis for the required number of tests for a 95% confidence interval
and results within 5% of the mean.
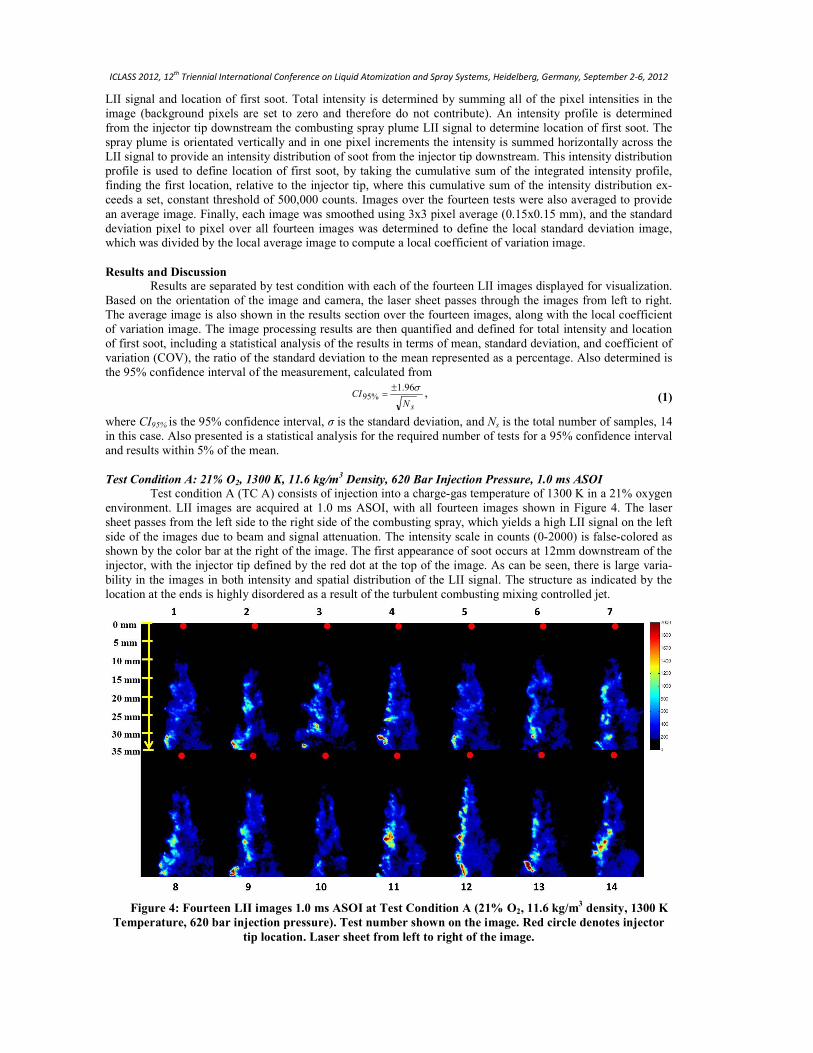
Test Condition A: 21% O2, 1300 K, 11.6 kg/m3 Density, 620 Bar Injection Pressure, 1.0 ms ASOI
Test condition A (TC A) consists of injection into a charge-gas temperature of 1300 K in a 21% oxygen
environment. LII images are acquired at 1.0 ms ASOI, with all fourteen images shown in Figure 4. The laser
sheet passes from the left side to the right side of the combusting spray, which yields a high LII signal on the left
side of the images due to beam and signal attenuation. The intensity scale in counts (0-2000) is false-colored as
shown by the color bar at the right of the image. The first appearance of soot occurs at 12mm downstream of the
injector, with the injector tip defined by the red dot at the top of the image. As can be seen, there is large varia-
bility in the images in both intensity and spatial distribution of the LII signal. The structure as indicated by the
location at the ends is highly disordered as a result of the turbulent combusting mixing controlled jet.
Figure 4: Fourteen LII images 1.0 ms ASOI at Test Condition A (21% O2, 11.6 kg/m
3 density, 1300 K
Temperature, 620 bar injection pressure). Test number shown on the image. Red circle denotes injector
tip location. Laser sheet from left to right of the image.
ICLASS 2012, 12th
Triennial International Conference on Liquid Atomization and Spray Systems, Heidelberg, Germany, September 2-6, 2012
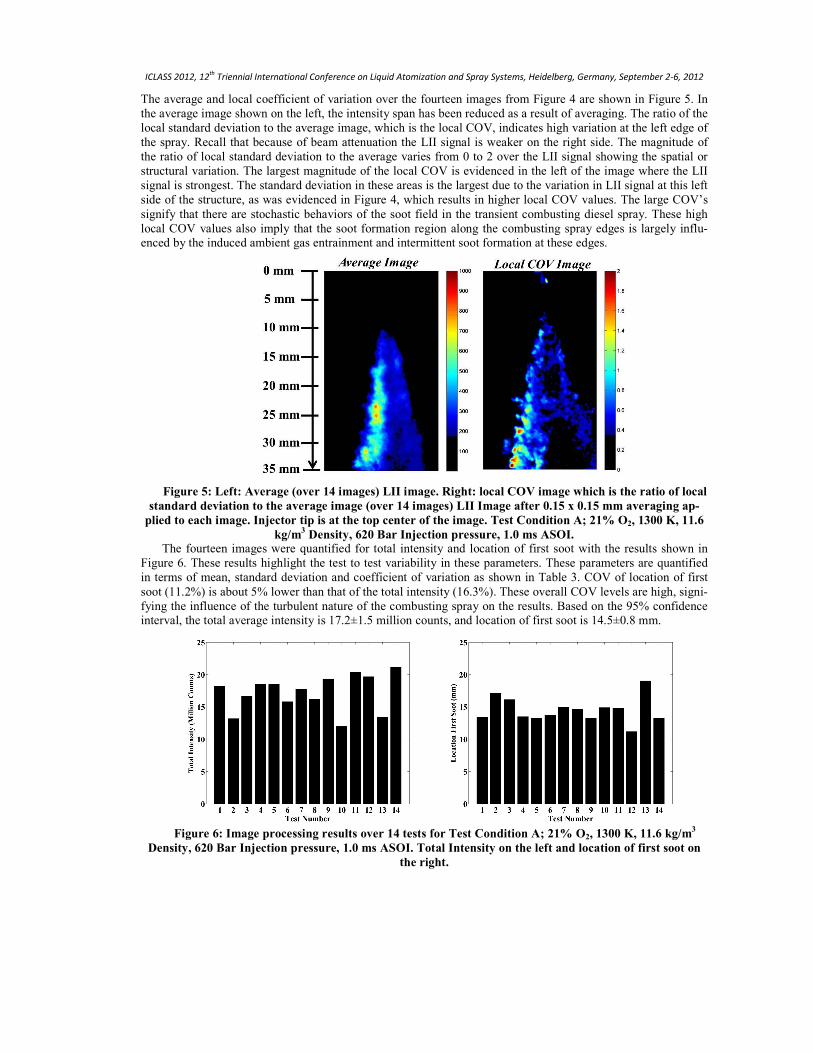
The average and local coefficient of variation over the fourteen images from Figure 4 are shown in Figure 5. In
the average image shown on the left, the intensity span has been reduced as a result of averaging. The ratio of the
local standard deviation to the average image, which is the local COV, indicates high variation at the left edge of
the spray. Recall that because of beam attenuation the LII signal is weaker on the right side. The magnitude of
the ratio of local standard deviation to the average varies from 0 to 2 over the LII signal showing the spatial or
structural variation. The largest magnitude of the local COV is evidenced in the left of the image where the LII
signal is strongest. The standard deviation in these areas is the largest due to the variation in LII signal at this left
side of the structure, as was evidenced in Figure 4, which results in higher local COV values. The large COV’s
signify that there are stochastic behaviors of the soot field in the transient combusting diesel spray. These high
local COV values also imply that the soot formation region along the combusting spray edges is largely influ-
enced by the induced ambient gas entrainment and intermittent soot formation at these edges.
Figure 5: Left: Average (over 14 images) LII image. Right: local COV image which is the ratio of local
standard deviation to the average image (over 14 images) LII Image after 0.15 x 0.15 mm averaging ap-
plied to each image. Injector tip is at the top center of the image. Test Condition A; 21% O2, 1300 K, 11.6
kg/m3 Density, 620 Bar Injection pressure, 1.0 ms ASOI.
The fourteen images were quantified for total intensity and location of first soot with the results shown in
Figure 6. These results highlight the test to test variability in these parameters. These parameters are quantified
in terms of mean, standard deviation and coefficient of variation as shown in Table 3. COV of location of first
soot (11.2%) is about 5% lower than that of the total intensity (16.3%). These overall COV levels are high, signi-
fying the influence of the turbulent nature of the combusting spray on the results. Based on the 95% confidence
interval, the total average intensity is 17.2±1.5 million counts, and location of first soot is 14.5±0.8 mm.
Figure 6: Image processing results over 14 tests for Test Condition A; 21% O2, 1300 K, 11.6 kg/m
3
Density, 620 Bar Injection pressure, 1.0 ms ASOI. Total Intensity on the left and location of first soot on
the right.
ICLASS 2012, 12th
Triennial International Conference on Liquid Atomization and Spray Systems, Heidelberg, Germany, September 2-6, 2012
Table 3: Mean, standard deviation, coefficient of variation and 95% confidence interval (CI)
for total intensity and location of first soot for Test Condition A
Mean Standard
Deviation COV (%) 95% CI
Total Intensity (Million Counts) 17.2 2.8 16.3 ±1.5
Location of First Soot (mm) 14.5 1.5 11.2 ±0.8
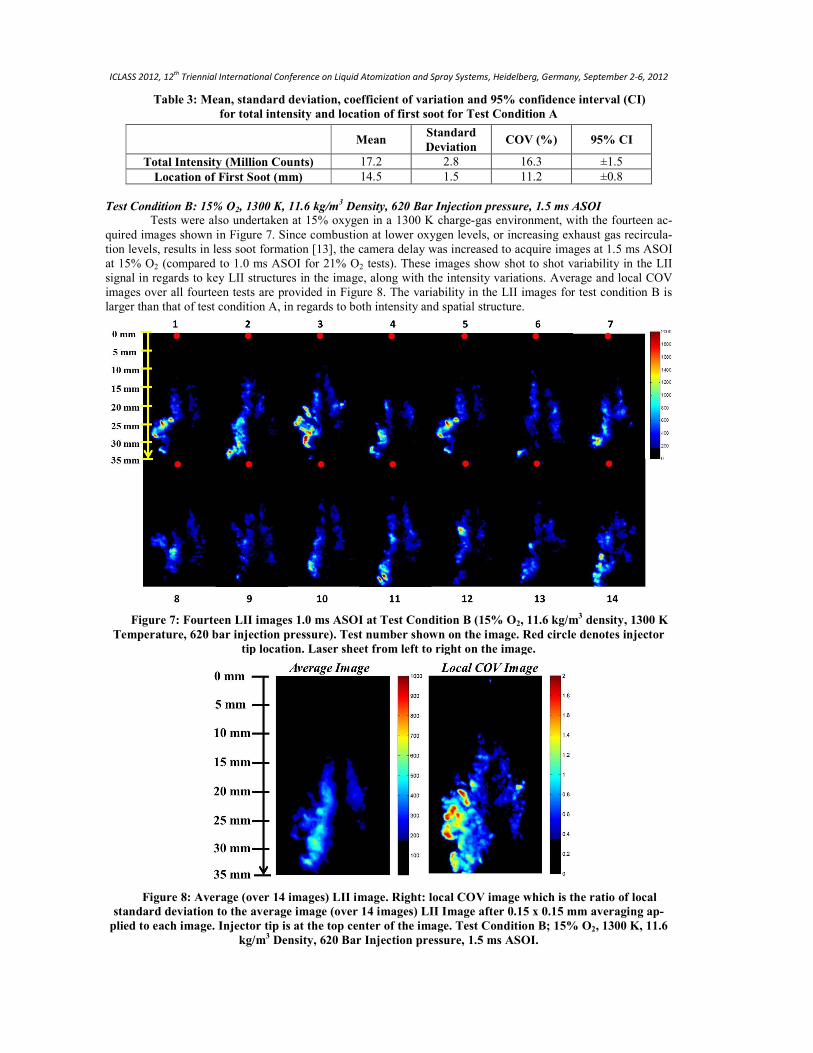
Test Condition B: 15% O2, 1300 K, 11.6 kg/m3 Density, 620 Bar Injection pressure, 1.5 ms ASOI
Tests were also undertaken at 15% oxygen in a 1300 K charge-gas environment, with the fourteen ac-
quired images shown in Figure 7. Since combustion at lower oxygen levels, or increasing exhaust gas recircula-
tion levels, results in less soot formation [13], the camera delay was increased to acquire images at 1.5 ms ASOI
at 15% O2 (compared to 1.0 ms ASOI for 21% O2 tests). These images show shot to shot variability in the LII
signal in regards to key LII structures in the image, along with the intensity variations. Average and local COV
images over all fourteen tests are provided in Figure 8. The variability in the LII images for test condition B is
larger than that of test condition A, in regards to both intensity and spatial structure.
Figure 7: Fourteen LII images 1.0 ms ASOI at Test Condition B (15% O2, 11.6 kg/m
3 density, 1300 K
Temperature, 620 bar injection pressure). Test number shown on the image. Red circle denotes injector
tip location. Laser sheet from left to right on the image.
Figure 8: Average (over 14 images) LII image. Right: local COV image which is the ratio of local
standard deviation to the average image (over 14 images) LII Image after 0.15 x 0.15 mm averaging ap-
plied to each image. Injector tip is at the top center of the image. Test Condition B; 15% O2, 1300 K, 11.6
kg/m3 Density, 620 Bar Injection pressure, 1.5 ms ASOI.
ICLASS 2012, 12th
Triennial International Conference on Liquid Atomization and Spray Systems, Heidelberg, Germany, September 2-6, 2012
The average LII image has reduced variability in LII signal structure which highlights the consistent features in
the LII signal, over multiple tests. Image variability, in terms of the local COV is decreased towards the top of
the LII signal which will lead to consistent locations of first soot as will be discussed. As was the trend with test
condition A, the local COV is largest on the left side of the image, being the smallest on the right side of the im-
age where there is the largest signal attenuation and reduction in intensity, and therefore LII structural differ-
ences are minimal. The local COV ratio is increased at the wider sections of the left side of the image showing
that although these structures are present in a subset of the images (see Figure 7), this structural behavior is not
consistently present and therefore results in an increased ratio of standard deviation to intensity.
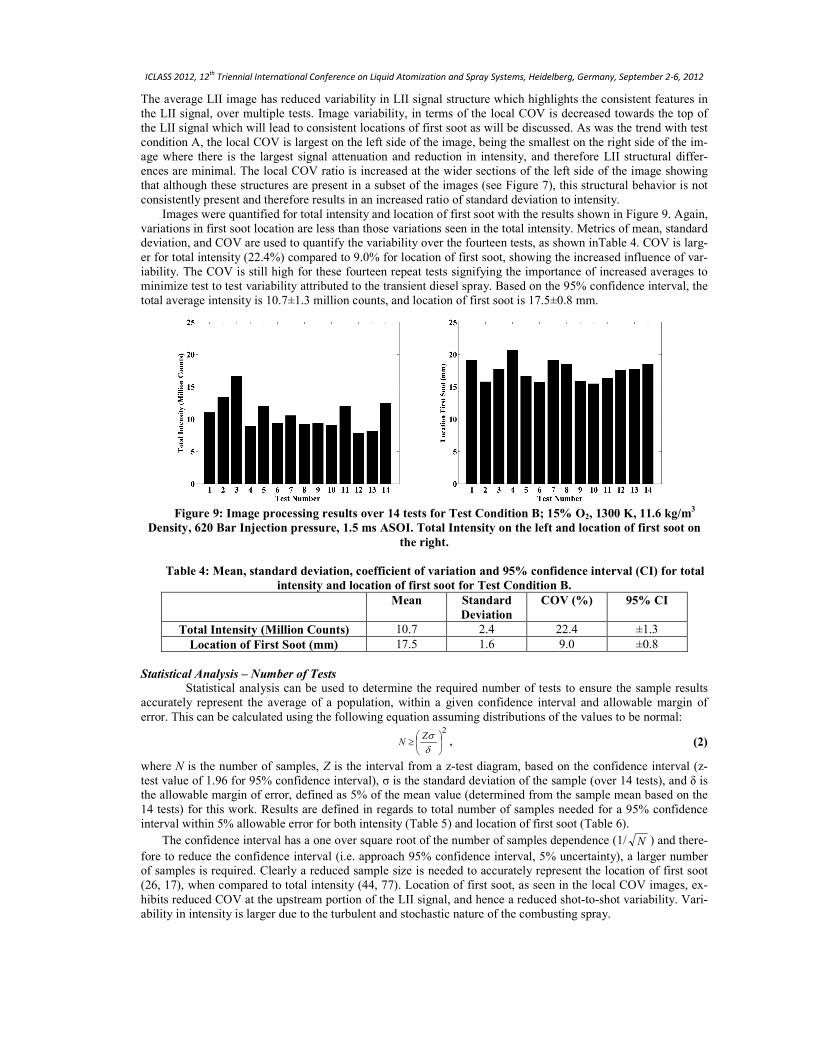
Images were quantified for total intensity and location of first soot with the results shown in Figure 9. Again,
variations in first soot location are less than those variations seen in the total intensity. Metrics of mean, standard
deviation, and COV are used to quantify the variability over the fourteen tests, as shown inTable 4. COV is larg-
er for total intensity (22.4%) compared to 9.0% for location of first soot, showing the increased influence of var-
iability. The COV is still high for these fourteen repeat tests signifying the importance of increased averages to
minimize test to test variability attributed to the transient diesel spray. Based on the 95% confidence interval, the
total average intensity is 10.7±1.3 million counts, and location of first soot is 17.5±0.8 mm.
Figure 9: Image processing results over 14 tests for Test Condition B; 15% O2, 1300 K, 11.6 kg/m
3
Density, 620 Bar Injection pressure, 1.5 ms ASOI. Total Intensity on the left and location of first soot on
the right.
Table 4: Mean, standard deviation, coefficient of variation and 95% confidence interval (CI) for total
intensity and location of first soot for Test Condition B.
Mean Standard
Deviation
COV (%) 95% CI
Total Intensity (Million Counts) 10.7 2.4 22.4 ±1.3
Location of First Soot (mm) 17.5 1.6 9.0 ±0.8
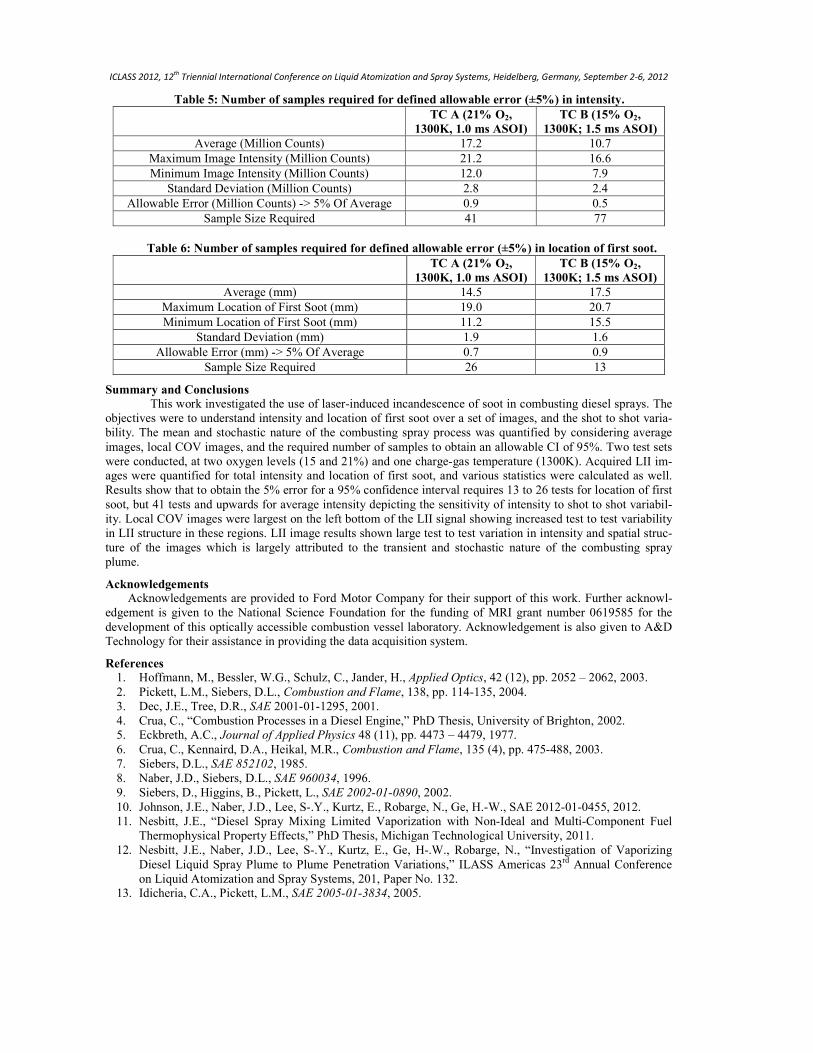
Statistical Analysis – Number of Tests
Statistical analysis can be used to determine the required number of tests to ensure the sample results
accurately represent the average of a population, within a given confidence interval and allowable margin of
error. This can be calculated using the following equation assuming distributions of the values to be normal:
2
≥
δ
σZN , (2)
where N is the number of samples, Z is the interval from a z-test diagram, based on the confidence interval (z-
test value of 1.96 for 95% confidence interval), σ is the standard deviation of the sample (over 14 tests), and δ is
the allowable margin of error, defined as 5% of the mean value (determined from the sample mean based on the
14 tests) for this work. Results are defined in regards to total number of samples needed for a 95% confidence
interval within 5% allowable error for both intensity (Table 5) and location of first soot (Table 6).
The confidence interval has a one over square root of the number of samples dependence (1/ N ) and there-
fore to reduce the confidence interval (i.e. approach 95% confidence interval, 5% uncertainty), a larger number
of samples is required. Clearly a reduced sample size is needed to accurately represent the location of first soot
(26, 17), when compared to total intensity (44, 77). Location of first soot, as seen in the local COV images, ex-
hibits reduced COV at the upstream portion of the LII signal, and hence a reduced shot-to-shot variability. Vari-
ability in intensity is larger due to the turbulent and stochastic nature of the combusting spray.
ICLASS 2012, 12th
Triennial International Conference on Liquid Atomization and Spray Systems, Heidelberg, Germany, September 2-6, 2012
Table 5: Number of samples required for defined allowable error (±5%) in intensity.
TC A (21% O2,
1300K, 1.0 ms ASOI)
TC B (15% O2,
1300K; 1.5 ms ASOI)
Average (Million Counts) 17.2 10.7
Maximum Image Intensity (Million Counts) 21.2 16.6
Minimum Image Intensity (Million Counts) 12.0 7.9
Standard Deviation (Million Counts) 2.8 2.4
Allowable Error (Million Counts) -> 5% Of Average 0.9 0.5
Sample Size Required 41 77
Table 6: Number of samples required for defined allowable error (±5%) in location of first soot.
TC A (21% O2,
1300K, 1.0 ms ASOI)
TC B (15% O2,
1300K; 1.5 ms ASOI)
Average (mm) 14.5 17.5
Maximum Location of First Soot (mm) 19.0 20.7
Minimum Location of First Soot (mm) 11.2 15.5
Standard Deviation (mm) 1.9 1.6
Allowable Error (mm) -> 5% Of Average 0.7 0.9
Sample Size Required 26 13
Summary and Conclusions
This work investigated the use of laser-induced incandescence of soot in combusting diesel sprays. The
objectives were to understand intensity and location of first soot over a set of images, and the shot to shot varia-
bility. The mean and stochastic nature of the combusting spray process was quantified by considering average
images, local COV images, and the required number of samples to obtain an allowable CI of 95%. Two test sets
were conducted, at two oxygen levels (15 and 21%) and one charge-gas temperature (1300K). Acquired LII im-
ages were quantified for total intensity and location of first soot, and various statistics were calculated as well.
Results show that to obtain the 5% error for a 95% confidence interval requires 13 to 26 tests for location of first
soot, but 41 tests and upwards for average intensity depicting the sensitivity of intensity to shot to shot variabil-
ity. Local COV images were largest on the left bottom of the LII signal showing increased test to test variability
in LII structure in these regions. LII image results shown large test to test variation in intensity and spatial struc-
ture of the images which is largely attributed to the transient and stochastic nature of the combusting spray
plume.
Acknowledgements
Acknowledgements are provided to Ford Motor Company for their support of this work. Further acknowl-
edgement is given to the National Science Foundation for the funding of MRI grant number 0619585 for the
development of this optically accessible combustion vessel laboratory. Acknowledgement is also given to A&D
Technology for their assistance in providing the data acquisition system.
References
1. Hoffmann, M., Bessler, W.G., Schulz, C., Jander, H., Applied Optics, 42 (12), pp. 2052 – 2062, 2003.
2. Pickett, L.M., Siebers, D.L., Combustion and Flame, 138, pp. 114-135, 2004.
3. Dec, J.E., Tree, D.R., SAE 2001-01-1295, 2001.
4. Crua, C., “Combustion Processes in a Diesel Engine,” PhD Thesis, University of Brighton, 2002.
5. Eckbreth, A.C., Journal of Applied Physics 48 (11), pp. 4473 – 4479, 1977.
6. Crua, C., Kennaird, D.A., Heikal, M.R., Combustion and Flame, 135 (4), pp. 475-488, 2003.
7. Siebers, D.L., SAE 852102, 1985.
8. Naber, J.D., Siebers, D.L., SAE 960034, 1996.
9. Siebers, D., Higgins, B., Pickett, L., SAE 2002-01-0890, 2002.
10. Johnson, J.E., Naber, J.D., Lee, S-.Y., Kurtz, E., Robarge, N., Ge, H.-W., SAE 2012-01-0455, 2012.
11. Nesbitt, J.E., “Diesel Spray Mixing Limited Vaporization with Non-Ideal and Multi-Component Fuel
Thermophysical Property Effects,” PhD Thesis, Michigan Technological University, 2011.
12. Nesbitt, J.E., Naber, J.D., Lee, S-.Y., Kurtz, E., Ge, H-.W., Robarge, N., “Investigation of Vaporizing
Diesel Liquid Spray Plume to Plume Penetration Variations,” ILASS Americas 23rd
Annual Conference
on Liquid Atomization and Spray Systems, 201, Paper No. 132.
13. Idicheria, C.A., Pickett, L.M., SAE 2005-01-3834, 2005.


![Numerical simulations of supersonic gas atomization of liquid …42]JJAP-2014... · 2018-01-12 · Numerical simulations of supersonic gas atomization of liquid metal droplets Dudi](https://img.pdfslide.us/doc/110x75/5f1e3400e013ce41984ecccd/numerical-simulations-of-supersonic-gas-atomization-of-liquid-42jjap-2014.jpg)