Embed Size (px)
Citation preview

TRICARE Plus: A Cost, Capacity and Enrollment Analysis
Lieutenant Junior Grade Michael L. Haney, MSC, USNR
Resident, U.S. Army-Baylor University Graduate Program in Healthcare Administration
Naval Hospital Pensacola, Florida

Report Documentation Page Form ApprovedOMB No. 0704-0188
Public reporting burden for the collection of information is estimated to average 1 hour per response, including the time for reviewing instructions, searching existing data sources, gathering andmaintaining the data needed, and completing and reviewing the collection of information. Send comments regarding this burden estimate or any other aspect of this collection of information,including suggestions for reducing this burden, to Washington Headquarters Services, Directorate for Information Operations and Reports, 1215 Jefferson Davis Highway, Suite 1204, ArlingtonVA 22202-4302. Respondents should be aware that notwithstanding any other provision of law, no person shall be subject to a penalty for failing to comply with a collection of information if itdoes not display a currently valid OMB control number.
1. REPORT DATE MAY 2002
2. REPORT TYPE Final
3. DATES COVERED Jul 2001 - Jul 2002
4. TITLE AND SUBTITLE TRICARE Plus: A Cost, Capacity and Enrollment Analysis
5a. CONTRACT NUMBER
5b. GRANT NUMBER
5c. PROGRAM ELEMENT NUMBER
6. AUTHOR(S) Lieutenant Junior Grade Michael L. Haney, USNR
5d. PROJECT NUMBER
5e. TASK NUMBER
5f. WORK UNIT NUMBER
7. PERFORMING ORGANIZATION NAME(S) AND ADDRESS(ES) Naval Hospital Pensacola 6000 West Highway 98 Pensacola, FL 32512-0003
8. PERFORMING ORGANIZATIONREPORT NUMBER
9. SPONSORING/MONITORING AGENCY NAME(S) AND ADDRESS(ES) US Army Medical Department Center and School Bldg 2841 MCCS-HRA(US Army-Baylor Program in HCA) 3151 Scott Road, Suite 1412 FortSam Houston, TX 78234-6135
10. SPONSOR/MONITOR’S ACRONYM(S)
11. SPONSOR/MONITOR’S REPORT NUMBER(S) 32-02
12. DISTRIBUTION/AVAILABILITY STATEMENT Approved for public release, distribution unlimited
13. SUPPLEMENTARY NOTES
14. ABSTRACT This study looks at the TRICARE Plus (TP) impact on the cost of primary care (PC) within the NavalHospital Pensacola (NHP) catchment area by determining current costs and NHPs TRICARE Primeenrollment capacity. Recommended TRICARE Plus options are provided based on NHPs and the MilitaryHealth System (MHS) costs and capacity. NHPs fiscal year 2001 (FY01) PC capacity was nearly 50 percent,which equated to over 45,000 unfilled visits. NHPs and the MHS PC costs in FY01 for the Pensacolacatchment area were $17,357,609 and $23,753,608 respectively. Increasing enrollment will reduce thesecosts. Over 28,000 eligible beneficiaries in the Pensacola catchment area are not enrolled in TRICAREPrime at NHP. Recapturing a portion of these beneficiaries could result in $2.25 million savings for theMHS and decrease the cost of a NHP PC visit to $44. Specific enrollment strategies will determine actualsavings. It is recommended that NHP recapture all Active Duty Dependents (ADD) currently enrolled inthe Civilian Provider Network (CPN) while actively enrolling TRICARE Plus eligibles. By FY06, ADDCivilian Prime Network recaptures should increase NHPs TRICARE Prime enrollment nearly 4500.Additionally, TRICARE Plus enrollment could increase by over 3000. Estimated annual cost savings forNHP and the MHS would be $90 thousand and $2.25 million respectively.
15. SUBJECT TERMS TRICARE; TRICARE Plus; capacity modeling; Military Treatment Facilities
16. SECURITY CLASSIFICATION OF: 17. LIMITATION OF ABSTRACT
UU
18. NUMBEROF PAGES
36
19a. NAME OFRESPONSIBLE PERSON
a. REPORT unclassified
b. ABSTRACT unclassified
c. THIS PAGE unclassified

ii
Acknowledgments
The following people are acknowledged for their guidance, assistance, and support in the
compilation of this study.
CDR Mark Bernier, Naval Hospital Pensacola Director for Administration (Preceptor)
MAJ Richard Thorp, Army-Baylor MHA Graduate Program (Faculty Advisor)
LCDR David Walton, Naval Hospital Pensacola Director of Health Plans and Management
Mr. Wayne Hickman, Naval Hospital Pensacola Director of Resource Management
CDR Kim Lyons, Health Plans and Management Directorate
Mr. John Perrault, Health Plans and Management Directorate
Ms. Connie Vallandingham, Health Plans and Management Directorate
Ms. Liz Meriwether, Health Plans and Management Directorate

iii
Abstract
This study looks at the TRICARE Plus (TP) impact on the cost of primary care (PC) within the
Naval Hospital Pensacola (NHP) catchment area by determining current costs and NHP’s
TRICARE Prime enrollment capacity. Recommended TRICARE Plus options are provided
based on NHP’s and the Military Health System (MHS) costs and capacity.
NHP’s fiscal year 2001 (FY01) PC capacity was nearly 50 percent, which equated to over 45,000
unfilled visits. NHP’s and the MHS PC costs in FY01 for the Pensacola catchment area were
$17,357,609 and $23,753,608 respectively. Increasing enrollment will reduce these costs.
Over 28,000 eligible beneficiaries in the Pensacola catchment area are not enrolled in TRICARE
Prime at NHP. Recapturing a portion of these beneficiaries could result in $2.25 million savings
for the MHS and decrease the cost of a NHP PC visit to $44. Specific enrollment strategies will
determine actual savings.
It is recommended that NHP recapture all Active Duty Dependents (ADD) currently enrolled in
the Civilian Provider Network (CPN) while actively enrolling TRICARE Plus eligibles. By
FY06, ADD Civilian Prime Network recaptures should increase NHP’s TRICARE Prime
enrollment nearly 4500. Additionally, TRICARE Plus enrollment could increase by over 3000.
Estimated annual cost savings for NHP and the MHS would be $90 thousand and $2.25 million
respectively.

iv
Table of Contents
Introduction.................................................................................................................................... 1
Conditions which prompted the study .................................................................................... 1
Statement of Problem ............................................................................................................... 4
Literature Review ..................................................................................................................... 4Cost of Care ............................................................................................................................ 4Determining Capacity ............................................................................................................. 7Increasing Enrollment............................................................................................................. 9
Purpose..................................................................................................................................... 10
Methods and Procedures ............................................................................................................. 11
Assumptions............................................................................................................................. 11
Clinic Capacity ........................................................................................................................ 12
Enrollment Capacity............................................................................................................... 13
Cost Analysis ........................................................................................................................... 14
The Results ................................................................................................................................... 15
Capacity ................................................................................................................................... 16
Cost of Delivering Care .......................................................................................................... 16
Current Visit Availability....................................................................................................... 18
Discussion .................................................................................................................................... 23
Conclusions and Recommendations ........................................................................................... 24
Appendices.................................................................................................................................... 27
References .................................................................................................................................... 30

v
List of Tables and Figures
Tables:
Table 1 – PCM Enrollment by Clinic............................................................................................ 8
Table 2 – Appointments Per Hour for Relative Value by Beneficiary Category, Adjusted ...... 13
Table 3 – Maximum Enrollment based on Visit Availability ..................................................... 14
Table 4 – Direct Costs Allocation per Cost Center ..................................................................... 15Table 5 – Available Visit Capacity............................................................................................... 16
Table 6 – Cost per Bed Day or Visit ............................................................................................ 17
Table 7 – Estimated Current TFL Costs ..................................................................................... 17
Table 8 – Available Visits............................................................................................................. 18
Table 9 – TRICARE Plus Capacity Scenario One ..................................................................... 19
Table 10 – TRICARE Plus Capacity Scenario Two ................................................................... 19
Table 11 – Total Cost based on projected enrollment maximizing total CPN Recapture......... 20
Table 12 – Total Cost based on projected enrollment, ADD CPN Recapture Only .................. 21
Table 13 – Total Cost based on increased MTF Visits ............................................................... 21
Figures:
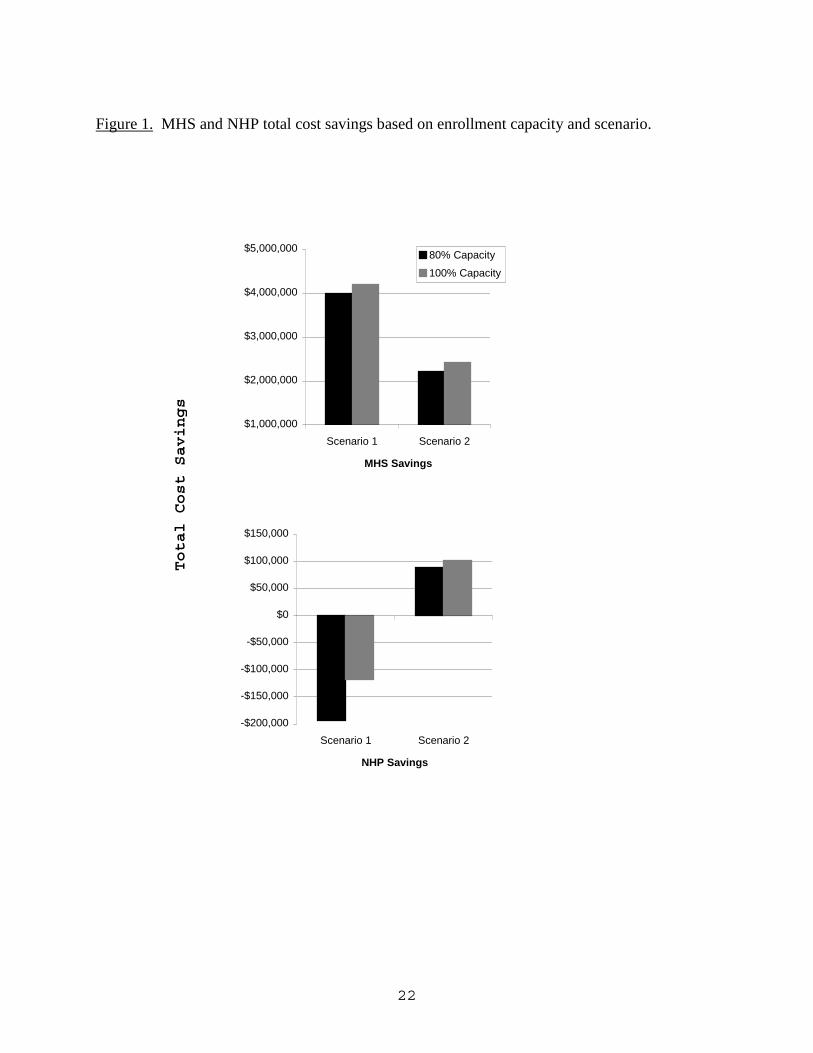
Figure 1. MHS and NHP total cost savings based on enrollment capacity and scenario. ...... 22
Figure A1. Estimated NHP Catchment Area Healthcare Costs with 100% CPN Recapture. .. 27
Figure B1. Estimated NHP Catchment Area Healthcare Costs with ADD CPN RecaptureOnly............................................................................................................................................... 28
1
TRICARE PLUS: A Cost, Capacity and Enrollment Analysis
Introduction
Conditions which prompted the study
TRICARE is the U.S. military’s health benefit plan that provides three options of care to
its eligible beneficiaries. The first option, TRICARE Prime, is the military’s equivalent to a
hybrid staff model Health Maintenance Organization (HMO). Qualified beneficiaries must
enroll in TRICARE Prime and are assigned a Primary Care Manager (PCM) at their local
Military Treatment Facility (MTF) or with a local civilian network provider. TRICARE Prime
provides the least out-of-pocket expense for the beneficiary. The other two options, TRICARE
Extra and TRICARE Standard (traditional CHAMPUS) are similar, except TRICARE Extra is
much like a Preferred Provider Organization (PPO), whereby the outpatient cost share for the
beneficiary is reduced when services are rendered by a network provider. Beneficiaries using
either of these options have more flexibility in receiving care but bear a higher cost in the form
of annual deductibles and cost sharing. Currently, the annual deductible is $150 per
benificiary/$300 per family ($50/$100 for junior enlisted E-5 and below). The outpatient cost
share is 20 and 25 percent after the annual deductible has been met for active duty dependents
and retirees under the age of 65 respectively. Services provided by a TRICARE Extra provider
receive a 5 percent discount off these cost shares. Out-of-pocket expenses are limited to $1000
per family for active duty and $3000 for a retiree family. Thereafter, TRICARE pays 100
percent of appropriate medical care (TRICARE, 2001).
Before October 2001, TRICARE provided healthcare coverage for active duty (AD)
personnel and their dependents (ADD), retired personnel under the age of 65 and their
dependents (NADD), and other qualifying individuals. Once a retired beneficiary reached the
2
age of 65, they were no longer eligible for TRICARE benefits with limited exceptions. They
could be seen space available in MTFs and their medications could be filled at MTF pharmacies
if the medication was part of the MTFs formulary. However, much “space available” care at
MTFs vanished during the 1990s due to downsizing. Many military retirees over the age of 65
and their eligible dependents (NADD>65) were enraged at losing their healthcare benefit at a
MTF. They felt that “free healthcare” was a right based on documented promises made by the
government when they entered military service. One of their arguments was that Medicare
differed from military health care in that it did not have a pharmacy benefit (Harris, 2000).
Through strong legislative lobbying by retiree organizations, TRICARE Senior Prime, a
Medicare subvention demonstration project, was piloted at six select locations during the late
1990s. It ended December 31, 2001. These demonstration projects allowed a specified number
of NADD>65 beneficiaries to enroll in the military’s HMO program and receive the same care
and access standards afforded TRICARE Prime patients. Each demonstration project was
geographically dispersed and only affected a small portion of the NADD>65 population. These
demonstration projects did not address the healthcare needs for the majority of military retirees
over the age of 65. Additional lobbying to Congress by military affiliated organizations was
performed on behalf of these beneficiaries. These efforts paid off in 2000 with the passing of the
National Defense Appropriations Act of 2001 (NDAA). The NDAA made sweeping changes in
military healthcare reform.
The NDAA introduced a few, yet significant, healthcare benefits for the NADD>65
population starting in fiscal year 2002 (FY02). Title VII Subtitle B of the DAA (Senior Health
Care) updated the pharmacy benefits to include access to retail pharmacies and the National Mail
Order Pharmacy (NMOP). This benefit began April 1, 2001. Sections 712 and 713 under the

3
aforementioned Subtitle established a new benefit that has been tabbed “TRICARE for Life”
(TFL). This benefit started in October 2001 and essentially made TRICARE a secondary payer
to MEDICARE for approved services. NADD>65 beneficiaries must be enrolled in both
MEDICARE A and B in order to be eligible for TFL. However, a portion of the NADD>65
population do not have Medicare Part B and/or would still prefer to receive their care at the local
MTF. Prior to October 2001, no TRICARE MTF care option existed for this population other
than space available care. However, a small portion of the NADD>65 population has been
empanelled in certain Family Practice teaching hospitals for Graduate Medical Education (GME)
residency programs. This population currently accounts for approximately 2000 empanels at
Naval Hospital Pensacola (NHP). Since no TRICARE option existed for the care of the
NADD>65 population at a MTF, a new option, TRICARE Plus (TP), was developed to fill this
void.
TRICARE Plus allows any beneficiary, including NADD>65, not currently enrolled in
TRICARE Prime or other Health Maintenance Organizations (HMOs) to enroll in TRICARE
Plus (Assistant Secretary of Defense, 2001). It potentially affects over 12,000 NADD>65
beneficiaries that reside in the Pensacola catchment area. TRICARE Plus works much like
TRICARE Prime in that enrollees are assigned a PCM with the local MTF and have similar
access standards for primary care. However, there are no guaranteed access standards for
specialty care. Specialty care is provided on a space available basis. The main advantages to
TRICARE Plus are that enrollees do not have an enrollment fee and NADD>65 beneficiaries are
not required to have Medicare Part B coverage to qualify. However, any NADD>65 beneficiary
with only Medicare Part A would subject themselves to 100 percent of the cost of any civilian
care because TRICARE only becomes secondary payer when the NADD>65 beneficiary has
4
Medicare Part B coverage. There are some disadvantages to TRICARE Plus. First, TRICARE
Plus enrollees must reside in the MTFs catchment area (50 miles) as the program is only utilized
by MTFs. Additionally, TRICARE Plus is MTF specific and not portable. Guaranteed access
standards are only specific to the enrolled facility. If a TRICARE Plus enrollee leaves an area
that has a participating MTF, there is no guarantee that another MTF will be able to enroll them
in TRICARE Plus or whether that MTF even participates in TRICARE Plus. Lastly, MTF
commanders can elect not to participate in TRICARE Plus (TMA, 2001). Currently, no
additional funding is afforded commanders that participate in TRICARE Plus. Therefore,
TRICARE Plus will have a significant impact on any MTF that elects to participate, both in cost
of care and capacity management (quality of care and access to care), in treating this new
beneficiary category. Validating capacity and cost of providing TRICARE Plus at an MTF is
crucial.
Statement of Problem
Capacity management and cost efficiency are concerns to any MTF commander, but a
unique twist presents itself with regards to TRICARE Plus particularly the NADD>65
population. Since the NADD>65 population is traditionally seen more often and their care more
costly than most current Military Treatment Facilities (MTFs) beneficiaries, the impact of
treating this population is not fully understood. This particular study will determine the capacity
at NHP and the most cost efficient measures to treat the NADD>65 population enrolled in
TRICARE Plus that reside in the Pensacola catchment area.
Literature Review
Cost of Care. Cost of care is derived in a number of ways. Costs can be associated
directly with the care received or spread across an organization through a step-down process.

5
There are three traditional methods used for cost accounting in medical services: historical
method, margin, and weighted-average method. Historical method looks at what an organization
has traditionally charged and what a payor has paid. Generally, margin looks at cost plus profit
margin. Lastly, weighted-average accounting looks at the total costs divided by the number of
procedures (i.e. visits) in order to arrive at an average cost per event (Zelman, McCue, and
Millikan, 1998). In the DOD healthcare system, the Military Expense Performance Reporting
System (MEPRS) is used for cost accounting purposes and most closely resembles a weighted-
average costing system. In 1999, the DoD average MTF cost per outpatient visit was $105
(TRICARE, 2001). Per visit cost for Civilian Prime Network, TRICARE Extra, and TRICARE
Standard was $116, $99, and $117 respectively in FY 2000 for services provided in the NHP
catchment area (Lead Agent Region 4, 2001). The current cost impact of TRICARE Plus is
unknown.
TRICARE Plus is a new aspect of the overall TRICARE Health Plan. Very little research
is available on its impact on MTFs. However, TRICARE Plus closely matches a three-year
demonstration project, MACDILL 65, which ended in September 2001. It provided medical care
for 2000 NADD>65 beneficiaries at the MacDill AFB MTF. While MTF size and capabilities
may cause variations among facilities, the MACDILL 65 project noted that per member per
month (PMPM) cost for treating the NADD>65 population was $80.90, over half which was
attributable to pharmaceuticals (BUMED, 2001). Center for Medicare (CMS) data for calendar
year 2000 (CY00) indicated $6937 was the average amount spent on healthcare for each
Medicare enrollee (CMS, 2001). This figure increases to nearly $700 PMPM for Medicare
enrollees in the state of Florida. The average amount of an outpatient visit for a Medicare
recipient is $157 (HHS, 2001). The low PMPM cost of the MACDILL 65 project compared to

6
the PMPM rate for Florida Medicare enrollees suggest cost efficiencies could be met through
NADD>65 care being received at a MTF.
NHP spent in excess of $11 million providing over age 65 care in FY01. The majority of
this care was spent on the Medicare population empanelled in the GME residency program.
However, some of this care was spent on the non-eligible, age 65 and older population (i.e.
civilian humanitarian care). The amount spent PMPM at NHP for the Medicare population was
$423. This amount does not include ancillary services. Comparatively, this amount is 26
percent less than the average amount spent on each Medicare eligible recipient in the state of
Florida.
Health Metrix Research Inc., a leading research organization in the cost of Medicare
HMOs, reports plans in three phases based on health status. These three phases are: good, fair
and poor. Health status is determined by the amount of usage by the enrollee. NHP’s
NADD>65 empanelment average nearly 10 provider visits and 1 ER visit annually which closely
matches the utilization rates of Florida’s Medicare enrollees with fair health status. A participant
with fair health status on average includes 12 provider visits, 1 ER visit, 1 inpatient stay of 3
days, and 24 prescriptions per year. HMO participants with fair health status average over $1800
per year in out-of pocket expenses, which does not include their Medicare part B premiums
(Health Metrix Inc, 2002). Overall, Florida’s Medicare HMO enrollees average annual out-of-
pocket expenses range from $1000-$3500.
Under TFL, eligible Medicare enrollees’ out-of-pocket expenses are absorbed by the
MHS for approved services. Therefore if the MHS can treat the NADD>65 population through
unused capacity for less than the out-of-pocket expenses that would normally be absorbed by the
7
MHS, it makes financial sense to recapture this care in local MTFs. Capacity is a driving force
in how much NADD>65 care can be accomplished within the MTFs.
Determining Capacity. Historically, enrollment has been set using a ratio of patients to
provider. There are many sources available to estimate an average empanelment per provider
based on the provider’s specialty. Since TRICARE Plus operates much like a staff model HMO,
enrollment should mirror that of a civilian staff HMO with expected variations for military
primary care managers (PCM). Generically, capacity is defined as the number of available
providers multiplied by the maximum number of enrollees per primary care manager. For
example, a MTF with 20 primary care managers with a maximum enrollment of 1200 patients
per provider would have a capacity of 24,000 enrollees. Available capacity, represented as a
percentage, is derived by subtracting current enrollment from total available enrollment and
dividing the results by total available enrollment. Using the above example of 24,000 enrollees,
a MTF with 12,000 actual enrollees would have an available capacity of 50 percent (24000-
12000 = 12000, 12000/24000 = .50). A recent study sponsored by Aventis Pharmaceuticals
found an average of 205 HMO members per PCM when all HMOs were taken into account.
This figure is lower than actual PCM enrollment because many PCMs spread their enrollment
over multiple HMO plans and other payors. However, enrollment figures more than tripled to
753 members per PCM when only staff model HMOs were considered (Adventis, 2000). In
staff-model HMOs, PCM patient enrollment is more closely associated with member per PCM
size because enrollment is usually limited to the specific plan enrollees. This is especially true in
a closed staff-model HMO like TRICARE Prime. Another large-scale report, done in 1997,
found an average of 779 members per PCM in staff model HMOs. The enrollment population in
staff model Medicare HMOs was reduced to 661 enrollees per PCM (Kongstvedt, 2001). This

8
latter figure is better for comparison with TRICARE Plus, assuming that the majority of
enrollees will be NADD>65. Determining if any of these figures are representative of MTF
PCM enrollment is difficult to gauge, but it does give a measure to use for comparison.
MTFs generally have a smaller enrolled population than the private sector because of
unique military requirements. A few examples include; increased military leadership duties,
physical readiness requirements, annual leave, and military medicine specific education. In
some military capacity models, military physicians have been considered .75 of a standard full-
time equivalent (FTE) for enrollment purposes. Utilizing this assessment, a contracted civilian
provider in a MTF may have an enrollment of 1000 patients and a military provider would have
an enrollment of 750 (.75 x 1000). Reviews of enrollments throughout MTFs show great
variation. NHP enrollment figures (October 2001) per primary care manager (PCM) vary from
0-1046 patients per provider (Table 1) and depend on the role and availability of the PCM.
Enrollment figures presented are a snapshot and PCMs with an enrollment of zero were new
arrivals to the Pensacola area at the beginning of FY02.
Table 1
PCM Enrollment by Clinic
Clinic FP IM PEDSNumber of Providers 49 9 6Total Enrollment 10,977 4,800 3,891Low Enrollment 0 0 419High Enrollment 379 1046 746Avg Enrollment 201 435 648Standard Deviation 90.957 361.545 135.559Source: Director Healthcare Management and Plans, NHP (October 2001)
Accurate capacity modeling results in better access for enrolled patients and allows both
the local MTF and the overall MHS to function more cost efficiently. At MTFs lacking accurate

9
validation procedures, including number of enrollees and type of patients, capacity can easily get
out of control either through over-enrollment or under-enrollment.
Over-enrollment traditionally leads to patient dissatisfaction. Enrollees would have
difficulty in acquiring timely appointments within the MTF and/or with their PCM as a result of
over-enrollment. Thus, care would have to be received “outside the network” resulting in higher
costs for the patient and the MHS. If access standards can’t be met, MTFs may be forced to
disenroll patients at the MTF. In this scenario, the TRICARE Plus enrolled population would be
disenrolled first. The failure to meet access standards, the higher costs associated with failure of
delivery, and the possibility of disenrollment would ultimately lead to increased beneficiary
dissatisfaction, a quality indicator.
On the other hand, under-enrollment has a greater cost impact on the overall Military
Healthcare System (MHS). Under-enrollment leads to an increase in the number of available
visits going unfilled. Any visit going unfilled may have a financial impact on the MHS as
unfilled visits can result in a higher bid price adjustment process with the managed care support
contractor (MCSC). The bid price adjustment process requires MTFs to have a minimum
number of visits (Philpott, 2001). Therefore, if an MTF is not being fully utilized and falls short
of the required number of visits, it increases the workload provided “in the network” resulting in
higher overall costs to the MHS through an increase in TRICARE contractor costs. Therefore,
under enrollment has a direct impact on higher costs per enrollee. Increasing enrollment in an
under-enrolled environment will help reduce the bid price adjustment and result in overall MHS
savings.
Increasing Enrollment. NHP plans to increase MTF enrollment of TRICARE Prime by
5000 beneficiaries over the next 2 years through new marketing efforts and realignment of
10
enrollment policies. It is estimated sixty percent of that increase will come from newly reporting
personnel enrolling in TRICARE Prime at NHP. The other forty percent will be recaptured
through marketing efforts of those currently in the Civilian Prime Network or those choosing the
TRICARE Standard/Extra option.
There are over 30,000 beneficiaries, including Medicare eligibles, in the NHP catchment
area that are not enrolled in TRICARE Prime at NHP. Of those, 11,000 are enrolled in the
Civilian Prime Network and 10,000 are potential Medicare eligible TRICARE Plus enrollees
(Naval Hospital Pensacola, 2002). While recapturing TRICARE Standard patients into
TRICARE Prime is the most cost-effective approach, the assumption is that most of those
beneficiaries who have elected TRICARE Standard over TRICARE Prime will continue to do so.
Recapturing Medicare eligible beneficiaries through unused MTF capacity is cost efficient for
the MHS and NHP up to the point of full capacity since TRICARE only pays 20 percent of an
outpatient visit for an NADD>65 beneficiary. In other words, the marginal cost of an outpatient
visit at the MTF is less than the average Medicare co-pay of treating any NADD>65
beneficiaries up to the point of full capacity. Additionally, future funding for NADD>65 care to
MTFs will be based on level of effort. This level of effort will be base lined to FY2000
(TRICARE Management Activity, 2001). Any MTF that recaptures more NADD>65 care than
they received credit for in FY2000 may receive additional funding for providing that care.
Reimbursement determinations are being discussed at TMA and service specific agencies.
Purpose
The purpose of this study is to best determine the capacity (patient/provider) for enrolling
beneficiaries into TRICARE Plus at NHP and thus assist in controlling the cost of care within the
MTF and the MHS. The hypothesis of this study is that capacity and cost are functionally related

11
within a local MTF in regards to TRICARE Plus. Fully utilizing unused capacity in treating
TRICARE Plus enrollees should reduce the overall cost of the MHS. A secondary hypothesis is
that utilizing MTFs for cost savings is only achievable up to the point of current MTF capacity in
regards to the NADD>65 population. After capacity is reached within a MTF, cost of providing
care to the NADD>65 population is prohibitively more expensive to the MHS when the care is
performed within the MTF because the MHS, as secondary payor to Medicare, is only
responsible for the deductibles and cost shares of civilian care. In both instances, the null
hypothesis is that no significant cost differences exist in regards to where the care is received
regardless of available capacity.
Methods and Procedures
Assumptions
To answer the basic questions of capacity and costs of TRICARE Plus at NHP, a few
assumptions must be made. First, while TRICARE Plus is open to all TRICARE beneficiaries
not currently enrolled in TRICARE Prime or another HMO, it is expected that the majority
desiring to enroll in TRICARE Plus will be age 65 and older. Other beneficiary categories
already have the ability to enroll in TRICARE Prime and for whatever reason have elected not to
do so. Additionally, those currently enrolled in TRICARE Prime, including NADD, are
discouraged from changing enrollment from TRICARE Prime to TRICARE Plus because the
guarantee to all levels of care and portability of the healthcare plan doesn’t exist in TRICARE
Plus. TRICARE Plus is a local MTF specific option, and not all MTFs are required to
participate. Therefore, this study will focus primarily on NADD>65 beneficiaries and their
impact on TRICARE Plus in relation to capacity management and cost efficiencies. Secondly,
the study will not include the NADD>65 population already empanelled in Family Practice at
12
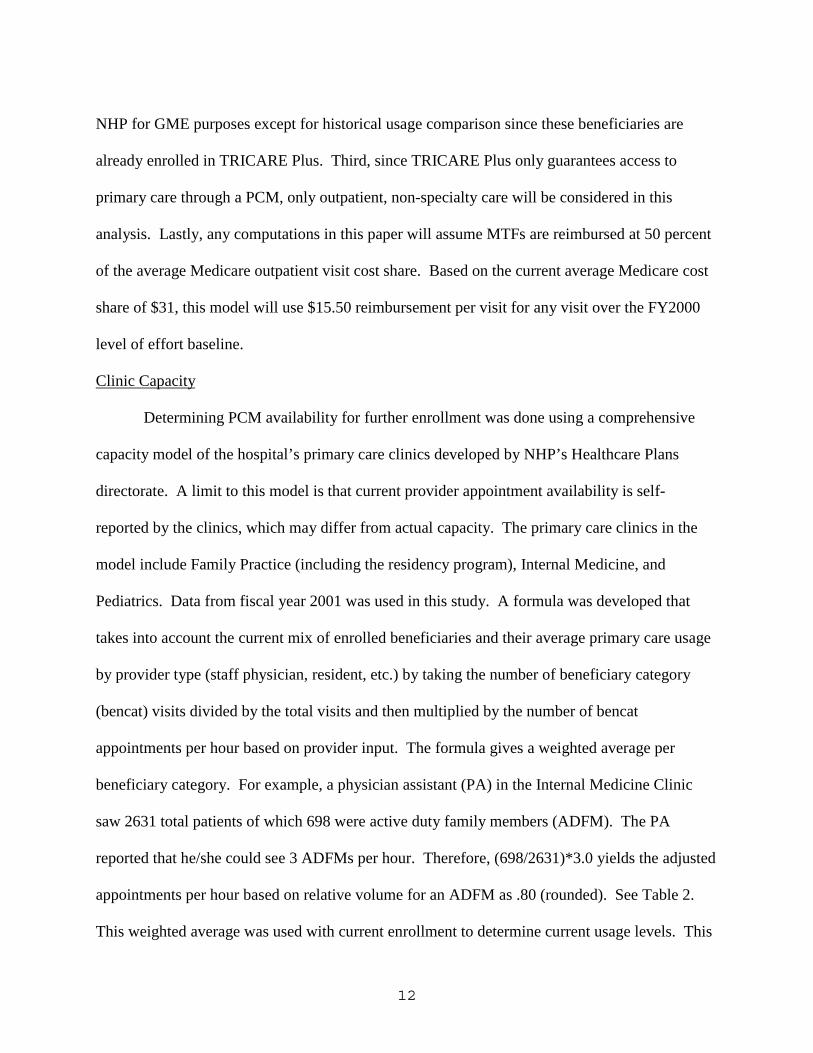
NHP for GME purposes except for historical usage comparison since these beneficiaries are
already enrolled in TRICARE Plus. Third, since TRICARE Plus only guarantees access to
primary care through a PCM, only outpatient, non-specialty care will be considered in this
analysis. Lastly, any computations in this paper will assume MTFs are reimbursed at 50 percent
of the average Medicare outpatient visit cost share. Based on the current average Medicare cost
share of $31, this model will use $15.50 reimbursement per visit for any visit over the FY2000
level of effort baseline.
Clinic Capacity
Determining PCM availability for further enrollment was done using a comprehensive
capacity model of the hospital’s primary care clinics developed by NHP’s Healthcare Plans
directorate. A limit to this model is that current provider appointment availability is self-
reported by the clinics, which may differ from actual capacity. The primary care clinics in the
model include Family Practice (including the residency program), Internal Medicine, and
Pediatrics. Data from fiscal year 2001 was used in this study. A formula was developed that
takes into account the current mix of enrolled beneficiaries and their average primary care usage
by provider type (staff physician, resident, etc.) by taking the number of beneficiary category
(bencat) visits divided by the total visits and then multiplied by the number of bencat
appointments per hour based on provider input. The formula gives a weighted average per
beneficiary category. For example, a physician assistant (PA) in the Internal Medicine Clinic
saw 2631 total patients of which 698 were active duty family members (ADFM). The PA
reported that he/she could see 3 ADFMs per hour. Therefore, (698/2631)*3.0 yields the adjusted
appointments per hour based on relative volume for an ADFM as .80 (rounded). See Table 2.
This weighted average was used with current enrollment to determine current usage levels. This

13
model gives a very accurate assessment of current usage levels (Naval Hospital Pensacola,
2001). Model data can be adjusted on a periodic basis to demonstrate any change in enrollment
mix.
Table 2
Appointments Per Hour for Relative Value by Beneficiary Category, Adjusted
Appts Per Hour Adjusted for Relative Volume by BencatFamily Practice AD ADFM R & RFM <65 65 + Total AdjustedStaff FP's, FNP's & PA's 0.55 1.21 0.93 0.30 2.99Residents (3rd Yr) 0.24 1.46 0.91 0.30 2.91Residents (2nd Yr) 0.24 1.46 0.73 0.30 2.73Residents (1st Yr) 0.12 0.97 0.52 0.23 1.83Internal MedicineInternists 0.32 1.13 0.55 2.00PA 0.80 1.51 0.69 3.00Resource Sharing 1.34 1.65 2.99PediatricsPediatricians 2.62 0.38 3.00PNP 2.09 0.31 2.40
The adjusted appointments per hour multiplied by the number of hours in clinic (hours
available per week multiplied by number of available week per year) yield maximum clinic
appointment output. This output divided by average number of visits per enrollee will determine
maximum visit capacity.
Enrollment Capacity
Research indicates that potential enrollees’ outpatient visit patterns differ from current
enrollees. Based on FY01 visit patterns, the average number of visits per enrollee for family
practice, pediatrics, and internal medicine are 3.40, 3.34, and 2.95 respectively. Comparatively,
Civilian Prime Network enrollees’ average 3.2 visits per year (TRICARE Region 4, 2001) and
Florida Medicare recipients average 6.8 visits per year (Adventis, 2000). The current usage
14
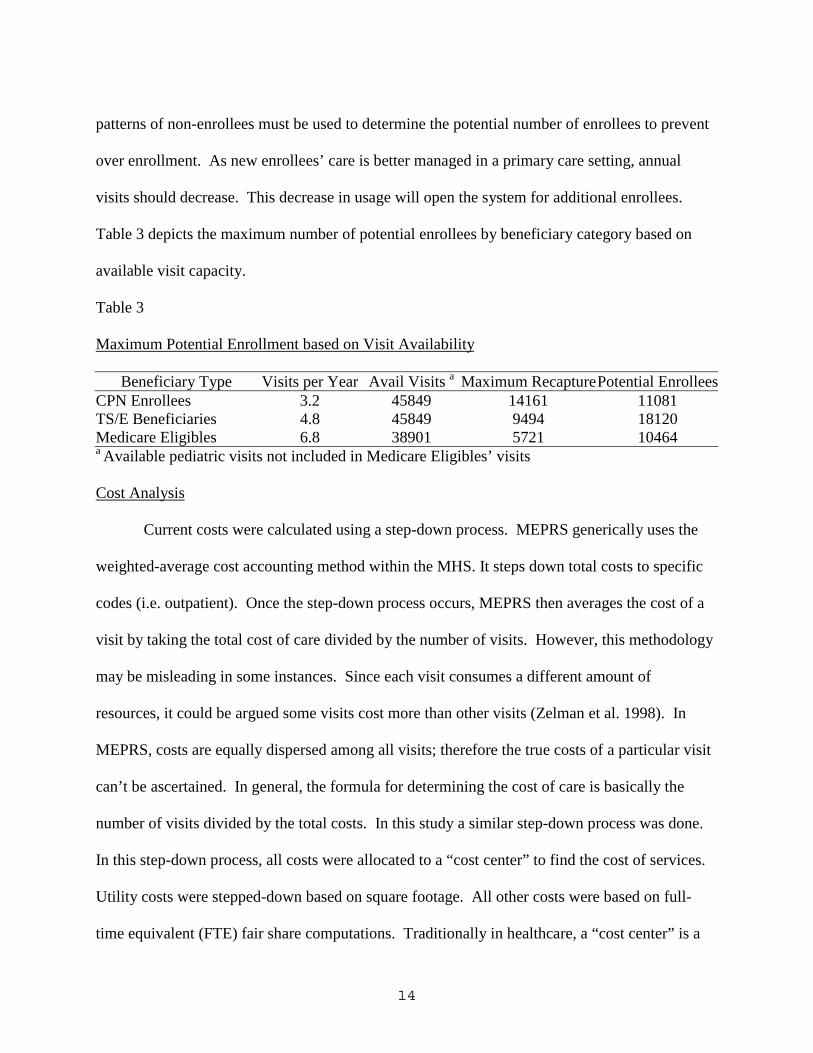
patterns of non-enrollees must be used to determine the potential number of enrollees to prevent
over enrollment. As new enrollees’ care is better managed in a primary care setting, annual
visits should decrease. This decrease in usage will open the system for additional enrollees.
Table 3 depicts the maximum number of potential enrollees by beneficiary category based on
available visit capacity.
Table 3
Maximum Potential Enrollment based on Visit Availability
Beneficiary Type Visits per Year Avail Visits a Maximum RecapturePotential EnrolleesCPN Enrollees 3.2 45849 14161 11081TS/E Beneficiaries 4.8 45849 9494 18120Medicare Eligibles 6.8 38901 5721 10464a Available pediatric visits not included in Medicare Eligibles’ visits
Cost Analysis
Current costs were calculated using a step-down process. MEPRS generically uses the
weighted-average cost accounting method within the MHS. It steps down total costs to specific
codes (i.e. outpatient). Once the step-down process occurs, MEPRS then averages the cost of a
visit by taking the total cost of care divided by the number of visits. However, this methodology
may be misleading in some instances. Since each visit consumes a different amount of
resources, it could be argued some visits cost more than other visits (Zelman et al. 1998). In
MEPRS, costs are equally dispersed among all visits; therefore the true costs of a particular visit
can’t be ascertained. In general, the formula for determining the cost of care is basically the
number of visits divided by the total costs. In this study a similar step-down process was done.
In this step-down process, all costs were allocated to a “cost center” to find the cost of services.
Utility costs were stepped-down based on square footage. All other costs were based on full-
time equivalent (FTE) fair share computations. Traditionally in healthcare, a “cost center” is a

15
patient interaction, revenue generating work center (i.e. clinic). Three cost centers were used in
this study; outpatient services, inpatient services, and specialty services. Costs were allocated to
the primary care clinics (FP, IM, and PEDS) as illustrated in Table 4. Ancillary services were
not included because they are a separate cost under most healthcare plans. Additionally, the
major ancillary service, pharmacy, should not be greatly impacted by this study because most
beneficiaries that would considered joining TRICARE Plus most likely already have their
prescriptions filled by NHP. Therefore, all ancillary related costs were removed prior to any
calculations.
Table 4
Direct Costs Allocation per Cost Center
Workcenter Direct Costs Utilities General Admin Total Direct CostsUtilities a $4,899,495 ($4,899,495)Administration b $16,158,242 $1,758,611 ($17,916,853)Inpatient Services $11,108,397 $1,335,721 $4,411,200 $16,855,317Primary Care Clinics $11,344,571 $1,164,070 $3,845,662 $16,354,303Specialty Clinics $10,156,742 $1,567,736 $5,170,637 $16,895,115a Utilities include repair and custodial servicesb Administration includes all administrative services notdirectly associated with particular service (i.e. Command Suite)Note: Computations do not equal 100% because some operationsare not allocated to clinical services (i.e. POMI)Financial Source: Director Resource Management, Naval Hospital PensacolaSquare Foot Allocation Source: Facilities Department, Naval Hospital Pensacola
The Results
The results of this study are divided into four categories. First, the capacity of the MTFs
outpatient clinics is presented. Second, NHP’s current total cost of services is provided. Third,
the estimated number of visits that can be recaptured is provided. Lastly, the effects of increased
enrollment on NHP’s total costs are presented. These four sections indicate that capacity and
16
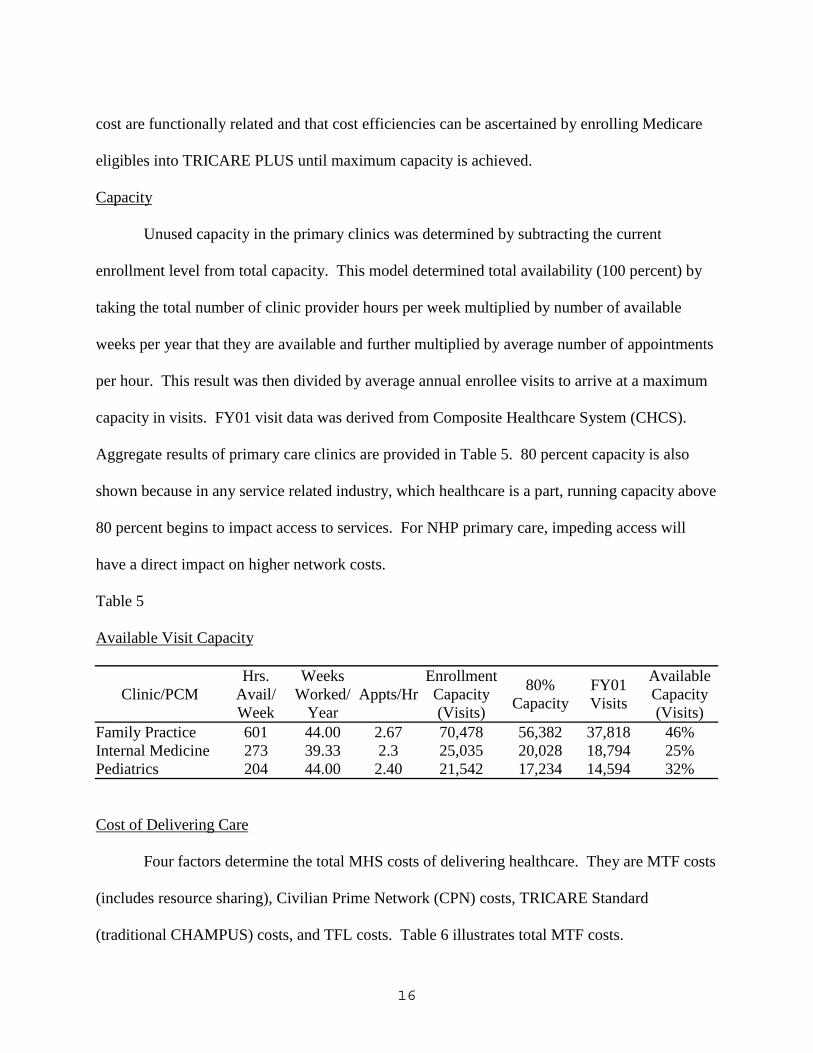
cost are functionally related and that cost efficiencies can be ascertained by enrolling Medicare
eligibles into TRICARE PLUS until maximum capacity is achieved.
Capacity
Unused capacity in the primary clinics was determined by subtracting the current
enrollment level from total capacity. This model determined total availability (100 percent) by
taking the total number of clinic provider hours per week multiplied by number of available
weeks per year that they are available and further multiplied by average number of appointments
per hour. This result was then divided by average annual enrollee visits to arrive at a maximum
capacity in visits. FY01 visit data was derived from Composite Healthcare System (CHCS).
Aggregate results of primary care clinics are provided in Table 5. 80 percent capacity is also
shown because in any service related industry, which healthcare is a part, running capacity above
80 percent begins to impact access to services. For NHP primary care, impeding access will
have a direct impact on higher network costs.
Table 5
Available Visit Capacity
Clinic/PCMHrs.
Avail/Week
WeeksWorked/
YearAppts/Hr
EnrollmentCapacity(Visits)
80%Capacity
FY01Visits
AvailableCapacity(Visits)
Family Practice 601 44.00 2.67 70,478 56,382 37,818 46%Internal Medicine 273 39.33 2.3 25,035 20,028 18,794 25%Pediatrics 204 44.00 2.40 21,542 17,234 14,594 32%
Cost of Delivering Care
Four factors determine the total MHS costs of delivering healthcare. They are MTF costs
(includes resource sharing), Civilian Prime Network (CPN) costs, TRICARE Standard
(traditional CHAMPUS) costs, and TFL costs. Table 6 illustrates total MTF costs.

17
Table 6
Cost per Bed Day or Visit
Workcenter Total Direct Costs Visits/Bed Days Costs per Bed Day or VisitInpatient Services $16,855,317 7977Primary Care Clinics $16,354,303 180224Specialty Clinics $16,895,115 56140
$2,112.99$90.74$300.95
Visit/Bed Day Data Source: Director Healthcare Management and Plans, Naval Hospital Pensacola
The primary care visit costs outlined above in Table 6 do not include any ancillary
services (i.e. pharmaceuticals). Further drill down of the data reflects of the $90.74 spent in
FY01 on a primary care visit, only slightly more than $6 dollars is associated with variable costs
(VC) of the visit. Similar results were noted in inpatient and specialty services too. The high
fixed cost (FC) is primarily due to the low number of visits being spread across a high amount of
labor costs.
Civilian Prime Network costs in support of over 11,000 beneficiaries totaled $4,162,394
in FY00. Other NHP area TRICARE costs (Extra and Standard) totaled $15,035,929 (Region 4
Lead Agent, 2001). Figures for TFL are not available. However, Table 7 is an estimated
illustration of TFL costs. The cost of eligibles enrolled in the GME program is not included in
the TFL cost calculation because these beneficiaries are already captured in total MTF costs.
The estimated TFL cost per visit is 20 percent of the average Medicare outpatient visit.
Table 7
Estimated Current TFL Costs
NHP AreaMedicare Eligibles
Estimated TFLOutpatient Visits TFL Cost per visit Total Estimated TFL Costs
10464 71155 $31.40 $2,234,273

18
Current Visit Availability
Table 8 depicts the approximate number of available visits that went unfilled during
FY01 based on capacity. With current staffing, NHP can recapture enough additional enrollees
that will satisfy 37,000 to 46,000 annual visits.
Table 8
Available Visits
Clinic/PCMTotalVisitsAvail
80% AvailVisits
FY01Visits
Avail VisitsFilled Pct
Current AvailVisits Unfilled
80% AvailVisits Unfilled
Family Practice 70478 56382 37818 54% 32660 26128Internal Medicine 25035 20028 18794 75% 6241 4993
Pediatrics 21542 17234 14594 68% 6948 5559NHP Total 117,055 93,644 71,206 65% 45,849 36,679
Capacity exists at NHP’s three primary care clinics. There are two primary ways to gain
efficiencies in capacity: reduce staff or increase enrollment. Since NHP catchment area has a
demonstrated need for services, increasing enrollment seems to be the most logical, cost
effective measure. Increasing enrollment will come from three areas; beneficiaries enrolled in
the Civilian Prime Network (both ADD and NADD<65), TRICARE Standard/Extra
beneficiaries, and the NADD>65 population through enrollment in the TRICARE Plus program.
It should be pointed out again in this study that it is assumed most beneficiaries electing
TRICARE Standard/Extra, for whatever reason, will continue to do so. They are not considered
in any recapturing calculations. The next two tables depict recapturing capacity. Table 9
calculates recapturing all Civilian Prime Network beneficiaries into NHP TRICARE Prime
before enrolling TRICARE Plus. Table 10 calculates recapturing ADD Civilian Prime Network
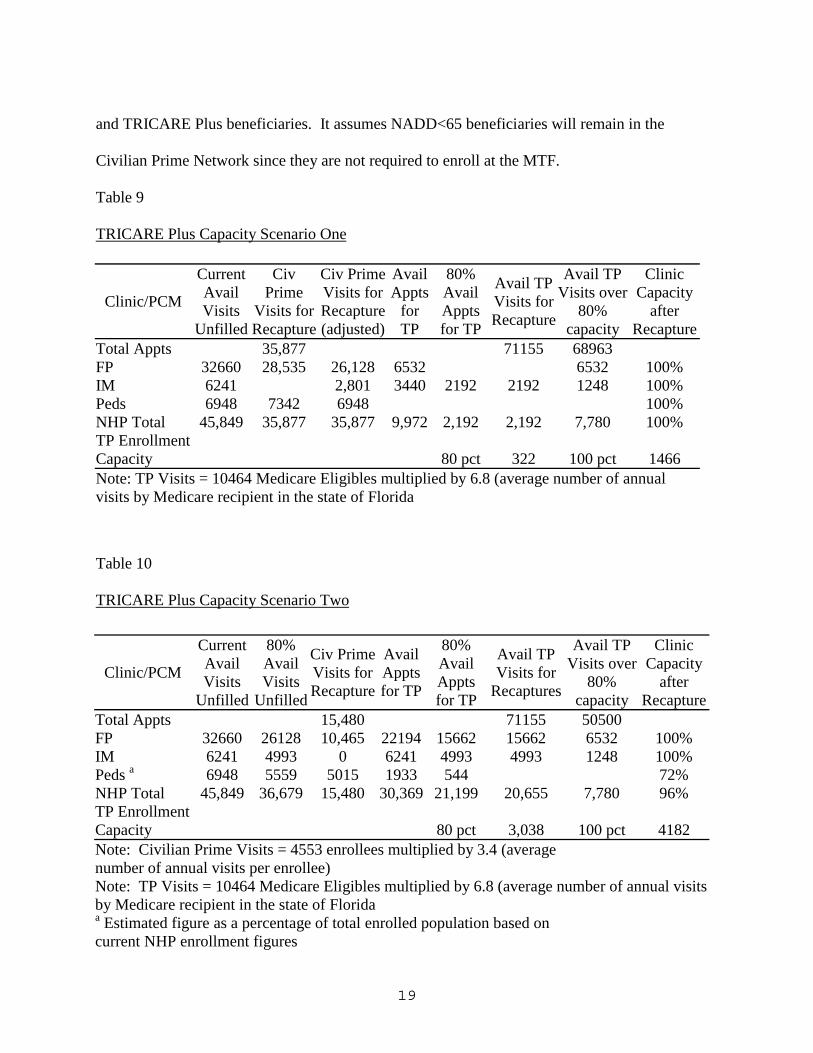
19
and TRICARE Plus beneficiaries. It assumes NADD<65 beneficiaries will remain in the
Civilian Prime Network since they are not required to enroll at the MTF.
Table 9
TRICARE Plus Capacity Scenario One
Table 10
TRICARE Plus Capacity Scenario Two
Clinic/PCM
CurrentAvailVisits
Unfilled
CivPrime
Visits forRecapture
Civ PrimeVisits forRecapture(adjusted)
AvailAppts
forTP
80%AvailApptsfor TP
Avail TPVisits forRecapture
Avail TPVisits over
80%capacity
ClinicCapacity
afterRecapture
Total Appts 35,877 71155 68963FP 32660 28,535 26,128 6532 6532 100%IM 6241 2,801 3440 2192 2192 1248 100%Peds 6948 7342 6948 100%NHP Total 45,849 35,877 35,877 9,972 2,192 2,192 7,780 100%TP EnrollmentCapacity 80 pct 322 100 pct 1466Note: TP Visits = 10464 Medicare Eligibles multiplied by 6.8 (average number of annualvisits by Medicare recipient in the state of Florida
Clinic/PCM
CurrentAvailVisits
Unfilled
80%AvailVisits
Unfilled
Civ PrimeVisits forRecapture
AvailApptsfor TP
80%AvailApptsfor TP
Avail TPVisits for
Recaptures
Avail TPVisits over
80%capacity
ClinicCapacity
afterRecapture
Total Appts 15,480 71155 50500FP 32660 26128 10,465 22194 15662 15662 6532 100%IM 6241 4993 0 6241 4993 4993 1248 100%Peds a 6948 5559 5015 1933 544 72%NHP Total 45,849 36,679 15,480 30,369 21,199 20,655 7,780 96%TP EnrollmentCapacity 80 pct 3,038 100 pct 4182Note: Civilian Prime Visits = 4553 enrollees multiplied by 3.4 (averagenumber of annual visits per enrollee)Note: TP Visits = 10464 Medicare Eligibles multiplied by 6.8 (average number of annual visitsby Medicare recipient in the state of Floridaa Estimated figure as a percentage of total enrolled population based oncurrent NHP enrollment figures

20
The ability for NHP to open enrollment in TRICARE Plus for NADD>65 exist. Tables 9
and 10 suggest TRICARE Plus additional enrollment could range between 300 and 4200
depending on NHP’s strategy on recapturing enrollees. Table 11 and 12 are cost benefit analyses
of increasing enrollment. Graphical presentation of tables 11 and 12 showing estimated MTF
Costs, Network Costs, and TFL costs are presented in Appendix A and B. Annual cost
avoidance for the MHS would be over $2.25 million. Cost savings, based on reimbursement for
recapturing TRICARE PLUS visits, for NHP could be as high as $100 thousand annually.
Figure 1 illustrates total cost savings of increasing enrollment based on scenarios one and two.
In Table 12, there is a surplus of pediatric visits after recapturing all ADD Civilian Prime
Network beneficiaries because it is assumed that TRICARE Plus will enroll mainly NADD>65.
Therefore, no available pediatric visits were associated with TRICARE Plus enrollees.
Table 11
Total Cost based on projected enrollment maximizing total CPN Recapture
Primary CareVisits
IncreasedMTF Visits
CPN Visitsa TP Visits b TFL Visits b
TotalVisits
Total CareCosts
Current (FY01) N/A 35877 0 71155 107032 $23,753,60810000 25,877 0 71155 107032 $22,653,60815000 20,877 0 71155 107032 $22,103,60820000 15,877 0 71155 107032 $21,553,60825000 10,877 0 71155 107032 $21,003,60830000 5,877 0 71155 107032 $20,453,60835000 877 0 71155 107032 $19,903,608
80% Capacity 38069 0 2,192 68963 107032 $19,751,46140000 0 4,123 67032 107032 $19,702,41445000 0 9,123 62032 107032 $19,575,414
100% Capacity 45849 0 9,972 61183 107032 $19,553,84950000 0 14,123 57032 107032 $19,823,414107032 0 71,155 0 107032 $22,499,801
a Non-referral visits onlyb Does not include the NADD>65 beneficiaries currently enrolled

21
Table 12
Total Cost based on projected enrollment, ADD CPN Recapture Only
Primary CareVisits
IncreasedMTF Visits CPN Visits a TP Visits b TFL Visits b
TotalVisits Total Care Costs
Current (FY01) N/A 35877 0 71155 107032 $23,753,60810000 25,877 0 71155 107032 $22,653,60815000 20,877 0 71155 107032 $22,103,60820000 20,397 4,520 66635 107032 $21,936,00025000 20,397 9,520 61635 107032 $21,809,00130000 20,397 14,520 56635 107032 $21,682,00035000 20,397 19,520 51635 107032 $21,555,000
80% Capacity 36135 20,397 20,655 50500 107032 $21,526,17140000 20,397 24,520 46635 107032 $21,428,000
100% Capacity 43915 20,397 28,435 42720 107032 $21,328,55945000 20,397 29,520 41635 107032 $21,376,00050000 20,397 34,520 36635 107032 $21,624,00086635 20,397 71,155 0 107032 $23,443,471
a Non-referral visits only b Does not include the NADD >65 beneficiaries currently enrolled
22
Figure 1. MHS and NHP total cost savings based on enrollment capacity and scenario.
$1,000,000
$2,000,000
$3,000,000
$4,000,000
$5,000,000
Scenario 1 Scenario 2
MHS Savings
80% Capacity100% Capacity
-$200,000
-$150,000
-$100,000
-$50,000
$0
$50,000
$100,000
$150,000
Scenario 1 Scenario 2
NHP Savings
Total Cost Savings

23
Discussion
As demonstrated in the results, secondary questions had to be answered prior to
determining whether capacity for TRICARE Plus existed at NHP and at what cost impact
TRICARE Plus would have. These questions included; finding out total capacity, where
capacity existed, and the total current cost.
Total capacity was achieved through self-reported provider availability input compared to
actual FY01 primary care visits. This calculation verified that unused capacity existed. Next,
the number of visits available in each primary clinic was calculated. Calculating capacity based
on visits instead of percentage of enrollment is vital because potential enrollees have a
significant different usage pattern than those currently enrolled. For example, NADD>65
currently enrolled to the Family Practice clinic have an average of 4.11 visits per year whereas
the Medicare recipients in Florida average 6.8 visits per year. Knowing the capacity levels in
each clinic is a key ingredient in the strategy to increase enrollment. Another key ingredient is
the cost of delivering healthcare.
The average, current cost of a NHP primary care visit is slightly less than $91. The
average government cost of a TRICARE approved visit to a civilian provider is $111. The
estimated cost share for a TFL visit is $31.40. Table 13 depicts projected costs based on
increasing visits at the NHP. Network costs are eliminated after 35,877 visits are recaptured.
TFL costs are eliminated after 107,032 visits are recaptured.

24
Table 13
Total Cost based on projected enrollment
Conclusions and Recommendations
Capacity management can become more efficient by increasing enrollment at NHP and
can result in cost savings for NHP and the MHS. Maximizing capacity would drive the average
cost of a primary care visit down to $43.50 at NHP. While current cost per visit is 22 percent
less than the average cost of a civilian provider visit, maximizing capacity results in a 155
percent savings. However, current unused capacity (45,849 visits) limits the number of potential
enrollees that can be recaptured. Three sources exist for increased enrollment: ADD and
NADD<65 Prime enrollees in the Civilian Prime Network, TRICARE Standard/Extra
beneficiaries, and the Medicare eligible population through enrollment in TRICARE Plus.
The most cost effective approach for the MHS is to recapture all Civilian Prime Network
enrollees. However, current NHP policy does not require any network enrollee to abandon their
current patient/provider relationship in favor of enrolling in NHP TRICARE Prime. New Tricare
Prime enrollees have been required to enroll at NHP since February 2002. In a three to four-year
period, this should attrite most ADD beneficiaries from the Civilian Prime Network. Under
PC VisitsIncreasedMTF Visits
MTF FixedCosts
MTF VariableCosts MTF Total Costs
NetworkCosts TFL Costs
Total CareCosts
FY01 N/A $16,224,000 $1,133,609 $17,357,609.00 $4,161,732 $2,234,273 $23,753,614 20000 $16,224,000 $1,253,609 $17,477,609.00 $1,841,732 $2,234,267 $21,553,608 30000 $16,224,000 $1,313,609 $17,537,609.00 $681,732 $2,234,267 $20,453,608 40000 $16,224,000 $1,373,609 $17,597,609.00 $0 $2,104,805 $19,702,414100% Cap 45849 $16,224,000 $1,408,703 $17,632,703.00 $0 $1,921,146 $19,553,849 55849 $16,599,000 $1,468,703 $18,067,703.00 $0 $1,607,146 $19,674,849 65849 $16,974,000 $1,528,703 $18,502,703.00 $0 $1,293,146 $19,795,849 75849 $17,349,000 $1,588,703 $18,937,703.00 $0 $979,146 $19,916,849 85849 $17,724,000 $1,648,703 $19,372,703.00 $0 $665,146 $20,037,849 95849 $18,099,000 $1,708,703 $19,807,703.00 $0 $351,146 $20,158,849 107032 $18,324,000 $1,775,801 $20,099,801.00 $0 $0 $20,099,801
25
current policy, NADD<65 enrolled in the Civilian Prime Network will continue to do so until
they relocate outside NHP catchment area, disenroll from TRICARE Prime, or elect to abandon
their current provider relationship in favor of NHP’s TRICARE Prime option. Although it is
possible to recapture over 11,000 beneficiaries from the Civilian Prime Network, it is the
conclusion of this author that only the ADD will be recaptured. Heavy marketing efforts may
attract some NADD<65 enrollees, but without requiring formal conversion, few will abandon
their current healthcare relationships.
TRICARE Standard/Extra beneficiaries are the second most cost effective approach to
increase enrollment. However, this population has already chosen not to enroll in TRICARE
Prime, including the Civilian Prime Network, for whatever reason. It is the conclusion of the
author that few, if any of these beneficiaries will enroll in TRICARE Prime unless drastic
changes in benefits (perceived care, copays, etc.) occur, which are not expected in the near term.
Medicare eligibles may not be the most cost effective approach, but they are cost
effective up until capacity is achieved. Also, they are probably the most attractive population to
market. In many cases, they are eager to receive their care at a MTF where they already get their
medications. In essence, “a one-stop shop.” Arguably, they could be considered the MTF’s
most loyal customer. Additionally, MTFs that attract NADD>65 care to their facility may gain
increased funding from the “accrual fund”, a fund set up to pay for NADD>65 care beginning in
fiscal year 2003 (FY03). The dilemma in attracting Medicare eligibles back into the MTF is that
now their care with a civilian provider is essentially free so long as they pay Medicare Part B
premiums. Also, this population was forced out of the MTFs when they turned age 65.
Recruiting them back may prove difficult. However, this population may still be the second best
source for increasing enrollment outside the ADD population.
26
Two courses of action are depicted in Tables 11 and 12 in the results section of this
paper. Although there are two other courses of action, they are without merit. The first would
be maintaining the status quo, which is not efficient or effective as it pertains to capacity or cost.
The second, eliminating staff to meet efficiencies, is not viable in a market that has a
demonstrated need for services and an operational commitment for the active duty staff.
Of the two viable options, the first scenario would recapture all Prime beneficiaries
currently enrolled in the Civilian Prime Network before increasing any TRICARE Plus
enrollment. The second scenario looks at increasing TRICARE Plus enrollment based on
projected numbers of ADD beneficiaries being recaptured from the Civilian Prime Network.
The second scenario does not forecast any NADD<65 enrollees coming back into NHP’s
TRICARE Prime. Neither scenario directs efforts to recapture TRICARE Standard/Extra
beneficiaries because it is concluded that they are the hardest population to attract and the least
likely to enroll.
The second option is the recommended approach for NHP for two primary reasons. First,
it attracts the most marketable populations, ADD and NADD>65. Secondly, as both scenarios
produce significant savings for the MHS, only the second scenario has the potential to produce
actual cost savings for NHP through estimated reimbursements from the NADD>65 accrual
fund. At 80 percent capacity, the second scenario will increase TRICARE Prime enrollment by
over 4500 and TRICARE Plus enrollment by at least 3000 from December 2001 levels.
TRICARE Plus enrollment could increase an additionally 1100 if maximum capacity was
considered. At 80 percent capacity, the increased enrollment will result in annual savings of $90
thousand and $2.25 million for NHP and the MHS respectively.

27
Appendix A
Figure A1. Estimated NHP Catchment Area Healthcare Costs with 100% CPN Recapture.
Cost of NHP Area Healthcare
$0.00
$5,000,000.00
$10,000,000.00
$15,000,000.00
$20,000,000.00
$25,000,000.00
Tota
l Cos
ts MTF Total CostsNetwork CostsTFL CostsTotal Care Costs
80-100% Capacity
28
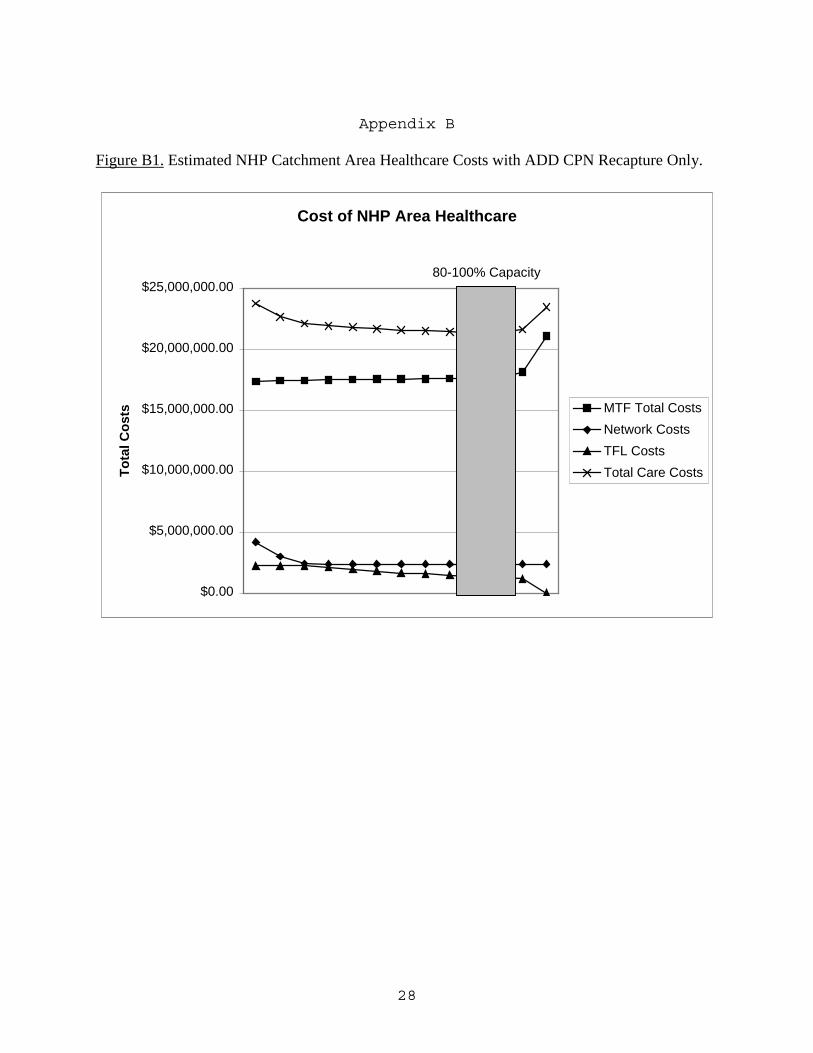
Appendix B
Figure B1. Estimated NHP Catchment Area Healthcare Costs with ADD CPN Recapture Only.
Cost of NHP Area Healthcare
$0.00
$5,000,000.00
$10,000,000.00
$15,000,000.00
$20,000,000.00
$25,000,000.00
Tota
l Cos
ts MTF Total CostsNetwork CostsTFL CostsTotal Care Costs
80-100% Capacity

29
Appendix C
Alphabetical List of Key Acronyms Included in this Paper
AD Active Duty Service MemberADD Active Duty DependentBencat Beneficiary CategoryADFM Active Duty Family MemberCDR Commander, United States NavyCHAMPUS Civilian Health and Medical Plan of the Uniformed ServicesCHCS Composite Healthcare SystemCPN Civilian TRICARE Prime NetworkCY Calendar Year (Jan – Dec)DAA Defense Authorization ActDoD Department of DefenseFY Fiscal Year (Oct – Sep)GME Graduate Medical EducationHMO Health Maintenance OrganizationLCDR Lieutenant Commander, United States NavyMAJ Major, United States ArmyMEPRS Military Expense Performance Reporting SystemMHS Military Health SystemMTF Military Treatment Facility (Hospital)NADD<65 Non-Active Duty Beneficiary under the age of 65NADD>65 Non-Active Duty Beneficiary over the age of 65 (Medicare Eligibles)NHP Naval Hospital PensacolaNMOP National Mail Order PharmacyNP Nurse PractitionerPA Physician AssistantPC Primary CarePCM Primary Care ManagerPPO Preferred Provider OrganizationTP TRICARE PlusTFL TRICARE for Life

30
References
Assistant Secretary Of Defense (2001). Policy Memorandum to Refine Policy and
Establish the TRICARE Plus Program. Washington, DC. Author.
Aventis Pharmaceuticals (2001). Managed Care Digest Series, HMO-PPO Digest (Vol. 4,
pp. 15-54). Bridgewater, NJ: Author.
BUMED-32. (2001). Tricare plus: MTF enrollment toolkit (Summer, Annex A).
Washington, DC: Author.
Center for Medicare (2001). Available: http://hcfa.gov.
Commander Southern Command Naval Facilities Engineering Command. (1996).
Facility Utilization Study (Contract No. N62467-93-R-0908). Winter Park, Florida: Rogers,
Lovelock, and Fritz.
Harris, M. and Carr, N. (2000). Military Retirees Focusing On House and Senate
Decisions On Health Care. Available: http://216.33.101.100/About/Press/HealthCare.asp
HealthMetrix Research Inc. (2002). Medicare HMO 2002 Cost Share Report. Available:
http://www.hmos4seniors.com
Kongstvedt, P. R. (2001). Essentials of managed health care (4th ed.). Gaithersburg, MD:
Aspen Publishers, Inc.
Luduigsen, S. M. (2001). [Naval Hospital Pensacola Marketing Study]. Unpublished raw
data.
Nashville Area Office Indian Health Service (2001). IHS Final Medicare and Medicaid
Rates [On-line]. Available:
http://www.ihs.gov/FacilitiesServices/AreaOffices/Nashville/mcr_mcd_rates.htm
Perrault, J. (2001). [Naval Hospital Pensacola Capacity Model]. Unpublished raw data.

31
Philpott, T. (2001, August). The tricare budget drain. Air Force Magazine, page 84.
TRICARE Management Activity (2001). TRICARE Financial Managers Education
Program. Washington, D.C.
TRICARE Management Activity. (2001). Available: http://www.tricare.osd.mil
TRICARE Region 4 (2001). Available: http://region4.tricare.osd.mil/
Zelman, W. N., McCue, M. J., & Millikan, A. R. (1998). Financial management of health
care organizations: An introduction to fundamental tools, concepts, and applications. Malden,
Massachusetts: Blackwell Publishers Inc.