Embed Size (px)
Citation preview
TRICARE Data Quality Training Course
June 2006
Mr. Martin Shepherd, Manager, Direct Care Data OperationsTRICARE Management Activity (TMA)Executive Information and Decision Support (EIDS)United States Department of Defense Military Health System
2
Who We Are
MHS centralized data store Receive, analyze, process, and store
100+ terabytes of data Thousands of users worldwide
3
Our Mission EIDS supports MHS decision-makers by
collecting, processing, and managing enterprise data.
Our Vision EIDS is the recognized and preferred
source of decision-critical data for the MHS.
4
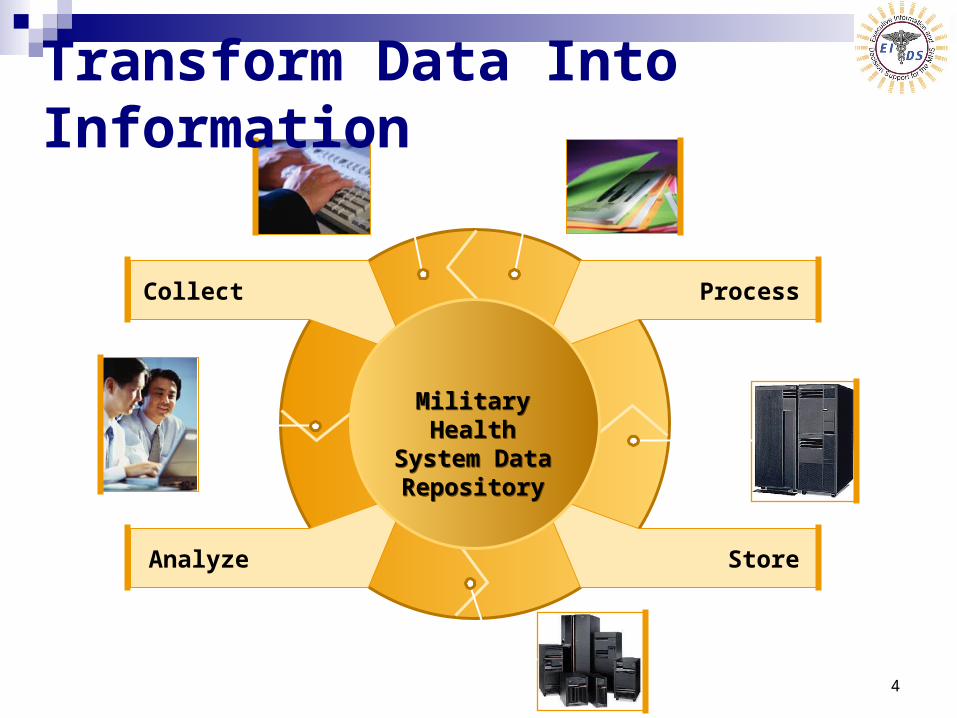
Analyze Store
ProcessCollect
Fraud, Performance, Eligibility Analysis
Receive Claims
Store 200M+ Claims Per Year
Process Through Business Rules
Military Health System Data Repository
Military Health System Data Repository
Military Health System Data Repository
Transform Data Into Information
5
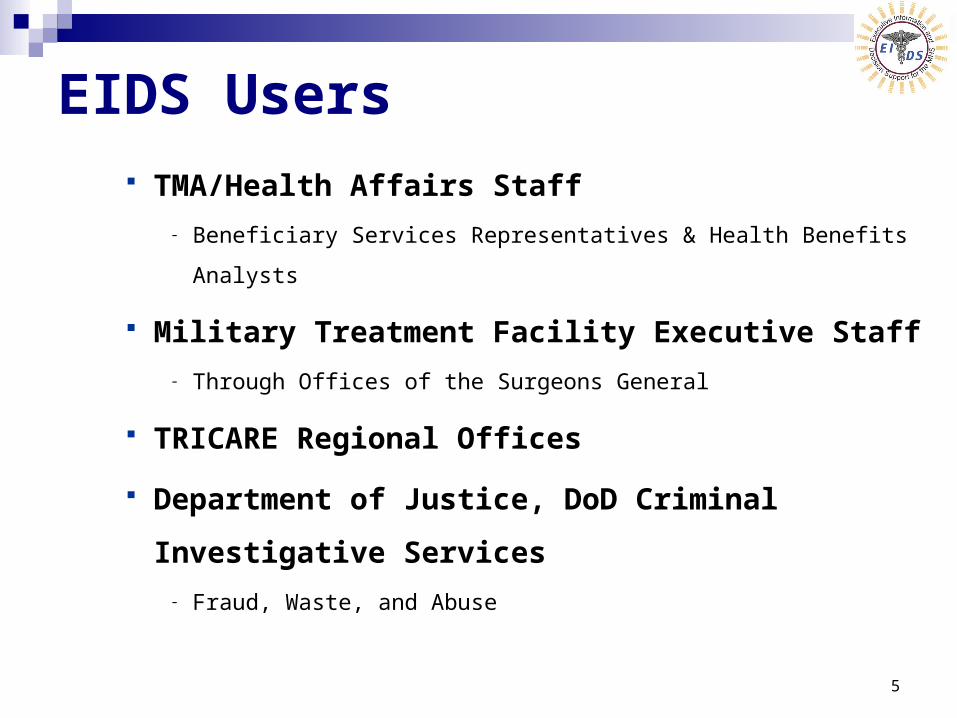
EIDS Users
TMA/Health Affairs Staff
- Beneficiary Services Representatives & Health Benefits Analysts
Military Treatment Facility Executive Staff
- Through Offices of the Surgeons General
TRICARE Regional Offices
Department of Justice, DoD Criminal Investigative
Services
- Fraud, Waste, and Abuse
6
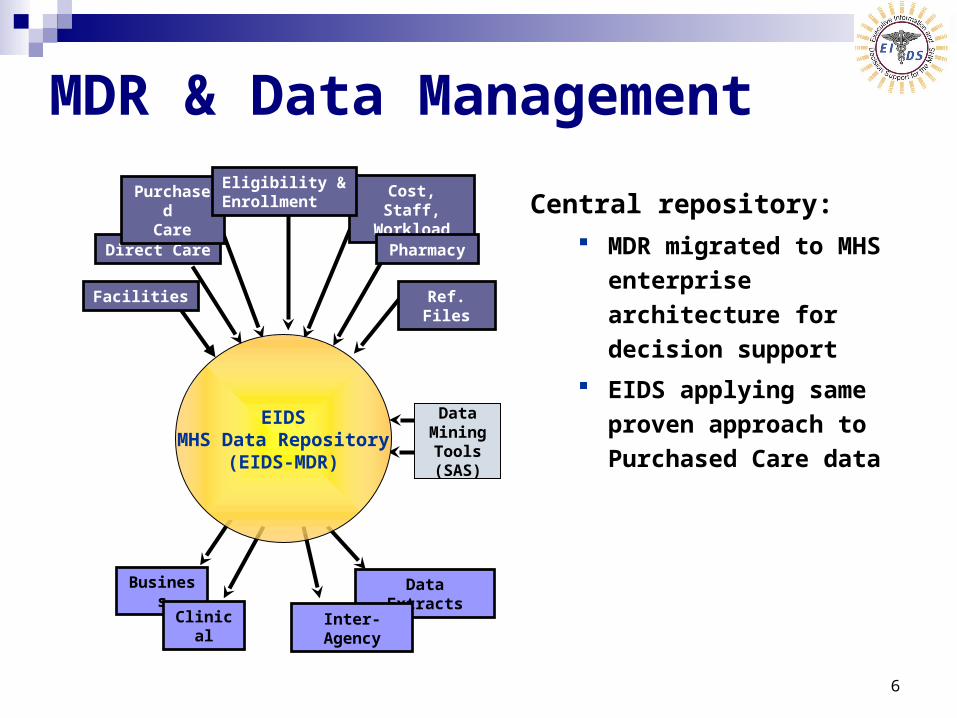
Direct Care
Cost, Staff, Workload
Purchased Care
Eligibility &Enrollment
Ref. Files
Pharmacy
Facilities
Business
Clinical
Data Extracts
Inter-Agency
MDR & Data Management
Central repository: MDR migrated to MHS
enterprise architecture for
decision support
EIDS applying same proven
approach to Purchased Care
dataData
Mining Tools (SAS)
EIDSMHS Data Repository
(EIDS-MDR)
7
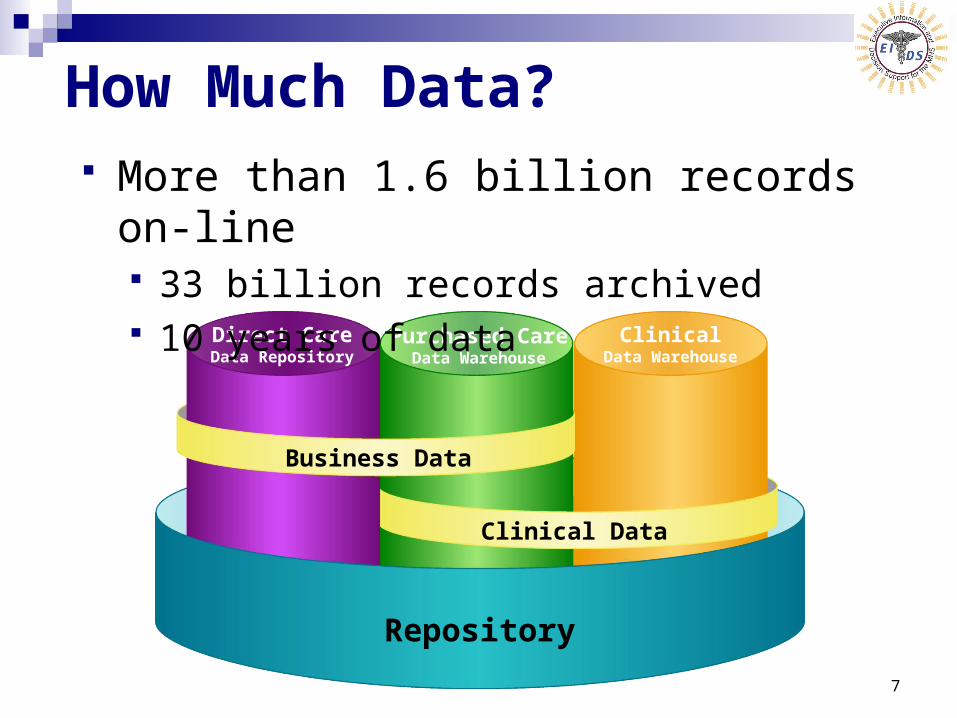
Repository
Clinical Data
Business Data
Direct CareData Repository
Purchased CareData Warehouse
ClinicalData Warehouse
How Much Data? More than 1.6 billion records on-line
33 billion records archived 10 years of data
8
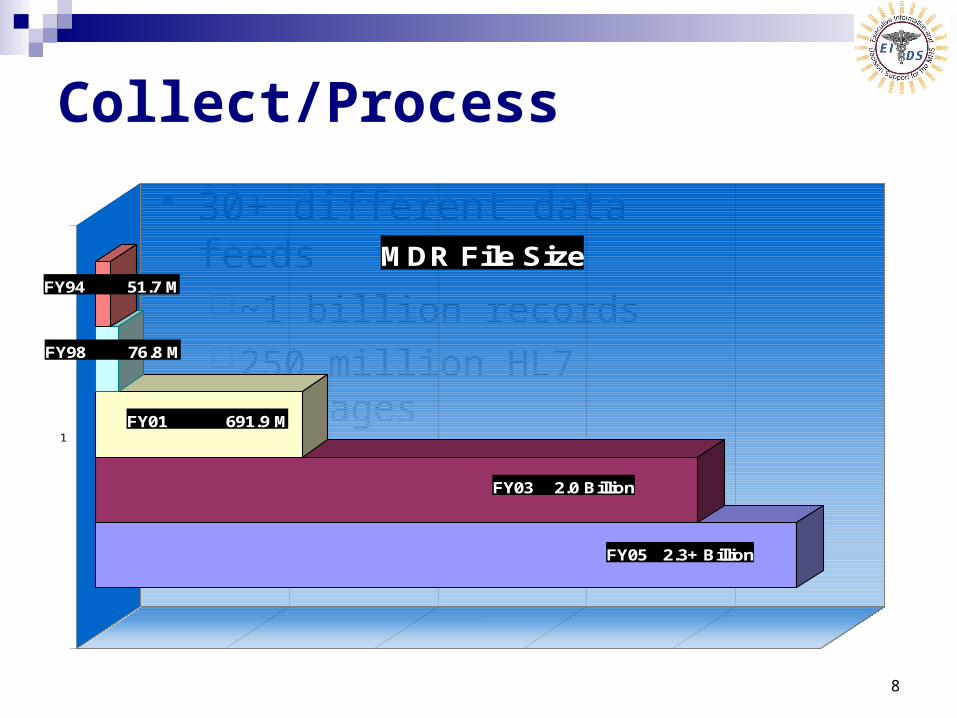
Collect/Process
30+ different data feeds~1 billion records250 million HL7
messages
FY05 2.3+ Billion
FY03 2.0 Billion
FY01 691.9 M
FY98 76.8 M
FY94 51.7 M
1
MDR File Size
9
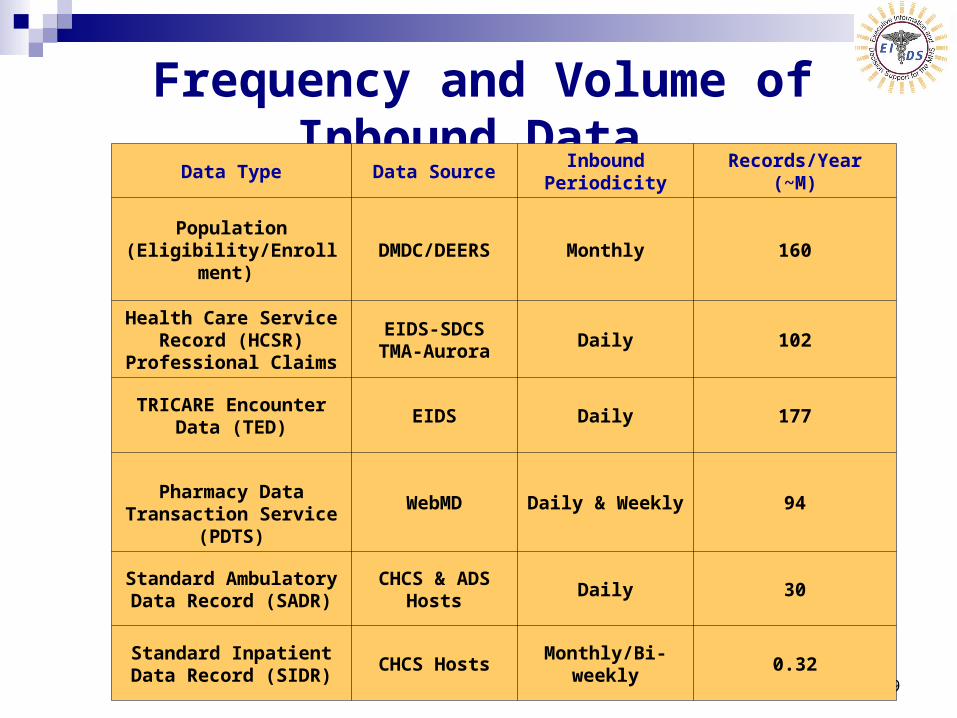
Frequency and Volume of Inbound Data
Data Type Data SourceInbound
PeriodicityRecords/Year
(~M)
Population (Eligibility/Enrollmen
t) DMDC/DEERS Monthly 160
Health Care Service Record (HCSR)
Professional Claims
EIDS-SDCS TMA-Aurora
Daily 102
TRICARE Encounter Data (TED)
EIDS Daily 177
Pharmacy Data Transaction Service
(PDTS)
WebMDDaily & Weekly
94
Standard Ambulatory Data Record (SADR)
CHCS & ADS Hosts
Daily 30
Standard Inpatient Data Record (SIDR)
CHCS HostsMonthly/Bi-
weekly0.32
10
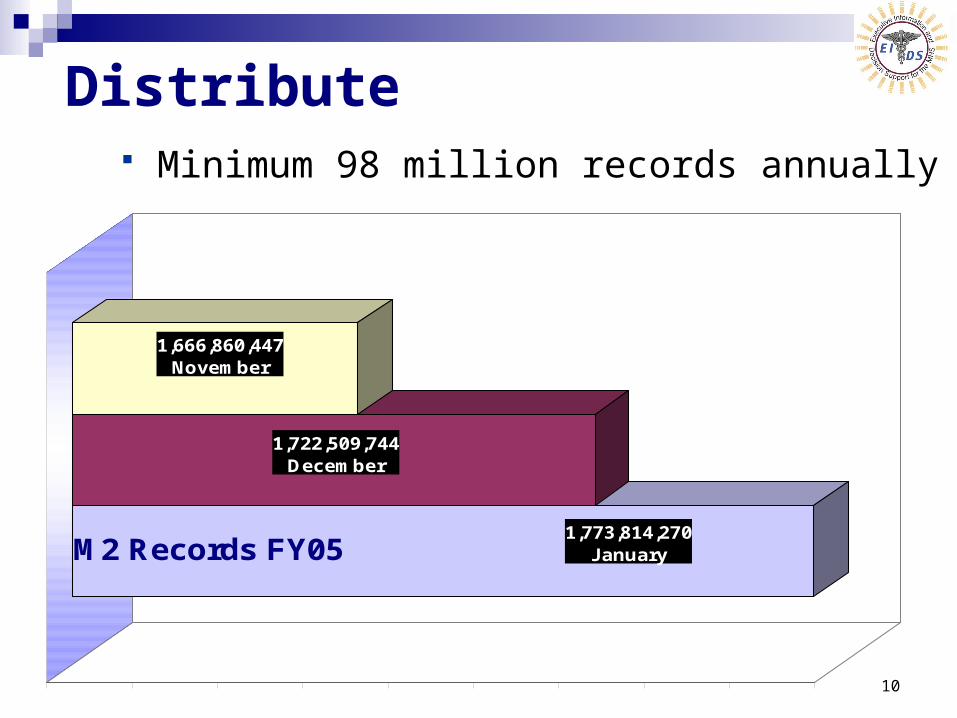
Distribute Minimum 98 million records annually
1,773,814,270 January
1,722,509,744 December
1,666,860,447 November
M2 Records FY05
11
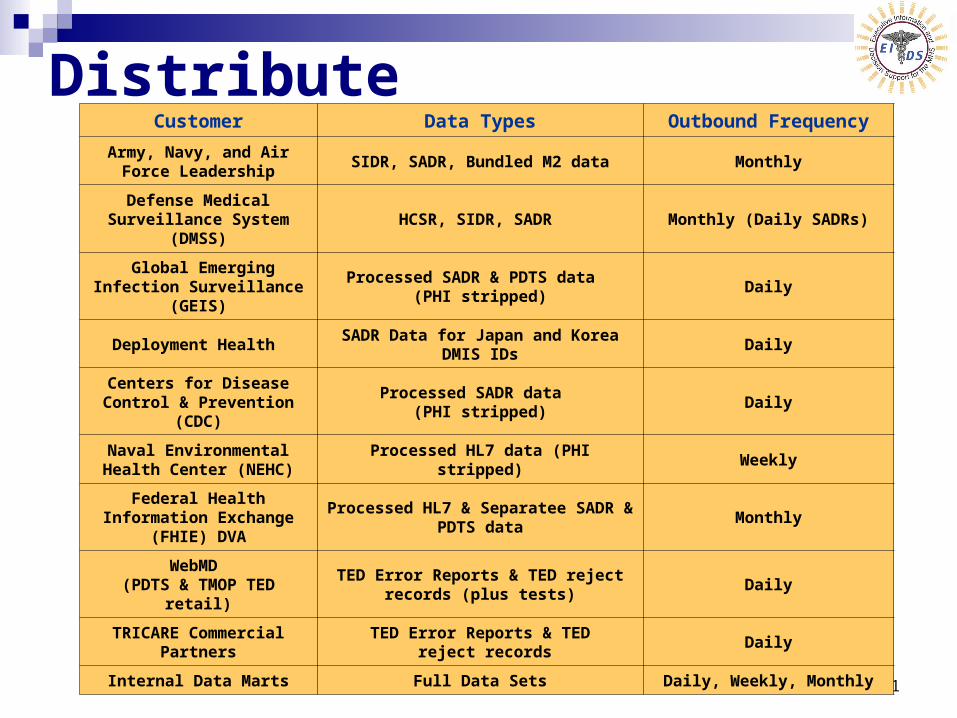
Distribute Customer Data Types Outbound Frequency
Army, Navy, and Air Force Leadership
SIDR, SADR, Bundled M2 data Monthly
Defense Medical Surveillance System
(DMSS)HCSR, SIDR, SADR Monthly (Daily SADRs)
Global Emerging Infection Surveillance
(GEIS)
Processed SADR & PDTS data (PHI stripped)
Daily
Deployment Health SADR Data for Japan and Korea
DMIS IDsDaily
Centers for Disease Control & Prevention
(CDC)
Processed SADR data (PHI stripped)
Daily
Naval Environmental Health Center (NEHC)
Processed HL7 data (PHI stripped)
Weekly
Federal Health Information Exchange
(FHIE) DVA
Processed HL7 & Separatee SADR & PDTS data
Monthly
WebMD (PDTS & TMOP TED
retail)
TED Error Reports & TED reject records (plus tests)
Daily
TRICARE Commercial Partners
TED Error Reports & TED reject records
Daily
Internal Data Marts Full Data Sets Daily, Weekly, Monthly
12
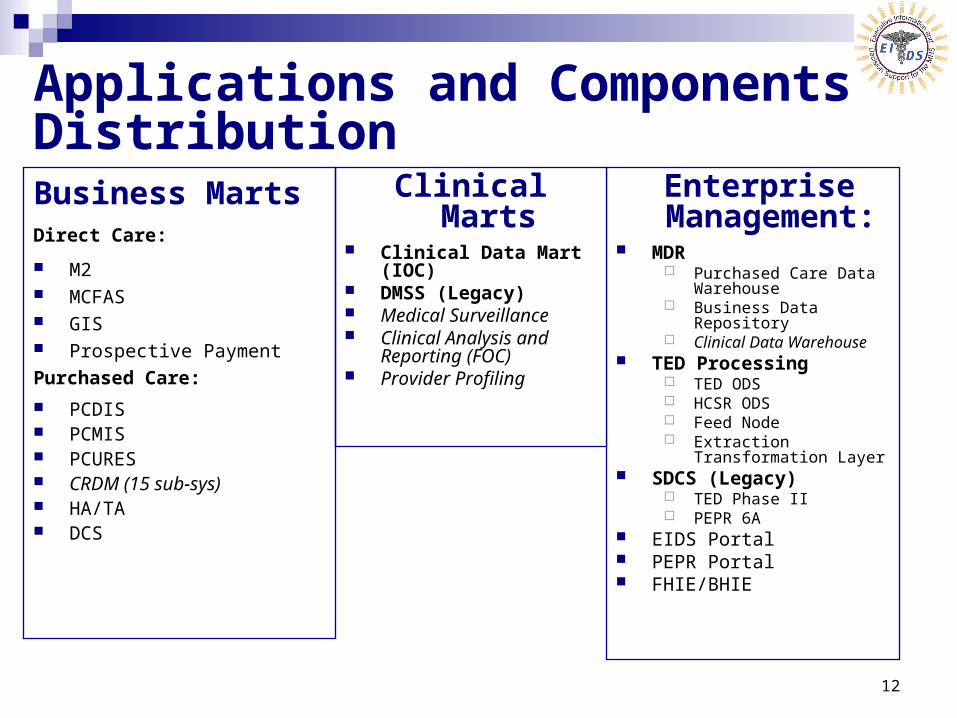
Applications and Components Distribution
Enterprise Management
: MDR
Purchased Care Data Warehouse
Business Data Repository
Clinical Data Warehouse TED Processing
TED ODS HCSR ODS Feed Node Extraction
Transformation Layer SDCS (Legacy)
TED Phase II PEPR 6A
EIDS Portal PEPR Portal FHIE/BHIE
Clinical Marts Clinical Data Mart
(IOC) DMSS (Legacy) Medical Surveillance Clinical Analysis and
Reporting (FOC) Provider Profiling
Business MartsDirect Care:
M2 MCFAS GIS Prospective PaymentPurchased Care:
PCDIS PCMIS PCURES CRDM (15 sub-sys) HA/TA DCS
13
How We Manage Data
Security Quality Assurance Validity Tests
14
Management Control Measures
Product Release (to include data) Multiple gates to assure acceptance by
functional proponent Design reviews (URS, PDR & CDR) Testing & data validity checks Each gate requires approval by functional
proponent
15
Security Measures Information Assurance & Vulnerability Assessment
(IAVA) compliant TMA Privacy Office oversight HIPAA data anonymized based on user need (e.g.
role-based access) All records encrypted during distribution All data marts certified before users are permitted
access
16
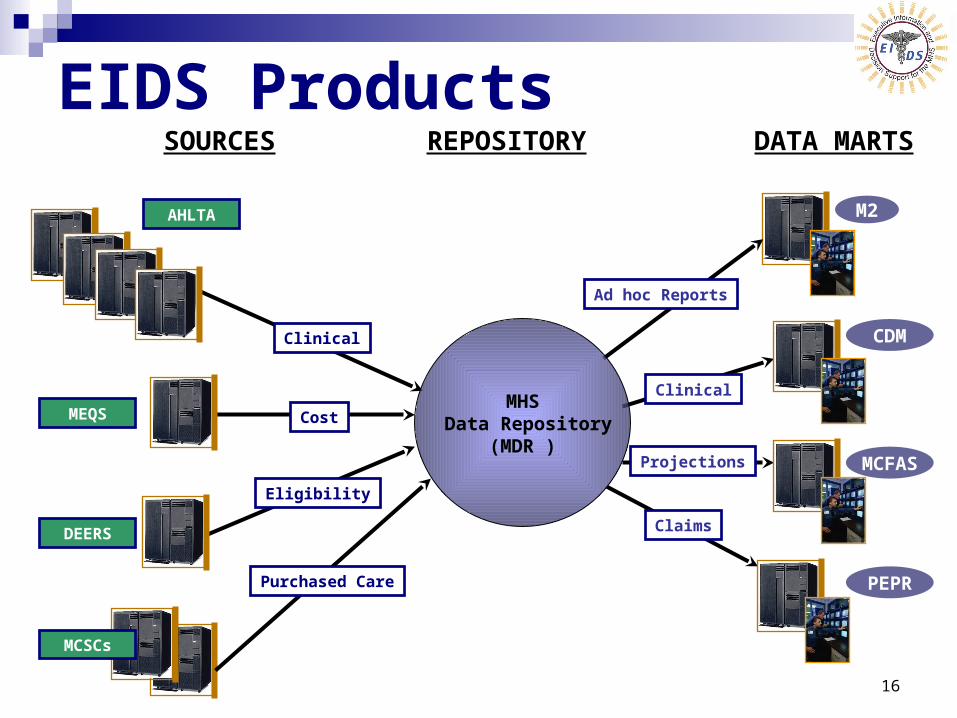
SOURCES DATA MARTSREPOSITORY
EIDS Products
M2
Clinical
Cost
Purchased Care
Eligibility
Ad hoc Reports
Clinical
Projections
Claims
MHS Data Repository
(MDR )
CDM
MCFAS
PEPR
AHLTA
MEQS
DEERS
MCSCs
17
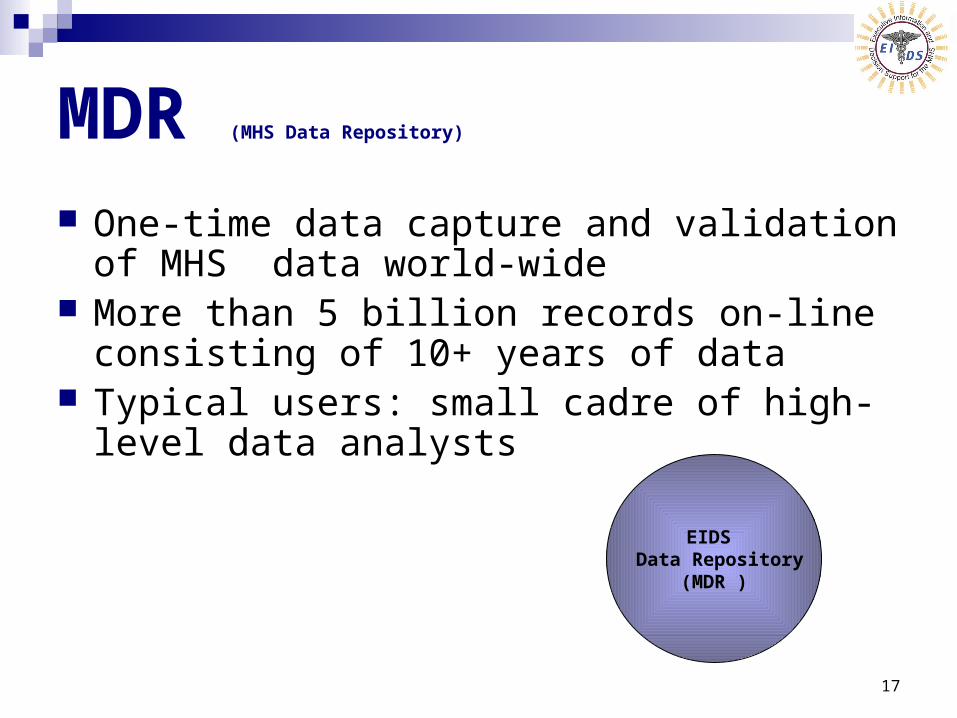
MDR (MHS Data Repository)
One-time data capture and validation of MHS data world-wide
More than 5 billion records on-line consisting of 10+ years of data
Typical users: small cadre of high-level data analysts
EIDS Data Repository
(MDR )
18
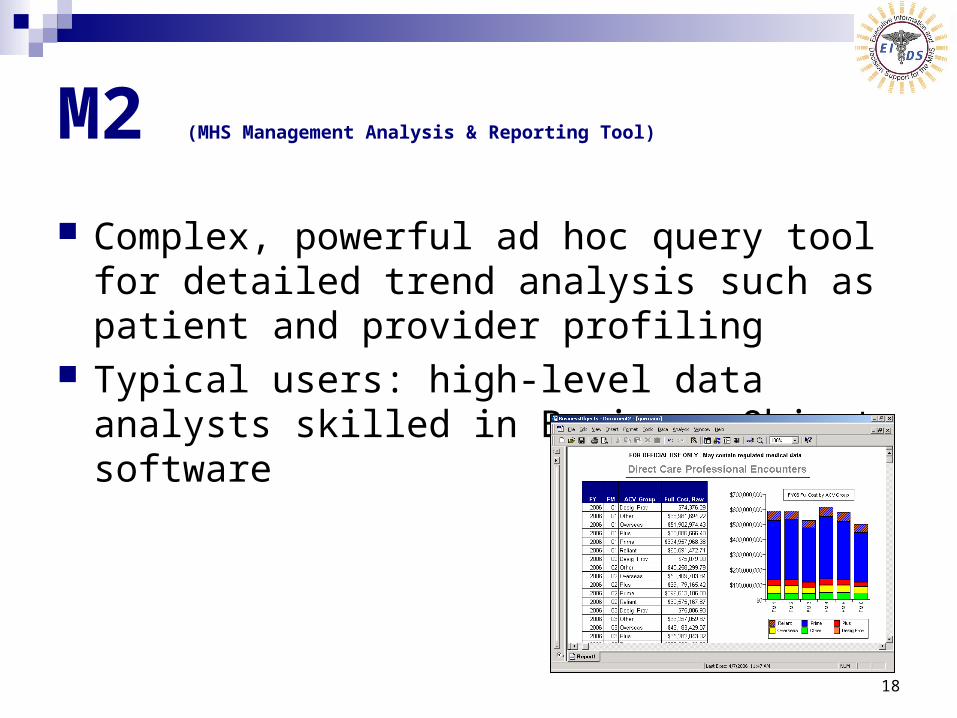
M2 (MHS Management Analysis & Reporting Tool)
Complex, powerful ad hoc query tool for detailed trend analysis such as patient and provider profiling
Typical users: high-level data analysts skilled in Business Objects software
19
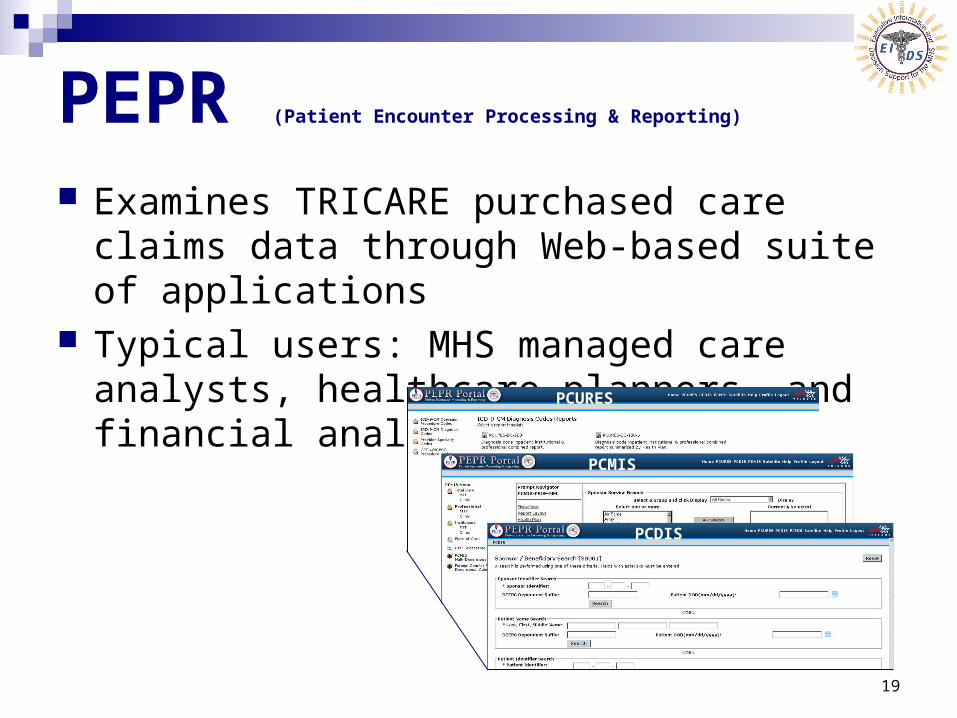
Examines TRICARE purchased care claims data through Web-based suite of applications
Typical users: MHS managed care analysts, healthcare planners, and financial analysts
PEPR (Patient Encounter Processing & Reporting)
PCURES
PCMIS
PCDIS
20
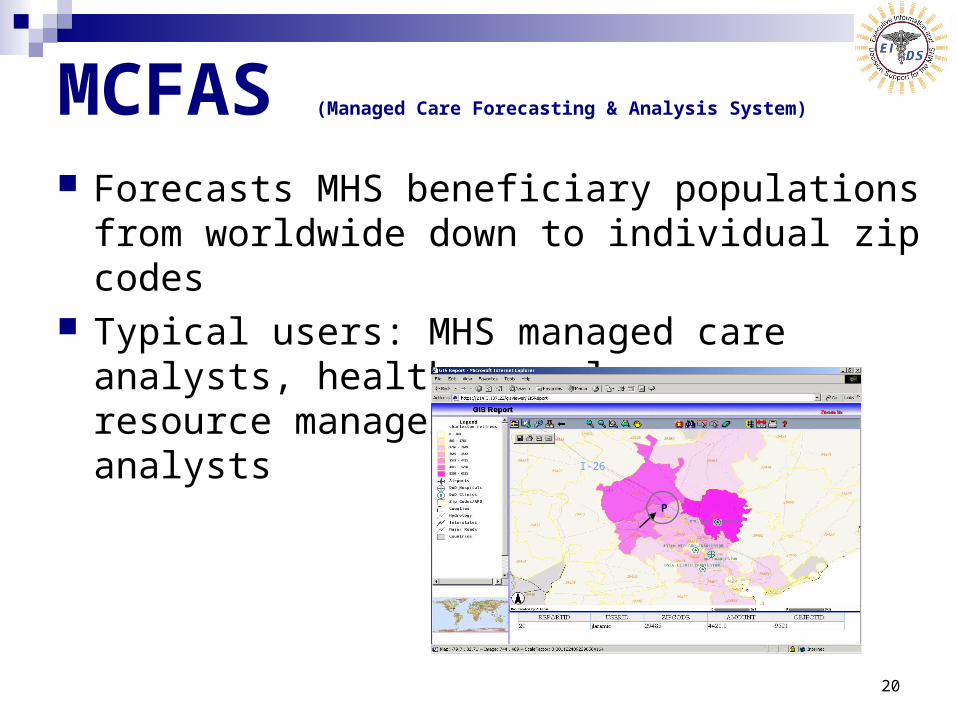
MCFAS (Managed Care Forecasting & Analysis System)
Forecasts MHS beneficiary populations from worldwide down to individual zip codes
Typical users: MHS managed care analysts, healthcare planners, resource managers, and financial analysts
I-26
P
21
Data Quality Examples
22
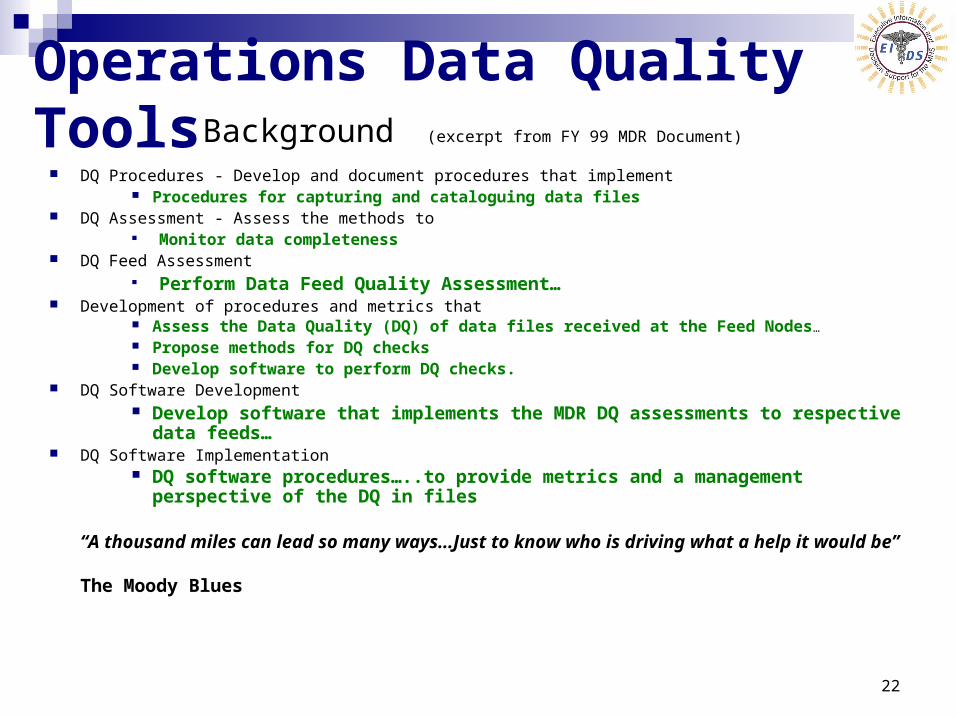
Operations Data Quality ToolsBackground (excerpt from FY 99 MDR Document)
DQ Procedures - Develop and document procedures that implement Procedures for capturing and cataloguing data files
DQ Assessment - Assess the methods to Monitor data completeness
DQ Feed Assessment Perform Data Feed Quality Assessment…
Development of procedures and metrics that Assess the Data Quality (DQ) of data files received at the Feed Nodes…
Propose methods for DQ checks Develop software to perform DQ checks.
DQ Software Development Develop software that implements the MDR DQ assessments to respective data
feeds… DQ Software Implementation
DQ software procedures…..to provide metrics and a management perspective of the DQ in files
“A thousand miles can lead so many ways…Just to know who is driving what a help it would be”
The Moody Blues
23
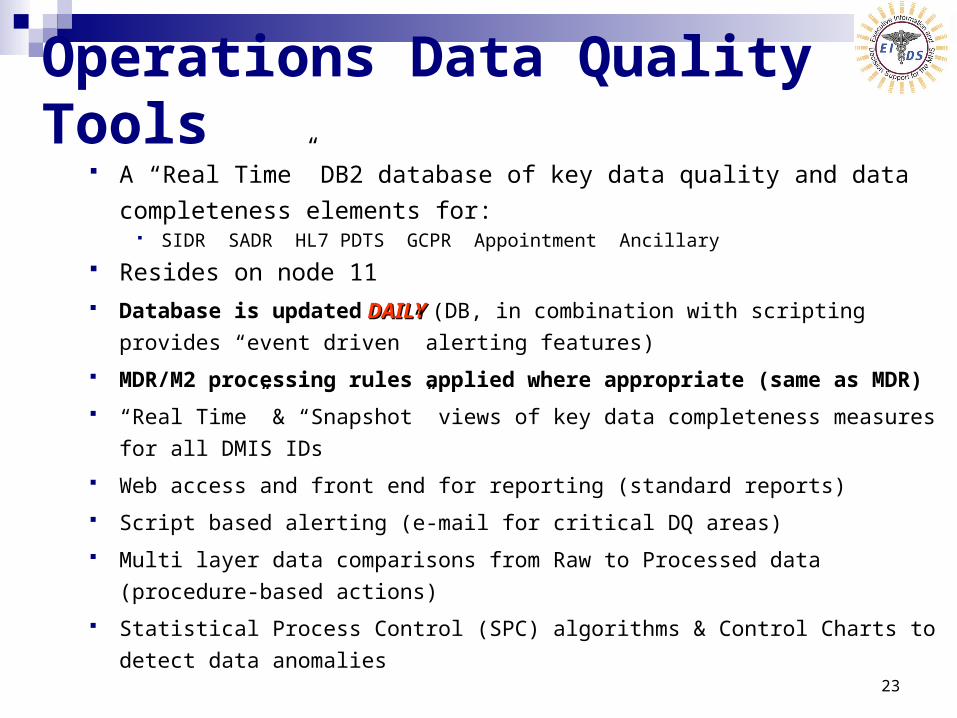
A “Real Time” DB2 database of key data quality and data completeness
elements for: SIDR SADR HL7 PDTS GCPR Appointment Ancillary
Resides on node 11 Database is updated DAILYDAILY (DB, in combination with scripting provides “event driven”
alerting features)
MDR/M2 processing rules applied where appropriate (same as MDR)
“Real Time” & “Snapshot” views of key data completeness measures for all DMIS IDs
Web access and front end for reporting (standard reports)
Script based alerting (e-mail for critical DQ areas)
Multi layer data comparisons from Raw to Processed data (procedure-based actions)
Statistical Process Control (SPC) algorithms & Control Charts to detect data anomalies
Operations Data Quality Tools
24
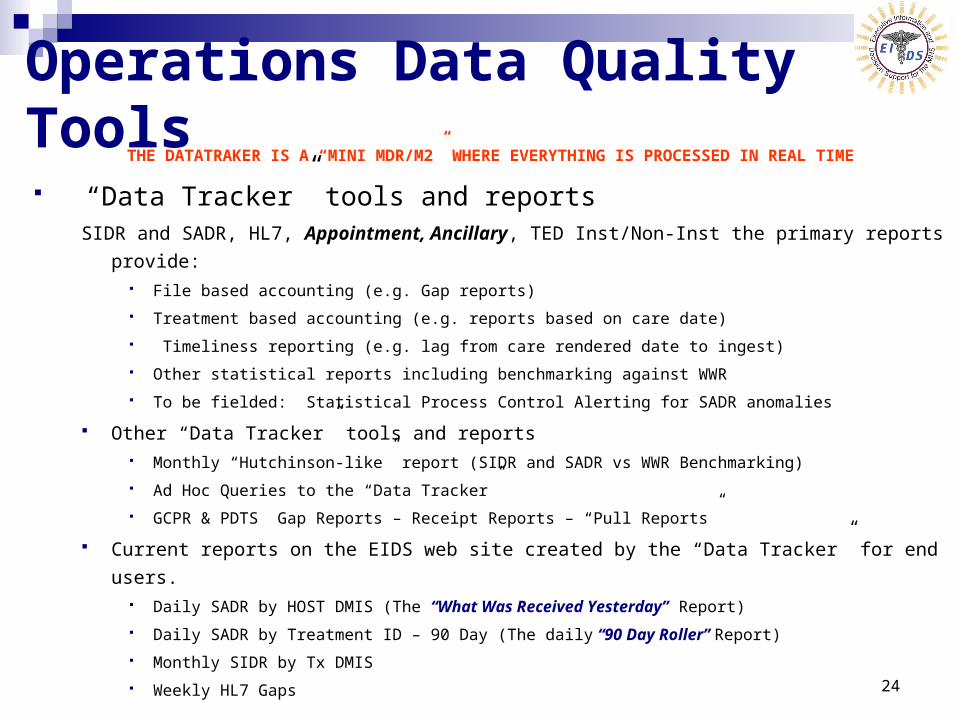
Operations Data Quality ToolsTHE DATATRAKER IS A “MINI MDR/M2” WHERE EVERYTHING IS PROCESSED IN REAL TIME
“Data Tracker” tools and reports SIDR and SADR, HL7, Appointment, Ancillary, TED Inst/Non-Inst the primary reports provide:
File based accounting (e.g. Gap reports)
Treatment based accounting (e.g. reports based on care date)
Timeliness reporting (e.g. lag from care rendered date to ingest)
Other statistical reports including benchmarking against WWR
To be fielded: Statistical Process Control Alerting for SADR anomalies
Other “Data Tracker” tools and reports Monthly “Hutchinson-like” report (SIDR and SADR vs WWR Benchmarking)
Ad Hoc Queries to the “Data Tracker”
GCPR & PDTS Gap Reports – Receipt Reports – “Pull Reports”
Current reports on the EIDS web site created by the “Data Tracker” for end users. Daily SADR by HOST DMIS (The “What Was Received Yesterday” Report)
Daily SADR by Treatment ID – 90 Day (The daily “90 Day Roller” Report)
Monthly SIDR by Tx DMIS
Weekly HL7 Gaps
25
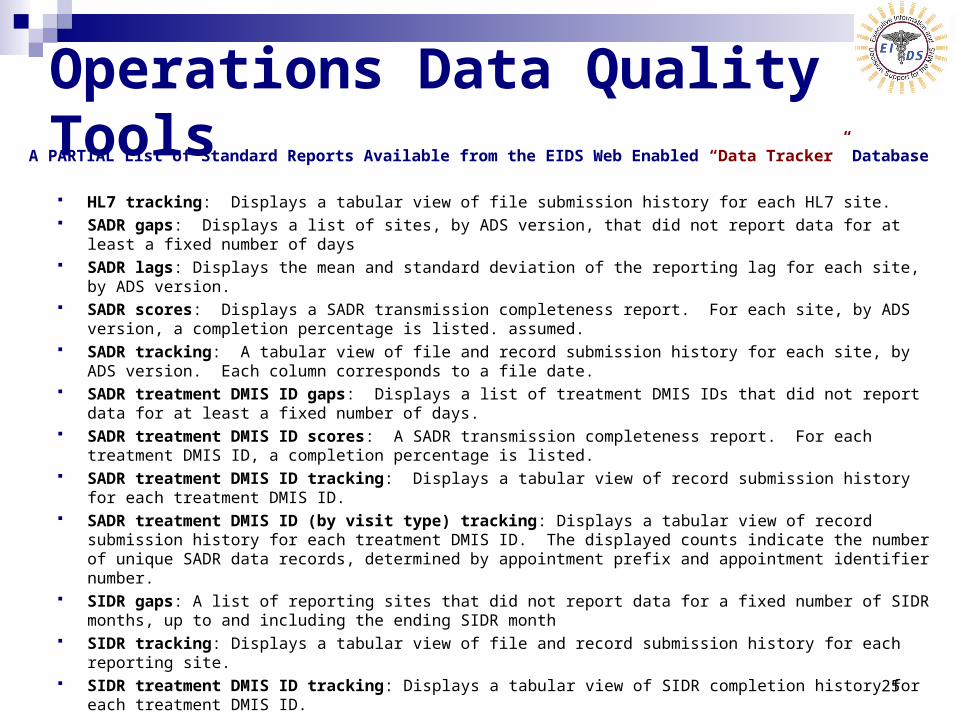
Operations Data Quality ToolsA PARTIAL List of Standard Reports Available from the EIDS Web Enabled “Data Tracker” Database
HL7 tracking: Displays a tabular view of file submission history for each HL7 site. SADR gaps: Displays a list of sites, by ADS version, that did not report data for at least a fixed number of days SADR lags: Displays the mean and standard deviation of the reporting lag for each site, by ADS version. SADR scores: Displays a SADR transmission completeness report. For each site, by ADS version, a completion
percentage is listed. assumed. SADR tracking: A tabular view of file and record submission history for each site, by ADS version. Each column
corresponds to a file date. SADR treatment DMIS ID gaps: Displays a list of treatment DMIS IDs that did not report data for at least a fixed number
of days. SADR treatment DMIS ID scores: A SADR transmission completeness report. For each treatment DMIS ID, a
completion percentage is listed. SADR treatment DMIS ID tracking: Displays a tabular view of record submission history for each treatment DMIS ID. SADR treatment DMIS ID (by visit type) tracking: Displays a tabular view of record submission history for each
treatment DMIS ID. The displayed counts indicate the number of unique SADR data records, determined by appointment prefix and appointment identifier number.
SIDR gaps: A list of reporting sites that did not report data for a fixed number of SIDR months, up to and including the ending SIDR month
SIDR tracking: Displays a tabular view of file and record submission history for each reporting site. SIDR treatment DMIS ID tracking: Displays a tabular view of SIDR completion history for each treatment DMIS ID. GCPR gap: Displays a list of sites that did not report data for at least a fixed number of days.
26
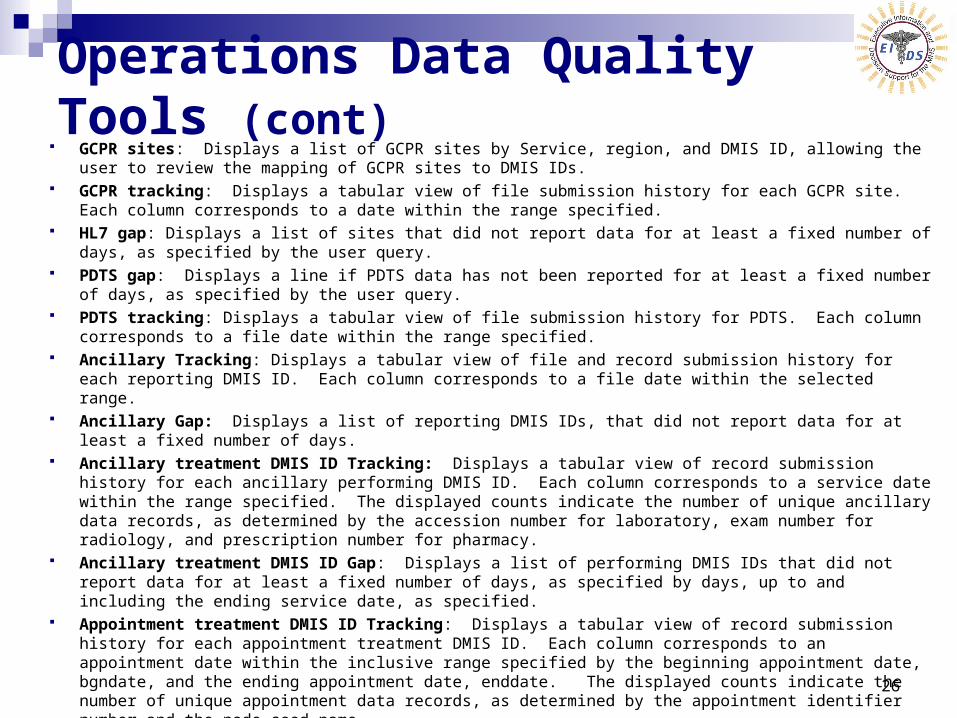
Operations Data Quality Tools (cont) GCPR sites: Displays a list of GCPR sites by Service, region, and DMIS ID, allowing the user to review the mapping of
GCPR sites to DMIS IDs. GCPR tracking: Displays a tabular view of file submission history for each GCPR site. Each column corresponds to a
date within the range specified. HL7 gap: Displays a list of sites that did not report data for at least a fixed number of days, as specified by the user
query. PDTS gap: Displays a line if PDTS data has not been reported for at least a fixed number of days, as specified by the
user query. PDTS tracking: Displays a tabular view of file submission history for PDTS. Each column corresponds to a file date
within the range specified. Ancillary Tracking: Displays a tabular view of file and record submission history for each reporting DMIS ID. Each
column corresponds to a file date within the selected range. Ancillary Gap: Displays a list of reporting DMIS IDs, that did not report data for at least a fixed number of days. Ancillary treatment DMIS ID Tracking: Displays a tabular view of record submission history for each ancillary
performing DMIS ID. Each column corresponds to a service date within the range specified. The displayed counts indicate the number of unique ancillary data records, as determined by the accession number for laboratory, exam number for radiology, and prescription number for pharmacy.
Ancillary treatment DMIS ID Gap: Displays a list of performing DMIS IDs that did not report data for at least a fixed number of days, as specified by days, up to and including the ending service date, as specified.
Appointment treatment DMIS ID Tracking: Displays a tabular view of record submission history for each appointment treatment DMIS ID. Each column corresponds to an appointment date within the inclusive range specified by the beginning appointment date, bgndate, and the ending appointment date, enddate. The displayed counts indicate the number of unique appointment data records, as determined by the appointment identifier number and the node seed name.
Appointment treatment DMIS ID Gap: Displays a list of treatment DMIS IDs that did not report data for at least a fixed number of days, as specified by days, up to and including the ending appointment date, as specified.
27
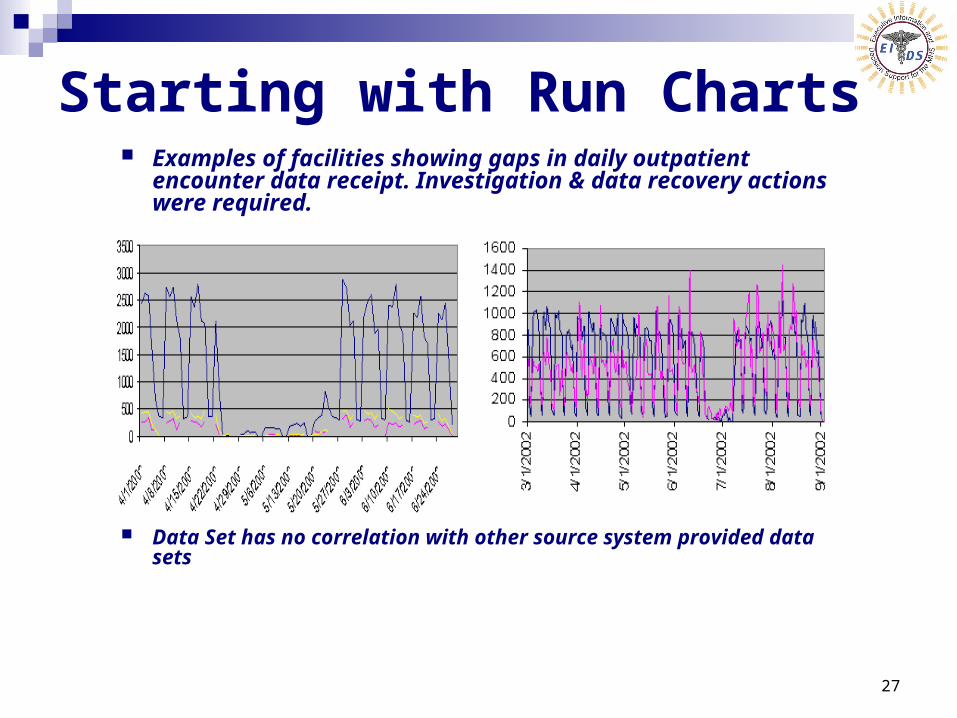
Starting with Run Charts Examples of facilities showing gaps in daily outpatient
encounter data receipt. Investigation & data recovery actions were required.
Data Set has no correlation with other source system provided data sets
28
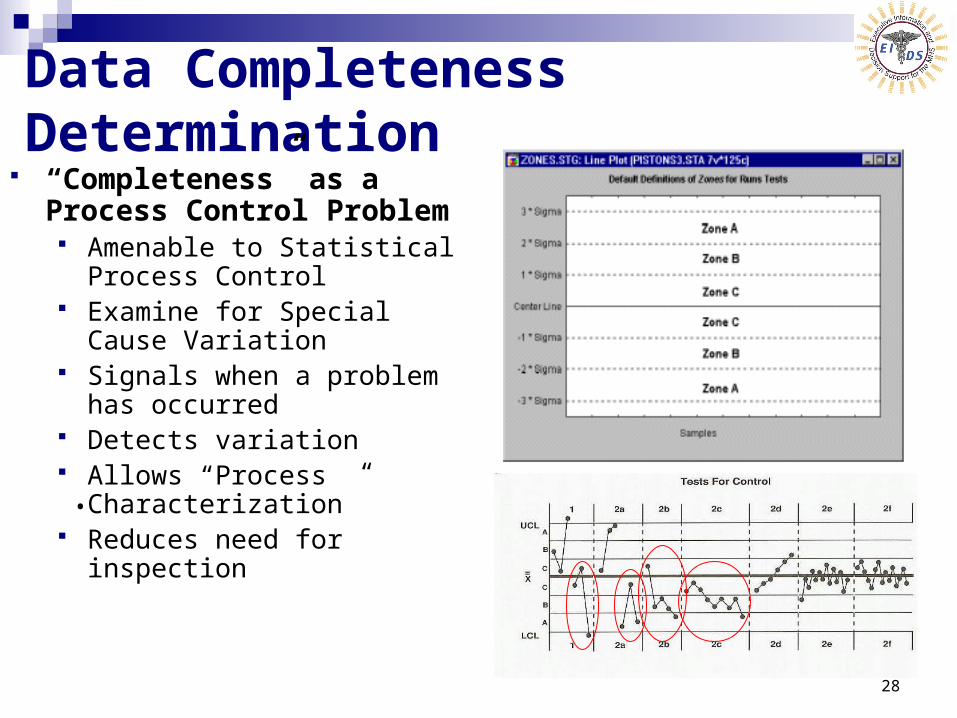
Data Completeness Determination “Completeness” as a Process
Control Problem Amenable to Statistical Process
Control Examine for Special Cause
Variation Signals when a problem has
occurred Detects variation Allows “Process
Characterization” Reduces need for inspection
•
29
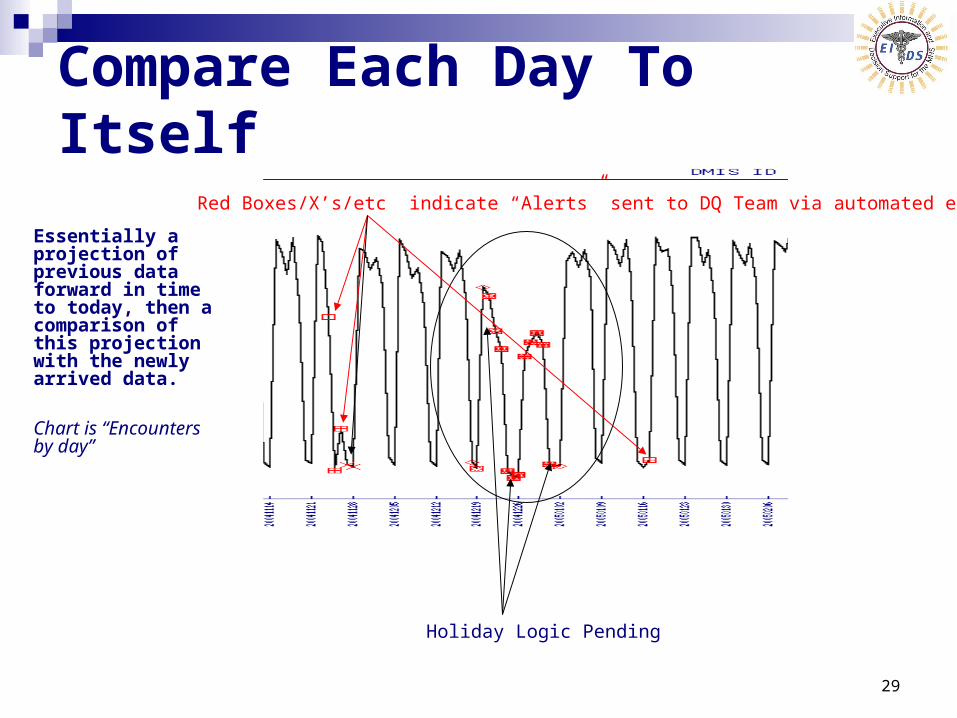
Compare Each Day To Itself
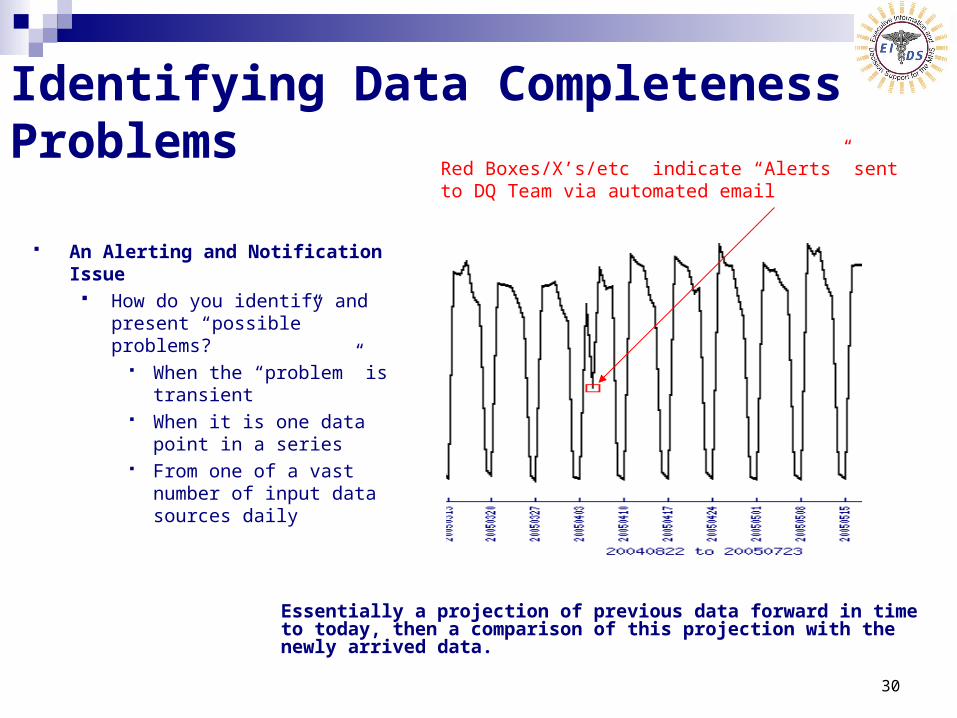
Red Boxes/X’s/etc indicate “Alerts” sent to DQ Team via automated email
Holiday Logic Pending
Essentially a projection of previous data forward in time to today, then a comparison of this projection with the newly arrived data.
Chart is “Encounters by day”
30
Identifying Data Completeness Problems
An Alerting and Notification Issue How do you identify and present
“possible” problems? When the “problem” is
transient When it is one data point in
a series From one of a vast number
of input data sources daily
Red Boxes/X’s/etc indicate “Alerts” sent to DQ Team via automated email
Essentially a projection of previous data forward in time to today, then a comparison of this projection with the newly arrived data.
31
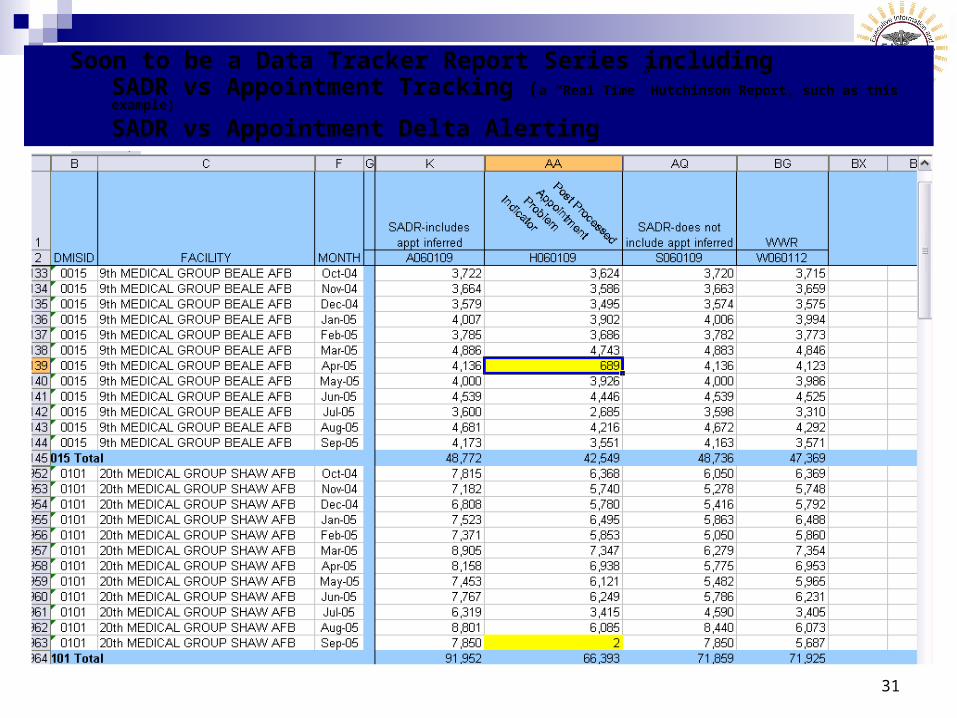
Soon to be a Data Tracker Report Series including SADR vs Appointment Tracking (a “Real Time” Hutchinson Report, such as this example)
SADR vs Appointment Delta Alerting
32
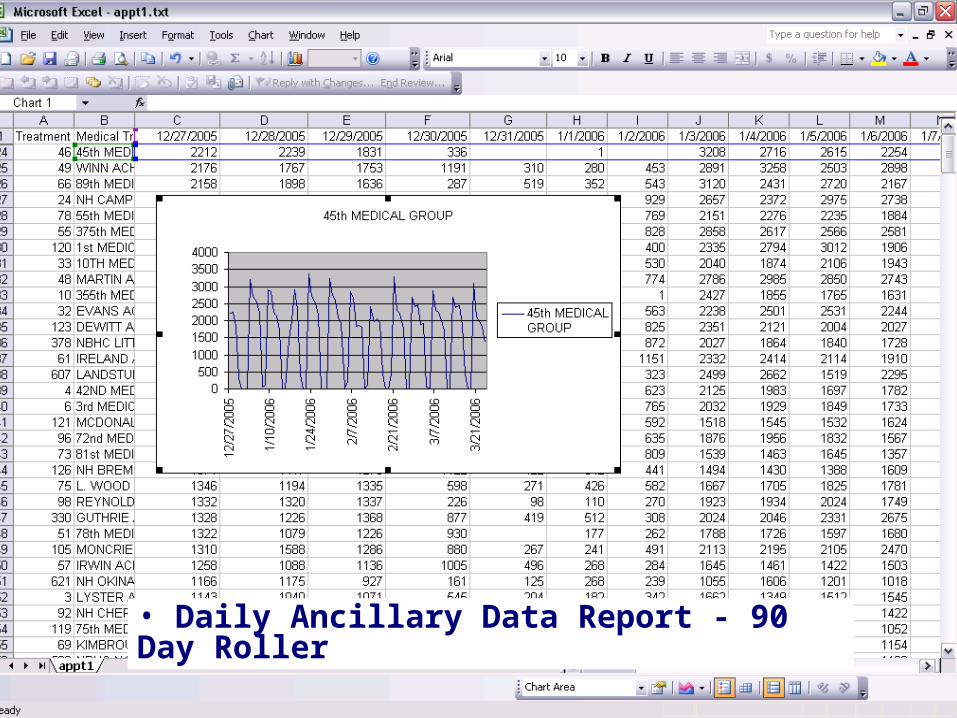
• Daily Ancillary Data Report - 90 Day Roller
33
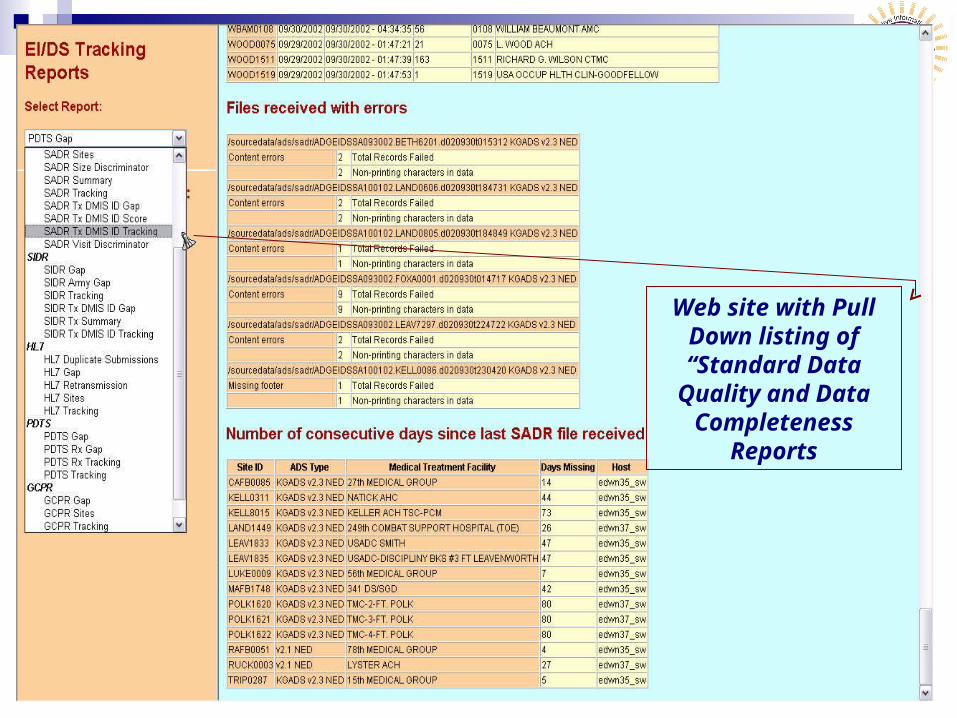
Web site with Pull Down listing of “Standard Data
Quality and Data Completeness
Reports
34
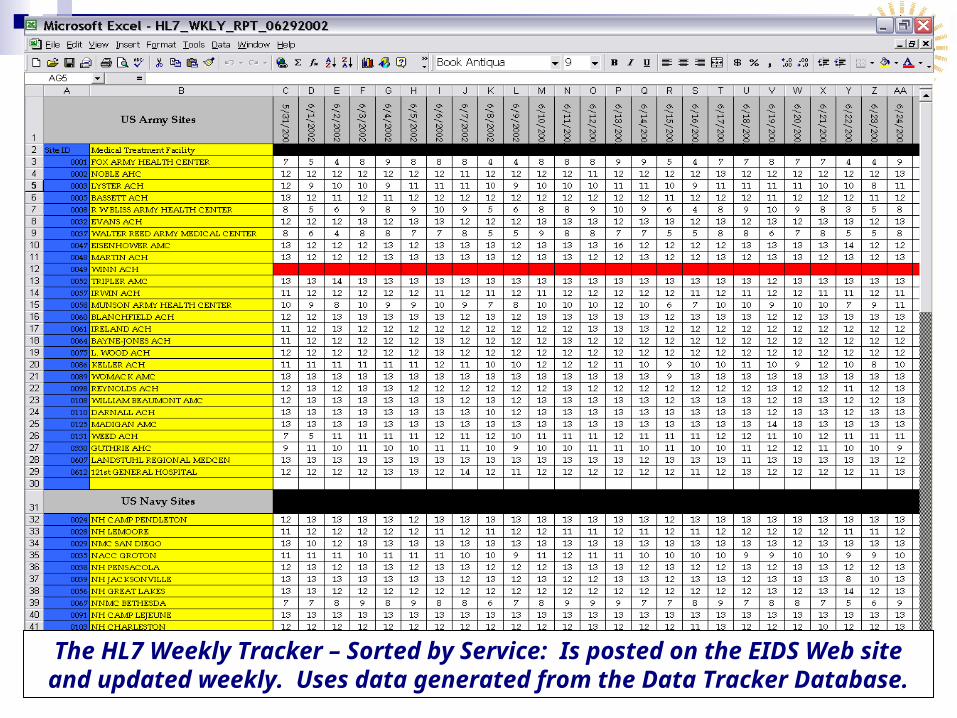
The HL7 Weekly Tracker – Sorted by Service: Is posted on the EIDS Web site and updated weekly. Uses data generated from the Data Tracker Database.
35
Operations Data Quality Tools
These tools and procedures allow EIDS to: Catalogue data files Monitor data completeness Provide metrics to assess Data Quality/Completeness of data received Utilize DQ Software to provide event driven alerting and reporting
“A thousand miles can lead so many ways…Just to know who is driving what a help it would be…we found our driver.”
36
Data Quality through Software
Data Quality Context Data Ingest Scripts (DIS) Operations MDR
37
Data Quality
Accuracy: is it free from error? Completeness: is it whole? Consistency: is it free from contradiction? Integrity: is it secure? Relatability: is it rationally correlated? Relevancy: is it appropriate? Timeliness: is it available when needed? Uniqueness: is it sole? Validity: is it sound?
38
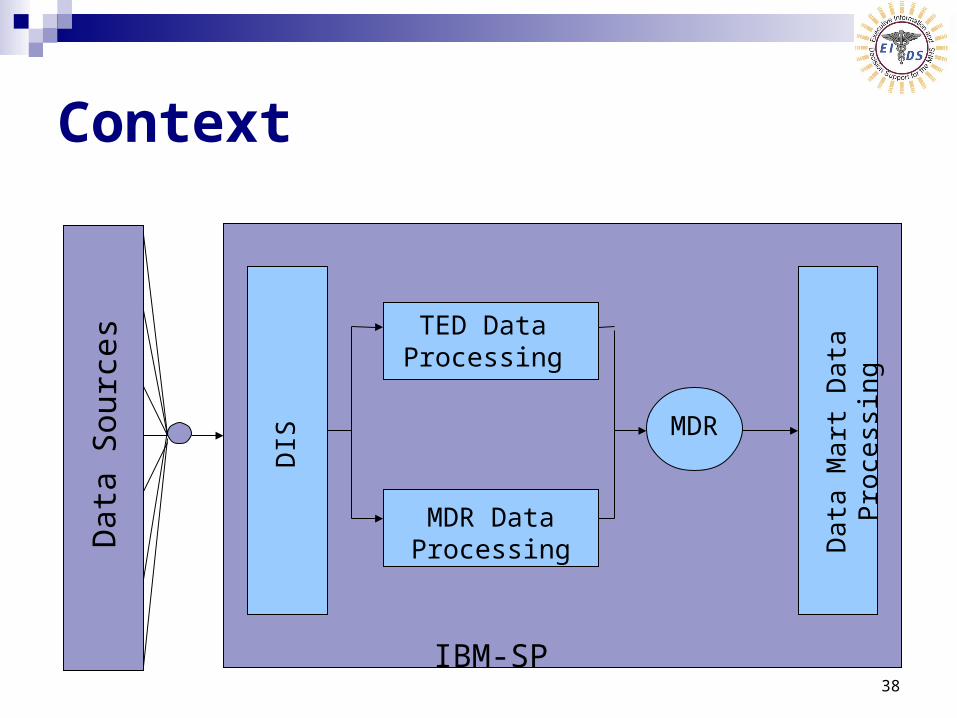
ContextD
ata
Sou
rces
DIS
TED Data Processing
MDR Data Processing
MDR
Da
ta M
art D
ata
Pro
cess
ing
IBM-SP
39
DIS
Feed node scripts Preprocessors
Ancillary Appointment SADR SIDR
40
Feed Node Scripts
Decompress and decrypt Archive Correct location and ownership Copy for other real-time systems Inspect
File structure Content of key fields
Report
41
Preprocessors
Reject bad records Bad format Invalid key fields Currently no major edits
Batch by week or month Maintain record of contributing source files Provide counts for reconciliation
Transfer for MDR processing Fully automated Predefined schedule
42
Accu
racy
Com
ple
ten
ess
Con
sis
ten
cy
Inte
gri
ty
Rela
tab
ilit
y
Rele
van
cy
Tim
elin
ess
Un
iqu
en
ess
Valid
ity
Feed node scripts X X X XPreprocessors X X X X
DIS and Quality
43
Operations
Data management Data tracker Ad hoc scripts
Systems management Query monitor Systems monitoring
44
Data Tracker
Store data on source files and records Identify unique records Track data by date Check data against source metadata Compare multiple data types Create x-bar control charts Provide daily reporting
45
Ad Hoc Scripts
Identify source files sent in clear text Track corrections in source systems
46
Query Monitor
Display query activity Identify performance issues Report access to PHI
47
System Monitoring
Record and display system utilization CPU and memory IP connections Tape drives User activity
48
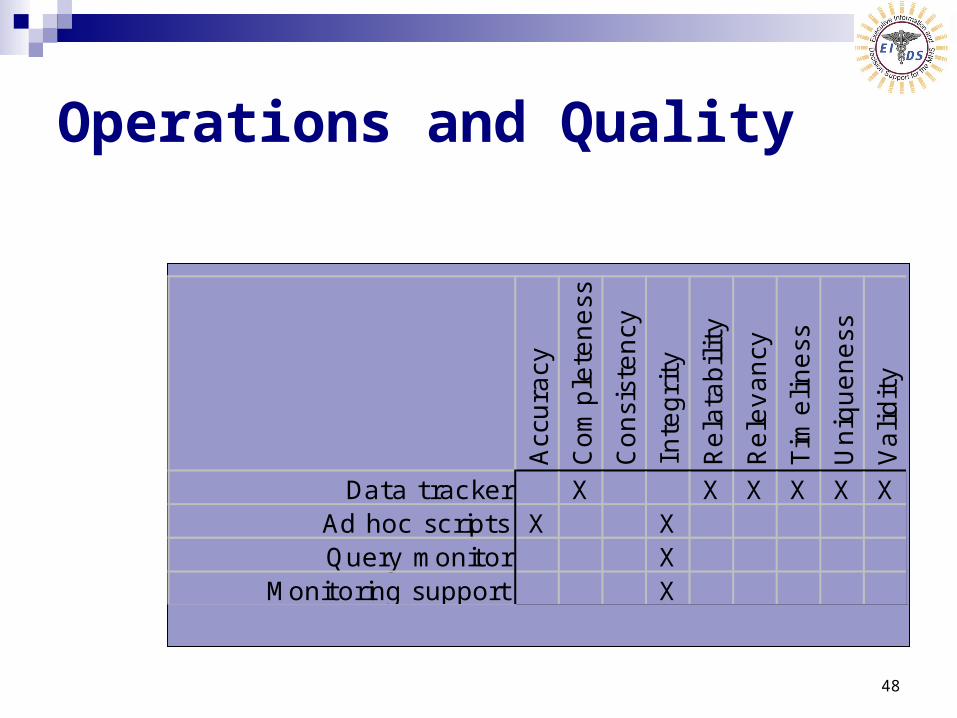
Operations and Quality
Acc
ura
cy
Com
ple
teness
Consi
stency
Inte
gri
ty
Rela
tabilit
y
Rele
vancy
Tim
eliness
Uniq
ueness
Validit
y
Data tracker X X X X X XAd hoc scripts X XQuery monitor X
Monitoring support X
49
MDR
Processors Processing utilities Access control script Metadata catalog
50
Processors
Parse raw records Filter data Merge and de-duplicate with master data Derive standardized values Enhance with reference data
Enrollment Facilities Identity Market areas
Create feeds for data marts
51
Processing Utilities
Apply common functional logic Manage processor jobs
Before execution Calculate disk requirements Check disk and tape resources
After execution Document all inputs, references, and outputs Check logs for errors and PHI Extract counts and frequencies Create metadata
52
Access Control Script
Detect new files Examine and enforce file attributes
Ownership Permissions Access control lists
53
Metadata Catalog
Store MDR metadata Track history of MDR files Audit MDR files Populate missing metadata
Size Records Format
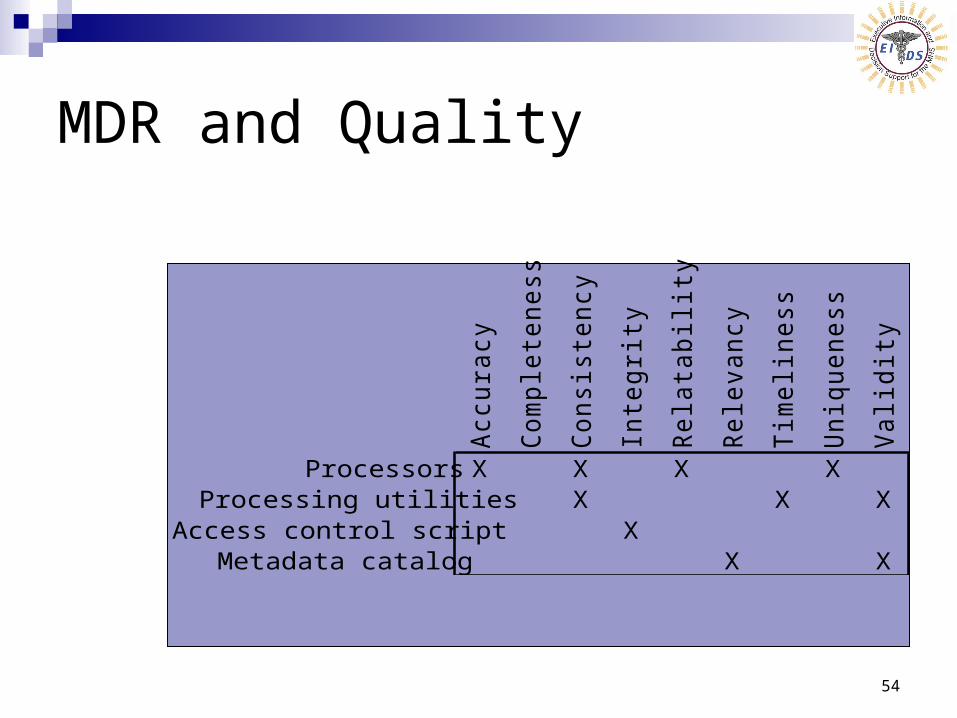
54
MDR and Quality
Accura
cy
Com
ple
teness
Consis
tency
Inte
gri
ty
Rela
tabilit
y
Rele
vancy
Tim
eliness
Uniq
ueness
Validit
y
Processors X X X XProcessing utilities X X X
Access control script XMetadata catalog X X
55
Key to data quality success – partnering with our user community to maximize information sharing
Call the Help Desk 1-800-600-9332 Questions?
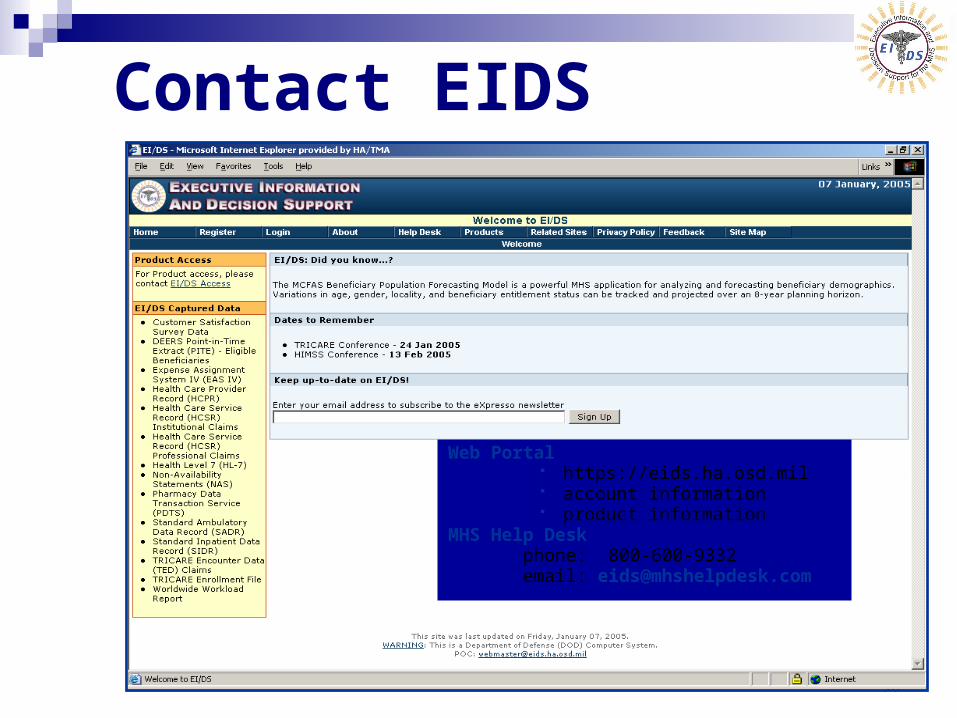
Contact EIDS
56
Web Portal https://eids.ha.osd.mil account information product information
MHS Help Deskphone: 800-600-9332email:
Contact EIDS