Embed Size (px)
Citation preview

HIGHLIGHTED ARTICLE| INVESTIGATION
Triallelic Population Genomics for InferringCorrelated Fitness Effects of Same Site
Nonsynonymous MutationsAaron P. Ragsdale,* Alec J. Coffman,† PingHsun Hsieh,‡ Travis J. Struck,† and Ryan N. Gutenkunst†,1
*Program in Applied Mathematics, †Department of Molecular and Cellular Biology, and ‡Department of Ecology and EvolutionaryBiology, University of Arizona, Tucson, Arizona 85721
ABSTRACT The distribution of mutational effects on fitness is central to evolutionary genetics. Typical univariate distributions, however, cannotmodel the effects of multiple mutations at the same site, so we introduce a model in which mutations at the same site have correlated fitnesseffects. To infer the strength of that correlation, we developed a diffusion approximation to the triallelic frequency spectrum, which we applied todata fromDrosophilamelanogaster. We found amoderate positive correlation between the fitness effects of nonsynonymousmutations at the samecodon, suggesting that both mutation identity and location are important for determining fitness effects in proteins. We validated our approach bycomparing it to biochemical mutational scanning experiments, finding strong quantitative agreement, even between different organisms. We alsofound that the correlation of mutational fitness effects was not affected by protein solvent exposure or structural disorder. Together, our resultssuggest that the correlation of fitness effects at the same site is a previously overlooked yet fundamental property of protein evolution.
KEYWORDS diffusion approximation; distribution of fitness effects; Drosophila melanogaster; nonsynonymous mutations; triallelic sites
MUTATIONScreate genetic variationwithin populations,some of which causes differential fitness among indi-
viduals upon which natural selection operates. The effects ofmutations on fitness range from strongly deleterious tostrongly beneficial, and the distribution of fitness effects(DFE) is key formanyproblems ingenetics, from theevolutionof sex (Barton and Charlesworth 1998) to the architecture ofhuman disease (Di Rienzo 2006). For protein-coding regions,there are generallymany strongly deleterious or lethal mutations,a similar number of moderately deleterious or nearly neutral mu-tations, and a small number of beneficial mutations (Eyre-WalkerandKeightley 2007). TheDFEmaybedetermined experimentallythrough direct measurements of mutation fitness effects in clonalpopulations of viruses, bacteria, or yeast (Wloch et al. 2001; San-juán et al.2004), and recent studieshaveprovidedhigh-resolutionDFEs for single genes (Bank et al. 2014; Firnberg et al.2014) and for beneficial mutations (Levy et al. 2015). The
DFEmay also be inferred from comparative (Nielsen and Yang2003; Tamuri et al. 2012) or population genetic (Williamsonet al. 2005; Eyre-Walker et al. 2006; Keightley and Eyre-Walker 2007; Boyko et al. 2008) data, although these ap-proaches have little power for strongly deleterious mutations.
In the typical population genetic approach for estimatingthe DFE, the population demography is first inferred usinga putatively neutral class of mutations, and the DFE foranother class of mutations is inferred by modeling the distri-bution of allele frequencies expected under a model of de-mography plus selection. Most population genetic inferencehas focused on biallelic loci, for which the ancestral allele anda single mutant (derived) allele are segregating in the pop-ulation. When many individuals are sequenced, however,even single-nucleotide loci are often found to be multiallelic,with three or more segregating alleles. Multiallelic loci posea challenge formodeling selection. To use a typical univariateDFE, onemust assume thatmutations at the same site all haveeither equal fitness effects (so that mutation location com-pletely determines fitness) or independent fitness effects (sothat mutation identity completely determines fitness). Nei-ther of these assumptions is biologically well founded, sug-gesting the need for more sophisticated models of fitness
Copyright © 2016 by the Genetics Society of Americadoi: 10.1534/genetics.115.184812Manuscript received November 13, 2015; accepted for publication March 19, 2016;published Early Online March 28, 2016.Supplemental material is available online at www.genetics.org/lookup/suppl/doi:10.1534/genetics.115.184812/-/DC1.1Corresponding author: University of Arizona, Life Sciences South Bldg., Room 325,1007 E. Lowell St., Tucson, AZ 85271. E-mail: [email protected]
Genetics, Vol. 203, 513–523 May 2016 513

effects. Herewe introduce amodel of correlatedfitness effectsfor mutations at the same site, and we analyze sequence datato infer the strength of that correlation.
Our inference is based on triallelic codons, loci where threemutually nonsynonymous amino acid alleles are segregating inthe population (Figure 1A). Interest in triallelic loci has grownrecently, because such loci, while typically much less numerousthan biallelic loci, are often observed in sequencing studies thatsample tens or hundreds of individuals within single popula-tions. For example, Hodgkinson and Eyre-Walker (2010) foundin humans a roughly twofold excess of triallelic sites over theexpectation under neutral conditions and random distributionof mutations. This led them to suggest an alternate mutationalmechanism that could simultaneously generate two uniquemutations, although recent population growth and substructurecan account for the distribution of observed triallelic variation(Jenkins et al. 2014). Recently, Jenkins, Mueller, and Song(Jenkins and Song 2011; Jenkins et al. 2014) developed a co-alescent method to calculate the expected triallelic frequencyspectrum under arbitrary single-population demography. Theyshowed that triallelic frequencies are sensitive to demographichistory (Jenkins and Song 2011; Jenkins et al. 2014), but theirmethod cannot model selection.
In this study, we developed a numerical diffusion simula-tion of expected triallelic allele frequencies for single popu-lationswitharbitrarydemographyandselectionatoneorbothderived alleles. We coupled this simulation to a DFE thatmodels the correlation between fitness effects of the twoderived alleles. We applied this approach to infer the corre-lation coefficient of fitness effects from whole-genomeDrosophila melanogaster data, inferring a moderate positivecorrelation between fitness effects of mutually nonsynony-mousmutations in the same codon. To validate our inference,we compared this approach with direct biochemical experi-ments, finding strong agreement. Finally, we applied our ap-proach to biologically relevant subsets of nonsynonymousmutations to assess how the fitness effects correlation variesamong classes of mutations.
Theory and Methods
Herewe describe themodel for triallelic loci and howwe solvethe triallelic diffusion equation to obtain the expected sampletriallelic frequency spectrum under arbitrary demography andselection.Wealso describe how to obtain the sample frequencyspectrumunder an arbitrary univariate or bivariate DFE,whichwe used in our inference of the correlation coefficient forselection strength at triallelic loci. Finally, we compared ourresults to correlation coefficients estimated from mutationalscanning experiment data, discussed here as well.
Model for triallelic loci
The diffusion approximation we used is based on a triallelicextension to the standard Wright–Fisher (WF) model for al-lele frequency dynamics, which assumes nonoverlappinggenerations and random mating. The two derived alleles
have selection coefficients, sx and sy; so their fitnesses relativeto the ancestral allele are 1þ sx and 1þ sy: If the two derivedalleles have frequencies ðit; jtÞ in generation t in a diploidpopulation of size N, then their frequencies in generationt þ 1 are sampled from a trinomial distribution, such thatthe probability of sampling ði; jÞ is
Pði; jjit; jtÞ ¼�2Ni; j
�pii p
jj ð12pi2pjÞ2N2i2j; (1)
where
pi ¼ itð1þ sxÞitð1þ sxÞ þ jtð1þ syÞ þ ð2N2 it 2 jtÞ;
pj ¼jtð1þ syÞ
itð1þ sxÞ þ jtð1þ syÞ þ ð2N2 it 2 jtÞ;
and�2Ni; j
�is the trinomial coefficient ð2NÞ!=�i! j!ð2N2 i2 jÞ!�:
From here on, we focus on relative allele frequencies x ¼ i=2Nand y ¼ j=2N:
Most applications of the biallelic WFmodel assume infinitesites, so eachnewmutation is unique, andnewmutations enterthe population at a rate proportional to ubi ¼ 4Nam:Here ubi isthe population-scaled mutation rate, Na is the ancestral effec-tive population size, andm is the per-generationmutation rate.Mutations begin at frequency 1=2N and are assumed to evolveindependently. Given these assumptions, the density functionf ðxÞ for derived allele frequencies in a population can be ap-proximated by diffusion theory (Kimura 1964), such that theexpected total number of alleles with frequency between x0and x1 is
R x1x0ðubi=2Þf ðxÞ dx; a key result from Poisson random
field theory (Sawyer and Hartl 1992). The expected sampleallele frequency spectrum F with n samples is then
FðiÞ ¼Z 1
0
ubi2
fðxÞ�ni
�xið12xÞn2i dx; (2)
where�ni
�is the binomial coefficient. The likelihood of an
observed allele frequency spectrum under this model is thena product of Poisson likelihoods for each entry in the spec-trum (Sawyer and Hartl 1992).
Whereas new biallelic mutations begin at frequency 1=2N;triallelic loci are created when a novel mutation occurs ata locus that is already biallelic. The new derived allele ini-tially has frequency 1=2N; and the existing derived allele hasa frequency x 2 ð0; 1Þ drawn from the population distributionof biallelic frequencies fðxÞ in that generation. The net rate atwhich triallelic loci arise is thus
2Nmtriubi2
f ðxÞ ¼ utri2
ubi2
f ðxÞ; (3)
where mtri is the rate for mutations that hit existing biallelicsites and produce a third allele. Triallelic sites then evolve
514 A. P. Ragsdale et al.
under the three-locus WF model, and we denote the densityfunction for frequencies of triallelic loci asfðx; yÞ: The triallelicfrequency spectrum summarizes sequence data from a sam-ple of individuals by storing the counts of triallelic loci witheach set of observed derived allele frequencies (Jenkinset al. 2014) (Figure 1, E and F). The expected triallelic fre-quency spectrum T with n samples is proportional to theintegral of the density function f against the trinomialsampling distribution:
Tði; jÞ}Z 1
0
Z 12y
0fðx; yÞ
�ni; j
�x iy jð12x2yÞn2i2j dx dy:
(4)
Because the net triallelic mutation rate mtri is sensitive tomutation rate heterogeneity, in our triallelic analyses we fo-cused on the normalized triallelic frequency spectrum, whichdoes not depend on the overall rate of creation. Similarly,because the order in which the two derived alleles aroseis often unknown, we considered only counts of majorand minor derived alleles, which have respectively higheror lower sample frequencies (Figure 1). That is, for givenmajor and minor derived allele frequencies i and j, withj, i; we collapsed the Tði; jÞ and Tð j; iÞ counts together intothe Tði; jÞ bin. If in a sample we observe counts of indepen-dent triallelic frequencies D ¼ Dði; jÞ; Poisson Random Fieldtheory shows that the data Dði; jÞ are Poisson distributed withmean Tði; jÞ; enabling likelihood calculations.
Diffusion approximation to the triallelic frequencyspectrum with selection
To obtain the expected sample frequency spectrum for a givenmodel of selection and demography, we numerically solved
the corresponding diffusion equation. First described byKimura (1955, 1956), the triallelic diffusion equation modelsthe evolution of the density function fðx; yÞ for the expectednumber of loci in the population with derived allele frequen-cies ðx; yÞ; such that x; y 2 ð0; 1Þ and x þ y, 1 (Figure 1B):
@f
@t¼ 12
@ 2
@x 2
�xð12 xÞ
nf
�þ 12
@ 2
@y2
�yð12 yÞ
nf
�
2@ 2
@x@y
�xynf
�2 ~gx
@
@x�xð12 xÞf�2 ~gy
@
@y�yð12 yÞf�:
(5)
Time t is measured is units of 2Na generations, where Na isthe ancestral effective population size. The spatial second-derivative terms account for genetic drift, which is scaledby the relative population size nðtÞ ¼ NðtÞ=Na; and themixed derivative term accounts for the covariance in allelefrequency changes. The population-scaled selection coeffi-cient is g ¼ 2Nas;where s is the relative fitness of the derivedvs. ancestral allele. Here that selection coefficient must beadjusted to ~g to account for competition between the twosegregating derived alleles, dependent on their allele fre-quencies. For example, if their selection coefficients areroughly equal, they will be effectively neutral when at highfrequency. In general,
~gx ¼ gx12 x2 y12 x
þ ðgx 2gyÞy
12 x; (6)
with a similar expression for ~gy:
Like the biallelic diffusion method @a@i; Equation 5 doesnot account for recurrent mutation, which would tend to in-crease derived allele frequencies. Recurrent mutation couldbe accounted for in the first-derivative terms, but at the cost
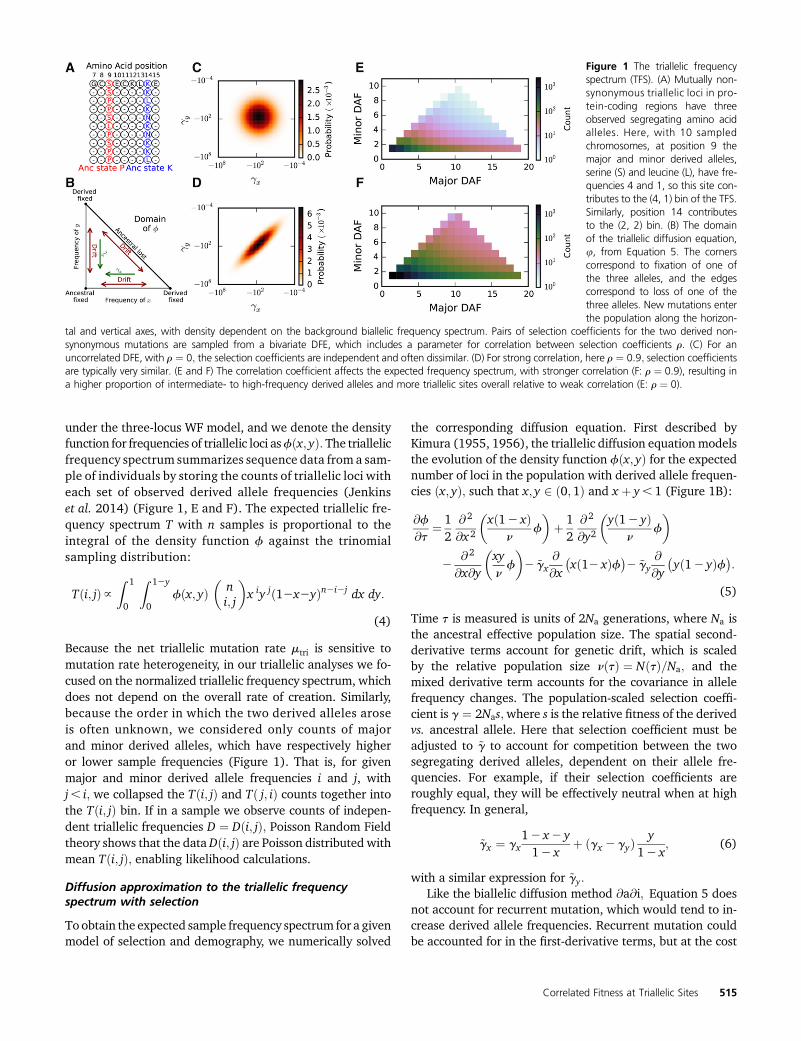
Figure 1 The triallelic frequencyspectrum (TFS). (A) Mutually non-synonymous triallelic loci in pro-tein-coding regions have threeobserved segregating amino acidalleles. Here, with 10 sampledchromosomes, at position 9 themajor and minor derived alleles,serine (S) and leucine (L), have fre-quencies 4 and 1, so this site con-tributes to the (4, 1) bin of the TFS.Similarly, position 14 contributesto the (2, 2) bin. (B) The domainof the triallelic diffusion equation,u, from Equation 5. The cornerscorrespond to fixation of one ofthe three alleles, and the edgescorrespond to loss of one of thethree alleles. New mutations enterthe population along the horizon-
tal and vertical axes, with density dependent on the background biallelic frequency spectrum. Pairs of selection coefficients for the two derived non-synonymous mutations are sampled from a bivariate DFE, which includes a parameter for correlation between selection coefficients r. (C) For anuncorrelated DFE, with r ¼ 0; the selection coefficients are independent and often dissimilar. (D) For strong correlation, here r ¼ 0:9; selection coefficientsare typically very similar. (E and F) The correlation coefficient affects the expected frequency spectrum, with stronger correlation (F: r ¼ 0:9), resulting ina higher proportion of intermediate- to high-frequency derived alleles and more triallelic sites overall relative to weak correlation (E: r ¼ 0).
Correlated Fitness at Triallelic Sites 515

of additional model complexity. If it is common, neglectingrecurrent mutation can bias inferences of mutation rate, pop-ulation size, and selection (Desai and Plotkin 2008; Mathewet al. 2013). Applying our present theory thus requires thatthe mutation rate be high enough to create a substantialnumber of triallelic sites for inference, but not so high thata large fraction of biallelic or triallelic sites are affected byrecurrent mutation. For most eukaryotes, including humansandDrosophila, mutation rates are low enough that recurrentmutation is negligible in most applications (Desai and Plotkin2008).
Someanalytic results areknownfor triallelicdiffusion(Tierand Keller 1978; Tier 1979; Spencer and Barakat 1992), butwe solved Equation 5 numerically.We used a finite-differencemethod similar to that in @a@i (Gutenkunst et al. 2009). Tointegrate the diffusion equation forward in time, we usedoperator splitting to separately apply the nonmixed andmixed derivative terms each time step (Supplemental Mate-rial, File S1). We integrated the nonmixed terms, using a con-servative alternating direction implicit (ADI) finite differencescheme (Chang and Cooper 1970). We integrated the mixedterm, using a standard explicit scheme for mixed derivatives.We used uniform grids in x and ywith equal grid spacingD; sothat grid points lie directly on the diagonal x þ y ¼ 1 bound-ary of the domain, which readily allowed the diagonalboundary to be absorbing. Although these integrationschemes worked well in the interior of the domain, applica-tion at the diagonal boundary led to an excess of densitybeing lost (File S1 and Figure S1). To avoid this excess loss,we did not apply the ADI andmixed derivative schemes at theclosest grid points to the diagonal boundary. Instead, at eachtime step we calculated the amount of density at each gridpoint that would fix along the diagonal boundary, and wedirectly removed that amount from the numerical densityfunction and added it to the boundary.
To inject density into f for new triallelic loci, at each timestep we added density to the first interior rows of grid pointsbased on the expected background biallelic frequencyf ðxÞ: For example, we added to the row of grid pointsx ¼ D; 2D; . . . 12D; y ¼ D with weight for point ðx;DÞ pro-portional to the biallelic population allele density fðxÞ at fre-quency x. We directly coupled with @a@i to track f ðxÞ: Toobtain the expected sample frequency spectrum T from thepopulation frequency spectrum f, we numerically integratedagainst the trinomial distribution with sample size n, usingEquation 4. Our code implementing these methods isintegrated into @a@i; available at https://bitbucket.org/gutenkunstlab/dadi.
Calculating frequency spectra under a DFE
Given a DFE, the expected sample frequency spectrum can beobtainedby integrating over the expected frequency spectrumfor each selection coefficient, weighted by the DFE. Forbiallelic sites, theDFE is a univariate distribution. For triallelicsites, the DFE is a two-dimensional joint distribution, becausethere are two derived alleles. Moreover, the two marginal
distributions are identical, because we assume no knowledgeof which allele arose first.
For our primary analysis, we used a lognormal model forthe deleterious triallelic DFE (Figure 1, C and D), plus a pointmass of positive selection. The lognormal distribution readilygeneralizes to an arbitrary number of dimensions, and thebivariate lognormal distribution includes a correlation coef-ficient r that characterizes the correlation between selectioncoefficients. If r ¼ 0; the selection coefficients of the two de-rived alleles at a single triallelic locus are independent,whereas if r ¼ 1; they are equal. For a fixed marginal DFE,as the correlation coefficient r increases, more segregatingtriallelic loci are expected, particularly at moderate and highderived allele frequencies (Figure 1, C–F). We quantified therelative importance of identity and location for protein mu-tation fitness effects through r; low correlation suggests thatidentity is more important, whereas high correlation suggeststhat location within the protein is more important.
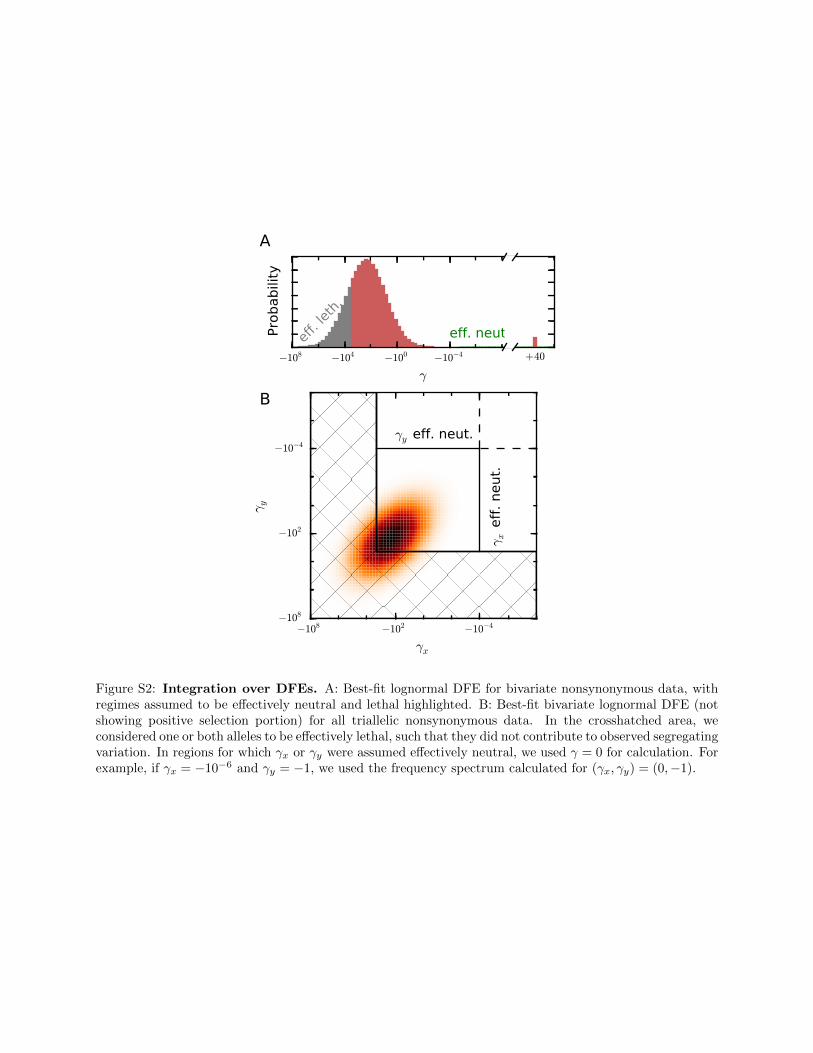
To numerically integrate over the univariate DFE, we useda logarithmically spaced grid with 2000 grid points rangingfrom g ¼ 2 2000 to 21024; along with g ¼ 0 and a pointmass of positive selection gþ . 0: Biallelic spectra werecached for each g# 0; resulting in 2001 cached spectra. Weassumed that alleles with g, 2 2000 were effectively lethaland did not contribute to the sample frequency spectrum. Wealso assumed that alleles with2104 ,g, 0 were effectivelyneutral, and we used the cached spectrum for g ¼ 0 for con-tributions from this range of the DFE (Figure S2A).
To integrate over the bivariate DFE we used a logarith-mically spaced grid with 50 grid points ranging fromg ¼ 2 2000 to 21024; along with g ¼ 0 and gþ . 0; deter-mined by the univariate DFE fit. We cached spectra for eachpossible pair ðgx; gyÞ; yielding 522 cached spectra. A pair ofselection coefficients ðgx; gyÞ could fall into four quadrants,depending on the sign of gx and gy: The overall frequencyspectrum was calculated by summing over the weighted fre-quency spectra for each quadrant based on the DFE parame-ters pþ and r. The weights were p2þ þ r pþð12 pþÞ forboth gx; gy . 0; ð12 rÞpþð12 pþÞ for one selectioncoefficient positive and the other negative, andð12pþÞ2 þ rð12 pþÞpþ for both gx; gy , 0: These weightswere found by taking the distribution of two point masses(one for positive selection, pþ; and one for negative selection,12 pþ) and extending it to a bivariate distribution of pointmasses with correlation coefficient r (File S1). To integrateover the continuous distributions with one or both of theselection coefficients negative, we used the trapezoid rule.We approximated g 2 ð21024; 0Þ as effectively neutral andg, 22000 as effectively lethal (Figure S2B).
Genomic data
We extracted SNPs from phase 3 of theDrosophila PopulationGenomics Project (DPGP3) population of fruit flies from theDrosophila Genome Nexus Data (Lack et al. 2015). The datawe used consist of 197 sequenced genomes from a Zambianpopulation obtained through high-coverage haploid embryo
516 A. P. Ragsdale et al.

sequencing. This population has high genetic diversity, and itdid not experience the out-of-Africa bottleneck or NewWorldadmixture that other D. melanogaster populations have expe-rienced (Lack et al. 2015). We used Annovar (Wang et al.2010) to determine the transcript and codon position of eachcoding SNP. The ancestral state of each codon was deter-mined using the aligned sequences of D. melanogaster (April2006, dm3) andD. simulans (droSim1) downloaded from theUniversity of California, Santa Cruz genome database, byassuming that the D. simulans allele was ancestral. We ex-cluded loci with no aligned D. simulans sequence. We down-loaded the reference transcript sequences from EnsemblBiomart (Flicek et al. 2014) and used the ancestral statesdetermined by the droSim1 alignment to determine the an-cestral codon state.
Inferring the selection correlation coefficient
In our application to D. melanogaster, we used biallelic syn-onymous data to infer the single-population demographichistory and then used nonsynonymous data to infer theparameters of the DFE. Using the unfolded synonymousallele frequency spectrum, we fitted a neutral three-epochdemographic model. This model has two instantaneoussize changes, at times t1 and t2 in the past, with constant pop-ulation sizes, n1 and n2; relative to the ancestral population size.Wealso included a parameterpmisid to account for ancestral statemisidentification, which creates an excess of high-frequencyderived alleles (Baudry and Depaulis 2003). Specifically,we compared the data not with the expected true unfoldedfrequency spectrum Ftrue under the demographic model, butrather with the expected observed unfolded frequency Fobs;such that FobsðiÞ ¼ ð12 pmisidÞFtrueðiÞ þ pmisidFtrueðn2 iÞ;where n is the sample size. We chose to include misidentifi-cation in our model rather than adjusting the data spectra(Hernandez et al. 2007), because adjusting the data leads toviolations of the Poisson random field assumption, most obvi-ously when the adjustment leads to negative entries in the dataspectrum. The population-scaled mutation rate usyn was an im-plicit free parameter. We used the built-in optimization routinesin @a@i (Gutenkunst et al. 2009) to fit themodel to the data.Wefixed this demographic model for all future inferences.
The unfolded biallelic nonsynonymous allele frequencyspectrum was used to infer the marginal DFE. As describedabove,weused a lognormal distribution for negative selectioncombinedwith a point mass of positive selection. This yieldeda total of four parameters, m and s for the lognormal portionand gþ and proportion pþ for the point mass. As in the fits fordemography using synonymous data, we also includeda parameter to model ancestral state misidentification. Inthis fit, the population-scaled mutation rate was fixed tounon ¼ 2:53 usyn; and we again used @a@i’s optimizationroutines to fit the DFE to the data.
Finally, we used triallelic data with two mutually non-synonymous derived codons to infer the correlation coeffi-cient r. We fixed the demography to that inferred from thebiallelic synonymous data, and we fixed the DFE parameters
m, s, pþ; and gþ to the values inferred from the biallelicnonsynonymous data. This left the correlation coefficientr as the only free parameter of the bivariate DFE, andwe also included a free parameter to account for ancestralmisidentification. Assuming that the two observedderived alleles were equally likely to be the true ancestralallele, we calculated the expected observed triallelicspectrum Tobs from the expected true spectrum Ttrue
by Tobsði; jÞ ¼ ð12 pmisidÞTtrueði; jÞ þ 12pmisidTtrueðn2 i2 j; jÞþ
12pmisidTtrueði; n2 i2 jÞ: We also left the overall population-
scaled mutation rate for triallelic loci as an implicit free pa-rameter, so our fit considered only the distribution of trialleliccodons among frequency classes, not the overall numberof such codons. We did this because the overall number oftriallelic codons can be strongly affected by mutation rateheterogeneity, and imperfect modeling of that heterogeneitycould bias our results.
We estimated model parameters by maximum compositelikelihood. Following the Poisson random field framework,likelihoods LðDjQÞ of the data D given the model parametersQ were calculated by assuming that each entry in the ob-served triallelic frequency spectrum Di;j was an independentPoisson random variable with mean Ti;j (Sawyer and Hartl1992), where T is the expected triallelic frequency spectrumgenerated under Q :
LðQjDÞ ¼Yi; j
e2Ti; jT Di; j
i; j
Di; j!: (7)
Because our SNP data are not actually independent, L is notthe true likelihood, but rather a composite likelihood. To ac-count for this, we calculated parameter uncertainties for eachmodel fit, using the Godambe information matrix (Coffmanet al. 2016), which adjusts the composite-likelihood statisticto account for the effects of linkage. To do so, we generated1000 bootstrap data sets by dividing the D. melanogasterautosomal genome into 1000 regions of equal length andresampling among these regions.
Tests on simulated data
To generate simulated data for tests of statistical power, wefirst calculated the expected frequency spectrum under eachmodel considered, usingourdiffusionmethod. Togenerate anobserved frequency spectrum with exactly n entries, we gen-erated nmultinomial samples of frequencies, weighted by theexpected frequency spectrum. To generate an observed fre-quency spectrum with a given mutation rate u, we scaled theexpected frequency spectrum by u, treated the bin weights asPoisson random variables, and sampled independently foreach bin.
Mutational scanning data
For comparison with our population genetic inference, weconsidered data from three mutational scanning studies
Correlated Fitness at Triallelic Sites 517

(Roscoe et al. 2013; Firnberg et al. 2014; Starita et al. 2015).Each study assayed a different protein from a different organ-ism, using a different proxy for fitness. In all three experi-ments, the distribution of fitnesses was bimodal, with peaksof moderately and strongly deleterious mutations, althoughthe relative sizes of these peaks differed markedly betweenexperiments (Figure S3, A–C). To calculate the fitness corre-lation coefficient, we sampled a pair of mutually nonsynon-ymous mutations from each site in the protein (excludingmutations without reported fitness) and calculated the Pear-son correlation of those fitnesses. The confidence intervals inTable 1 are 2.5% and 97.5% quantiles from 10,000 repeti-tions of this sampling. To visualize the correlations, we cal-culated the proportion of mutually nonsynonymousmutationpairs within each possible bin of joint fitness effects (Figure4B and Figure S3, D–I). Because our population-genetic anal-ysis is not sensitive to strongly deleterious mutations, wefocused our analysis on moderately deleterious mutations(shaded regions in Figure S3, A–C, joint distributions in Fig-ure S3, D–F). For details on each data set, see File S1.
Data availability
The authors state that all data necessary for confirming theconclusions presented in the article are represented fullywithin the article.
Results and Discussion
We first validated our diffusion approach to calculating theexpected triallelic frequency spectrum through comparisonswith coalescent simulations including demography (FigureS4) and Wright–Fisher simulations including selection (Fig-ure S5). We then applied our method to genomic data fromD. melanogaster to infer the strength of correlation of selec-tion coefficients for nonsynonymous mutations that occur atthe same codon in protein-coding regions. We then used sim-ulations to characterize the performance of our approachwith varying amounts of data and possible model misspecifi-cation. Finally, we compared our results to inferences madefrom deep mutation scanning experiments and refined ourinferences to consider biologically relevant subsets of thedata.
Correlation of selection strengths for nonsynonymousmutations at the same site
To estimate the correlation between fitness effects of aminoacid-alteringmutations,we used197ZambianD.melanogasterwhole-genome sequences from the DPGP3 (Lack et al.2015). We chose this population because it has high ge-netic diversity (and thus many triallelic sites) and a demo-graphic history without admixture from non-sub-Saharanpopulations (Lack et al. 2015), which allowed us to model thepopulation’s demographic history using a single-populationmodel. Recurrent mutation is expected to be rare in this pop-ulation, because only � 5% of sites are polymorphic, andof the nonsynonymous sites, only � 4% are triallelic. As
detailed in Theory and Methods, we first inferred demographichistory using biallelic synonymous sites. We then inferred themarginal DFE for newly arising nonsynonymous mutations,using that demographic model and the biallelic nonsynony-mous data. Finally, we inferred the fitness effects correlationcoefficient, using our inferred demography and marginal DFEand the mutually nonsynonymous triallelic loci in the data.For all model fits, we included a parameter to account for an-cestral state misidentification, which creates an excess of high-frequency derived alleles (Baudry and Depaulis 2003).
We used @a@i (Gutenkunst et al. 2009) to fit a three-epochpopulation size model to the unfolded biallelic synonymousfrequency spectrum (Figure 2, A and B, and Table S1). Wefixed this demographic model for all future inferences, andwe fitted a univariate DFE to the biallelic nonsynonymousdata. For negatively selected sites (g, 0), we assumed a log-normal distribution of selection coefficients with mean andvariance parameters m and s, which has been previouslyshown to be a good approximation for the biallelic DFE forD. melanogaster (Kousathanas and Keightley 2013). Our DFEalso included a point mass modeling a proportion pþ of pos-itively selected sites with scaled selection coefficient gþ: Ourinferred biallelic DFE (Figure 2C and Table S1) fits the datawell (Figure 2A), with just under 1% of new mutationsinferred to be beneficial (inferred gþ ¼ 39:9). When fittingthe DFE to the nonsynonymous data, the parameters for thelognormal portion (negatively selected sites) were tightly con-strained, but pþ and gþ were confounded and inversely cor-related, as found in other studies (Sella et al. 2009; Schneideret al. 2011). Our inferred proportions of mutations in variousselective regimes agreed well with prior work (Table S2).
We worked at the codon level to assess the correlation inselection coefficients for nonsynonymous mutations, so a tri-allelic locus could arise from two mutations at the samenucleotide or at different nucleotides in the same codon.Weextendedour inferredone-dimensionalDFE to twodimen-sions, fixing the parameters m;s; gþ; and pþ; so that the cor-relation coefficient r was the only free parameter of thebivariate lognormal distribution, along with a single param-eter for ancestral misidentification. Fitting to 10,471 mutu-ally nonsynonymous triallelic loci (Figure 3A), we inferredr ¼ 0:51 (Figure 3B, Table 1, and Table S1). Selection coef-ficients for nonsynonymous mutations at the same codon arethus somewhat but not completely correlated, so locationand identity play roughly equal roles in determining muta-tion fitness effects.
Effects of data quality and model misspecification
Statistical power to infer the selection correlation coefficientvaries with the number of observed triallelic loci and thenumber of sampled individuals. Inference may also be biasedby distortions in the observed frequency spectrum due tosequencing error or by misspecification of the demographicor selection model. To assess the sensitivity of our analysis tosuch effects, we considered both fits to simulated data andalternative fits to the Drosophila data.
518 A. P. Ragsdale et al.

There were 10,471 mutually nonsynonymous trialleliccodon polymorphisms in the 197 sampled genomes of theZambian fruit fly data, which yielded a tight confidence in-terval for the selection correlation coefficient (Table 1). Totest the power of our inference for different true values of theunderlying correlation coefficient and smaller numbers ofsampled individuals or triallelic loci, we fitted simulated datasets, assuming the exact demography andmarginal DFEwereknown. As expected, inferences of the correlation coefficientwere unbiased, and power increased with increasing numberof observed triallelic loci (Figure S6, A–E). For a constantnumber of observed triallelic loci, the precision of the infer-ence was insensitive to the number of sampled individuals(Figure S6F), suggesting that capturing rare triallelic variantsis not crucial. To infer the correlation coefficient to a similarprecision to that in the mutational-scanning studies, .2000triallelic sites were needed, suggesting that our inference canbe carried out only for populations with high genetic diver-sity. For example, in the 1000 Genomes Project Phase 3 hu-man data (1000 Genomes Project Consortium 2015), amongthe 216 genomes from the Yoruba population, there wereonly 658 mutually nonsynonymous triallelic codons forwhich we were able to determine the ancestral state. Basedon our fits to simulated data, we would not have power toaccurately infer the correlation coefficient from these data.
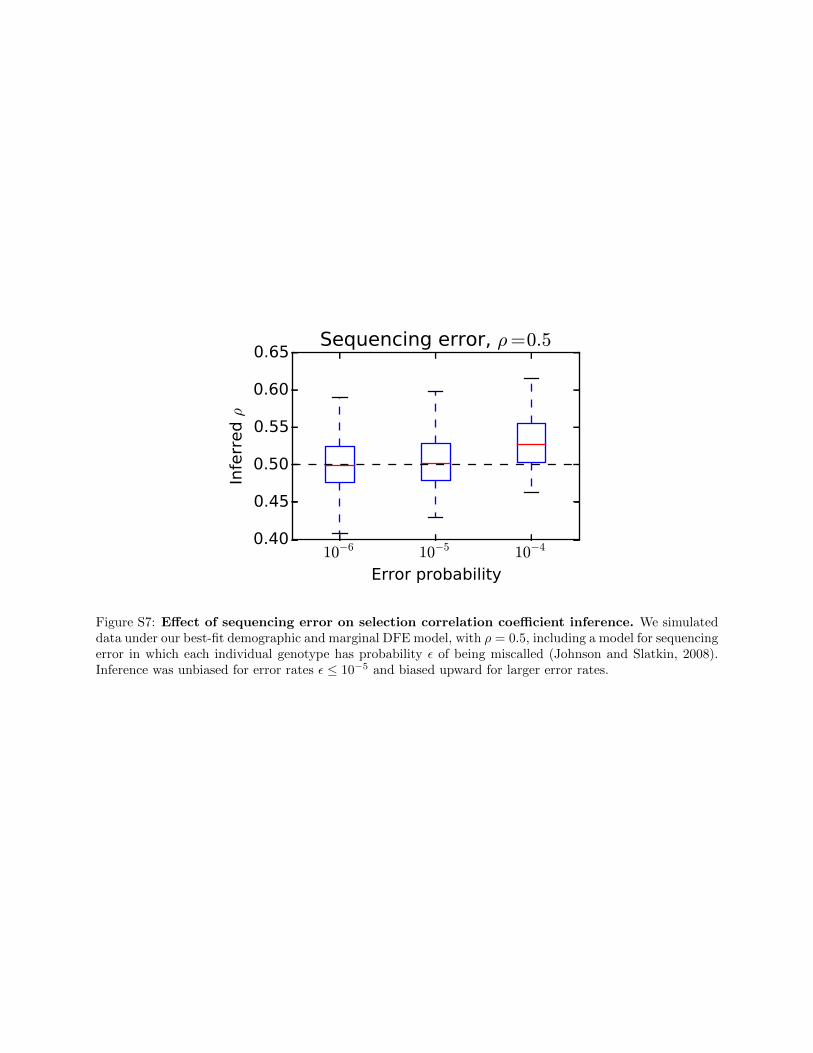
Errors in sequencing may distort the observed site fre-quency spectrum, particularly at low frequencies. To testthe sensitivity of our approach to sequencing error, we sim-ulated data under our three-epoch demographic model andDFE, plusanadditionalmodel for sequencingerror. Themodelassumed that each sequenced base had probability e � 1 tobe incorrectly identified; that is, with probability e, for eachpolymorphic site, an individual’s true derived base was calledas ancestral, or an individual’s true ancestral base was calledas derived (Johnson and Slatkin 2008). We then refittedparameters for all of our models to both the biallelic andtriallelic data simulated under this model. We found thathigh error rates (e$ 1024) biased our inference of the selec-tion correlation coefficient upward (Figure S7). This is likelybecause, under this model, sequencing error reduces the pro-portion of alleles observed at low vs. moderate and high fre-quencies, and higher values of r similarly reduce the
proportion of alleles expected at low frequency vs. high andmoderate frequencies (Figure 1, C–F).
Sequencing errors may bias inference, but the DPGP3 D.melanogaster data we used are high-coverage (30–503 ) hap-loid sequences (Lack et al. 2015), so we expect sequencingerror was negligible in our inference. In particular, Lack et al.(2015) report error rates on the order 1025 per site, below the1024 error rate that caused bias in our simulation study.
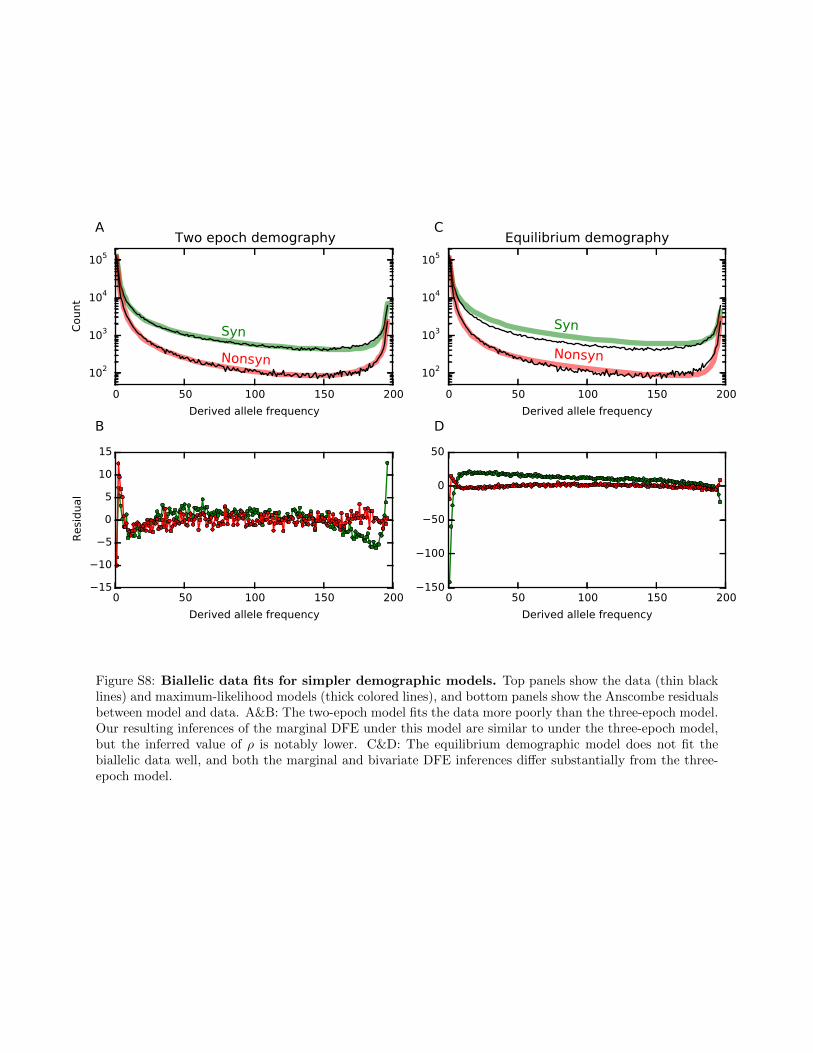
To assess the sensitivity of our inferences to the demo-graphic model, we fitted two additional models to theDrosophila data, both simpler than the three-epoch model wefocused on. For both models, we fitted the demographicparameters to the synonymous biallelic data, fitted the mar-ginal DFE to the nonsynonymous biallelic data, and finallyinferred r from the mutually nonsynonymous triallelic data,all as described previously. We first considered a two-epochdemographic model, consisting of a single instantaneouspopulation size change at some time in the past. Using thismodel resulted in a noticeably poorer fit to the biallelic andtriallelic data (Figure S8A and Table S3). The inferred log-normal portion of the marginal DFE was similar to that fromthe three-epoch model. Under the two-epoch model, how-ever, we inferred more and stronger positive selection, likelybecause this compensates for the underestimation of high-frequency alleles in the two-epoch model (Figure S8B). Thisin turn caused the inferred correlation coefficient to be sub-stantially lower (Table S3), likely because a lower correlationcoefficient reduces the number of moderate- and high-frequency triallelic loci (Figure 1, C–F), partially compensat-ing for the effect of increased positive selection. We thenconsidered an equilibrium demography, assuming no popu-lation size changes. This model fitted the data very poorly(Figure S8A and Table S3), and the marginal DFE and thecorrelation coefficient we inferred were skewed toward neu-trality and a lower r (Table S3), because these skews gener-ate more rare variants to account for the deficit produced bythis poor demographic model. Together, these analyses sug-gest that inference of the triallelic DFE is sensitive to misspe-cification of the demographic model.
In our primary Drosophila analysis, we assumed that theDFE followed a lognormal distribution, because such a distri-bution fits the biallelic data well and easily generalizes to two
Table 1 Fitness effect correlation coefficients for nonsynonymous mutations at the same codon, inferred from population genomic dataand biochemical experiments
Approach Data set r 95% C.I.
Population genomic data D. melanogaster all 0.51 0.45–0.57Biochemical experiments E. coli TEM-1 b-lactamase (Firnberg et al. 2014) 0.41 0.34–0.50
Yeast ubiquitin (Roscoe et al. 2013) 0.34 0.20–0.56Human BRCA1 (Starita et al. 2015) 0.32 0.16–0.48
Population genomic data 20% most similar amino acids 0.72 0.58–0.8520% most dissimilar amino acids 0.24 0.15–0.3220% highest solvent accessibility 0.54 0.43–0.6520% lowest solvent accessibility 0.50 0.37–0.63Disordered residues 0.54 0.45–0.62Ordered residues 0.45 0.35–0.55
Correlated Fitness at Triallelic Sites 519

or more dimensions. Other analyses of the univariate DFEhave, however, used other parametric distributions (Eyre-Walkeret al. 2006; Keightley and Eyre-Walker 2007; Boyko et al.2008; Kousathanas and Keightley 2013), particularly thegamma distribution (Eyre-Walker et al. 2006; Keightley andEyre-Walker 2007). When we fitted a DFE with a gamma dis-tribution for negatively selected sites and a point mass of pos-itive selection to the bivariate data, we found a poorer fit thanthat of the lognormal distribution (Table S4).We neverthelessfitted a bivariate extension of the gamma distribution to thetriallelic data. A number of bivariate gamma distributions havebeen defined (reviewed by Yue et al. 2001). We chose one thatmaintains the univariate gamma distribution when marginal-ized (Kibble 1941; File S1).Whenfitted to theDrosophiladata,the bivariate gamma distribution yielded r ¼ 0:975; witha moderately worse likelihood than that of the bivariate log-normal (Table S4). Note, however, that the bivariate gammaDFE is in terms of the selection coefficient g, and the lognormaldistribution is in terms of logg; so the correlation coefficientsare not directly comparable. Given that the lognormal distri-bution better fits our data and has been previously found to bea good approximation for the D. melanogaster univariate DFE(Kousathanas and Keightley 2013), we prefer the lognormalestimate. This analysis shows, however, that the inferred cor-relation coefficient is sensitive to the parametric form of thebivariate distribution. Future applications may thus considerother possible forms for the bivariate DFE.
Comparison to experimental mutationalscanning studies
Our population genetic approach allowed us to simulta-neously study the whole genome, but it is an indirect
approach to measuring the selection coefficient correla-tion. Complementary experimental data come from muta-tional scanning experiments, which use deep sequencingto simultaneously assay the function of thousands of mu-tant forms of a protein (Araya and Fowler 2011; Figure4A). To measure selection coefficient correlations fromsuch data, we sampled pairs of mutually nonsynonymousmutations for each site assayed in the protein and calcu-lated the resulting correlations (Figure 4B and File S1).Because our population genetic inference is insensitive tostrongly deleterious mutations, we restricted our analysisto the moderately deleterious mutations found in eachexperiment (Figure S3). We analyzed proteins fromEscherichia coli (Firnberg et al. 2014), Saccharomycescerevisiae (Roscoe et al. 2013), and humans (Starita et al.2015) (Table 1). In all three cases these direct biochem-ical assays yielded a fitness effects correlation in agree-ment with our population genetic estimate, although thelimited number of sites within each experiment yieldedlarge confidence intervals, and experimental noisewould tend to systematically bias the experimental cor-relations downward. These results suggest that themoderate correlation of mutational fitness effects wefound in D. melanogaster also holds true for other organismsand proteins.
Figure 3 Inference of selection correlation coefficient from triallelic data.(A) The observed triallelic frequency spectrum for mutually nonsynony-mous triallelic sites, which contained 10,471 triallelic sites. (B) The best-fitmodel, optimizing the correlation coefficient r and the ancestral misiden-tification parameters. (C) Joint distribution of selection coefficients fromthe maximum-likelihood inferred correlation coefficient of r ¼ 0:51: Se-lection coefficients for nonsynonymous mutations at the same site aremoderately correlated.
Figure 2 Inferences of demographic history and marginal distribution offitness effects from biallelic data. (A) Biallelic synonymous and nonsynon-ymous data (thin black lines) and corresponding maximum-likelihood modelfits (thick colored lines). Ancestral state misidentification is likely responsiblefor most of the excess of high-frequency derived alleles, and a parameter tomodel such misidentification was included in both the synonymous andnonsynonymous models. (B) Inferred demographic model, with two instan-taneous population size changes. Time is in units of 2Na generations, whereNa is the ancestral effective population size. (C) Inferred distribution offitness effects, lognormally distributed for negatively selected mutationswith a proportion of positively selected mutations.
520 A. P. Ragsdale et al.

Selection coefficient correlation for subsets of data
Sites within proteins vary in their evolutionary properties(Halpern and Bruno 1998; Holder et al. 2008), so we askedhow the fitness effect correlation coefficient differs amongsubsets of the D. melanogaster population genomic data.We first tested our expectation that biochemically similar de-rived amino acids would have more tightly correlated se-lection coefficients than dissimilar derived amino acids(Yampolsky et al. 2005; Blanquart and Lartillot 2008). Weassessed similarity, using the Grantham matrix (Grantham1974), which scores pairs of amino acids based on similarityof biochemical properties. We then refitted the correlationcoefficient and misidentification parameter to the subsets ofloci with the top and bottom 20% of similarity scores. Weindeed found that highly similar derived amino acidsexhibited stronger correlation than dissimilar amino acids(Table 1), validating our approach.
We also assessed the correlation of fitness effects for sub-sets of amino acids that are buried or exposed, based onsolvent accessibility, as well as subsets that are ordered ordisordered, because protein structural properties are knownto affect the amino acid substitution process (Dimmic et al.2000). We used SPINE-D (Zhang et al. 2012) to separate sitesinto the top and bottom 20% of solvent accessibility scoresand into disordered and ordered classes. For each subset, werefitted the underlying marginal DFE and then fitted the bi-variate DFE to measure the correlation coefficient. Asexpected (Goldman et al. 1998; Bustamante et al. 2000;Tseng and Liang 2006; Lin et al. 2007), for buried residueswith low solvent accessibility and for ordered residues, weinferred DFEs that were more negatively skewed than forresidues with high solvent accessibility or that were structur-ally disordered (Table S5). We found, however, that thesestructural features did not affect the inferred fitness effectscorrelation coefficient (Table 1). Together, these results sug-gest that models of protein evolution that incorporate struc-tural features (Wilke 2012; Arenas et al. 2013) do need toaccount for differences in the marginal DFE, but not for dif-ferences in correlation.
Conclusions
Based on the three-allele Wright–Fisher model with an influxof new mutations, we developed a novel numerical solutionto the triallelic diffusion equation that simultaneouslymodelsthe effects of demography and selection on pairs of derivedalleles (Figure 1). Using our method, we inferred, for the firsttime, the correlation of mutation fitness effects at the samesite within proteins from triallelic nonsynonymous SNP data(Figure 3). We found that the correlation coefficient is in-termediate between completely uncorrelated and completelycorrelated. Early mutation–selection models of protein evo-lutionmade the unrealistic assumption that the fitness effectsof multiplemutations occurring at the same site were identical(Nielsen and Yang 2003). More recent methods estimate se-lection coefficients for every possible amino acid at every site(Tamuri et al. 2012), but these complexmodels require a greatdeal of data (Tamuri et al. 2014). Our model of correlatedfitness effects is a useful intermediate-complexity model.
We found strong quantitative agreement between thefitness effects correlation coefficient inferred from our pop-ulation genomic inference and those from direct biochemicalexperiments (Figure 4).Moreover, this agreement held acrossa wide range of model organisms, for genes that vary dra-matically in function, and using several measures of fitness,suggesting that this correlation of mutational fitness effects isa fundamental property of protein biology, not species or pro-tein specific. We also refined our analysis to biologicallyrelevant subsets of the data (Table 1). As expected, non-synonymous pairs of similar derived amino acids show signif-icantly higher correlation of fitness effects than dissimilarpairs. Although solvent accessibility and structural disorderdid affect the marginal DFE (Table S5), we did not find a dif-ference in fitness effects correlation among these classes ofsites (Table 1). Together, our results suggest that the fitnesseffects correlation we inferred is a nearly universal propertyof protein evolution, with important implications for model-ing protein evolution.
Acknowledgments
This work was supported by the National Science Founda-tion (DEB-1146074 to R.N.G.).
Literature Cited
Araya, C. L., and D. M. Fowler, 2011 Deep mutational scanning:assessing protein function on a massive scale. Trends Biotech-nol. 29: 435–442.
Arenas, M., H. G. Dos Santos, D. Posada, and U. Bastolla,2013 Protein evolution along phylogenetic histories understructurally constrained substitution models. Bioinformatics29: 3020–3028.
Bank, C., R. T. Hietpas, A. Wong, D. N. Bolon, and J. D. Jensen,2014 A Bayesian MCMC approach to assess the complete dis-tribution of fitness effects of new mutations: uncovering thepotential for adaptive walks in challenging environments. Ge-netics 196: 841–852.
Figure 4 Mutational scanning data. (A) Partial mutational fitness land-scape for E. coli TEM-1 b-lactamase, adapted from Firnberg et al. (2014).For almost all possible single mutants, fitness was assayed as relativeantibiotic resistance. Gray entries denote mutations not measured, andgreen squares highlight the ancestral sequence. (B) Joint distribution offitnesses for mutually nonsynonymous mutations for TEM-1 b-lactamase,using data from Firnberg et al. (2014). For other data sets in Table 1, seeFigure S3.
Correlated Fitness at Triallelic Sites 521

Barton, N. H., and B. Charlesworth, 1998 Why sex and recombi-nation? Science 281: 1986–1990.
Baudry, E., and F. Depaulis, 2003 Effect of misoriented sites onneutrality tests with outgroup. Genetics 165: 1619–1622.
Blanquart, S., and N. Lartillot, 2008 A site- and time-heterogeneousmodel of amino acid replacement. Mol. Biol. Evol. 25: 842–858.
Boyko, A. R., S. H. Williamson, A. R. Indap, J. D. Degenhardt, R. D.Hernandez et al., 2008 Assessing the evolutionary impact ofamino acid mutations in the human genome. PLoS Genet. 4:e1000083.
Bustamante, C. D., J. P. Townsend, and D. L. Hartl, 2000 Solventaccessibility and purifying selection within proteins of Escherichiacoli and Salmonella enterica. Mol. Biol. Evol. 17: 301–308.
Chang, J. S., and G. Cooper, 1970 A practical difference schemefor Fokker-Planck equations. J. Comput. Phys. 6: 1–16.
Coffman, A. J., P. Hsieh, S. Gravel, and R. N. Gutenkunst,2016 Computationally efficient composite likelihood statisticsfor demographic inference. Mol. Biol. Evol. 33: 591–593.
Desai, M. M., and J. B. Plotkin, 2008 The polymorphism fre-quency spectrum of finitely many sites under selection. Genetics180: 2175–2191.
Di Rienzo, A., 2006 Population genetics models of common dis-eases. Curr. Opin. Genet. Dev. 16: 630–636.
Dimmic, M. W., D. P. Mindell, and R. A. Goldstein,2000 Modeling evolution at the protein level using an adjust-able amino acid fitness model. Pac. Symp. Biocomput. 29: 18–29.
Eyre-Walker, A., and P. D. Keightley, 2007 The distribution offitness effects of new mutations. Nat. Rev. Genet. 8: 61061–61068.
Eyre-Walker, A., M. Woolfit, and T. Phelps, 2006 The distributionof fitness effects of new deleterious amino acid mutations inhumans. Genetics 173: 891–900.
Firnberg, E., J. W. Labonte, J. J. Gray, and M. Ostermeier, 2014 Acomprehensive, high-resolution map of a gene’s fitness land-scape. Mol. Biol. Evol. 31: 1581–1592.
Flicek, P., M. R. Amode, D. Barrell, K. Beal, K. Billis et al.,2014 Ensembl 2014. Nucleic Acids Res. 42: 749–755.
Goldman, N., J. L. Thorne, and D. T. Jones, 1998 Assessing theimpact of secondary structure and solvent accessibility on pro-tein evolution. Genetics 149: 445–458.
Grantham, R., 1974 Amino acid difference formula to help ex-plain protein evolution. Science 185: 862–864.
Gutenkunst, R. N., R. D. Hernandez, S. H. Williamson, and C. D.Bustamante, 2009 Inferring the joint demographic history ofmultiple populations from multidimensional SNP frequencydata. PLoS Genet. 5: e1000695.
Halpern, A. L., and W. J. Bruno, 1998 Evolutionary distances forprotein-coding sequences: modeling site-specific residue fre-quencies. Mol. Biol. Evol. 15: 910–917.
Hernandez, R. D., S. H. Williamson, and C. D. Bustamante,2007 Context dependence, ancestral misidentification, andspurious signatures of natural selection. Mol. Biol. Evol. 24:1792–1800.
Hodgkinson, A., and A. Eyre-Walker, 2010 Human triallelic sites:evidence for a new mutational mechanism? Genetics 184: 233–241.
Holder, M. T., D. J. Zwickl, and C. Dessimoz, 2008 Evaluatingthe robustness of phylogenetic methods to among-site variabil-ity in substitution processes. Philos Trans. R. Soc B 363: 4013–4021.
Jenkins, P. A., and Y. S. Song, 2011 The effect of recurrent mu-tation on the frequency spectrum of a segregating site and theage of an allele. Theor. Popul. Biol. 80: 158–173.
Jenkins, P. A., J. W. Mueller, and Y. S. Song, 2014 Generaltriallelic frequency spectrum under demographic models withvariable population size. Genetics 196: 295–311.
Johnson, P. L. F., and M. Slatkin, 2008 Accounting for bias fromsequencing error in population genetic estimates. Mol. Biol.Evol. 25: 199–206.
Keightley, P. D., and A. Eyre-Walker, 2007 Joint inference of thedistribution of fitness effects of deleterious mutations and pop-ulation demography based on nucleotide polymorphism fre-quencies. Genetics 177: 2251–2261.
Kibble, W. F., 1941 A two-variate gamma type distribution.Sankhya 5: 137–150.
Kimura, M., 1955 Random genetic drift in multi-allelic locus. Evo-lution 9: 419–435.
Kimura, M., 1956 Random genetic drift in a tri-allelic locus; exactsolution with a continuous model. Biometrics 12: 57–66.
Kimura, M., 1964 Diffusion models in population genetics. J.Appl. Probab. 1: 177–232.
Kousathanas, A., and P. D. Keightley, 2013 A comparison of mod-els to infer the distribution of fitness effects of new mutations.Genetics 193: 1197–1208.
Lack, J. B., C. M. Cardeno, M. W. Crepeau, W. Taylor, R. B. Corbett-Detig et al., 2015 The Drosophila Genome Nexus: a populationgenomic resource of 623 Drosophila melanogaster genomes, in-cluding 197 from a single ancestral range population. Genetics199: 1229–1241.
Levy, S. F., J. R. Blundell, S. Venkataram, D. A. Petrov, D. S. Fisheret al., 2015 Quantitative evolutionary dynamics using high-resolution lineage tracking. Nature 519: 181–186.
Lin, Y. S., W. L. Hsu, J. K. Hwang, and W. H. Li, 2007 Proportionof solvent-exposed amino acids in a protein and rate of proteinevolution. Mol. Biol. Evol. 24: 1005–1011.
Mathew, L. A., P. R. Staab, L. E. Rose, and D. Metzler, 2013 Whyto account for finite sites in population genetic studies and howto do this with Jaatha 2.0. Ecol. Evol. 3: 3647–3662.
Nielsen, R., and Z. Yang, 2003 Estimating the distribution ofselection coefficients from phylogenetic data with applicationsto mitochondrial and viral DNA. Mol. Biol. Evol. 20: 1231–1239.
1000 Genomes Project Consortium, 2015 A global reference forhuman genetic variation. Nature 526: 68–74.
Roscoe, B. P., K. M. Thayer, K. B. Zeldovich, D. Fushman, and D. N.A. Bolon, 2013 Analyses of the effects of all ubiquitin pointmutants on yeast growth rate. J. Mol. Biol. 425: 1363–1377.
Sanjuán, R., A. Moya, and S. F. Elena, 2004 The distribution offitness effects caused by single-nucleotide substitutions in anRNA virus. Proc. Natl. Acad. Sci. USA 101: 8396–8401.
Sawyer, S. A., and D. L. Hartl, 1992 Population genetics of poly-morphism and divergence. Genetics 132: 1161–1176.
Schneider, A., B. Charlesworth, A. Eyre-Walker, and P. D. Keightley,2011 A method for inferring the rate of occurrence and fitnesseffects of advantageous mutations. Genetics 189: 1427–1437.
Sella, G., D. A. Petrov, M. Przeworski, and P. Andolfatto,2009 Pervasive natural selection in the Drosophila genome?PLoS Genet. 5: e1000495.
Spencer, H. G., and R. Barakat, 1992 Random genetic drift andselection in a triallelic locus: a continuous diffusion model.Math. Biosci. 108: 127–139.
Starita, L. M., D. L. Young, M. Islam, J. O. Kitzman, J. Gullingsrudet al., 2015 Massively parallel functional analysis of BRCA1RING domain variants. Genetics 200: 413–422.
Tamuri, A. U., M. dos Reis, and R. A. Goldstein, 2012 Estimatingthe distribution of selection coefficients from phylogenetic datausing sitewise mutation-selection models. Genetics 190: 1101–1115.
Tamuri, A. U., N. Goldman, and M. dos Reis, 2014 A penalized-likelihood method to estimate the distribution of selection co-efficients from phylogenetic data. Genetics 197: 257–271.
Tier, C., 1979 A tri-allelic diffusion model with selection, migra-tion, and mutation. Math. Biosci. 60: 41–60.
522 A. P. Ragsdale et al.
Tier, C., and J. B. Keller, 1978 A tri-allelic diffusion model withselection. SIAM J. Appl. Math. 35: 521–535.
Tseng, Y. Y., and J. Liang, 2006 Estimation of amino acid residuesubstitution rates at local spatial regions and application in pro-tein function inference: a Bayesian Monte Carlo approach. Mol.Biol. Evol. 23: 421–436.
Wang, K., M. Li, and H. Hakonarson, 2010 ANNOVAR: functionalannotation of genetic variants from high-throughput sequencingdata. Nucleic Acids Res. 38: 1–7.
Wilke, C. O., 2012 Bringing molecules back into molecular evo-lution. PLoS Comput. Biol. 8: 6–9.
Williamson, S. H., R. Hernandez, A. Fledel-alon, L. Zhu, R. Nielsenet al., 2005 Simultanous inference of selection and populationgrowth from patterns of variation in the human genome. Proc.Natl. Acad. Sci. USA 102: 7882–7887.
Wloch, D. M., K. Szafraniec, R. H. Borts, and R. Korona,2001 Direct estimate of the mutation rate and the distribution
of fitness effects in the yeast Saccharomyces cerevisiae. Genetics159: 441–452.
Yampolsky, L. Y., F. A. Kondrashov, and A. S. Kondrashov,2005 Distribution of the strength of selection against aminoacid replacements in human proteins. Hum. Mol. Genet. 14:3191–3201.
Yue, S., T. B. M. J. Ouarda, and B. Bobée, 2001 A review ofbivariate gamma distributions for hydrological application.J. Hydrol. 246: 1–18.
Zhang, T., E. Faraggi, B. Xue, A. K. Dunker, V. N. Uversky et al.,2012 SPINE-D: accurate prediction of short and long disor-dered regions by a single neural-network based method. J. Bio-mol. Struct. Dyn. 29: 799–813.
Communicating editor: Y. S. Song
Correlated Fitness at Triallelic Sites 523

GENETICSSupporting Information
www.genetics.org/lookup/suppl/doi:10.1534/genetics.115.184812/-/DC1
Triallelic Population Genomics for InferringCorrelated Fitness Effects of Same Site
Nonsynonymous MutationsAaron P. Ragsdale, Alec J. Coffman, PingHsun Hsieh, Travis J. Struck, and Ryan N. Gutenkunst
Copyright © 2016 by the Genetics Society of AmericaDOI: 10.1534/genetics.115.184812

One
gridpoint
fromboundary
00
1
1
x
y
Absorbing
boundaryAbsorbing
boundary
A
B
C
Figure S1: Numerical challenges along diagonal boundary. A: In the interior of the domain, weintegrated forward with Eq. S1 and Eq. S2. B: Near the boundary of the domain, density spreads primarilydiagonally (blue ellipse). In our scheme, the ADI step (Eq. S1, solid arrows) pushes density horizontallyand vertically, and the explicit step (Eq. S2, dashed arrows) accounts for diagonal flow. C: Immediatelyadjacent to the boundary, the ADI step pushes excess density onto the boundary, which cannot return (redXs), because the boundary is absorbing. We thus applied the ADI step to all points except those adjacentto the boundary. At the adjacent points we calculated the density that should be lost to the boundary eachtimestep and explicitly moved that much density to the boundary.
−108 −104 −100 −10−4 +40
γ
Pro
babili
ty
eff.
leth
.
eff. neut.
−108 −102 −10−4
γx
−108
−102
−10−4
γy
γy eff. neut.
γx e
ff.
neut.
A
B
Figure S2: Integration over DFEs. A: Best-fit lognormal DFE for bivariate nonsynonymous data, withregimes assumed to be effectively neutral and lethal highlighted. B: Best-fit bivariate lognormal DFE (notshowing positive selection portion) for all triallelic nonsynonymous data. In the crosshatched area, weconsidered one or both alleles to be effectively lethal, such that they did not contribute to observed segregatingvariation. In regions for which γx or γy were assumed effectively neutral, we used γ = 0 for calculation. Forexample, if γx = −10−6 and γy = −1, we used the frequency spectrum calculated for (γx, γy) = (0,−1).

0.0 0.4 0.8 1.2
Antibiotic resistance
0
80
160
240
Muta
tions
E. coli TEM-1
0.0 0.4 0.8 1.2
Antibiotic resistance
0.0
0.4
0.8
1.2
Anti
bio
tic
resi
stance
0.00
0.02
0.04
0.06
0.08
Pro
babili
ty
0.2 0.5 0.8 1.1 1.4
Antibiotic resistance
0.2
0.5
0.8
1.1
1.4
Anti
bio
tic
resi
stance
0.000
0.002
0.004
0.006
Pro
babili
ty
0.0 0.5 1.0
Growth rate
0
80
160
240
Muta
tions
Yeast ubiquitin
0.0 0.5 1.0
Growth rate
0.0
0.5
1.0
Gro
wth
rate
0.00
0.02
0.04
0.06
0.08
0.10
0.12Pro
babili
ty
0.75 0.85 0.95 1.05
Growth rate
0.75
0.85
0.95
1.05
Gro
wth
rate
0.0000.0050.0100.0150.0200.0250.0300.035
Pro
babili
ty
0.0 0.3 0.6 0.9 1.2
HDR rescue score
0
20
40
60
80
Muta
tions
Human BRCA1
0.0 0.3 0.6 0.9 1.2
HDR rescue score
0.0
0.3
0.6
0.9
1.2H
DR
resc
ue s
core
0.000
0.002
0.004
0.006
0.008
Pro
babili
ty
0.4 0.6 0.8 1.0 1.2
HDR rescue score
0.4
0.6
0.8
1.0
1.2
HD
R r
esc
ue s
core
0.000
0.001
0.002
0.003
0.004
0.005
0.006
Pro
babili
ty
A B C
D E F
G H I
Figure S3: Mutational scanning experiments. A-C: Fitness proxy distributions for all three datasets. Shaded region indicates mutations considered in our primary analysis that focused on mutations withmoderate effect (Table 1). D-F: Binned probability distribution of joint fitnesses for pairs of nonsynonymousmutations at the same site, restricted to fitnesses considered in our primary analysis. G-I: As in D-F, butincluding all mutations.

0 5 10 15 200
2
4
6
8
10
12Diffusion
100
101
102
Count
0 5 10 15 200
2
4
6
8
10
12Coalescent
100
101
102
Count
0 5 10 15 200
2
4
6
8
10
12Residual (Coal − Diff)
0.250.200.150.100.05
0.000.050.100.150.200.25
A
B
C
Figure S4: Validation of numerics for neutral demography. For a two-epoch demography in whichthe population doubles in size at a time 0.1 × 2Na generations before present, we compared our diffusionresults with the coalescent method of Jenkins, Mueller, and Song (Jenkins et al., 2014). A: Numericaldiffusion solution with grid points [60, 80, and 100] and time steps [0.01, 0.001, and 0.0001]. B: Coalescentsolution from 10,000 simulated trees (from Hudson’s ms (Hudson, 2002)) used to calculate the momentsof intercoalescent times. C. The residuals show good agreement between our numerical diffusion approachand the coalescent approach from Jenkins et al. (2014), with Poisson residuals calculated as (Coalescent −Diffusion)/
√Coalescent, with the exception that our diffusion method slightly underestimates low-frequency
alleles when compared with the coalescent approach.
0 5 10 15 200
5
10
15
20
5,317,590 SNPs
γx =γy =0
4.5
3.0
1.5
0.0
1.5
3.0
4.5
0 5 10 15 200
5
10
15
20
4,030,569 SNPs
γx =γy =−1
4.5
3.0
1.5
0.0
1.5
3.0
4.5
0 5 10 15 200
5
10
15
20
4,097,000 SNPs
γx =−2,γy =−1
6.0
4.5
3.0
1.5
0.0
1.5
3.0
4.5
6.0
0 5 10 15 200
5
10
15
20
1,694,587 SNPs
γx =γy =−5
4.5
3.0
1.5
0.0
1.5
3.0
4.5
0 5 10 15 200
5
10
15
20
2,185,731 SNPs
γx =−10,γy =0
8
6
4
2
0
2
4
6
8
0 5 10 15 200
5
10
15
20
7,032,139 SNPs
γx =2,γy =−2
4.5
3.0
1.5
0.0
1.5
3.0
4.5
Residuals (Diff − Sim)
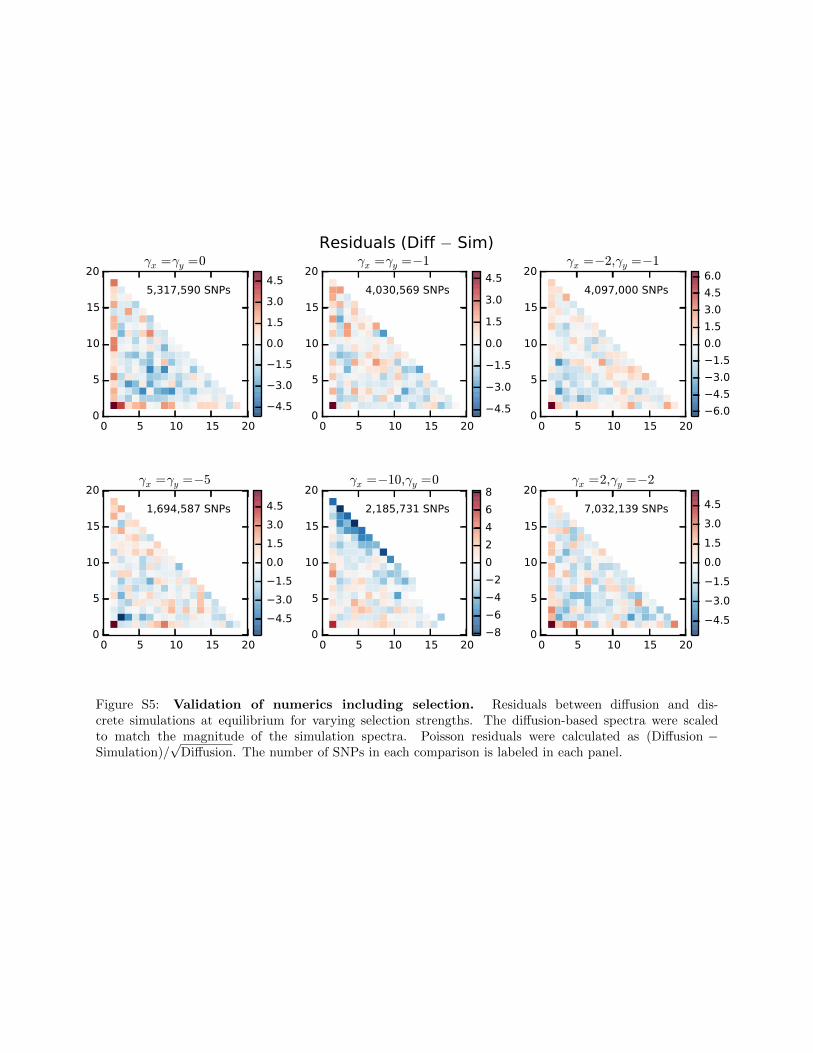
Figure S5: Validation of numerics including selection. Residuals between diffusion and dis-crete simulations at equilibrium for varying selection strengths. The diffusion-based spectra were scaledto match the magnitude of the simulation spectra. Poisson residuals were calculated as (Diffusion −Simulation)/
√Diffusion. The number of SNPs in each comparison is labeled in each panel.

500 1000 2000 5000 10000Number of entries in TFS
0.10.20.30.40.50.60.70.80.91.0
Infe
rred ρ
Varying entries, ρ=0.5
500 1000 2000 5000 10000Number of entries in TFS
0.4
0.5
0.6
0.7
0.8
0.9
1.0
Infe
rred ρ
Varying entries, ρ=0.9
500 1000 2000 5000 10000Number of entries in TFS
0.3
0.2
0.1
0.0
0.1
0.2
0.3
Infe
rred ρ
Varying entries, ρ=0.0
500 1000 2000 5000 10000Number of entries in TFS
0.1
0.0
0.1
0.2
0.3
0.4
0.5
0.6
Infe
rred ρ
Varying entries, ρ=0.25
20 50 100 197Sample size
0.0
0.2
0.4
0.6
0.8
1.0
Infe
rred ρ
Varying sample size, ρ=0.5
20 50 100 197Sample size
0.0
0.2
0.4
0.6
0.8
1.0
Infe
rred ρ
Varying sample size, ρ=0.5
A B
C D
E F
Figure S6: Statistical power of selection correlation coefficient inference. Plotted are the distri-butions of selection correlation coefficients inferred from simulated data. Red lines denote medians, boxesdenote first and third quartiles. Data were simulated using our best-fit demography and marginal DFE fromthe Drosophila data, but with varying correlation coefficient ρ. For each configuration of ρ and data size,we simulated and fit 200 data sets. A-D: For a given ρ, we varied the number of observed triallelic lociamong 197 sampled chromosomes. As the number of observed loci increases, the power to accurately infer ρincreases smoothly. E: For ρ = 0.5, we varied the number of sampled individuals, while holding θ constantso that 10,000 triallelic loci would be observed with 197 samples, and fewer would be observed with smallersamples. F: For ρ = 0.5, we varied the number of sampled individuals, while holding the number of observedtriallelic loci constant at 10,000. In this case, power depends very little on sample size.
10−6 10−5 10−4
Error probability
0.40
0.45
0.50
0.55
0.60
0.65
Infe
rred ρ
Sequencing error, ρ=0.5
Figure S7: Effect of sequencing error on selection correlation coefficient inference. We simulateddata under our best-fit demographic and marginal DFE model, with ρ = 0.5, including a model for sequencingerror in which each individual genotype has probability ε of being miscalled (Johnson and Slatkin, 2008).Inference was unbiased for error rates ε ≤ 10−5 and biased upward for larger error rates.
0 50 100 150 200
Derived allele frequency
102
103
104
105
Count
Syn
Nonsyn
Two epoch demography
0 50 100 150 200
Derived allele frequency
102
103
104
105
Syn
Nonsyn
Equilibrium demography
0 50 100 150 200
Derived allele frequency
15
10
5
0
5
10
15
Resi
dual
0 50 100 150 200
Derived allele frequency
150
100
50
0
50
A
B
C
D
Figure S8: Biallelic data fits for simpler demographic models. Top panels show the data (thin blacklines) and maximum-likelihood models (thick colored lines), and bottom panels show the Anscombe residualsbetween model and data. A&B: The two-epoch model fits the data more poorly than the three-epoch model.Our resulting inferences of the marginal DFE under this model are similar to under the three-epoch model,but the inferred value of ρ is notably lower. C&D: The equilibrium demographic model does not fit thebiallelic data well, and both the marginal and bivariate DFE inferences differ substantially from the three-epoch model.

Table S1: Maximum-likelihood estimates from Drosophila data. Point estimates and confidenceintervals for our three epoch demographic model (Fig. 2B), the univariate distribution of fitness effects fornonsynonymous mutations (Fig. 2C), and the bivariate DFE from triallelic data (Fig. 3).
EstimatesModel Parameter Max Likelihood 95% CI Log-likelihood
3-epoch
ν1 1.63 1.47−1.79
-1334ν2 3.15 3.02−3.28τ1 0.12 0.10−0.14τ2 0.044 0.035−0.054
misid 0.052 0.051−0.053
DFE
µ 5.42
-853.3σ 3.36γ+ 39.9p+ 0.0079
misid 0.014
5.23−5.623.25−3.4735.7−44.1
0.0069−0.00880.013−0.015
Correlationρ 0.51 0.44− 0.59
-4433misid 0.029 0.023− 0.34
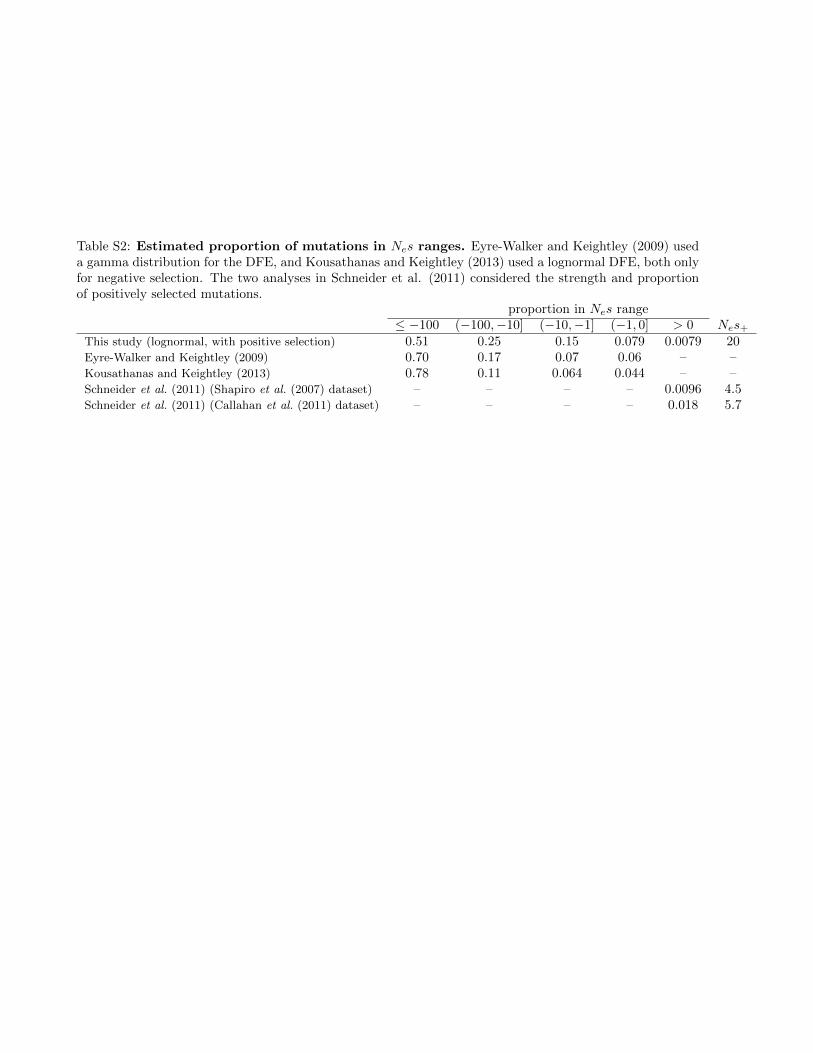
Table S2: Estimated proportion of mutations in Nes ranges. Eyre-Walker and Keightley (2009) useda gamma distribution for the DFE, and Kousathanas and Keightley (2013) used a lognormal DFE, both onlyfor negative selection. The two analyses in Schneider et al. (2011) considered the strength and proportionof positively selected mutations.
proportion in Nes range≤ −100 (−100,−10] (−10,−1] (−1, 0] > 0 Nes+
0.51 0.25 0.15 0.079 0.0079 200.70 0.17 0.07 0.06 – –0.78 0.11 0.064 0.044 – –
– – – – 0.0096 4.5
This study (lognormal, with positive selection)
Eyre-Walker and Keightley (2009)
Kousathanas and Keightley (2013)
Schneider et al. (2011) (Shapiro et al. (2007) dataset)
Schneider et al. (2011) (Callahan et al. (2011) dataset) – – – – 0.018 5.7

Table S3: Maximum-likelihood parameters from simpler demographic models. The two-epoch de-mographic model fit the synonymous data somewhat worse than the three-epoch model, and the equilibriumdemography fit the data very poorly (Fig. S8). The fits to the nonsynonymous biallelic and triallelic datawere also worse for the two simpler demographic models (compare log-likelihoods with Table S1). The twoepoch demography fits the data more poorly for low and high frequency alleles than the three epoch demog-raphy (Fig. S8, and the DFE is skewed toward neutrality for negatively selected sites and the strength ofpositive selection is higher than the three epoch DFE. This causes more high frequency alleles to be presentin the triallelic frequency spectrum, which tends to push the inferred ρ to lower values (Fig. 1).
EstimatesModel Parameter Max Likelihood 95% CI Log-likelihood
2-epoch, demographyν 2.73 2.70− 2.75
-1499τ 0.091 0.089− 0.093misid 0.051 0.050− 0.052
2-epoch, DFE
µ 5.28
-979.3σ 3.03γ+ 72.2p+ 0.0091
misid 0.011
5.25− 5.302.98− 3.0769.0− 75.4
0.0084− 0.00970.010− 0.012
2-epoch, correlationρ 0.31 0.27− 0.35
-4451misid 0.025 0.023− 0.027
Equilibrium, DFE
µ 4.40 4.39− 4.42
-1619σ 1.19 1.17− 1.21γ+ 0.0p+ 0.062 0.061− 0.063
misid 0.024 0.023− 0.024
Equilibrium, correlationρ 0.20 0.17− 0.22
-4480misid 0.056 0.050− 0.062

Table S4: Maximum likelihood estimates for a gamma-distributed DFE. The univariate and bi-variate gamma distributions fit the biallelic nonsynonymous Drosophila data worse than the lognormaldistribution (Table S1). The correlation coefficient in the gamma distribution is in terms of the selectioncoefficient, but in the lognormal distribution it is in terms of the logarithm of the selection coefficient, so itis difficult to directly compare the inferred coefficients.
EstimatesModel Parameter Max Likelihood 95% CI Log-likelihood
Univariate gamma
α 0.384
-871β 1401γ+ 97.0p+ 0.00426
misid 0.0133
0.379− 0.3891339− 146382.3− 111.7
0.00396− 0.004560.0122− 0.0144
Gamma correlationρ 0.975
-4464misid 0.0197
0.966− 0.9830.0146− 0.0248

Table S5: Maximum likelihood estimates for the refit DFEs for subsets of the data based onsolvent accessibility and structural disorder. We refit the correlation coefficient ρ to subsets of thetriallelic fruit fly data. We first refit the univariate DFE to the biallelic nonsynonymous data, and we fixedγ+ = 39.9 for all fits. In the biallelic fits, we inferred stronger negative selection for buried and orderedamino acids, as expected and described in the main text.
EstimatesSubset Parameter Max Likelihood 95% CI range
Exposedµ 4.26 4.22−4.31σ 2.93 2.85−3.01p+ 0.0132 0.0118−0.0146
Buriedµ 7.06 6.98−7.14σ 3.53 3.45−3.60p+ 0.00352 0.00308−0.00396
Disorderedµ 4.14 4.11−4.17σ 3.00 2.95−3.05p+ 0.0111 0.0102−0.0120
Orderedµ 6.42 6.37−6.47σ 3.43 3.37−3.48p+ 0.00589 0.00547−0.00631
Triallelic solution numerics
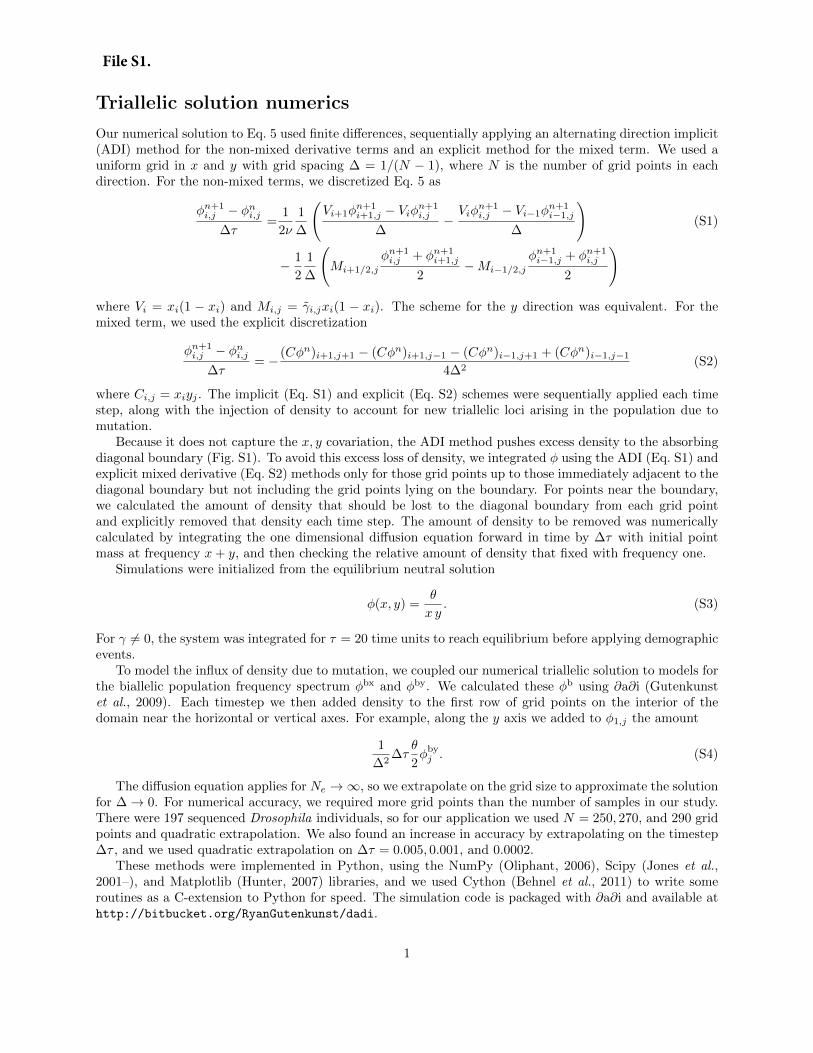
Our numerical solution to Eq. 5 used finite differences, sequentially applying an alternating direction implicit(ADI) method for the non-mixed derivative terms and an explicit method for the mixed term. We used auniform grid in x and y with grid spacing ∆ = 1/(N − 1), where N is the number of grid points in eachdirection. For the non-mixed terms, we discretized Eq. 5 as
φn+1i,j − φni,j
∆τ=
1
2ν
1
∆
(Vi+1φ
n+1i+1,j − Viφ
n+1i,j
∆−Viφ
n+1i,j − Vi−1φ
n+1i−1,j
∆
)(S1)
− 1
2
1
∆
(Mi+1/2,j
φn+1i,j + φn+1
i+1,j
2−Mi−1/2,j
φn+1i−1,j + φn+1
i,j
2
)
where Vi = xi(1 − xi) and Mi,j = γ̃i,jxi(1 − xi). The scheme for the y direction was equivalent. For themixed term, we used the explicit discretization
φn+1i,j − φni,j
∆τ= − (Cφn)i+1,j+1 − (Cφn)i+1,j−1 − (Cφn)i−1,j+1 + (Cφn)i−1,j−1
4∆2(S2)
where Ci,j = xiyj . The implicit (Eq. S1) and explicit (Eq. S2) schemes were sequentially applied each timestep, along with the injection of density to account for new triallelic loci arising in the population due tomutation.
Because it does not capture the x, y covariation, the ADI method pushes excess density to the absorbingdiagonal boundary (Fig. S1). To avoid this excess loss of density, we integrated φ using the ADI (Eq. S1) andexplicit mixed derivative (Eq. S2) methods only for those grid points up to those immediately adjacent to thediagonal boundary but not including the grid points lying on the boundary. For points near the boundary,we calculated the amount of density that should be lost to the diagonal boundary from each grid pointand explicitly removed that density each time step. The amount of density to be removed was numericallycalculated by integrating the one dimensional diffusion equation forward in time by ∆τ with initial pointmass at frequency x+ y, and then checking the relative amount of density that fixed with frequency one.
Simulations were initialized from the equilibrium neutral solution
φ(x, y) =θ
x y. (S3)
For γ 6= 0, the system was integrated for τ = 20 time units to reach equilibrium before applying demographicevents.
To model the influx of density due to mutation, we coupled our numerical triallelic solution to models forthe biallelic population frequency spectrum φbx and φby. We calculated these φb using ∂a∂i (Gutenkunstet al., 2009). Each timestep we then added density to the first row of grid points on the interior of thedomain near the horizontal or vertical axes. For example, along the y axis we added to φ1,j the amount
1
∆2∆τ
θ
2φbyj . (S4)
The diffusion equation applies for Ne →∞, so we extrapolate on the grid size to approximate the solutionfor ∆→ 0. For numerical accuracy, we required more grid points than the number of samples in our study.There were 197 sequenced Drosophila individuals, so for our application we used N = 250, 270, and 290 gridpoints and quadratic extrapolation. We also found an increase in accuracy by extrapolating on the timestep∆τ , and we used quadratic extrapolation on ∆τ = 0.005, 0.001, and 0.0002.
These methods were implemented in Python, using the NumPy (Oliphant, 2006), Scipy (Jones et al.,2001–), and Matplotlib (Hunter, 2007) libraries, and we used Cython (Behnel et al., 2011) to write someroutines as a C-extension to Python for speed. The simulation code is packaged with ∂a∂i and available athttp://bitbucket.org/RyanGutenkunst/dadi.
1
File S1.

Validation of triallelic simulations
To validate our triallelic diffusion simulations, we first compared to the neutral coalescent results of Jenkins,Mueller, and Song (Jenkins et al., 2014) for a number of simple two- and three-epoch demographies atneutrality, i.e. γx = γy = 0. We calculated the entries for the coalescent-based spectrum using Eq. 8 inJenkins et al. (2014). Our diffusion simulations agreed well with these coalescent results (Fig. S4). Boththe diffusion calculation and coalescent calculations took less than 30 seconds, although generating the treesneeded for the coalescent calculation took tens of minutes.
To validate our triallelic diffusion simulations with selection, we compared to custom Wright-Fishersimulations implemented in Python (Figure S5). Each generation, new triallelic loci entered the populationat constant rate, with frequency (1/2N, y) or (x, 1/2N), where frequencies x or y were sampled from thebackground equilibrium biallelic frequency spectrum corresponding to the selection coefficients of the twoalleles. The expected number of new triallelic loci per generation depended on the selection coefficient of thebackground allele, as the magnitude of the biallelic density function varies with γ. We approximated thesepopulation-level density functions using 2N grid points. Each generation, the allele frequencies of each locuswere updated using multinomial sampling, with the expected frequencies xnext = x(1 + sx)/(1 + xsx + ysy)and ynext = y(1+sy)/(1+xsx+ysy). After each generation, we dropped loci for which one of the alleles waslost, rendering the site no longer triallelic. We used population sizes of N = 1000 and ran each simulation for20N generations to reach equilibrium. We then populated the frequency spectrum by sampling 20 copies ofeach locus every 100 generations, for 20N generations. We ran 200 independent instances of the simulationfor each set of selection coefficients and combined the frequency spectra in order to increase the number ofindependently sampled triallelic loci. Our diffusion simulations agreed well with these discrete simulations(Fig. S5).
Bivariate lognormal distribution
For biallelic data, we used the univariate lognormal distribution to model the negatively selected portion ofthe nonsynonymous DFE, along with a point mass for some proportion of positive selection. The lognormaldistribution takes the form
f(x) =1
xσ√
2πe−
(ln x−µ)2
2σ2 (S5)
and we assume that with probability p+, a novel nonsynonymous mutation will have selection coefficientγ+ > 0, and with probability 1− p+, it will have selection coefficient pulled from the density function f(x).The bivariate extension of the lognormal distribution has density function
g(x, y) =1
2πxyσxσy√
1− ρe−Q/2 (S6)
with
Q =1
1− ρ2
[(lnx− µx
σx
)2
− 2ρ
(lnx− µx
σx
)(ln y − µy
σy
)+
(ln y − µy
σy
)2]
(S7)
where µx, µy are the marginal means, and σx, σy are the marginal standard deviations, and ρ is the correlationcoefficient. In our application µx = µy = µ, and σx = σy = σ.
We now describe how the DFE with a point mass of positive selection extends to the bivariate DFE.For a triallelic locus, assume that the first derived allele to arise has selection coefficient γx. This selectioncoefficient is γ+ with probability p+, or has γx < 0 sampled from the univariate lognormal distribution givenby f(x) with probability 1 − p+. The selection coefficient γy of the second derived allele at this locus isconditional on γx. The relative weights for the regimes of the signs of the two selection coefficients (withγx, γy < 0; γx, γy > 0; or one selection coefficient positive and the other negative) depends on both p+ andρ. If γx = γ+, then γy = γ+ with probability ρ(1− p+) + p+, or γy is pulled from the univariate lognormaldistribution with mean µ and standard deviation σ with probability (1 − p+)(1 − ρ). If ρ is larger, the
2

probability that γy = γ+ as well increases, as expected. On the other hand, if γx < 0, having been pulledfrom the lognormal distribution with parameters µ and σ, then γy = γ+ with probability p+(1 − ρ), andγy < 0 with probability (1 − p+) + p+ρ, pulled from the univariate lognormal distribution with µ̃ and σ̃.The new parameters µ̃ and σ̃ are found by holding γx constant in the bivariate lognormal distribution andrearranging to find the univariate distribution for γy:
σ̃ = σ√
1− ρ,µ̃ = µ+ ρσ̃B,
B =ln (−γx)− µσ√
1− ρ2.
Bivariate gamma distribution
We also performed our analysis using a gamma distributed DFE instead of a lognormal DFE. The bivariategamma distribution we used was introduced by Kibble (1941). The gamma distribution takes the form
f(x) =βα
Γ(α)xα−1e−βx, (S8)
where α and β are the shape and scale parameters, respectively. Consider two marginal gamma distributionsf1 with shape and scale parameters α1 and β1, and f2 with α2, β2, and let α =
√α1α2. For correlation
coefficient ρ, the bivariate gamma distribution that we used then takes the form
g(x, y) =(β1β2)α
(1− ρ)Γ(α)
(xy
ρβ1β2
)α−12
exp
(−β1x+ β2y
1− ρ
)Iα−1
(2√ρβ1β2xy
1− ρ
)(S9)
where Iα is the modified Bessel function of the first kind of order α, given by
Iα(z) =
∞∑k=0
(z/2)2k+α
Γ(k + α+ 1)k!. (S10)
Subsets of trialleic variation
When considering similar or dissimilar derived amino acids, we refit the correlation coefficient using the sameunivariate DFE as the full data. For the solvent accessibility and disorder analysis, we refit the univariateDFE, although for consistency with the whole-genome analysis we fixed γ+ = 39.9.
To predict residue solvent accessibility and structural disorder using SPINE-D (Zhang et al., 2012), wefirst matched RefSeq IDs from Annovar (Wang et al., 2010) to Ensembl release 81 (Cunningham et al., 2014)gene and transcript IDs. For the 95% of proteins for which the Ensembl CDS sequence perfectly matchedthe SNP states reported by Annovar, we then ran SPINE-D (Zhang et al., 2012) on the longest Ensembltranscript.
Mutational scanning data
Firnberg et al. (2014) studied 286 positions in E. coli TEM-1 β-Lacatamase. Their proxy for fitness wasresistance to ampicillin, relative to the ancestral sequence. They reported fitnesses at the codon level, so werestricted our analysis to mutations that were a single nucleotide change from the ancestral sequence. Thedistribution of measured fitnesses was strongly skewed toward zero (Fig. S3A). To exclude severely deleteriousmutations, in our primary analysis (Table 1) we considered only mutations with fitness > 0.1 (Fig. S3A,D).If we included all mutations (Fig. S3G), we inferred a fitness correlation coefficient of 0.42−0.58.
3
Roscoe et al. (2013) studied 75 positions in S. cerevisiae ubiquitin, assaying fitness as growth rate relativeto the ancestral sequence. They reported data at the amino acid level, so we considered mutations to allpossible amino acids. To focus on the bulk of the fitness distribution, we restricted our primary analysisto only mutations with fitness > 0.72 (Fig. S3B,E). If we included all mutations (Fig. S3H), we inferred afitness correlation coefficient of 0.34−0.68.
Starita et al. (2015) studied 303 positions in the RING domain of human BRCA1 protein. Their proxy forfitness was a homology-directed DNA repair (HDR) score, based on combined measurements of ubiquitinationactivity assayed by phage display and binding to the RING domain of BARD1 assayed by yeast two-hybrid.To focus on the bulk of the fitness distribution, we restricted our primary analysis to consider only mutationswith fitness > 0.35 (Fig. S3C,F). If we included all mutations (Fig. S3I), we inferred a fitness correlationcoefficient of 0.29−0.59.
References
Behnel, S., R. Bradshaw, C. Citro, L. Dalcin, D. Seljebotn, and K. Smith, 2011 Cython: the best of bothworlds. Comput Sci Eng 13: 31 –39.
Callahan, B., R. a. Neher, D. Bachtrog, P. Andolfatto, and B. I. Shraiman, 2011 Correlated evolution ofnearby residues in Drosophilid proteins. PLoS Genet 7: e1001315.
Cunningham, F., M. R. Amode, D. Barrell, K. Beal, K. Billis, et al., 2014 Ensembl 2015. Nucleic Acids Res43: D662–D669.
Eyre-Walker, A. and P. D. Keightley, 2009 Estimating the rate of adaptive molecular evolution in thepresence of slightly deleterious mutations and population size change. Mol Biol Evol 26: 2097–2108.
Firnberg, E., J. W. Labonte, J. J. Gray, and M. Ostermeier, 2014 A comprehensive, high-resolution map ofa gene’s fitness landscape. Mol Biol Evol 31: 1581–1592.
Gutenkunst, R. N., R. D. Hernandez, S. H. Williamson, and C. D. Bustamante, 2009 Inferring the jointdemographic history of multiple populations from multidimensional SNP frequency data. PLoS Genet 5:e1000695.
Hudson, R. R., 2002 Generating samples under a Wright-Fisher neutral model of genetic variation. Bioin-formatics 18: 337–338.
Hunter, J. D., 2007 Matplotlib: A 2d graphics environment. Comput Sci Eng 9: 90–95.
Jenkins, P. A., J. W. Mueller, and Y. S. Song, 2014 General triallelic frequency spectrum under demographicmodels with variable population size. Genetics 196: 295–311.
Johnson, P. L. F. and M. Slatkin, 2008 Accounting for bias from sequencing error in population geneticestimates. Mol Biol Evol 25: 199–206.
Jones, E., T. Oliphant, P. Peterson, et al., 2001– SciPy: Open source scientific tools for Python.
Kibble, W. F., 1941 A two-variate gamma type distribution. Sankhya 5: 137–150.
Kousathanas, A. and P. D. Keightley, 2013 A comparison of models to infer the distribution of fitness effectsof new mutations. Genetics 193: 1197–1208.
Oliphant, T. E., 2006 Guide to NumPy . Provo, UT.
Roscoe, B. P., K. M. Thayer, K. B. Zeldovich, D. Fushman, and D. N. A. Bolon, 2013 Analyses of the effectsof all ubiquitin point mutants on yeast growth rate. J Molec Biol 425: 1363–1377.
4

Schneider, A., B. Charlesworth, A. Eyre-Walker, and P. D. Keightley, 2011 A method for inferring the rateof occurrence and fitness effects of advantageous mutations. Genetics 189: 1427–1437.
Shapiro, J. A., W. Huang, C. Zhang, M. J. Hubisz, J. Lu, et al., 2007 Adaptive genic evolution in theDrosophila genomes. Proc Natl Acad Sci U S A 104: 2271–2276.
Starita, L. M., D. L. Young, M. Islam, J. O. Kitzman, J. Gullingsrud, et al., 2015 Massively parallel functionalanalysis of BRCA1 RING domain variants. Genetics 200: 413–422.
Wang, K., M. Li, and H. Hakonarson, 2010 ANNOVAR: functional annotation of genetic variants fromhigh-throughput sequencing data. Nucleic Acids Res 38: 1–7.
Zhang, T., E. Faraggi, B. Xue, A. K. Dunker, V. N. Uversky, and Y. Zhou, 2012 SPINE-D: accurate predictionof short and long disordered regions by a single neural-network based method. J Biomolec Struct Dynam29: 799–813.
5