Embed Size (px)
Citation preview

Tri-West Hendricks Senior High School
DOE # 2731
North West Hendricks Schools
DOE # 3295
7883 N. State Road 39
Lizton, IN 46149
School Phone:
317-994-4000
School Fax:
317-994-5106
Email:
bennera@ hendricks.k12.in.us

2
Table of Contents
I. School and Community Description (p. 3)
II. Mission Statement
A. Mission and Vision Statement of Tri-West High School (p. 4)
B. Mission and Vision Statement of Northwest Hendricks School Corporation
(p. 5)
C. We Believe..… (p. 6)
III. Profile (Quad-angulations of Data) (p. 7)
A. ECA test data + Six year trend data analysis (p. 7)
B. NWEA Analysis (p. 10)
C. SAT / PSAT (p. 13)
D. Survey Data Analysis (p. 14)
IV. Student Data (p. 18)
V. Instructional Data (p. 21)
VI. Community Data (p. 23)
VII. Goals and Strategies (2011 - 2015) (p. 27)
VIII. Professional Development and Accountability (p. 30)
Appendix
A. Response to Intervention (RTI) (p.37)
B. Marzano’s (Nine) High-Yield Instructional Strategies (p. 38)
C. Word Walls / Bell Ringers (p. 43)
D. Team Teaching (p. 44)
E. Quarterly Assessments (p. 48)
F. Student Survey questions and tabulation (p. 50)
G. Teacher Survey questions and tabulation (p. 55)
H. Parent Survey questions and tabulations (p. 63)
I. Student and Instructional data (p. 66)
J. Teacher committees (p. 77)

3
I. SCHOOL AND COMMUNITY DESCRIPTION
The North West Hendricks School Corporation is comprised of Eel River, Union, and Middle Townships
in Hendricks County. Included in the geographic area are the incorporated towns of Lizton, North Salem,
and Pittsboro. Tri-West Hendricks High School is situated about 20 miles west of Indianapolis and is the
only school in the district for grades 9-12. Tri-West High School was first occupied in the fall of 1975 by
grades 7 – 12 after the consolidation of North Salem, Lizton and Pittsboro High Schools. Tri-West has
undergone several renovations. The first was in 1983 when six classrooms were added to the east side of
the building. In 1998 the athletic area grew with the addition of a hallway that connecting to the new
wrestling and weight rooms. In January of 2003, a new middle school opened. The seventh and eighth
grades moved into their new facility at that time. The sixth grades from the elementary schools also moved
to the middle school facilities. In October of 2008 the high school started a major renovation project which
continued through December 2010. The remodeling included reconfigurations of space inside the building
two new science rooms, a music suite, auditorium, and auxiliary gym. A new elementary building, Pittsboro
Primary, also opened in Pittsboro in 2010 and houses Kindergarten through 2nd grade.
The Tri-West community is primarily agricultural with the majority of students living in a rural setting.
Although Hendricks County is considered one of the fastest growing counties in Indiana, the 80 square
miles comprising the North West Hendricks School Corporation District has only begun to see more rapid
growth in recent years. In fact, Steel Dynamics (formerly known as Qualitech Steel Corporation’s steel
mini-mill), which opened in August 1998, was the first significant industry in the area. The steel mini-mill
is finally running at its full capacity.
The Tri-West High School staff is composed of 33 certified teachers, 3 administrators and 18 classified
personnel. Our staff is committed to teamwork, which is necessary for Tri-West to run effectively each
day. The buildings and grounds are clean and well-maintained, reflecting student, staff, and community
pride. A well-rounded academic program is offered and available to all students. The overall atmosphere
of Tri-West and the community reflects pride and a real concern for academic excellence. The Indiana
Department of Education has frequently designated Tri-West High School a Four Star School, an honor
Tri-West has earned ten times and most recently for the 2013–2014 school year. In addition, Tri-West High
School was designated as “A Best Buy School” from the Indiana Chamber of Commerce.
It is the belief of the staff that every student is unique and each of them needs to be encouraged, guided,
and motivated to develop his or her full potential. The staff, parents, and administration work together and
make every effort to ensure that our students receive the maximum opportunity to obtain the tools that will
prepare them for a lifetime of learning. In 2013-14, 68% percent of our graduates pursued a post-secondary
education.

4
II.
Tri-West Hendricks Senior High School
Vision Statement
At Tri-West High School, we are driven by our vision to have the most sought after graduates by colleges, universities, the military, apprenticeships, and the work force!
Mission Statement
It is the mission of Tri-West Hendricks High School to learn academically, physically, and socially in order to adapt to an ever-changing world and contribute to society.
Tri-West Hendricks High School will Learn from the world, Adapt with the world,
Contribute to the world.
5
Mission Statement for North West Hendricks School Corporation
The North West Hendricks Schools provide an education that allows
all students to develop to their fullest potential while promoting
responsibility and the desire for lifelong learning.
Vision
The schools within the North West Hendricks School Corporation are
recognized statewide for their academic excellence. Students possess
skills which allow them to be proficient in the workforce and are able
to adapt to the ever-changing social challenges of society.
Core Values
Valuing employees and partners
Continuous improvement
Accountability
Teamwork
Alignment of Curriculum K – 12
High expectations
Data driven teaching and learning.

6
We Believe…
…a comprehensive program of education with curricula flexible enough to meet the students’ needs is
required.
…by providing students with the information, skills, and techniques essential for successful post-
secondary education.
…by making available learning experiences that provide students the opportunity to acquire skill and
fundamentals necessary for gainful employment.
…by providing students with the needed special assistance in order for them to be successful in school.
…by providing every student the opportunity to perform to his/her maximum potential through regular
and supplemental programs.
…critical and independent thinking using high order problem solving skills needs to be encouraged.
…communication skills need to be developed which will enable the student to effectively interact with others.
…students should develop a sense of awareness of the rights and responsibilities of citizenship.
…the development of high moral standards needs to be fostered.
…the students need to be prepared to anticipate, evaluate, adjust, and benefit from our ever-changing society.
…a comprehensive program of co-curricular activities needs to be provided to teach leadership,
sportsmanship, and an appreciation for leisure-time activities.
…that constant cooperation among, and interaction, with the community, school, and parents should be
fostered, making all aware of mutual and reciprocal benefits and responsibilities.
…opportunities need to be available for the expression of creativity, originality, and inventiveness.
…that one's inherent self-worth should be recognized.
…personal qualities that promote self-respect need to be nurtured.
…self-discipline needs to be developed.
…students should accept responsibility for and consequences of their actions.
…students should exhibit appropriate behavior, recognizing that different situations require different
standards of behavior.
…students should treat others with respect, recognizing their rights and privileges.
…there needs to be an understanding, respect and acceptance of individual and cultural differences.
…students should examine moral and ethical issues in order to make informed choices.
…students should develop a life-long respect for education.

7
III.
PROFILE
Quad-angulations of Data
(ECA, NWEA, SAT / PSAT and Survey)
Student ECA Algebra I Test Data for the Classes
of 2013 through 2018
Number of students Passed Failed % Passed
2013 162 148 14 91%
2014 147 140 7 95%
2015 149 143 6 96%
2016 146 142 4 97%
2017 145 137 8 94%
2018 37 36 1 97%
88%
89%
90%
91%
92%
93%
94%
95%
96%
97%
98%
2013 2014 2015 2016 2017 2018
% Passed
8
Student ECA English Test Data for the
Classes of 2013 through 2018
Number of students Passed Failed % Passed
2013 162 155 7 96%
2014 147 141 6 96%
2015 149 145 4 97%
2016 146 133 13 91%
2017 145 24 17%
2018 37 0%
0%
20%
40%
60%
80%
100%
120%
2013 2014 2015 2016 2017 2018
% Passed

9
Student ECA Biology 10
Test Data for the Classes of 2013 through 2018
Biology Number of students Took test Passed Failed % Passed
2013 162
2014 147 124 69 55 56%
2015 149 119 52 67 44%
2016 146 118 60 58 51%
2017 145
2018 37
0%
10%
20%
30%
40%
50%
60%
2013 2014 2015 2016 2017 2018
% Passed

10
NWEA Lexile Score Reading Level
Below 960
Above 960
Number
of students
Fall 2014 Class of 2018 67 89 57% 156
Fall 2013 Class of 2017 35 112 76% 147
Fall 2012 Class of 2016 56 96 63% 152
Fall 2011 Class of 2015 40 119 75% 159
Fall 2010 Class of 2014 53 86 62% 139
Grade Current
Band Lexile Band
K–1 N/A
2–3 450L–725L
4–5 645L–845L
6–8 860L–1010L
9-10 960L–1115L
11-12 1070L–1220L
0
0.2
0.4
0.6
0.8
Class of 2018 Class of 2017 Class of 2016 Class of 2015 Class of 2014
Percentage of students reading at 9th grade level
11
NWEA RIT Scores
MATH
Math 180-199 200-220 221-245 246+
Fall 2014 Class of 2018 3 16 81 57
Fall 2013 Class of 2017 1 15 94 38
Fall 2012 Class of 2016 0 18 93 40
Fall 2011 Class of 2015 2 18 79 37
LANGUAGE
Language 161-199 200-220 221-245 246+ Fall 2014 Class of 2018 3 31 120 3 Fall 2013 Class of 2017 4 29 107 8 Fall 2012 Class of 2016 3 42 103 5 Fall 2011 Class of 2015 2 36 91 4
0
20
40
60
80
100
Math 180-199 200-220 221-245 246+
MATH
Fall 2014 Fall 2013 Fall 2012 Fall 2011
0
50
100
150
Language 161-199 200-220 221-245 246+
LANGUAGE
Fall 2014 Fall 2013 Fall 2012 Fall 2011

12
READING Reading 156-199 200-220 221-245 246+
Fall 2014 Class of 2018 8 40 96 5
Fall 2013 Class of 2017 6 29 103 2
Fall 2012 Class of 2016 8 53 89 2
Fall 2011 Class of 2015 23 43 58 5
0
50
100
150
Reading 156-199 200-220 221-245 246+
READING
Fall 2014 Fall 2013 Fall 2012 Fall 2011

13
SAT / PSAT Data Analysis
PSAT
October 2013
Reading Math Writing
20 9 12 22
30 60 43 56
40 56 67 52
50 21 24 17
60 3 2 2
70 0 1
0
20
40
60
80
20 30 40 50 60 70
PSAT Results
Reading October 2013 Math October 2013 Writing
400
500
600
Reading Math Writing
SAT
SAT
TW State
SAT
Reading Math Writing
TW 481 496 459
State 493 500 477
14
SURVEY DATA ANALYSIS
The faculty and students at Tri-West High School completed a survey during January 2008, 2010, and 2012.
Our parents completed a similar survey during January 2010 and 2012. The student survey included 36
questions, faculty included 60 questions, and parents included 29 questions. The surveys addressed several
areas of our school including, administrative leadership, curriculum, instruction, monitoring student
progress, program evaluation, professional development, evaluation of school personnel, school climate,
and parent/community involvement. Students responded based on gender and grade level. Our faculty
responded based on gender and years of experience. Parent survey did not have a disaggregation
component. (Survey questions and results are included in the appendix). The following is a detailed analysis
of the strengths and needed areas of improvement, along with corresponding or differing results of the
groups.
2012-13 Students – Strengths (Areas above 80% for Strongly Agree and Agree combined)
The principal maintains open lines of communication with students, staff, and parents.
The principal sets aside time for basic instruction that is free from interruptions (e.g., intercom
messages, assemblies, etc.)
The principal in this school sets high standards and communicates those expectations to teachers,
students, and parents.
The principal is visible in the building and at school activities.
Teachers promote high learning expectations by starting session on time and continuing with
planned activity until the end of the period.
A system of student responsibility and accountability for work and other behavior is clearly
established on the first day.
Teachers are efficient in making assignments and providing materials during instruction.
Teachers indicate what they expect from students in order for achievement to occur.
Tri-West is a safe, secure, and orderly place to work and learn.
Weapon abuse by the students at Tri-West is not a problem
School events, such as athletic contests, musical and dramatic events, and social events, are well
attended by the faculty and students.
Teachers are available to work with students outside of regularly scheduled class time.
2010 Students – Needed areas of Improvement (Areas below 60% for Strongly Agree and Agree
combined)
Teachers in this school try to make learning interesting and fun.
The amount of homework is worthwhile in reinforcing and learning course objectives.
Students have input into the development and evaluation of school practices and policies.
Alcohol abuse by the students of Tri-West is not a major problem.
Drug abuse by the students of Tri-West is not a major problem.

15
2010 Teachers – Strengths (Areas above 90% for Strongly Agree and Agree combined)
All areas of administrative leadership, except one.
All areas of curriculum, except two.
Teachers sometimes change their lesson plans because of student needs and time constraints.
Teacher excellence is recognized through positive feedback and professional appreciations.
Students at Tri-West are challenged to reach their potential.
Teachers are responsive to students need for help.
Summaries of student performance are utilized by all staff to provide assistance for individual
learning needs.
Assessment results are used for instructional diagnosis and to determine if teaching methods are
working.
Each student has the opportunity to participate in school programs.
Tri-West has a written evaluation procedure which is used for the improvement process.
Tri-West participates in a systematic and comprehensive evaluation of all educational programs and
services.
School leaders inform parents and other community members of school and corporation activities.
Assessment results are used for instructional diagnosis and to determine if teaching methods are
working.
Staff evaluation includes input from staff and administration..
The principal regularly gives feedback to teachers regarding their instructional techniques.
Following a formal observation, the principal and teacher discuss the observation and together they
plan for instructional improvement.
Physical facilities are kept clean and made reasonable attractive; damage is repaired immediately
Weapon abuse by the student of Tri-West is not a major problem.
Decisions in this school are reached through a process in which staff members feel their views are
considered.
There are open channels of communication between students and staff and administration.
2010 Teachers – Weaknesses (Areas below 70% for Strongly Agree and Agree combined)
The written curriculum is the guide for all classroom instruction.
Objective based tests give administrators and teachers clear information about student achievement.
Specific program changes such as adjustments, improvements or terminations, have been made
based on student and/or program evaluations.
A professional library is available for staff to use.
The instructional staff is included in the planning and evaluation of professional development
programs.
The professional development programs are relevant and meet the needs of the staff.
Drug abuse by the students of Tri-West is not a major problem.
Student disciplinary action quickly follows infractions and is consistent with the policies stated in
the student handbook.

16
2010 Agreeing/Disagreeing Results from the two groups (Students/Teachers)
The principal in this school sets high standards and communicates those expectations to teachers,
students, and parents.
The principal sets aside time for basic instruction that is free from interruptions (e.g., intercom
messages, assemblies, etc.)
The principal maintains open lines of communication with students, staff, and parents.
The principal is visible in the building and at school activities.
Vandalism is not a problem at Tri-West.
Physical facilities are kept clean and made reasonably attractive; damage is repaired immediately.
Alcohol abuse by the students of Tri-West is not a major problem.
Drug abuse by the students of Tri-West is not a major problem.
2012-13 Parents – Strengths (Areas above 90% for Strongly Agree and Agree combined)
The facility is adequate for the needs of the students and programs.
Phone calls, newsletters, notes to and from home, e-mail, the school website, the homework hotline,
and conferences are ways that teachers communicate with parents.
Parents feel the overall school program is meaningful to their student.
Physical facilities are kept clean and made reasonably attractive; damage is repaired immediately.
Tri-West is a safe, secure, and orderly place to work and learn.
Student achievement for our school (i.e. standardize testing, NWEA testing, etc) are reported to
students and the general public.
The staff is visible in the building and at school activities.
2012-13 Parents – Weaknesses (Areas below 70% for Strongly Agree and Agree combined)
The staff extends the school’s learning environment beyond the school building.
Teachers are responsive to students’ needs for helping during class time.
Students are given specific feedback on classroom assessments in a timely fashion.
Student drug and alcohol use is a major concern at Tri-West.
Parent/Teacher interaction occurs at Tri-West on a regular basis.
Would participating in an active parent/faculty group be an interest to you?
The school encourages my student to read for pleasure.
2010 Overall Comparison for all three groups (Students/Teachers/Parents)
Strengths
The principal [staff] in this school sets high standards and communicates those expectations to
teachers, students, and parents.
The principal [staff is] visible in the building and at school activities.
There are open lines of communication between the faculty, staff, parents, and students.
Weaknesses
Vandalism is not a problem at Tri-West.
Physical facilities are kept clean and made reasonably attractive; damage is repaired immediately.
Alcohol abuse by the students of Tri-West is not a major problem.

17
Drug abuse by the students of Tri-West is not a major problem.
The facility is adequate for the needs of the student programs.
Strategies and goals addressing our strengths and areas of
improvement for the “quad”-angulation of data are located in
Section VII.

18
IV.
Student Data
The current enrollment at Tri-West High School totals 590 students in grades nine through twelve.
Since 2003, the average daily attendance rates for Tri-West High School have ranged from a low of 95%
in 2006 - 2007 to a high of 97.6% in 2004 - 2005. The most recent data shows that the 2013– 2014 rate is
96.7%. Overall, the rate has been fairly constant. The average attendance chart clearly shows that Tri
West High School’s attendance rates either exceeds or is very close to the state averages.
Within the student body, the current racial distribution is 96% Caucasian, 3% African American, and less
than one percent each of Multiracial, Asian, Native Hawaiian and American Indian. These numbers are
quite similar to previous years when the student racial distribution averaged around 98% Caucasian in
1998 and 98.4% Caucasian in 1997.
In the 2013 – 2014 school year the high school had a total of 48 suspensions and no expulsions. These
suspensions are a result of disruptions to the learning environment, tobacco, and/or insubordination.
Some of our students who have had disciplinary/behavior issues have the opportunity to take online
courses for credit if they are recommended for expulsion; however, alternative school opportunities are
given to those students who violate behavior policies and attendance policies rather than drug/alcohol
policies. The alternative school for Tri-West is Central Normal Campus, formally known as The
Opportunity House. The goal of this program is to return the student to Tri-West after one semester. This
is a cooperative effort with Danville and Mill Creek Community Schools. Each school is entitled to send
eight students per semester. During the 2013 – 2014 school year, 16 students from Tri-West have
attended the alternative school. A total of 123 students have attended since the 2005 – 2006 school year.
Since the 2006 – 2007 school year our special education enrollment has remained constant. The range of
students in the special education program was at a high of 64 for the 2013 - 2014 school year and a low of
48 for the current. Tri-West High School has very few students who receive educational services under
Section 504 of the Rehabilitation Act of 1973. Two percent of the total student enrollments during 2008–
2009 were classified for 504 services. Less than one percent were classified for 504 services for the 2013
– 2014 school year. Tri-West High School focuses on inclusion for all special education students who are
seeking to receive a diploma.
Students at Tri-West High School have the opportunity to take Advance Placement, Ivy Tech and Trine
University courses for college credit. The 132 students at Tri-West High School who participate in the
gifted and talented educational programs, now called L.E.A.P., has been very stable. The current school
year has 131 students enrolled in our eight advance placement courses, with AP U.S. History as the most
recent addition. This is an increase of 6 classes since the 2004 – 2005 school year. The current average is
approximately 22% of the student body enrolls in an AP course. District statistics indicate that students
normally fail to take advantage of the program as they approach the upper grades, but a weighted grading
scale has been employed to address this concern. The overall mean score for these students is 3.175.
Students have increased their scores over a two year period in two of the five test areas.

19
Ivy Tech Dual Credits may currently be earned by those students enrolled in Digital Design, Spanish II,
Spanish III, Introduction to Engineering, Principles of Engineering, Civil Engineering and Architecture,
Digital Electronics, Algebra II Honors, and Pre-Calculus. Trine University credits may be earned through
AP Biology and Physics classes. Beginning in 2012 – 2013 school year Dual Credits were awarded for
students enrolled in the Ivy Tech Professor on Loan Program. Forty five seniors enrolled in ENGL 111,
ENGL112, COMM 101, PSYC101, and SOCI111 the first year this was offered.
Tri-West High School operates on a traditional seven period day four of the five days each week.
Wednesday’s daily schedule begins at 8:50 A.M. The regular school day begins at 8:15 A.M. and
concludes at 3:20 P.M. The current number of students enrolled in each of the curriculum areas has
shown an increase from 2003 to 2013. The Engineering and Technology department has shown the most
dramatic increase. Besides Engineering and Technology, the departments that have the highest
enrollment of students include Foreign Language, Business and Family and Consumer Sciences. Those
departments with the lowest student enrollment include Music and Visual Art. The increase and decrease
in these areas were due to new courses being offered and a decrease in the number of elective courses
being offered.
Students generally perform well and achieve high academic marks at Tri-West High School. Tri-West
averages students’ grade point averages on a 4.0 scale. The following grading scale is used at Tri West
High School:
A+ 100% 4.0 C+ 78 %- 79% 2.33
A 93% - 99% 4.0 C 73% - 77% 2.00
A- 90% -92% 3.67 C- 70% - 72% 1.67
B+ 88% - 89% 3.33 D+ 68% - 69% 1.33
B 83%- 87% 3.0 D 63% - 67% 1.0
B- 80% - 82% 2.67 D- 60% - 62% .67
F Below 60% 0
For the 2010 school year the grading scale was adjusted as reflected above. In addition to weighted
grades for advanced placement courses, honor courses and dual credit courses were weighted.
This scale is a standard of performance and expectations for all students. Students perform well and are
recognized for their superior and outstanding work on the Honor Roll.
2009- 2010 2010-2011 2012-2013 2013-2014
GPA of 4.0 3% 5% 12% 11.2%
GPA of 3.0-3.99 40% 51% 51% 53.4%
GPA of 2.0-2.99 40% 36% 30% 25.6%
GPA of 1.0-1.99 13% 7% 7% 6.8%
GPA of less than 1.0 4% 1% 0% 0%
2008 - 2009 2009 – 2010 2010 - 2011 2012-2013 2013-2014
Core 40 graduates 47% 52% 48% 50% 45%

20
Academic Honors 46% 28% 36% 30% 29%
Number of
students pursuing
higher education
4 year degree 80% 80% 69% 50% 58.45%
2 year degree 2% 2% 13% 15.4% 9.86%
Vocational 10 10% 9% 6.8% 9.86%
Military,
Workforce 8% 8% 9% 15.4% 21.84%
21
V.
INSTRUCTIONAL DATA
Tri-West High School divides the school year into two semesters with each semester divided into two
nine-week grading periods. The school day consists of seven periods at 49 minutes each, a 25-minute
lunch and a 18-minute flex period which includes our Bruins’ Read (sustained reading program once a
week), and our Bruin Time, 3 times a week, where students seek additional assistance, make up tests or
quizzes, and organizational meetings can be held. In addition the Word of the Week, Quote of the Week
and On this day in History is given each day during the morning announcements.
The course description guides for high school classes are located in the guidance office, the principal’s
office, and the district administration center. The curriculum for each course can be found in the principal’s
office or at the district administration center.
The high school students have an opportunity to take a variety of college preparatory classes as well as
honors classes. Students are offered AP classes in Biology, Chemistry, Calculus, English, Art, U.S.
History, and Spanish 4. Students can complete dual credit courses at Tri-West High School, Area 31, on
college campuses, and other high schools. Students in the high school classes are also offered regular and
advanced English/Literature courses as well as traditional sequential courses in Math, Science, Social
Studies, and Spanish. Courses are also offered in the areas of Business Education, Family and Consumer
Sciences, Fine Arts, Technology, and Physical Education. In addition, students are offered vocational
courses from the Technical Education Area 31 program. Since the fall of 2005, students have been
offered the Project Lead the Way program. It begins with the Introduction to Engineering and has since
added the rest of the series.
Beginning with the class of 2004, students obtaining a diploma from Tri-West need at least 43 credits.
These credits must include eight in English, four in Social Studies, four in Science, four in Mathematics,
three in Physical Education / Health, two classes in Business, Interpersonal Relations, and the remaining
17 in electives. Students may also obtain a Core 40 Diploma, Technical Honors Diploma (47 credits) or
the Academic Honors Diploma (48 / 49 credits).
An after-school tutoring program has been used for five years to assist our students who have not passed
the ECA test. In these individual or small group sessions, students review their prior tests, receive
suggestions, and work on sample problems to aid them in developing the skills needed to pass ECA.
Our National Honor Society students hosts both a before and after school tutoring opportunity which is
available for all students. Students may attend the sessions on a regular or one time basis, for assistance
with classroom assignments, projects, or assessments. These sessions have had numerous students take
advantage of the opportunity on a regular basis. Students have received assistance in all classes but
primarily in the areas of Math, Language Arts, and Science. Several of our teachers offer study sessions
prior to assessment dates for student to seek additional clarification on assessment related items.
Tri-West High School offers several co-curricular activities for our students. Sporting activities for the
boys include: football, cross-country, soccer, golf, basketball, swimming, wrestling, baseball, and track.

22
Girls are offered cross-country, cheerleading, soccer, volleyball, swimming, basketball, golf, softball, and
track. Additional co-curricular opportunities include: high school student council, marching band, color
guard, choir, drum line, thespians, spell bowl, French & Spanish clubs, service club, school yearbook -
Reflections, and National Honor Society
The Tri-West Media Center tries to fill the void created by the lack of a community library. This void is
filled by encouraging and providing recreational reading while supporting the school curriculum. The
Media Center offers students and staff recreational books, research material, educational videos through
the Online Resource – Mediacast. Our Media Center catalog (OPAC) is available for students and staff
through the Tri-West High School’s home page.
Students have access to thirty-two computer stations in the media center. These computers are used for a
wide variety of assignments such as research, preparing classroom papers, PowerPoint design, Internet
research, and accessing the different electronic subscriptions available for student use. Teachers schedule
the computers and the use of the media center facilities for different classroom activities.
Tri-West High School currently has five additional computer labs. Three of the labs are used primarily
for the Engineering, Art, Business and Yearbook classes. Teachers make arrangements to use the other
computer labs for classroom assignments and exploration.

23
VI.
Community Data
COMMUNITY OVERVIEW
North West Hendricks has operated as a school unit since July 1, 1965. The corporation currently has an
enrollment of 1,921 students with an annual operating budget over $10 million.
http://www.hendricks.k12.in.us//.
North West Hendricks School Corporation is located in rural Hendricks County in central Indiana. The
school district includes the townships of Eel River, Middle and Union and the incorporated towns of Lizton,
North Salem, and Pittsboro, with a total land area of 80 square miles. North West Hendricks is bordered to
the north by Boone County, the east by the town of Brownsburg and Brown Township, the west by Putnam
and Montgomery Counties, and the south by Marion, Center and Washington Townships of Hendricks
County.
The school corporation has been in operation since July 1, 1965 and is governed by five elected board of
school trustee members. The schools encompassed by North West Hendricks Schools include:
2013-20014 2014-2015
North Salem Elementary School Grades K – 5 Enrollment of 248 Enrollment of 249
Pittsboro Primary Grades K - 2 Enrollment of 320 Enrollment of 289
Pittsboro Elementary School Grades 3 - 5 Enrollment of 291 Enrollment of 295
Tri-West Middle School Grades 6 - 8 Enrollment of 472 Enrollment of 451
Tri-West High School Grades 9 – 12 Enrollment of 590 Enrollment of 598
The eastern side of the district is experiencing substantial residential growth with several new housing
additions recently added near Pittsboro and several more currently under construction. The extension of
Indianapolis city water to Lizton has promoted new growth around the town of Lizton.
WORKFORCE
The population of Hendricks County has increased steadily over the past decade in this predominately
agricultural community.
The major employer in the area is Steel Dynamics Corporation; however, the Indianapolis metropolitan
area is within 20 to 30 minutes driving time.
Surveys indicate that more than two thirds of Hendricks County residents commute to jobs outside the
county, principally within the Indianapolis metropolitan area.

24
The commute is easily accessible via Interstate 74, which extends east to west across the northeast edge of
the school district. It connects Danville, Illinois to the west with Indianapolis to the east.
Other arteries of transportation include
US Highway 136
(running parallel to I-74 serving Lizton, Pittsboro and Brownsburg)
State Road 39
(running N-S through the center of the county, intersecting I-74, US 136 and Lizton)
State Road 267
(extending N-S on the eastern edge of the county, intersecting I-74, I-65, US 136, and
Brownsburg.)
http://www.hendricks.k12.in.us/district/community.htm
SCHOOLS
All schools are commissioned and have full accreditation from the Indiana Department of Education.
There are four in the district.
North Salem Elementary School (K-5) -- serves students in North Salem (Eel River township)
and Lizton (Union Township)
Pittsboro Elementary School (3 – 5) and the Primary School (K-2) -- serves students in Pittsboro
(Middle Township)
Tri-West Middle School (6-8) -- serves students from the whole district
TECHNOLOGY
There is a strong belief that technology can be an excellent tool for delivery of curricular resources.
Technology is a powerful force in breaking down the traditional school barriers, exposing students to the
various learning opportunities the world has to offer.
Every classroom has a Promethean Board or ceiling mounted LCD projector which teachers utilize on a
daily basis through their networked workstation. In addition we have five carts ranging from 15 to 30
netbooks each which instantly turn a classroom into a computer lab. Our staff is currently working with
BYOD (Bring Your Own Device) activities in their classroom. The Wi-Fi capability was improved over
the summer as more Wi-Fi antennas were placed throughout the building.
Tri-West High School is committed to providing a technology-rich learning environment that encourages
innovative approaches to school improvement. The online program, My Big Campus, is currently being
used by our staff to provide online curriculum, assignments, and assessments. Students have the ability to
retrieve classroom assignments and then submit completed assignments to their teachers. This program

25
also gives the students the ability to work in groups and share their work / project with other students in
the group.
Students have access to state-of-the-art computer applications as well as the Internet through the use of
three computer labs in the Art, Business, and Project Lead the Way curriculum areas. In addition, there are
three labs available for teacher and student use throughout the day.
The availability of telephones and email at each teacher’s desk improve the communication between teacher
and parents. By our teachers using Harmony, our student management software, students and parents are
able to check on grades, attendance, and behavior. Assignments and lesson plans can be found in the same
location.
Student email accounts were recently developed for students to communicate with their teachers and other
students who they are working with on group projects. These email accounts do not have access to
anyone outside the North West Hendricks School Corporation.
The school website allows the community to see what is happening at Tri-West as well as directly contact
teachers and staff through the email links. The website has also proved to be a valuable tool to communicate
closings and delays.
SPECIAL SCHOOL PROGRAMS
The corporation provides a High Ability (LEAP) program at each of its schools.
Additional educational services are provided to students through the Boone-Clinton-North West Hendricks
Special Education Cooperative,
Tri-West High School sends approximately 8% of its student population to a Vocational Program. Our
students have the opportunity of attending one of two programs. Ben Davis High School, in Indianapolis,
houses the Area 31 program. Here our students attend courses in Automotive Service Technology, Building
Grades, Cisco Networking Academy, Cosmetology, Culinary Arts, Early Childhood Education, Health
Occupations, Heating and Air Conditioning, Pre-Occupations, and Radio and TV Broadcasting. Those
students who desire agricultural training attend Danville High School for their program.

26
EXTRA-CURRICULAR
Tri-West students have the opportunity to participate in many activities outside of school hours.
The Tri-West Athletic department sponsors activities in football, volleyball, soccer, cross-country,
basketball, swimming, wrestling, baseball, softball, track and golf.
The Tri-West Music and Fine Arts Departments offer, Marching Blue Alliance, Rock Ensemble, Variety
Show, School Play, Dance Team and other performing opportunities for students.
Various school- and community-sponsored activities include Fellowship of Christian Athletes, Student
Council, National Honor Society, 4-H, Boy and Girl Scouts, various church youth organizations and others.
COMMUNITY/PARENT SUPPORT GROUPS
Tri-West enjoys the support of many parent support groups including the Quarterback Club, Basketball
Boosters (Boys and Girls), Swim Boosters, Band Boosters, Post Prom Committee, and others.
The PAWS (Parents Always Willing to Serve) parent group began in the Fall of 2010. This group of over
75 parents assists with supervision, communication, and sponsor events for our teachers and staff. The
group is represented on our school improvement team (Data Team).
FUTURE
It is projected that approximately 75% of outgoing seniors will locate outside the school district within four
years of graduation. This will be due either to their seeking higher education or seeking employment in
more urban areas. This “out-migration” will be offset by an “in-migration” of primarily young families
resulting in a gradual growth in population over the next several years.1
Alumni have the choice of seeking employment in the Indianapolis metropolitan area, attending one of
several vocational, technical, or trade schools located in the immediate area, or attending one of 12 colleges
or universities located within 55 miles of the district.
1Feasibility Study For North West Hendricks School Corporation, Performance Service’s Team, March 1,
2005.
http://www.hendricks.k12.in.us/district/community.htm
27
VII.
Tri-West High School Improvement Plan
2011-12, 2012-13, 2013-14, and 2014-2015
Focus on the Vital few to impact the Essential many!
Goal #1: Students will improve reading skills.
Students will…
…be able to comprehend what they have read.
…demonstrate comprehension through demonstration, using a variety of
in-class assessments; for example, verbal explanation, writing, power point, creative
rendering).
…be able to read aloud, demonstrating correct pronunciation, smoothness,
clarity, and rhythm.
…be able to “research read” effectively and efficiently.
School-Wide Strategies:
Continue and enhance curriculum maps, quarterly assessments, and standards item
analysis.
Continue and enhance the Bruin’s Read Program.
Continue and enhance differentiated instruction and Understanding by Design.
Read aloud frequently, with every student selected as a reader.
Continue and enhance the development of content area vocabulary (Word Walls).
Provide significantly more teacher demonstration of reading aloud.
Continue and enhance the use of bell ringers for reteaching state standards.
Implement Marzano’s HYIS (High Yield Instructional Strategies)
Monitoring:
NWEA, End of Course Assessments (Algebra and English 10)
Quarterly Assessments
Grades
PSAT, SAT, and ACT scores
Graduation Rate
Attendance Rate
Surveys
Classroom data graphs
TAP Talks

28
Goal #2: Students will improve writing skills.
Students will…
…be able to write a well-organized essay in any appropriate content area.
…be able to take notes effectively and in an organized fashion, enabling
the student to study more effectively and to enhance writing
organization skills.
…be able to organize an outline specific to a research project, presentation
or essay.
…be able to write with an acceptable standard of technical skill regarding
components of sentence structure, patterns, punctuation, grammar,
spelling, clarity and neatness.
School-Wide Strategies:
Continue and enhance the 6+1 Writing Traits program in all curricular areas.
Continue and enhance curriculum maps, quarterly assessments, and standards item
analysis.
Continue and enhance differentiated instruction and Understanding by Design
Require outlines for some essays and all major papers and presentations.
Apply significantly more short essays for assessments.
Teach and reinforce how to outline and organize writing.
Spend significantly more class time writing and talking about writing.
Implement more journaling and/or expand journaling in specific areas.
Emphasize appropriate writing mechanics with all writing by students; not just with
specific assignments.
Continue and enhance the use of bell ringers for reteaching state standards.
Implement Marzano’s HYIS (High Yield Instructional Strategies)
Monitoring:
NWEA, End of Course Assessments (Algebra and English 10)
Quarterly Assessments
Student journals/notebook entries
Grades
PSAT, SAT, and ACT scores
Graduation Rate
Attendance Rate
Surveys
Classroom data charts
TAP Talks
Goal #3: Students will improve study skills and problem solving skills.
Students will…

29
…be able to learn different methods for studying, taking into account
different learning styles.
…be able to study more effectively for different content areas.
…be able to apply correct study skills for different types of learning
(tests, homework, projects, discussion, etc.)
School-Wide Strategies:
Continue and enhance Freshmen test taking skills sessions.
Before and after school teacher directed help sessions on specific course content.
Continue and enhance the NHS peer tutoring opportunities.
Continue and enhance the Freshmen Mentoring program and the At-risk adult
mentor program.
All teachers will teach students different methods of how to study at the beginning
of the year, including in this instruction effective ways of study based on research,
personal inventories, handouts, brochures, and discussion.
Discuss effective study methods in the specific content area.
Discuss components of effective learning retention, such as note-taking, listening,
using study guides, personal preferences/learning style, using homework, and
environment needed for optimum learning.
Discuss study for short-term versus long-term learning and retention and skills and
practice needed for both.
Provide information regarding test anxiety.
Emphasize purpose of different standardized tests (NWEA, GQE, PSAT, SAT,
PLAN, ACT) and different strategies to prepare for these.
Monitoring:
NWEA, End of Course Assessments (Algebra and English 10)
Quarterly Assessments
Problem of the Week Inventory
Grades
PSAT, SAT, and ACT scores
Graduation Rate
Attendance Rate
Surveys
Classroom data charts
TAP Talks
BYOD (Bring Your Own Device)
A committee to oversee the Study Skills and look for way to enhance.
30
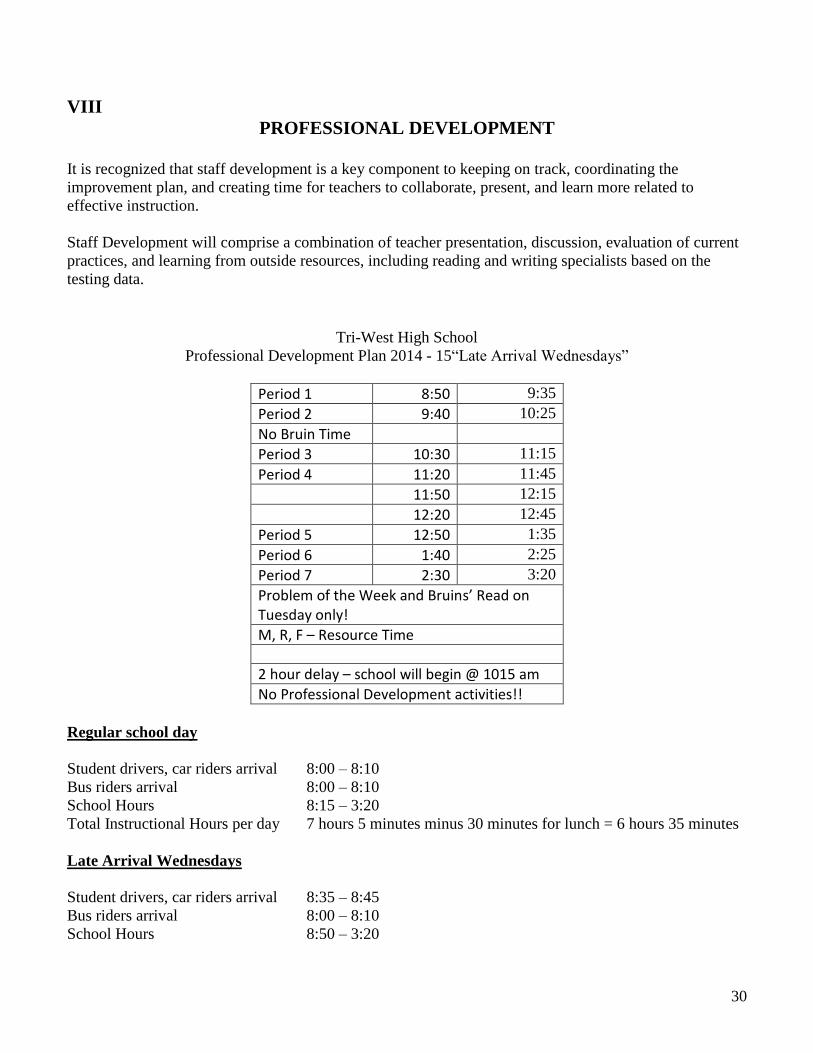
VIII
PROFESSIONAL DEVELOPMENT
It is recognized that staff development is a key component to keeping on track, coordinating the
improvement plan, and creating time for teachers to collaborate, present, and learn more related to
effective instruction.
Staff Development will comprise a combination of teacher presentation, discussion, evaluation of current
practices, and learning from outside resources, including reading and writing specialists based on the
testing data.
Tri-West High School
Professional Development Plan 2014 - 15“Late Arrival Wednesdays”
Period 1 8:50 9:35
Period 2 9:40 10:25
No Bruin Time
Period 3 10:30 11:15
Period 4 11:20 11:45
11:50 12:15
12:20 12:45
Period 5 12:50 1:35
Period 6 1:40 2:25
Period 7 2:30 3:20
Problem of the Week and Bruins’ Read on Tuesday only!
M, R, F – Resource Time
2 hour delay – school will begin @ 1015 am
No Professional Development activities!!
Regular school day
Student drivers, car riders arrival 8:00 – 8:10
Bus riders arrival 8:00 – 8:10
School Hours 8:15 – 3:20
Total Instructional Hours per day 7 hours 5 minutes minus 30 minutes for lunch = 6 hours 35 minutes
Late Arrival Wednesdays
Student drivers, car riders arrival 8:35 – 8:45
Bus riders arrival 8:00 – 8:10
School Hours 8:50 – 3:20

31
Total Instructional Hours per day 6 hours 30 minutes minus 30 minutes for lunch = 6 hours
On late arrival Wednesdays, our teaching staff of professionals will be actively engaged in professional
development activities, meetings, professional learning communities, parent/teacher conferences, and
special education case conferences from 8:00 – 8:40. Classified staff, administrators, potentially a couple
teachers, and/or parent volunteers will be assigned supervision of student arrival and activities in the
cafeteria/student commons areas.
NHS students will be available for peer tutoring in the cafeteria. NHS students will be available for
Literacy Leaders at the other buildings.
Teachers will NOT be engaged in activities which can take place during their daily preparation period.
General Overview “Plan, Do, Study, Act” – Continuous Improvement
August Primary Activity Secondary Activity
6 Regular Arrival- Opening Day NA
13 School Improvement Committees NA
20 All Staff Best Practice Discussion NA
27 Data Team
PLC's(Grade Level/Team Teaching
Groups)
September
3 Academic Department Meetings BYOD App/Program Share
10 Department Leaders Meeting
MBC digital content upload- Media
Center
17 School Improvement Committees NA
24 All Staff Best Practice Discussion NA
October
1 Academic Department Meetings BYOD App/Program Share
8 Department Leaders Meeting MBC digital content upload
22 All Staff Best Practice Discussion NA
29 Career Day- All Staff Meeting NA
November
5 Academic Department Meetings BYOD App/Program Share
12 Department Leaders Meeting MBC digital content upload
19 Data Team
PLC's(Grade Level/Team Teaching
Groups)
26 Superintendent Talk NA
December
3 All Staff Best Practice Discussion NA
10 Academic Department Meetings BYOD App/Program Share
17 Department Leaders Meeting
MBC digital content upload

32
January
7 Academic Department Meetings BYOD App/Program Share
14 Department Leaders Meeting
MBC digital content upload- Media
Center
21 All Staff Best Practice Discussion NA
28 Data Team
PLC's(Grade Level/Team Teaching
Groups)
February
4 Academic Department Meetings BYOD App/Program Share
11 Department Leaders Meeting
MBC digital content upload- Media
Center
18 School Improvement Committees NA
25 All Staff Best Practice Discussion NA
March
4 Academic Department Meetings BYOD App/Program Share
11 Department Leaders Meeting
MBC digital content upload- Media
Center
18 Data Team
PLC's(Grade Level/Team Teaching
Groups)
25 All Staff Best Practice Discussion NA
April
8 Academic Department Meetings BYOD App/Program Share
15 Department Leaders Meeting
MBC digital content upload- Media
Center
22 Superintendent Talk NA
29 All Staff Best Practice Discussion NA
May
6 Academic Department Meetings BYOD App/Program Share
13 Department Leaders Meeting
MBC digital content upload- Media
Center
20 All Staff Best Practice Discussion NA

33
Quarterly Assessment (QA’s) Protocol 2014-15
2014-15 QA Schedule
Monday Tuesday Wednesday Thursday Friday
1st 9 weeks
Oct. 6th-10th Science Math Related Arts Social Studies
Language Arts
2nd 9 weeks
Dec. 17-19 1st Semester Final Exams
1st Semester Final Exams
1st Semester Final Exams
3rd 9 weeks
Mar. 9-13 Social Studies
Language Arts
Science Math Related Arts
4th 9 weeks
May 19-21 2nd Semester Final Exams
2nd Semester Final Exams
2nd Semester Final Exams
Math - Algebra I, Algebra II, Geometry, Trigonometry, Pre-Calc
Science - Biology, Chemistry, Physics
Language Arts - English 9, 10, 11, 12
Social Studies - US Government, US History, World History
Teachers are using scantrons, Odyssey and My Big Campus to check the students’ growth.
Department Meeting in the department leaders room
PLC's Team Teaching/Grade Level Teams - In leader's room (*)
Team Teaching Teams (8:00 - 8:20) Grade Level Teams (8:20 - 8:40)

34
PLC's Team Teaching Members Grade Level Teams
LA Math 9th 10th
Terew Kern Young Bontreger
Pemberton Castrataro West Small
Bontreger West Farmer Kern
Young Gobel Dennis Begle
Cialkowski Muchler Coll Hall
Rogers Cialkowski
Harris Love
Science Social Studies Wiley Mulpuri
Wiley Marshall Gobel
Mulpuri Diagostino Muchler
Small Love
11th 12th
Rinker Rinker Terew Pemberton
Linn Diagostino Marshall
Hobaugh Hahn
Life Skills Dual Credit Gill Mendenhall
Gill Stroup Terrell Stroup
Coll Terrell Castrataro Dorrell
Farmer Harris
Rogers Hobaugh
Kurihara Mendenhall
Dorrell Hall
Begle Acton
Dennis

35
Accountability
The principal, through quarterly collaboration with the Data Team, will be responsible for keeping the
school on track overall with the school improvement plan and provide the superintendents with
documented evidence.
The principal will provide teachers with disaggregated data of students scoring below desired
achievement levels.
All teachers will collaborate with our colleagues on how they implemented strategies for the three
primary goals in collaboration with the building principal annually. Differentiated Instruction and
Understanding by Design will be discussed.
First and second year teachers will be required to submit one UBD and Differentiated Instruction plan on
the form available once each semester.
The Data team and department leaders, consisting of administrators, teachers, and parents/community
members, will coordinate the yearly staff development programs.

36
APPENDIX

Response to Intervention (RTI)
TIER 1 (CORE)
Core Curriculum (General, Honors, AP)
ISTEP+, End of Course Assessments (Algebra I, English10, Biology 1)
Standards aligned instruction (Curriculum Maps)
Quarterly Assessments
NWEA testing Grade 9
Sustained Silent reading program (SSR)
Writing Prompts
Collins Writing Program / 6 + 1 Writing Traits
Freshmen Mentoring Program
TIER II (Targeted)
Resource Study Hall
Reading Assessments (Weekly)
Quarterly Assessments Benchmarks
NHS tutoring/mentoring
Peer Tutoring
Adult Mentoring Program
Summer School Credit Recovery
TIER III (Intense)
Credit Recovery (IOA, CNC)
Cummins Mental Health
Special Education Services recommendation

Marzano’s (Nine) High-Yield Instructional Strategies
By Robert J. Marzano
Adapted from the book: Classroom Instruction that Works: Research-based
Strategies for Increasing Student Achievement, by Robert Marzano (2001)
High Yield Instructional
Strategies
What the Research says: How it looks in the Classroom:
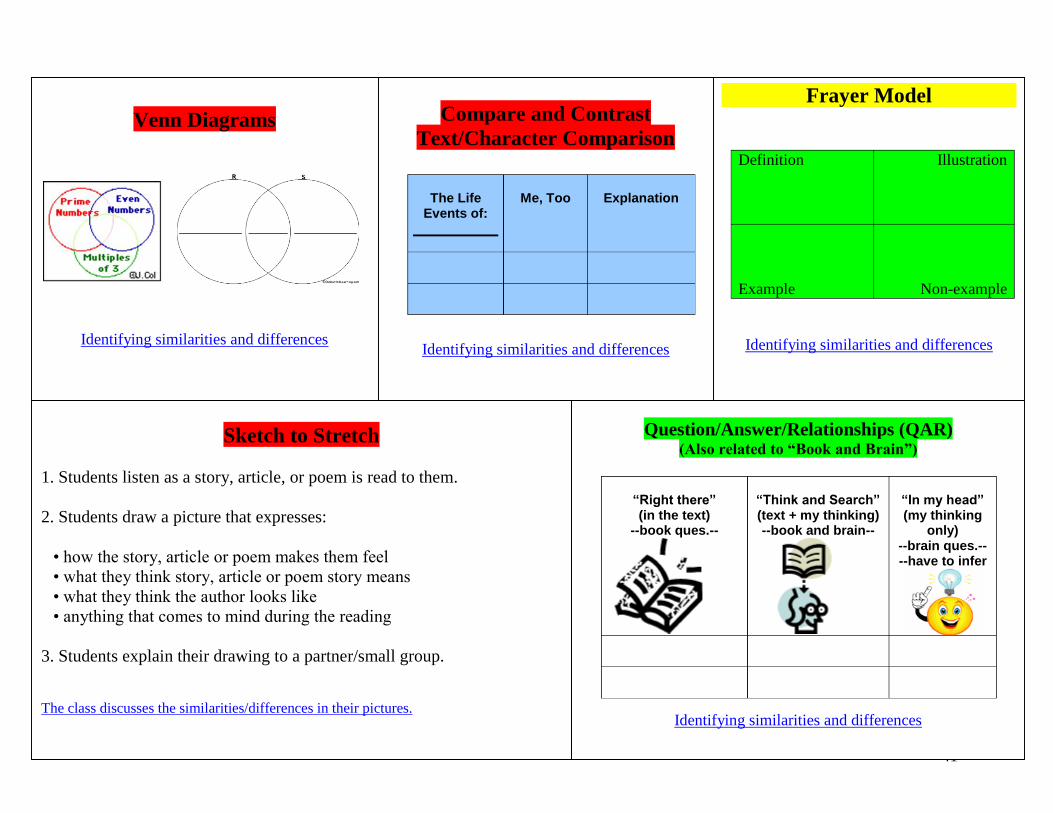
Identifying similarities and
differences
(Yields a 45 percentile gain)
Students should compare, classify, and create
metaphors, analogies and non-linguistic or
graphic representations
Thinking Maps, T-charts, Venn diagrams,
classifying, analogies, cause and effect links,
compare and contrast organizers
QAR (Question/Answer/Relationship), sketch to
stretch, affinity diagrams, Frayer model (see
below)
Summarizing and note taking
(Yields a 34 percentile gain
Students should learn to eliminate unnecessary
information, substitute some information, keep
important information, write / rewrite, and
analyze information. Students should be
encouraged to put some information into own
words.
Teacher models summarization techniques, identify
key concepts, bullets, outlines, clusters, narrative
organizers, journal summaries, break down
assignments, create simple reports, quick writes,
graphic organizers, column notes, affinity
diagrams, etc.
Reinforcing effort and providing
recognition
(Yields a 29 percentile gain)
Teachers should reward based on standards of
performance; use symbolic recognition rather
than just tangible rewards.
Hold high expectations, display finished products,
praise students’ effort, encourage students to share
ideas and express their thoughts, honor individual
learning styles, conference individually with students,
authentic portfolios, stress-free environment, high-
fives, Spelling Bee, Constitution Day, School
Newspaper, etc.
Homework and practice
(Yields a 28 percentile gain)
Teachers should vary the amount of homework
based on student grade level (less at the
elementary level, more at the secondary level),
keep parent involvement in homework to a
Retell, recite and review learning for the day at home,
reflective journals, parents are informed of the goals
and objectives, grade level teams plan together for
homework distribution; SLCs; teacher email.

39
minimum, state purpose, and, if assigned,
should be debriefed.
Nonlinguistic representations
(Yields a 27 percentile gain)
Students should create graphic representations,
models, mental pictures, drawings, pictographs,
and participate in kinesthetic (hands-on)
activities in order to assimilate knowledge.
Visual tools and manipulatives, problem-solution
organizers, spider webs, diagrams, concept maps,
drawings, charts, thinking maps, graphic organizers,
sketch to stretch, storyboards, foldables, act out
content, make physical models, etc.
Cooperative learning
(Yields a 23 percentile gain)
Teachers should limit use of ability groups,
keep groups small, apply strategy consistently
and systematically but not overuse. Assign roles
and responsibilities in groups.
Integrate content and language through group
engagement, reader’s theatre, pass the pencil, circle
of friends, cube it, radio reading, shared reading and
writing, plays, science projects, debates, jigsaw,
group reports, choral reading, affinity diagrams,
Students tackle TAKS word problems in groups and
explain their answers, etc.
Setting objectives and providing
feedback
(Yields a 23 percentile gain)
Teachers should create specific but flexible
goals, allowing some student choice. Teacher
feedback should be corrective, timely, and
specific to a criterion.
Articulating and displaying learning goals, KWL,
contract learning goals, etc. Teacher can display
objectives on the in-focus projector and follow-up on
the mastery of the objective at the end of the lesson.
Generating and testing hypothesis
(Yields a 23 percentile gain)
Students should generate, explain, test and
defend hypotheses using both inductive and
deductive strategies through problem solving,
history investigation, invention, experimental
inquiry, and decision making.
Thinking processes, constructivist practices,
investigate, explore, social construction of
knowledge, use of inductive and deductive reasoning,
questioning the author of a book, finding other
ways to solve same math problem, etc.
Questions, cues, and advance
organizers
(Yields a 22 percentile gain)
Teachers should use cues and questions that
focus on what is important (rather than
unusual), use ample wait time before accepting
responses, eliciting inference and analysis.
Advance organizers should focus on what is
important and are more useful with information
that is not well organized.
Graphic organizers, provide guiding questions
before each lesson, think alouds, inferencing,
predicting, drawing conclusions, skim chapters to
identify key vocabulary, concepts and skills,
foldables, annotating the text, etc.

40
Cause and Effect Links
A cause is something that makes something else happen. Out of two events,
it is the event that happens first. To determine the cause, ask the question "Why did it happen?"
--------------
An effect is what happens as a result of the cause. Of two related events,
it’s the one that happens second or last. To determine the effect, ask the question "What happened?"
---------------
At times conjunctions (connecting words) are used to link the cause and effect.
Examples of common conjunctions (connecting words) are: --------------------
since as a result because the cause of
therefore consequently due to the fact nevertheless
the reason for thus so has led to
due to + noun phrase because of +noun phrase
Identifying similarities and differences
HIGH-YIELD INSTRUCTIONAL
STRATEGIES SIMILARITIES AND DIFFERENCES
There are four basic types of tasks that
focus on identifying similarities and
differences for knowledge
development:
Comparing
Classifying
Creating Metaphors
Creating Analogies
Identifying similarities and differences
T-Chart
Looks like………...Sounds like
Cause……………..Effect
Compare…………...Contrast
Pro…………….Con
Identifying similarities and differences
Comparison Matrix
Name 1 Name 2
Attribute 1
Attribute 2
Attribute 3
Used to show similarities and differences
between two things (people, places, events,
ideas, etc.).
Key frame questions: What things are being
compared?
How are they similar? How are they
different?
Identifying similarities and differences
41
Venn Diagrams
Identifying similarities and differences
Compare and Contrast
Text/Character Comparison
The Life Events of:
Me, Too
Explanation
Identifying similarities and differences
Frayer Model
Definition
Illustration
Example
Non-example
Identifying similarities and differences
Sketch to Stretch
1. Students listen as a story, article, or poem is read to them.
2. Students draw a picture that expresses:
• how the story, article or poem makes them feel
• what they think story, article or poem story means
• what they think the author looks like
• anything that comes to mind during the reading
3. Students explain their drawing to a partner/small group.
The class discusses the similarities/differences in their pictures.
Question/Answer/Relationships (QAR) (Also related to “Book and Brain”)
“Right there” (in the text)
--book ques.--
“Think and Search” (text + my thinking) --book and brain--
“In my head” (my thinking
only) --brain ques.-- --have to infer
Identifying similarities and differences

Creating Analogies
Analogies help us see how seemingly
dissimilar things are similar, increasing
our understanding of new information.
Ex: core is to earth as nucleus is to atom.
Thermometer ...is to...Temperature
as
odometer ...is to...speed
(Both measure things)
Identifying similarities and differences
Classifying
__ate family __at family
Sort the word cards (or pictures)
into the correct bucket.
Identifying similarities and differences
Comparing Frame
FRACTIONS and DECIMALS are similar
because they both
_______________________________
_______________________________
_______________________________
FRACTIONS and DECIMALS are different
because
fractions ________, but decimals ________.
fractions ________, but decimals ________.
fractions ________, but decimals ________.
Identifying similarities and differences

Word Walls Key words (5-8) of study will be displayed on a bulletin board (ideal), white board, chalk board, door,
wall, or cabinet. Students should be able to pronounce the words, spell the words, use the word in a
sentence, and define the word. Word Walls may be displayed for one month at a time, but more frequent
changes build vocabulary.
A student’s comprehension increases by 33 percent when direct vocabulary instruction is provided on
specific words while reading. (Marzano, 2004)
Bell Ringers (Re-teaching)
An activity should be posted on the board for the students to begin completing upon entering the
classroom. The bell ringer engages and gets students on task at the beginning of the instructional period.
The activity should be easily completed without any prompting or instruction from the teacher. The
activity should be a question, prompt, or comment regarding previously taught and assessed content in
which the majority of students did not master.
For example: Compare and contrast, solve, reflect, predict, identify, explore, create, develop
Effective teachers guard instructional time as their most precious resource, packing as much as they can
into class time. (Wong, 2005)

44
Team Teaching
To create a professional learning community, focus on learning rather than teaching, work collaboratively,
and hold yourself accountable for results.
As we progress forward, every professional in the building must engage with colleagues in the ongoing
exploration of three crucial questions that drive the work of those within a professional learning community:
• What do we want each student to learn?
• How will we know when each student has learned it?
• How will we respond when a student experiences difficulty in learning?
“If the students did not master it, what can I discern? Where do we go from here?”
“If all students mastered it, what can I discern? Where do we go from here?”
Collaborative teacher conversations must quickly move beyond “What are we expected to teach?” to “How
will we know when each student has learned?”
1. Each teacher and course sharing about upcoming tests, quizzes, projects, and assignments for the
month.
2. Each Special Ed teacher/aide sharing concerns about content and items above.
3. Open discussion about student performance on tests, quizzes, projects, and assignments.
4. Open discussion about student study skills, strategies, etc.
5. Open discussion about work habits, behavior concerns, task completion, etc.
Identify common themes, students, issues, etc. – Investigate possible solutions
A group of staff members who are determined to work together will find a way.
Grade Level Teams
To create a professional learning community, focus on learning rather than teaching, work collaboratively,
and hold yourself accountable for results.
As we progress forward, every professional in the building must engage with colleagues in the ongoing
exploration of three crucial questions that drive the work of those within a professional learning community:
• What do we want each student to learn?
• How will we know when each student has learned it?
• How will we respond when a student experiences difficulty in learning?
“If the students did not master it, what can I discern? Where do we go from here?”
“If all students mastered it, what can I discern? Where do we go from here?”

45
Collaborative teacher conversations must quickly move beyond “What are we expected to teach?” to “How
will we know when each student has learned?”
1. Each grade level team member sharing about upcoming standards: overlaps?
2. Each grade level team member sharing about upcoming tests, quizzes, projects, and assignments for
the month: Overlaps, conflicts?
3. Each grade level team member sharing about student performance on tests, quizzes, projects,
assignments
4. Open discussion about work habits, behavior concerns, task completion, etc.
A group of staff members who are determined to work together will find a way.
Co-teaching Approaches
1. One Teach, One Observe. One of the advantages in co-teaching is that more detailed observation
of students engaged in the learning process can occur. With this approach, for example, co-
teachers can decide in advance what types of specific observational information to gather during
instruction and can agree on a system for gathering the data. Afterward, the teachers should
analyze the information together.
2. One Teach, One Drift. In a second approach to co-teaching, one person would keep primary
responsibility for teaching while the other professional circulated through the room providing
unobtrusive assistance to students as needed.
3. Parallel Teaching. On occasion, student learning would be greatly facilitated if they just had
more supervision by the teacher or more opportunity to respond. In parallel teaching, the teachers
are both teaching the same information, but they divide the class group and do so simultaneously.
4. Station Teaching. In this co-teaching approach, teachers divide content and students. Each
teacher then teachers the content to one group and subsequently repeats the instruction for the
other group. If appropriate, a third "station" could require that students work independently.
5. Alternative Teaching: In most class groups, occasions arise in which several students need
specialized attention. In alternative teaching, one teacher takes responsibility for the large group
while the other works with a smaller group.
6. Team Teaching: In team teaching, both teachers are delivering the same instruction at the same
time. Some teachers refer to this as having “one brain in two bodies.” Others call it “tag team teaching.” Most co-teachers consider this approach the most complex but satisfying way to co-
teach, but the approach that is most dependent on teachers’ styles.
46
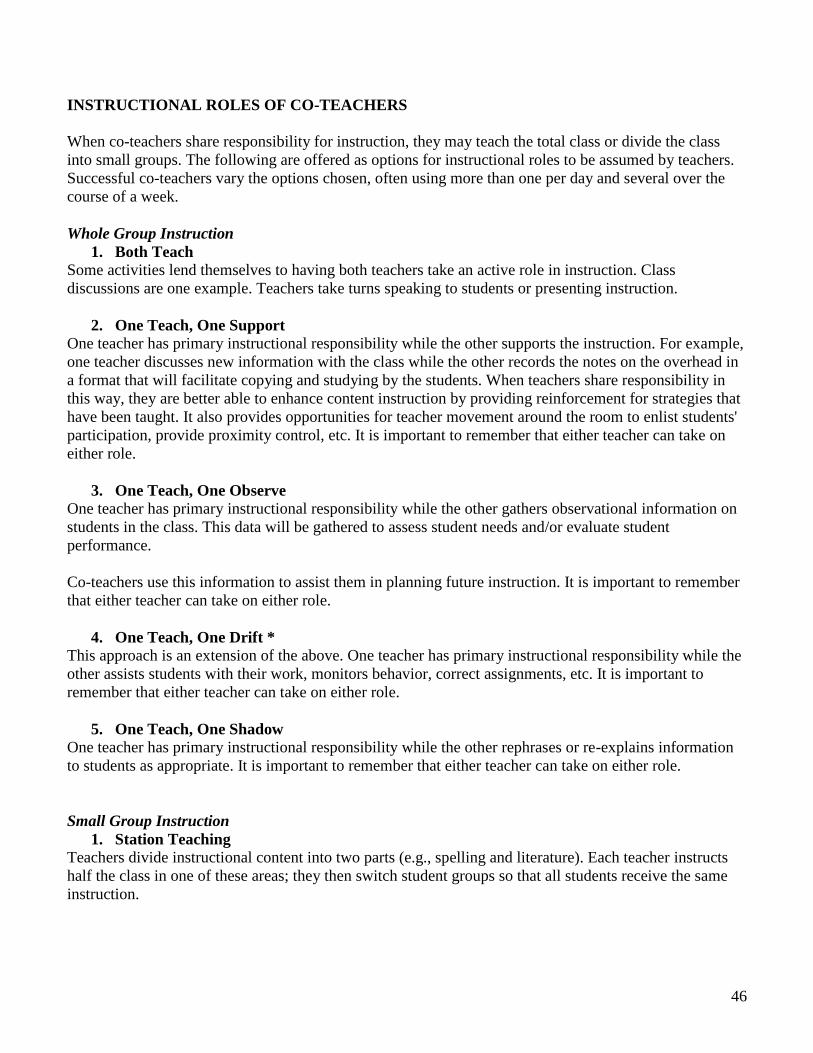
INSTRUCTIONAL ROLES OF CO-TEACHERS
When co-teachers share responsibility for instruction, they may teach the total class or divide the class
into small groups. The following are offered as options for instructional roles to be assumed by teachers.
Successful co-teachers vary the options chosen, often using more than one per day and several over the
course of a week.
Whole Group Instruction
1. Both Teach
Some activities lend themselves to having both teachers take an active role in instruction. Class
discussions are one example. Teachers take turns speaking to students or presenting instruction.
2. One Teach, One Support
One teacher has primary instructional responsibility while the other supports the instruction. For example,
one teacher discusses new information with the class while the other records the notes on the overhead in
a format that will facilitate copying and studying by the students. When teachers share responsibility in
this way, they are better able to enhance content instruction by providing reinforcement for strategies that
have been taught. It also provides opportunities for teacher movement around the room to enlist students'
participation, provide proximity control, etc. It is important to remember that either teacher can take on
either role.
3. One Teach, One Observe
One teacher has primary instructional responsibility while the other gathers observational information on
students in the class. This data will be gathered to assess student needs and/or evaluate student
performance.
Co-teachers use this information to assist them in planning future instruction. It is important to remember
that either teacher can take on either role.
4. One Teach, One Drift *
This approach is an extension of the above. One teacher has primary instructional responsibility while the
other assists students with their work, monitors behavior, correct assignments, etc. It is important to
remember that either teacher can take on either role.
5. One Teach, One Shadow
One teacher has primary instructional responsibility while the other rephrases or re-explains information
to students as appropriate. It is important to remember that either teacher can take on either role.
Small Group Instruction
1. Station Teaching
Teachers divide instructional content into two parts (e.g., spelling and literature). Each teacher instructs
half the class in one of these areas; they then switch student groups so that all students receive the same
instruction.

47
2. Parallel Teaching
Again, each teacher instructs half the student group, but they are addressing the same instructional model.
3. Remedial/Extension Instruction
One teacher re-teaches material to students who have not met mastery, and the other teacher does
extension activities with those who have. It is very important to pair remediation with extension.
Remedial students usually are not able to “catch up” if they work on remedial skills while other students
move ahead with the regular curriculum.
4. Supplemental Instruction *
One teacher presents the lesson in the standard format to the majority of students in the class. The other
works with those students who cannot master the material, simplifying it and otherwise adapting it to
meet their needs.

Quarterly Assessment Totals 2013-14
Class 2012-13 Averages
1st 9- % Passing
2nd 9- % Passing
3rd 9- % Passing
2013-14 Averages
Algebra I 42.00% 71% 53% 36% 53.33%
Algebra II 52.00% 63% 47% 72% 60.67%
Geometry 60.00% 34% 69% 20% 41.00%
Geometry H 69.00% 30% 50% 48% 42.67%
PreCalculus 76.00% 67% 70% 64% 67.00%
World History 68.00% 62% 50% 46% 52.67%
US History 58.00% 71% 92% 93% 85.33%
Government 45.00% 59% 58% 60% 59.00%
Economics 60.00% 76% 58% 48% 60.67%
English 9 75.00% 81% 84% 80% 81.67%
English 10 72.00% 74% 73% 45% 64.00%
English 10H 87.00% 79% 73% 45% 65.67%
English 11 72.00% 82% 84% 82% 82.67%
English 11H 90.00% 88% 88% 86% 87.33%
English 12 79.00% 80% 81% 80% 80.33%
Biology 53.00% 58% 25% 60% 47.67%
Chemistry 71.00% 79% 72% 80% 77.00%
Geography 57.00% 71% 54% 50% 58.33%
Careers 90.00% 96% 91% 95% 94.00%
Interactive Media I 90.00% 90% 98% 83% 90.33%
IPR 88.00% 85% 81% 88% 84.67%
2 D Art 85.00% 100% 100% 100% 100.00%
Choir 87.00% 88% 94% 94% 92.00%
Spanish II 65.00% 46% 46% 64% 52.00%
Spanish I 64.00% 74% 52% 86% 70.67%
Health 86.00% 86% 75% 93% 127.00%
9th PE 78.00% 100% 82% 94% 92.00%
ICP 38.00% 73% 47% 62% 60.67%
AP Bio 83.00% 81% 80% 92% 84.33%
Spanish III 85.00% 49% 80% 86% 71.67%
Earth Science NA 78% 68% 80% 75.33%

49
Quarterly Assessment Totals 2012-2013
Class 2011-12 Averages
1st 9- % Passing
2nd 9- % Passing
3rd 9- % Passing
2012-13 Averages
Algebra I 40% 45% 33% 47% 41.67%
Algebra II 63% 43% 65% 48% 52.00%
Geometry 38% 71% 83% 26% 60.00%
Geometry H 91% 78% 87% 43% 69.33%
PreCalculus 67% 87% 86% 56% 76.33%
World History 55% 72% 73% 60% 68.33%
US History 61% 67% 70% 37% 58.00%
Government 50% 47% 56% 33% 45.33%
Economics 62% 61% 55% 64% 60.00%
English 9 65% 65% 85% 75% 75.00%
English 10 59% 70% 75% 70% 71.67%
English 10H 94% 72% 96% 87.33%
English 11 52% 77% 80% 60% 72.33%
English 11H 89% 91% 90.00%
English 12 68% 66% 82% 88% 78.67%
Biology 60% 43% 57% 53.33%
Chemistry 41% 51% 74% 89% 71.33%
Geography 55% 46% 54% 70% 56.67%
Careers 92% 93% 82% 96% 90.33%
Computer Applications 94% 88% 88% 95% 90.33%
IPR 77% 87% 89% 87% 87.67%
2 D Art 73% 77% 84% 93% 84.67%
Choir 78% 78% 92% 90% 86.67%
Spanish II 65% 84% 44% 66% 64.67%
Spanish I 74% 94% 44% 54% 64.00%
Health 80% 90% 82% 86.00%
9th PE 63% 71% 81% 81% 77.67%
IED 73% 66% 71% 95% 77.33%
ICP 67% 39% 0% 75% 38.00%
AP Bio 68% 100% 75% 75% 83.33%
Spanish III 86% 90% 80% 85.00%

Comparative Analysis of TWHS Student Survey 2008 / 2010 / 2012
Number Percentage Total of all Student Surveys Percent
SA/A SA A D SD NA SA A D SD NA Question
2008 144 197 31 14 26 35% 48% 8% 3% 6% The principal maintains open lines of
communication with students, staff, and parents.
83%
2010 108 322 55 20 13 21% 62% 11% 4% 3% 83%
2012 55 230 41 11 8 16% 67% 12% 3% 2% 83%
2008 165 203 27 5 12 40% 49% 7% 1% 3% The principal sets aside time for basic
instruction that is free from interruptions (e.g., intercom messages, assemblies,
etc.).
89%
2010 104 332 50 19 14 20% 64% 10% 4% 3% 84%
2012 65 225 36 8 9 19% 66% 11% 2% 3% 85%
2008 158 217 16 5 16 38% 53% 4% 1% 4% The principal in this school sets high
standards and communicates those
expectations to teachers, students, and parents.
91%
2010 142 308 35 19 12 28% 60% 7% 4% 2% 88%
2012 82 218 25 7 7 24% 64% 7% 2% 2% 89%
2008 99 185 44 12 72 24% 45% 11% 3% 17% The principal encourages the school’s staff
to try out new ideas and support their efforts.
69%
2010 76 302 90 30 20 15% 58% 17% 6% 4% 73%
2012 37 208 57 19 20 11% 61% 17% 6% 6% 72%
2008 89 179 70 15 58 22% 44% 17% 4% 14% The principal encourages parent
involvement and provides avenues for parent participation in decision-making.
66%
2010 71 307 91 26 23 14% 59% 18% 5% 4% 73%
2012 27 203 68 18 25 8% 60% 20% 5% 7% 67%
2008 71 185 68 51 36 17% 45% 17% 12% 9% School improvement priorities and plans are developed cooperatively by the
principal, staff, and students.
62%
2010 54 317 93 35 18 10% 61% 18% 7% 3% 71%
2012 27 198 76 25 15 8% 58% 22% 7% 66%
2008 80 204 86 26 14 20% 50% 21% 6% 3% The principal visits the classrooms
frequently in order to observe instruction. 70%
2010 89 285 94 36 11 17% 55% 18% 7% 2% 72%

51
2012 53 182 75 19 11 16% 54% 22% 6% 3% 69%
2008 206 154 24 12 16 50% 37% 6% 3% 4% The principal is visible in the building and
at school activities. 87%
2010 186 274 26 25 7 36% 53% 5% 5% 1% 89%
2012 142 169 15 9 8 41% 49% 4% 3% 2% 91%
2008 97 220 63 23 9 24% 53% 15% 6% 2% Teachers promote high learning
expectations by starting session on time
and continuing with planned activity until the end of the period.
77%
2010 83 335 65 26 9 16% 65% 13% 5% 2% 81%
2012 59 216 47 17 4 17% 63% 14% 5% 1% 80%
2008 122 203 56 17 13 30% 49% 14% 4% 3% A system of student responsibility and
accountability for work and behavior is
clearly established on the first day.
79%
2010 97 332 53 23 11 19% 64% 10% 4% 2% 83%
2012 63 230 32 10 6 19% 67% 9% 3% 2% 86%
2008 94 246 49 14 9 23% 60% 12% 3% 2% Teachers are efficient in making assignments and providing materials
during instruction.
83%
2010 88 346 52 21 7 17% 67% 10% 4% 1% 84%
2012 41 234 44 14 7 12% 69% 13% 4% 2% 81%
2008 67 220 95 13 17 16% 53% 23% 3% 4% Teachers monitor instruction so all
students are included in learning activities. 69%
2010 72 337 70 29 6 14% 66% 14% 6% 1% 80%
2012 36 226 61 13 5 11% 66% 18% 4% 2% 77%
2008 62 177 114 39 20 15% 43% 28% 9% 5% Students’ successes receive appropriate
recognition. 58%
2010 47 314 107 38 8 9% 61% 21% 7% 2% 70%
2012 30 192 85 23 10 9% 57% 25% 7% 3% 65%
2008 94 241 51 15 11 23% 58% 12% 4% 3% Teachers indicate what they expect from students in order for achievement to occur.
81%
2010 74 361 43 20 12 15% 71% 8% 4% 2% 86%
2012 50 246 33 9 5 15% 72% 10% 3% 2% 86%

52
2008 71 209 101 15 13 17% 51% 25% 4% 3% Students are regularly reminded of key concepts of basic skills required for
achievement.
68%
2010 60 343 77 21 11 12% 67% 15% 4% 2% 79%
2012 31 234 60 10 5 9% 69% 18% 3% 2% 78%
2008 67 175 106 59 5 16% 42% 26% 14% 1% Teachers in this school try to make
learning interesting and fun. 58%
2010 49 238 140 73 11 10% 47% 27% 14% 2% 57%
2012 30 173 95 35 9 9% 51% 28% 10% 3% 59%
2008 55 171 110 54 18 13% 42% 27% 13% 4% The amount of homework is worthwhile in
reinforcing and learning course objectives. 55%
2010 36 251 143 74 10 7% 49% 28% 14% 2% 56%
2012 14 170 97 55 7 4% 50% 28% 16% 2% 54%
2008 66 178 113 38 17 16% 43% 27% 9% 4% Teachers sometimes change their lesson plans because of student needs and
interests.
59%
2010 46 294 123 37 14 9% 57% 24% 7% 3% 66%
2012 31 189 92 20 8 9% 56% 27% 6% 2% 65%
2008 64 222 85 22 18 16% 54% 21% 5% 4% Students are challenged to reach their
potential. 70%
2010 68 338 71 23 13 13% 66% 14% 4% 3% 79%
2012 50 216 53 13 9 15% 63% 16% 4% 3% 78%
2008 72 204 77 41 17 18% 50% 19% 10% 4% Rules and regulations have been
cooperatively developed, clearly stated, and are consistently enforced.
68%
2010 80 321 68 34 11 16% 62% 13% 7% 2% 78%
2012 27 239 47 22 5 8% 70% 14% 7% 2% 78%
2008 53 186 108 50 15 13% 45% 26% 12% 4% The school exhibits a supportive and stimulating environment.
58%
2010 43 299 117 46 8 8% 58% 23% 9% 2% 66%
2012 25 210 73 24 7 7% 62% 22% 7% 2% 69%
2008 53 184 109 41 24 13% 45% 27% 10% 6% 58%
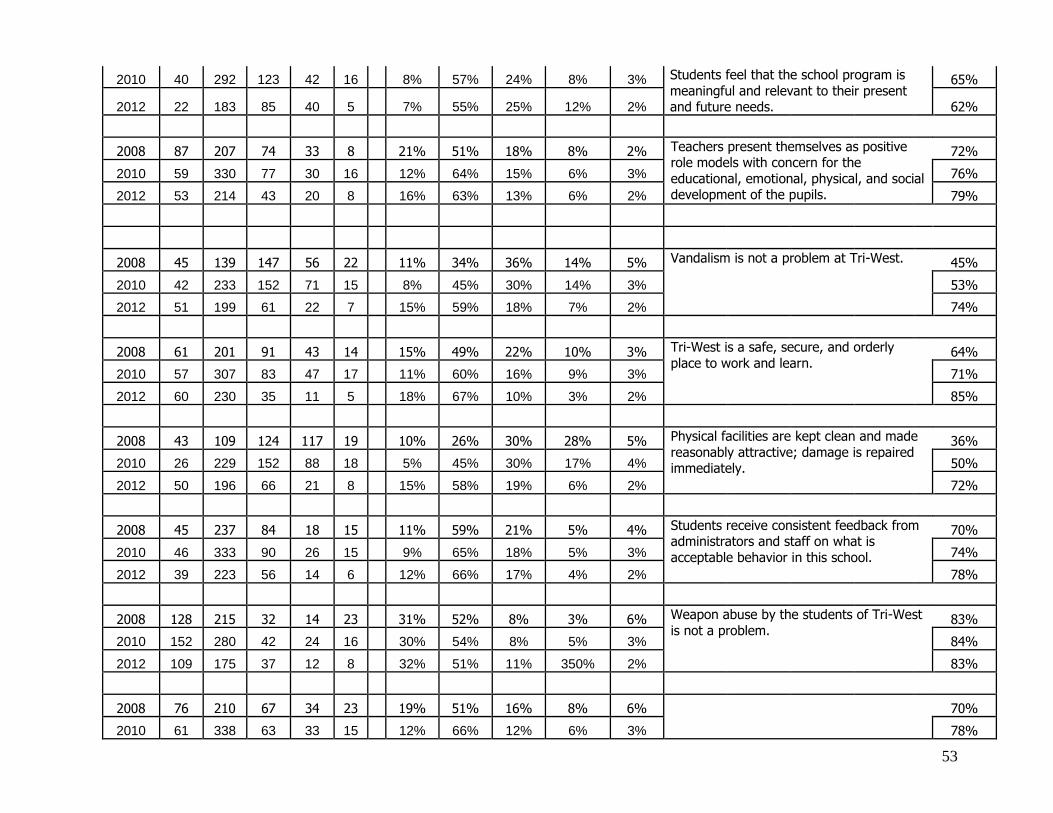
53
2010 40 292 123 42 16 8% 57% 24% 8% 3% Students feel that the school program is
meaningful and relevant to their present and future needs.
65%
2012 22 183 85 40 5 7% 55% 25% 12% 2% 62%
2008 87 207 74 33 8 21% 51% 18% 8% 2% Teachers present themselves as positive role models with concern for the
educational, emotional, physical, and social development of the pupils.
72%
2010 59 330 77 30 16 12% 64% 15% 6% 3% 76%
2012 53 214 43 20 8 16% 63% 13% 6% 2% 79%
2008 45 139 147 56 22 11% 34% 36% 14% 5% Vandalism is not a problem at Tri-West. 45%
2010 42 233 152 71 15 8% 45% 30% 14% 3% 53%
2012 51 199 61 22 7 15% 59% 18% 7% 2% 74%
2008 61 201 91 43 14 15% 49% 22% 10% 3% Tri-West is a safe, secure, and orderly
place to work and learn. 64%
2010 57 307 83 47 17 11% 60% 16% 9% 3% 71%
2012 60 230 35 11 5 18% 67% 10% 3% 2% 85%
2008 43 109 124 117 19 10% 26% 30% 28% 5% Physical facilities are kept clean and made
reasonably attractive; damage is repaired immediately.
36%
2010 26 229 152 88 18 5% 45% 30% 17% 4% 50%
2012 50 196 66 21 8 15% 58% 19% 6% 2% 72%
2008 45 237 84 18 15 11% 59% 21% 5% 4% Students receive consistent feedback from administrators and staff on what is
acceptable behavior in this school.
70%
2010 46 333 90 26 15 9% 65% 18% 5% 3% 74%
2012 39 223 56 14 6 12% 66% 17% 4% 2% 78%
2008 128 215 32 14 23 31% 52% 8% 3% 6% Weapon abuse by the students of Tri-West
is not a problem. 83%
2010 152 280 42 24 16 30% 54% 8% 5% 3% 84%
2012 109 175 37 12 8 32% 51% 11% 350% 2% 83%
2008 76 210 67 34 23 19% 51% 16% 8% 6% 70%
2010 61 338 63 33 15 12% 66% 12% 6% 3% 78%

54
2012 33 210 68 20 10 10% 61% 20% 6% 3%
Student disciplinary action quickly follows
infractions and is consistent with the policies stated in the student handbook. 71%
2008 34 148 119 78 29 8% 36% 29% 19% 7% Students have input into the development and evaluation of school practices and
policies.
44%
2010 30 263 137 61 20 6% 51% 27% 12% 4% 57%
2012 17 166 103 38 16 5% 49% 30% 11% 5% 54%
2008 78 207 69 43 14 19% 50% 17% 10% 3% Tri-West is a place where I feel
comfortable and accepted. 69%
2010 64 291 82 58 14 13% 57% 16% 11% 3% 70%
2012 54 198 53 27 7 16% 58% 16% 8% 2% 74%
2008 84 193 77 40 16 20% 47% 19% 10% 4% School events, such as athletic contests,
musical and dramatic events, and social events, are well attended by the faculty
and students
67%
2010 84 315 68 27 17 16% 62% 13% 5% 3% 78%
2012 60 220 37 14 11 18% 64% 11% 4% 3% 82%
2008 72 238 68 23 11 17% 58% 17% 6% 3% Teachers are available to work with students outside of regularly scheduled
class time.
75%
2010 63 337 68 29 15 12% 66% 13% 6% 3% 78%
2012 41 240 35 16 10 12% 70% 10% 5% 3% 82%
2008 68 197 82 34 18 17% 49% 21% 9% 5% There are open channels of communication
between students and staff and administration.
66%
2010 51 327 89 33 12 10% 64% 17% 6% 2% 74%
2012 36 225 56 16 9 11% 66% 16% 5% 3% 76%
2008 43 85 90 169 25 10% 21% 22% 41% 6% Alcohol abuse by the students of Tri-West
is not a major problem. 31%
2010 61 157 117 157 19 12% 31% 23% 31% 4% 43%
2012 34 132 82 85 9 10% 39% 24% 25% 3% 49%
2008 46 60 91 180 24 11% 15% 23% 45% 6% 26%
55
2010 55 137 138 159 21 11% 27% 27% 31% 4% Drug abuse, by the students of Tri-West, is not a major problem.
38%
2012 26 101 93 111 11 8% 30% 27% 33% 3% 37%
Comparative Analysis of TWHS Faculty/Staff Survey 2008 / 2010 / 2012
Number Percentage Total of all Teacher Surveys Percent
SA A D SD NA SA A D SD NA SA/A
Administrative leadership
2008 20 6 0 0 0 77% 23% 0% 0% 0% The principal in this school sets high standards
and communicates those expectations to
teachers, students, and parents
100%
2010 25 14 0 0 0 64% 36% 0% 0% 0% 100%
2012 17 22 1 0 0 43% 55% 3% 0% 0% 98%
2008 12 13 1 0 0 46% 50% 4% 0% 0% The principal encourages faculty members to try
out new ideas
96%
2010 17 20 0 0 2 44% 51% 0% 0% 4% 95%
2012 25 14 0 0 1 63% 35% 0% 0% 3% 98%
2008 10 14 0 0 0 42% 58% 0% 0% 0% The principal initiates effective coordination of
the instructional program.
100%
2010 15 20 0 0 4 36% 51% 0% 0% 10% 87%
2012 20 20 0 0 0 50% 50% 0% 0% 0% 100%
2008 23 3 0 0 0 88% 12% 0% 0% 0% The principal maintains open lines of
communication with students, staff, and parents.
100%
2010 23 15 1 0 0 59% 39% 3% 0% 0% 98%
2012 28 12 0 0 0 70% 30% 0% 0% 0% 100%
2008 17 9 0 0 0 65% 35% 0% 0% 0% The principal seeks ideas and suggestions from
the staff.
100%
2010 18 21 0 0 0 46% 54% 0% 0% 0% 100%
2012 26 14 0 0 0 65% 35% 0% 0% 0% 100%
0%
2008 8 13 2 0 0 35% 57% 9% 0% 0% Administrative leadership is available to resolve
disagreements that develop among staff
members.
92%
2010 14 17 1 0 7 36% 47% 3% 0% 18% 83%
2012 18 16 0 0 6 45% 40% 0% 0% 15% 85%
Number Percentage Total of all Teacher Surveys Percent
SA A D SD NA SA A D SD NA SA/A
Curriculum

56
2008 23 3 0 0 0 88% 12% 0% 0% 0% The principal is visible in the building and at
school activities
100%
2010 30 9 0 0 0 77% 23% 0% 0% 0% 100%
2012 29 10 0 0 1 73% 25% 0% 0% 3% 98%
0%
2008 7 14 2 0 1 30% 61% 9% 0% 4% Teachers, students, and parents are given
opportunities to participate in the development
of curriculum
91%
2010 7 25 4 0 3 18% 64% 10% 0% 8% 82%
2012 7 27 3 0 3 18% 68% 8% 0% 8% 85%
0%
2008 5 21 0 0 0 19% 81% 0% 0% 0% The school curriculum is relevant to student
needs.
100%
2010 8 27 2 0 2 21% 69% 5% 0% 5% 90%
2012 9 27 2 0 2 23% 68% 5% 0% 5% 90%
0%
2008 9 17 0 0 0 35% 65% 0% 0% 0% There are specific written objectives and
standards of acceptable performance for
students in grades K-12.
100%
2010 11 27 0 0 1 28% 69% 0% 0% 3% 97%
2012 12 26 0 0 2 30% 65% 0% 0% 5% 95%
0%
2008 1 17 5 2 0 4% 65% 19% 8% 0% Teachers hold students accountable for clear
and accurate writing, regardless of the subject
matter.
69%
2010 2 22 7 0 7 5% 58% 18% 0% 18% 63%
2012 5 24 5 1 5 13% 60% 13% 3% 13% 73%
Number Percentage Total of all Teacher Surveys Percent
SA A D SD NA SA A D SD NA SA/A
Instruction
2008 14 12 0 0 0 54% 46% 0% 0% 0% Teachers sometimes change their lesson plans
because of student needs and time constraints.
100%
2010 13 20 0 0 5 34% 53% 0% 0% 13% 87%
2012 17 19 0 0 2 45% 50% 0% 0% 5% 95%
0%
2008 2 16 8 0 0 8% 62% 31% 0% 0% The written curriculum is the guide for all
classroom instruction.
70%
2010 3 21 9 0 5 8% 55% 24% 0% 13% 63%
2012 9 22 4 0 3 24% 58% 11% 0% 8% 82%
0%
2008 3 16 6 1 0 12% 62% 23% 4% 0% Instructional time is not disrupted by the
scheduling of school events and administrative
procedures.
74%
2010 3 25 6 2 3 8% 63% 16% 5% 8% 71%
2012 3 24 8 1 1 8% 65% 22% 3% 3% 73%
0%
2008 2 20 2 0 1 8% 77% 8% 0% 4% 85%

57
2010 8 23 2 0 5 21% 61% 5% 0% 13% Teachers promote high learning expectations by
starting sessions on time and continuing with
planned activity until the end of the period.
82%
2012 8 25 3 0 2 21% 66% 8% 0% 5% 87%
0%
2008 4 18 3 0 1 15% 69% 12% 0% 4% Teachers excellence is recognized through
positive feedback and professional
appreciations.
84%
2010 9 26 1 0 2 24% 68% 3% 0% 5% 92%
2012 9 26 1 0 2 24% 68% 2% 0% 5% 92%
0%
2008 3 20 3 0 0 12% 77% 12% 0% 0% Students at Tri-West are challenged to reach
their potential.
89%
2010 7 26 2 0 3 18% 68% 5% 0% 8% 86%
2012 11 23 2 0 1 30% 62% 5% 0% 3% 92%
Number Percentage Total of all Teacher Surveys Percent
SA A D SD NA SA A D SD NA SA/A
Monitoring Student Progress
2008 7 19 0 0 0 27% 73% 0% 0% 0% Teachers are responsive to students need for
help
100%
2010 11 25 1 0 0 30% 68% 3% 0% 0% 98%
2012 15 21 1 0 1 40% 55% 3% 0% 3% 95%
2008 3 17 5 1 0 12% 65% 19% 4% 0% Objective based tests give administrators and
teachers clear information about student
achievement.
77%
2010 4 21 6 1 5 11% 57% 16% 3% 14% 68%
2012 6 16 12 1 2 16% 43% 32% 3% 5% 59%
2008 3 16 3 1 0 13% 70% 13% 4% 0% Specific program changes such as adjustments,
improvements or terminations, have been made
based on student and/or program evaluation.
83%
2010 2 23 5 0 7 5% 62% 14% 0% 19% 67%
2012 2 23 6 0 7 5% 61% 16% 0% 18% 66%
2008 1 13 9 1 0 4% 54% 38% 4% 0% Summaries of student performance are utilized
by all staff to provide assistance for individual
learning needs.
58%
2010 3 21 6 0 7 8% 57% 16% 0% 19% 65%
2012 8 27 2 0 1 21% 71% 5% 0% 3% 92%
2008 4 17 3 0 17% 71% 13% 0% 0% Pupil progress based on course objectives is
reported to parents at conferences.
88%
2010 3 23 6 0 6 17% 67% 3% 0% 14% 84%
2012 5 16 7 1 9 13% 42% 18% 3% 24% 55%
0%

58
Number Percentage Total of all Teacher Surveys
SA A D SD NA SA A D SD NA
Program Evaluation
2008 2 18 5 0 0 8% 72% 20% 0% 0% Assessment results are used for instructional
diagnosis and to determine if teaching methods
are working.
80%
2010 6 24 1 0 5 17% 67% 3% 0% 14% 84%
2012 9 26 1 0 2 24% 68% 3% 0% 5% 92%
2008 1 10 7 1 2 5% 48% 33% 5% 10% Needs assessments to determine planning
priorities are formulated by a committee
representing both administrators and teachers
53%
2010 5 22 0 0 10 14% 60% 0% 0% 27% 74%
2012 4 26 1 0 7 11% 68% 3% 0% 18% 79%
2008 1 15 5 1 0 5% 68% 23% 5% 0% The planning process has built in feedback
mechanisms for midcourse correction and
yearly evaluation and updating.
73%
2010 1 27 0 0 9 3% 73% 0% 0% 24% 76%
2012 4 28 2 0 4 11% 74% 5% 0% 11% 85%
2008 18 8 0 0 0 69% 31% 0% 0% 0% Each student has the opportunity to participate
in school programs.
100%
2010 19 17 1 0 1 50% 45% 3% 0% 3% 95%
2012 22 15 0 0 1 58% 40% 0% 0% 3% 98%
2008 3 15 6 1 1 12% 58% 23% 4% 4% Each program at Tri-West has well defined
objectives and goals.
70%
2010 2 27 4 0 5 5% 71% 11% 0% 13% 76%
2012 12 24 1 0 1 32% 63% 3% 0% 3% 95%
2008 4 15 4 1 0 17% 58% 15% 4% 0% Tri-West has a written evaluation procedure
which is used for the improvement process.
75%
2010 5 27 1 0 3 14% 75% 3% 0% 8% 89%
2012 12 24 0 0 2 32% 63% 0% 0% 6% 95%
2008 1 13 7 1 2 4% 50% 27% 4% 8% Tri-West participates in a systematic and
comprehensive evaluation of all educational
programs and services.
54%
2010 4 22 5 0 7 11% 58% 13% 0% 18% 69%
2012 8 26 2 0 2 21% 68% 5% 0% 5% 89%
2008 2 16 6 0 0 8% 62% 23% 0% 0% Teachers and administrators review and analyze
test results to plan instruction program
modifications.
70%
2010 3 25 1 0 8 8% 68% 3% 0% 22% 76%
2012 11 21 2 0 3 30% 57% 5% 0% 8% 87%

59
2008 1 18 5 0 0 4% 69% 19% 0% 0% Educational programs are changed on the basis
of student performance.
73%
2010 1 27 4 0 5 3% 73% 11% 0% 14% 76%
2012 6 23 3 0 4 17% 62% 8% 0% 11% 79%
2008 11 15 0 0 0 42% 58% 0% 0% 0% School leaders inform parents and other
community members of school and corporation
activities.
100%
2010 14 20 0 0 3 38% 54% 0% 0% 8% 92%
2012 16 21 0 0 0 43% 57% 0% 0% 0% 100%
2008 2 16 6 0 0 8% 67% 25% 0% 0% Assessment results are used for instructional
diagnosis and to determine if teaching methods
are working.
75%
2010 6 23 2 0 5 17% 64% 6% 0% 14% 81%
2012 10 26 1 0 1 26% 68% 3% 0% 3% 94%
Number Percentage Total of all Teacher Surveys
SA A D SD NA SA A D SD NA
Professional Development
2008 10 15 1 0 0 38% 58% 4% 0% 0% The administration encourages the use of
professional days.
96%
2010 6 23 2 0 5 17% 64% 7% 0% 14% 81%
2012 8 22 5 0 3 21% 58% 13% 0% 8% 79%
2008 5 21 0 0 0 19% 81% 0% 0% 0% Information regarding available professional
development opportunities and programs is
provided to the staff.
100%
2010 5 26 2 0 3 14% 72% 6% 0% 8% 86%
2012 6 26 4 0 2 16% 68% 11% 0% 5% 84%
2008 0 9 10 6 1 0% 35% 38% 23% 4% A professional library is available for staff to
use.
35%
2010 1 9 17 1 8 3% 25% 47% 3% 22% 28%
2012 1 17 7 4 9 3% 45% 18% 11% 24% 48%
2008 4 12 9 1 0 15% 46% 35% 4% 0% The instructional staff is included in the
planning and evaluation of professional
development programs.
61%
2010 16 8 0 5 19% 44% 22% 0% 14% 63%
2012 1 21 9 3 4 3% 55% 24% 8% 11% 58%
2008 1 18 3 1 1 4% 75% 13% 4% 4% The professional development programs are
relevant and meet the needs of the staff.
79%
2010 3 17 10 3 3 8% 47% 28% 8% 8% 55%
2012 2 21 11 2 2 5% 55% 11% 2% 2% 60%
2008 8 16 2 0 0 31% 62% 8% 0% 0% 93%

60
2010 5 24 2 2 3 14% 67% 6% 6% 8% Professional development includes
opportunities for the staff to work with and
learn from each other.
81%
2012 4 26 5 1 2 11% 68% 13% 3% 5% 79%
Number Percentage Total of all Teacher Surveys
SA A D SD NA SA A D SD NA
Evaluation of School Personnel
2008 3 13 4 2 0 14% 59% 18% 9% 0% The evaluation system for school personnel
serves as a basis for employment.
73%
2010 4 20 4 0 6 12% 59% 12% 0% 18% 71%
2012 6 24 5 0 2 16% 65% 14% 0% 5% 81%
2008 6 16 3 0 0 24% 64% 12% 0% 0% Teacher evaluation is used for improving
teacher performance.
88%
2010 6 27 0 0 2 17% 77% 0% 0% 6% 94%
2012 11 22 3 1 1 29% 58% 8% 3% 3% 87%
2008 5 16 4 0 0 20% 64% 16% 0% 0% Staff evaluation includes input from staff and
administrators.
84%
2010 3 25 5 0 2 9% 71% 14% 0% 6% 80%
2012 8 26 2 1 1 21% 68% 5% 3% 3% 89%
2008 8 15 1 0 0 33% 63% 4% 0% 0% The principal regularly gives feedback to
teachers regarding their instructional
techniques.
96%
2010 8 19 5 0 3 23% 54% 14% 0% 9% 77%
2012 11 24 0 1 2 29% 63% 0% 3% 5% 92%
2008 15 9 0 0 0 63% 38% 0% 0% 0% Following a formal observation, the principal
and teacher discuss the observation and together
they plan for instructional improvement.
101%
2010 17 12 0 0 5 50% 35% 0% 0% 15% 85%
2012 18 14 2 0 4 47% 37% 5% 0% 11% 84%
Number Percentage Total of all Teacher Surveys
SA A D SD NA SA A D SD NA
School Climate
2008 4 15 5 0 0 17% 63% 21% 0% 0% All staff members believe that all students can
learn and enthusiastically accept the challenge
to teach them.
80%
2010 5 21 8 0 2 14% 58% 22% 0% 6% 72%
2012 6 29 3 0 0 16% 76% 8% 0% 0% 92%
2008 0 1 13 8 1 0% 4% 57% 35% 4% Alcohol abuse by the students of Tri-West is not
a major problem.
4%
2010 0 10 19 1 5 0% 29% 54% 3% 14% 29%
2012 0 23 11 4 0 0% 61% 29% 11% 0% 61%

61
2008 0 1 12 11 0 0% 4% 50% 46% 0% Drug abuse by the students of Tri-West is not a
major problem
4%
2010 0 10 19 1 5 0% 29% 54% 3% 14% 29%
2012 0 18 16 4 0 3% 47% 42% 11% 0% 50%
2008 0 11 10 4 0 0% 44% 40% 16% 0% Physical facilities are kept clean and made
reasonably attractive: damage is repaired
immediately.
44%
2010 3 19 11 1 0 9% 56% 32% 3% 0% 65%
2012 9 27 2 0 0 24% 71% 5% 0% 0% 95%
2008 2 21 1 0 0 8% 88% 4% 0% 0% Weapon abuse by the students of Tri-West is
not a major problem.
96%
2010 10 19 1 1 4 29% 54% 3% 3% 11% 83%
2012 14 24 0 0 0 37% 63% 0% 0% 0% 100%
2008 4 18 3 0 0 16% 72% 12% 0% 0% Student disciplinary action quickly follows
infractions and is consistent with the policies
stated in the student handbook.
88%
2010 8 27 1 0 0 22% 75% 3% 0% 0% 97%
2012 2 20 11 3 1 5% 54% 30% 8% 3% 59%
2008 3 17 5 0 0 12% 68% 20% 0% 0% Decisions in this school are reached through a
process in which staff members feel their views
are considered.
80%
2010 7 20 5 0 2 21% 29% 15% 0% 6% 50%
2012 6 28 4 0 0 16% 71% 11% 0% 0% 87%
2008 3 14 3 2 0 14% 64% 14% 9% 0% School events such as athletic contests, musicals
and dramatic events, and social events are well
attended by the faculty and administration.
78%
2010 6 20 4 1 4 17% 57% 11% 3% 11% 74%
2012 8 23 3 1 3 21% 61% 8% 3% 8% 82%
2008 11 13 1 0 0 44% 50% 4% 0% 0% There are open channels of communication
between students and staff and administration.
94%
2010 8 25 2 0 1 22% 69% 6% 0% 3% 91%
2012 13 25 0 0 0 34% 66% 0% 0% 0% 100%
2008 6 13 3 0 0 27% 59% 14% 0% 0% Our principal’s ideas, concerns, and needs for
the betterment of our school are well received
by the superintendent and the school board.
86%
2010 7 15 2 0 11 20% 43% 6% 0% 31% 63%
2012 6 25 2 0 5 16% 66% 5% 0% 13% 82%
Number Percentage Total of all Teacher Surveys
SA A D SD NA SA A D SD NA
Parent and Community involvement

62
2008 2 16 2 1 1 9% 73% 9% 5% 5% Students, staff, and parents are included in the
development of programs at Tri-West.
82%
2010 5 25 3 0 3 14% 69% 8% 0% 8% 83%
2012 3 29 3 0 3 8% 76% 8% 0% 8% 84%
2008 1 15 7 0 0 4% 65% 30% 0% 0% Parents and teachers work together to monitor
homework assignments.
69%
2010 4 21 6 0 3 12% 62% 18% 0% 9% 74%
2012 4 24 4 1 4 11% 66% 11% 3% 11% 77%
2008 1 16 5 0 1 4% 70% 22% 0% 4% Procedures for parent involvement in school
activities are clearly communicated and
consistently used.
74%
2010 2 20 8 0 5 6% 57% 23% 0% 14% 63%
2012 4 26 5 0 3 11% 68% 13% 0% 8% 79%
2008 3 15 3 0 1 14% 68% 14% 0% 5% Parents have opportunities to visit the school to
observe educational programs.
82%
2010 6 22 2 0 6 17% 61% 6% 0% 17% 78%
2012 4 28 3 0 3 11% 74% 8% 0% 8% 85%
2008 1 15 3 0 1 5% 75% 15% 0% 5% Parents are actively involved in working on
school improvement tasks with staff and
students.
80%
2010 2 18 7 0 9 6% 50% 19% 0% 25% 56%
2012 3 24 6 1 3 8% 65% 16% 3% 8% 73%
2008 0 14 7 0 0 0% 67% 33% 0% 0% Parents and community are receptive to new
ideas.
67%
2010 2 15 12 1 5 6% 43% 34% 3% 14% 49%
2012 2 24 10 0 1 5% 65% 27% 0% 3% 70%

63
Analysis of TWHS Parent Survey 2010 / 2012
Number Percentage Total of all Teacher Surveys Percent
SA A D SD NA SA A D SD NA Question SA/A
2010 26 77 10 1 0 23% 68% 9% 1% 0% The staff at Tri-West sets high standards and
communicates those expectations to students
and parents.
91%
2012 27 94 14 4 0 19% 68% 10% 3% 0% 87%
2010 26 72 12 7 0 22% 62% 10% 6% 0% The staff is willing to hear the concerns and
opinions of parents and students. 84%
2012 26 91 11 4 6 19% 66% 8% 3% 4% 85%
2010 26 68 15 4 1 23% 60% 13% 4% 1% The staff communicates openly and honestly
with parents and students. 83%
2012 24 80 15 2 1 20% 66% 12% 2% 1% 85%
2010 17 66 20 6 4 15% 58% 18% 5% 4% The staff extends the school's learning
environment beyond the school building. 73%
2012 20 69 22 3 7 17% 57% 18% 3% 6% 74%
2010 35 73 4 0 2 31% 64% 4% 0% 2% The staff is visible in the building and at
school activities. 95%
2012 37 75 7 0 3 30% 62% 6% 0% 3% 92%
2010 14 71 19 6 3 12% 63% 17% 5% 3% Teachers are responsive to students' needs
for helping during class time. 75%
2012 18 74 20 3 4 15% 62% 17% 3% 3% 77%
2010 8 70 26 3 4 7% 63% 23% 3% 4% Students are given specific feedback on
classroom assessments in a timely fashion. 70%
2012 23 67 21 5 3 19% 56% 18% 4% 3% 76%
2010 18 69 13 4 5 17% 63% 12% 4% 5% Student achievement results for our school
(i.e. scholarship and extra-curricular) are
reported to students and the general public.
80%
2012 32 71 13 2 3 26% 59% 11% 2% 3% 85%
2010 20 79 8 1 4 18% 71% 7% 1% 4% Student achievement for our school (i.e.
standardize testing, NWEA testing, etc.) are
reported to parents, and the general public.
88%
2012 29 81 10 1 1 24% 66% 8% 1% 1% 90%
2010 26 67 14 3 1 23% 60% 13% 3% 1% 84%

64
2012 32 75 11 0 0 28% 63% 9% 0% 0% Tri-West is a safe, secure, and orderly place
to work and learn. 91%
2010 29 58 16 3 6 26% 52% 14% 3% 5% Student drug and alcohol use is a major
concern at Tri-West. 78%
2012 29 60 27 1 3 24% 50% 23% 1% 3% 74%
2010 6 71 17 9 11 5% 62% 15% 8% 10% Physical facilities are kept clean and made
reasonably attractive; damage is repaired
immediately.
68%
2012 37 75 2 1 5 31% 63% 1% 1% 4% 93%
2010 16 84 10 1 3 14% 74% 9% 1% 3% Students receive consistent feedback from
administrators and staff on what is
acceptable behavior at Tri-West.
88%
2012 24 83 8 2 3 20% 69% 7% 2% 3% 89%
2010 15 63 11 8 15 13% 56% 10% 7% 13% Student disciplinary action quickly follows
infractions and is consistent with the
policies stated in the student handbook.
70%
2012 19 85 13 3 0 16% 71% 11% 3% 0% 87%
2010 15 67 23 5 3 13% 59% 20% 4% 3% School spirit is strong. 73%
2012 19 85 13 3 0 16% 71% 11% 3% 0% 87%
2010 28 74 5 5 0 25% 66% 4% 4% 0% The administration provides positive
leadership. 91%
2012 31 76 14 0 1 25% 62% 12% 0% 1% 88%
2010 24 74 7 5 1 22% 67% 6% 5% 1% Parents feel the overall school program is
meaningful to their student. 88%
2012 29 79 11 0 1 24% 66% 9% 0% 1% 90%
2010 21 72 18 2 1 18% 63% 16% 2% 1% Teachers present themselves as positive role
models with concern for the physical,
educational, social, and emotional
development of the students.
82%
2012 25 74 17 2 0 21% 63% 14% 2% 0% 84%
2010 16 65 25 4 3 14% 58% 22% 4% 3% Parent/Teacher interaction occurs at Tri-
West on a regular basis. 72%
2012 10 66 34 4 5 8% 56% 29% 3% 4% 64%
2010 16 65 16 1 13 14% 59% 14% 1% 12% 73%

65
2012 19 63 12 3 21 16% 53% 10% 3% 18% Would participating in an active
parent/faculty group be on interest to you? 70%
2010 9 65 29 4 4 8% 59% 26% 4% 4% The school uses a variety of methods to
measure my student's progress. 67%
2012 16 78 20 2 3 13% 66% 17% 2% 3% 79%
2010 41 63 8 2 0 36% 55% 7% 2% 0% Phone calls, newsletters, notes to and from
home, e-mail, the school website, the
homework hotline, and conferences are
ways that teachers communicate with
parents.
91%
2012 32 80 6 3 0 26% 66% 5% 3% 0% 93%
2010 16 78 12 2 4 14% 70% 11% 2% 4% Technology use is stressed and encouraged
by teachers. 84%
2012 19 77 16 2 5 16% 65% 13% 2% 4% 81%
2010 25 73 11 1 4 22% 64% 10% 1% 4% Technology is an important part of the
curriculum. 86%
2012 25 75 15 1 4 21% 63% 13% 80% 3% 83%
2010 13 75 14 2 9 12% 66% 12% 2% 8% Technology is readily available to our
students at Tri-West High School. 78%
2012 18 82 19 0 1 15% 68% 16% 0% 0% 83%
2010 15 60 26 9 4 13% 53% 23% 8% 4% The school counselors are helpful and
provide relevant services to my students. 66%
2012 19 70 24 4 2 16% 59% 20% 3% 2% 75%
2010 14 26 17 3 7 21% 39% 25% 4% 10% The school encourages my student to read
for pleasure. 60%
2012 15 66 21 5 10 13% 56% 18% 4% 9% 69%
2010 7 9 17 3 12 15% 19% 35% 6% 25% The school library supports my student's
research and studies. 33%
2012 10 70 10 5 23 9% 59% 9% 4% 20% 68%
2010 13 4 18 5 3 30% 9% 42% 12% 7% The facility is adequate for the needs of the
students and programs. 40%
2012 19 92 9 0 2 16% 75% 7% 0% 2% 91%

Membership Data
Sources: Enrollment Reports & DOE website
Enrollment by Grade
20
06
-07
20
07
-08
20
08
-09
20
09
-10
20
10
-11
20
11
-12
20
12
-1
3
20
13
-14
20
14
-15
9th 143 147 163 155 164 155 154 146 159
10th 133 143 148 152 157 145 159 150 142
11th 132 130 133 145 160 162 148 152 146
12th 109 124 116 127 141 154 157 142 157
517 544 560 579 622 616 618 590 598
0
20
40
60
80
100
120
140
160
180
2006-07 2007-08 2008-09 2009-10 2010-11 2011-12 2012 -13 2013-14 2014-15
9th 10th 11th 12th

67
Membership Data
Sources: Enrollment Reports & DOE website
Enrollment by Grade
20
06
-07
20
07
-08
20
08
-09
20
09
-10
20
10
-11
20
11
-12
20
12
-1
3
20
13
-14
20
14
-15
Total 517 544 560 579 622 616 618 590 598
0
100
200
300
400
500
600
700
2006-07 2007-08 2008-09 2009-10 2010-11 2011-12 2012 -13 2013-14 2014-15
Total Enrollment
68
Attendance Rate for Tri-West High School
Sources: Enrollment Reports & DOE website
2007/08 2008/09 2009/10 2010/11 2011/12 2012/13 2013/14
Tri-West HS 96.3% 95.6% 95.86% 95.6% 96.1% 95.8% 97.1%
State Average 95.9% 96.1% 95.8% 95.1% 95.9% 95.80%
94.0%
94.5%
95.0%
95.5%
96.0%
96.5%
97.0%
97.5%
2007 - 08 2008-09 2009-10 2010-11 2011-12 2012-13 2013-14
Chart Title
Tri-West HS State Average

69
Enrollment by Gender
Sources: Enrollment Reports & DOE website
2007-08 2008-09 2009-10 2010-11 2011-12 2012-13 2013-14 2014-15
9th male 80 66 84 67 80 71 73 83
9th female 83 89 91 74 75 83 73 76
10th male 81 74 67 82 68 83 69 74
10th female 67 78 88 82 77 76 81 68
11th male 73 66 76 66 79 70 80 69
11th female 60 79 77 86 83 78 72 77
12th male 56 72 66 72 68 77 70 81
12th female 60 55 61 77 85 80 72 90
0
10
20
30
40
50
60
70
80
90
100
2007-08 2008-09 2009-10 2010-11 2011-12 2012-13 2013-14 2014-15
9th male 9th female 10th male 10th female
11th male 11th female 12th male 12th female
70
Tri-West High School Students Referred to Central Normal Campus
Sources: CNC & Guidance Department
2005-06 2006-07 2007-08 2008-09 2009-2010 2010-11 2011-12 2012-13 2013-14
Students referred to CNC
9 11 5 16 19 20 15 12 16
0
5
10
15
20
25
2005-06 2006-07 2007-08 2008-09 2009-2010 2010-11 2011-12 2012-13 2013-14
Opportunity House Central Normal Campus
Students referred to Central Normal Campus

71
Advance Placement Enrollment at Tri-West High School
Source: Tri-West Guidance Department.
20
04
-05
20
05
-06
20
06
-07
20
07
-08
20
08
-09
20
09
-10
20
10
-11
20
11
-12
20
12
-13
20
14
-15
Number of Students Taking AP Biology
8 9 7 12 19 24 49 52 7 29
Number of Students Taking AP Calculus
8 12 16 13 18 20 30 26 23 24
Number of Students taking AP Chemistry
25 20 20 20 19 31 30 23 27 14
Number of Students taking AP English
na 3 13 14 20 12 12 60 25 29
Number of Students taking AP Art / Photography
na 3 7 8 8 10 14 8 23 5
Number of Students taking AP French IV
na na na na na 6 2 1 3 na
Number of Students taking AP Spanish IV
na na na na na 15 16 20 17 na
Number of Students taking AP US History
na na na na na na 16 7 16 8
Number of Students taking Macro Economics
na na na na na na na na na 1
Number of Students taking Micro Economics
na na na na na na na na na 1
0
10
20
30
40
50
60
70
Chart Title
2005-06 2006-07 2007-08 2008-09 2009-10 2010-11 2011-12 2012-13 2013-14

72
Mean Scores of AP Tests Source: Guidance Department
20
04
-05
20
05
-06
20
06
-07
20
07
-08
2008-0
9
20
09
-10
20
10
-11
20
11
-12
20
12
-13
20
13
-14
AP Biology Test na 2.4 2.1 1.5 2.1 1.0 1.1 1.2 2 1.6
AP Calculus Test na 1.4 2.4 2.4 3.1 1.8 2.3 2.7 2.7 3
AP Chemistry Test na 1.3 1.4 1.3 1.2 1.2 1.3 1.6 na 1.9
AP English Test na 3.0 2.5 2.5 2.1 2.9 2.9 2.5 2.3 2.4
AP Art Test na 3.0 2.4 3.3 3.1 2.2 2.6 2 3 3.2
AP Art Test - 3D na na na na 1.0 5.0 2.5 2 2
AP French IV na na na na na 1.2 na na 3 na
AP Spanish IV na na na na na 1.1 1.0 2.2 1
AP US History na na na na na na 2.9 2.3 3.2 3.3
Macro Econimics na na na na na na na na na 5
Micro Economics na na na na na na na na na 5
0
1
2
3
4
5
6
Chart Title
2004-05 2005-06 2006-07 2007-08 2008-09
2009-10 2010-11 2011-12 2012-13 2013-14

73
Special Education Enrollment Sources: Special Education Student Enrollment Lists
20
06-
07
20
07-
08
20
08-
09
20
09-
10
20
10-
11
20
11-
12
20
12-
13
20
13-
14
20
14-
15
Grade 9 13 18 15 10 16 15 15 9 7
Grade 10 15 13 14 14 10 16 19 15 10
Grade 11 15 11 12 15 10 9 17 17 13
Grade 12 12 11 12 9 15 13 13 16 18
Totals 55 54 53 53 51 53 64 57 48
Total enrollment
544 561 578 604 603 616 618 590 598
Percentage of Special Ed
10.11% 9.63% 9.17% 8.77% 8.46% 8.60% 10% 10% 8%
0
2
4
6
8
10
12
14
16
18
20
2006-07 2007-08 2008-09 2009-10 2010-11 2011-12 2012-13 2013-14 2014-15
Special Education Students Per Grade
Grade 9 Grade 10 Grade 11 Grade 12
0.00%
2.00%
4.00%
6.00%
8.00%
10.00%
12.00%
Percentage of Students

74
Students Enrolled at Tri-West High School Receiving
Services Under Section 504 of The Rehabilitation Act
of 1973 Source: Tri-West High School Guidance Department
2006-0
7
2007-0
8
2008-0
9
2009-1
0
2010-1
1
2011-1
2
2012-1
3
2013-1
4
504 students 10 7 9 5 4 5 4 3
Total Enrollment 544 561 578 603 603 616 618 590
Percentage 1.8% 1.2% 1.6% 0.8% 0.7% 0.8% 0.6% 0.5%
0
2
4
6
8
10
12
2006 - 07 2007 - 08 2008-09 2009-10 2010-11 2011-12 2012-13 2013-14
Number of 504 students
0.0%
0.2%
0.4%
0.6%
0.8%
1.0%
1.2%
1.4%
1.6%
1.8%
2.0%
2006-07 2007-08 2008-09 2009-10 2010-11 2011-12 2012-13 2013-14
Percentage

75
Graduate Data at Tri-West High School
20
04
- 0
5
20
05
- 0
6
20
06
- 0
7
20
07
-08
20
08
-09
20
09
-10
20
10
-11
20
11
-12
20
12
-13
20
13
-14
Number of Graduates
74 97 115 105 120 131 147 154 157 144
Number earning Academic
Honors Diplomas
21 38 41 37 51 34 56 54 48 45
Percent earning Academic
Honors Diplomas
28% 39% 36% 35% 43% 26% 38% 35% 31% 31%
Number earning Core 40
Diplomas 35 49 44 43 52 78 74 72 79 74
Percent earning Core 40
Diplomas 47% 51% 38% 41% 43% 60% 50% 47% 50% 51%
Number earning Technical Honors
4 2
Percent earning Technical Honors
3% 1%
General 18 10 30 25 17 19 18 24 5 18
Percent earning General
Diplomas
24% 10% 26% 24% 14% 15% 12% 16% 3% 13%
0
50
100
150
200
2008-09 2009-10 2010-11 2011-12 2012-13 2013-14
Chart Title
Number of Graduates
Number earning Academic Honors Diplomas
Number earning Core 40 Diplomas
Number earning Technical Honors
General
76
“DATA TEAM”
School Improvement Team
This team will be responsible for changing the course for school improvement. Team members will be
chairpersons from the faculty committees, in addition to parents and community members.
Adam Benner Co-Chair
Kate Stroup Co-Chair
Kelly Simpson School Safety Team
Bob Linn Staff Morale Team
Kate Stroup Study Skills Team
Tom Pemberton Reading Team
Adam Bontreger Writing Team
Tricia Diagostino Renaissance Team
Marta Bridwell Parent/Community Members
Bill Pfeifer Parent/Community Members
Tammy Henley Parent/Community Members
Tony Hatton Parent/Community Members
Beth Jones Parent/Community Members
Susan Van Dyke Parent/Community Members
Claire Johnson Student Member
Karen Jones Student Member

77
COMMITTEES
‘WRITING TEAM”
This team will be responsible for addressing students
and data from ECA, PSAT, SAT, ACT, and NWEA
with emphasis on improving writing skills.
Adam Bontreger
Emily Mulpuri
Heidi West
Christie Cialkowski
Math TBA
“READING TEAM”
Same as above except…with emphasis on
improving reading skills.
Tom Pemberton
Dave Hobaugh
Shae Young
Stacy Rogers
Tim Kern
“SCHOOL SAFETY”
Kelly Simpson
Don Dorrell
Chris Coll
Steve Terrell
Brad Acton
“STUDY SKILLS TEAM”
This team will be responsible for addressing
study skills strategies.
Kate Stroup
Olympia Harris
Marilyn Terew
Jaime Castrataro
Erin Gill
“STAFF MORALE TEAM”
Bob Linn
Jeff Marshall
Jeremy Small
Cheryl Hahn
Camille Dorrell
“RENAISSANCE TEAM”
Tricia Diagostino
Kelli Jeziorski
Billy Hall
Dan Muchler
“TECHNOLOGY”
Adam Love
Elizabeth Mendenhall
Rodney Farmer
Kelli Wiley
Nathan Begle