Embed Size (px)
Citation preview
8/3/2019 TREPP CMBS 2011 Q2
http://slidepdf.com/reader/full/trepp-cmbs-2011-q2 1/35
CMBS Market Trends andOutlook
Presentation to
CREW CT -- REX
Thomas A. FinkSenior Vice President
March 23, 2011

8/3/2019 TREPP CMBS 2011 Q2
http://slidepdf.com/reader/full/trepp-cmbs-2011-q2 2/35
2
CMBS Background
8/3/2019 TREPP CMBS 2011 Q2
http://slidepdf.com/reader/full/trepp-cmbs-2011-q2 3/35
3
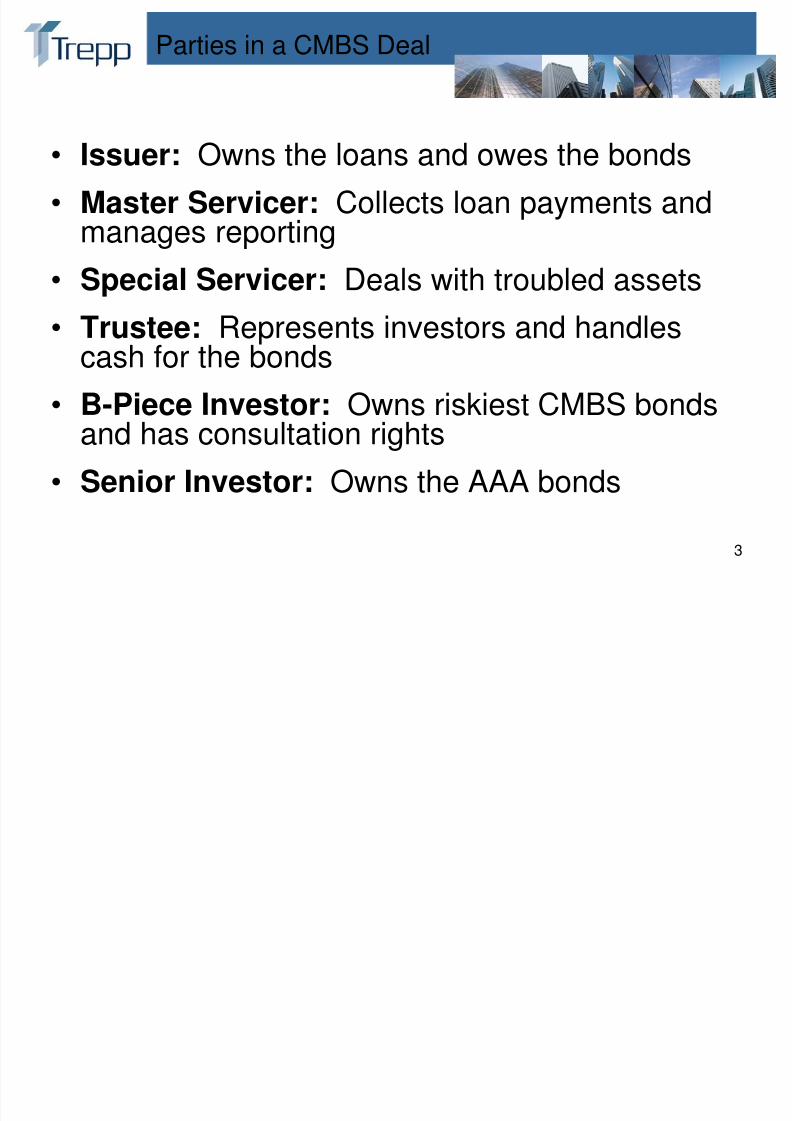
Parties in a CMBS Deal
• Issuer: Owns the loans and owes the bonds
• Master Servicer: Collects loan payments andmanages reporting
• Special Servicer: Deals with troubled assets
• Trustee: Represents investors and handlescash for the bonds
• B-Piece Investor: Owns riskiest CMBS bondsand has consultation rights
• Senior Investor: Owns the AAA bonds
8/3/2019 TREPP CMBS 2011 Q2
http://slidepdf.com/reader/full/trepp-cmbs-2011-q2 4/35
4
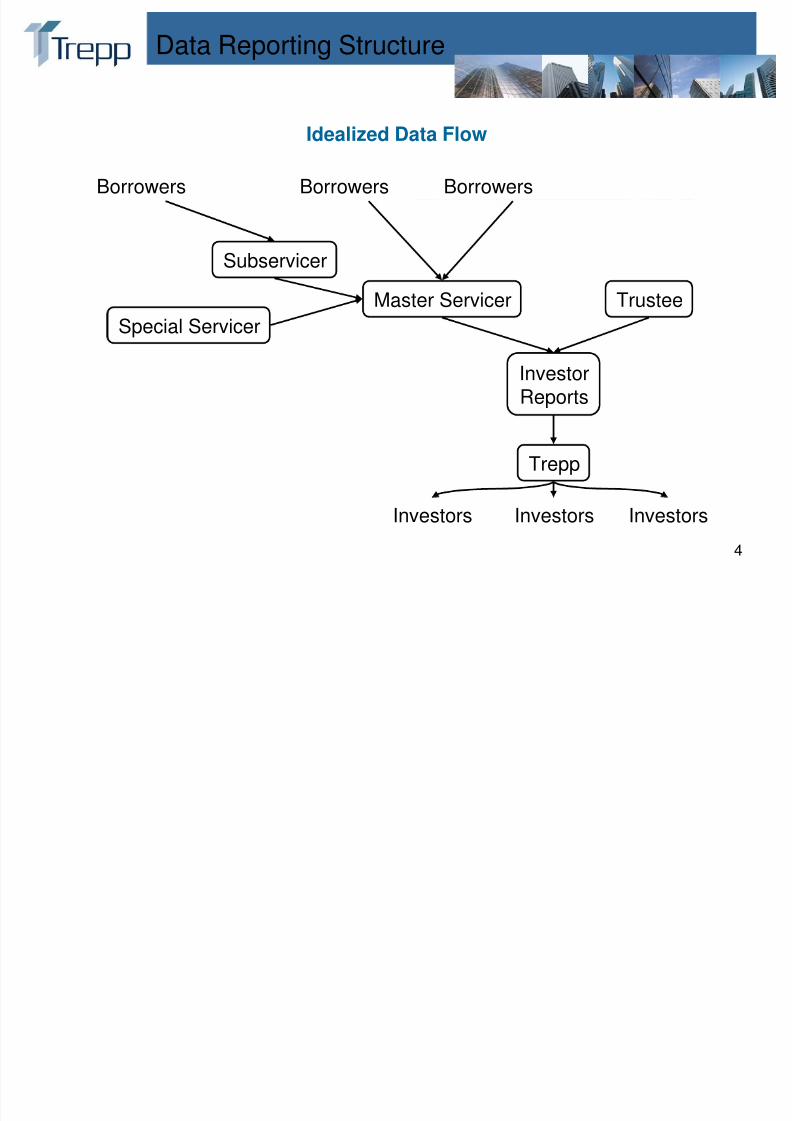
Data Reporting Structure
Idealized Data Flow
Borrowers Borrowers Borrowers
Subservicer
Master ServicerSpecial Servicer Trustee
InvestorReports
Trepp
InvestorsInvestors Investors

8/3/2019 TREPP CMBS 2011 Q2
http://slidepdf.com/reader/full/trepp-cmbs-2011-q2 5/35
5
CMBS Market Trends

8/3/2019 TREPP CMBS 2011 Q2
http://slidepdf.com/reader/full/trepp-cmbs-2011-q2 6/35
6
CMBS Market Trends
• CMBS Secondary Market Spreads
• Balance Sheet Lender Spreads• CMBS Primary Market
8/3/2019 TREPP CMBS 2011 Q2
http://slidepdf.com/reader/full/trepp-cmbs-2011-q2 7/35
7
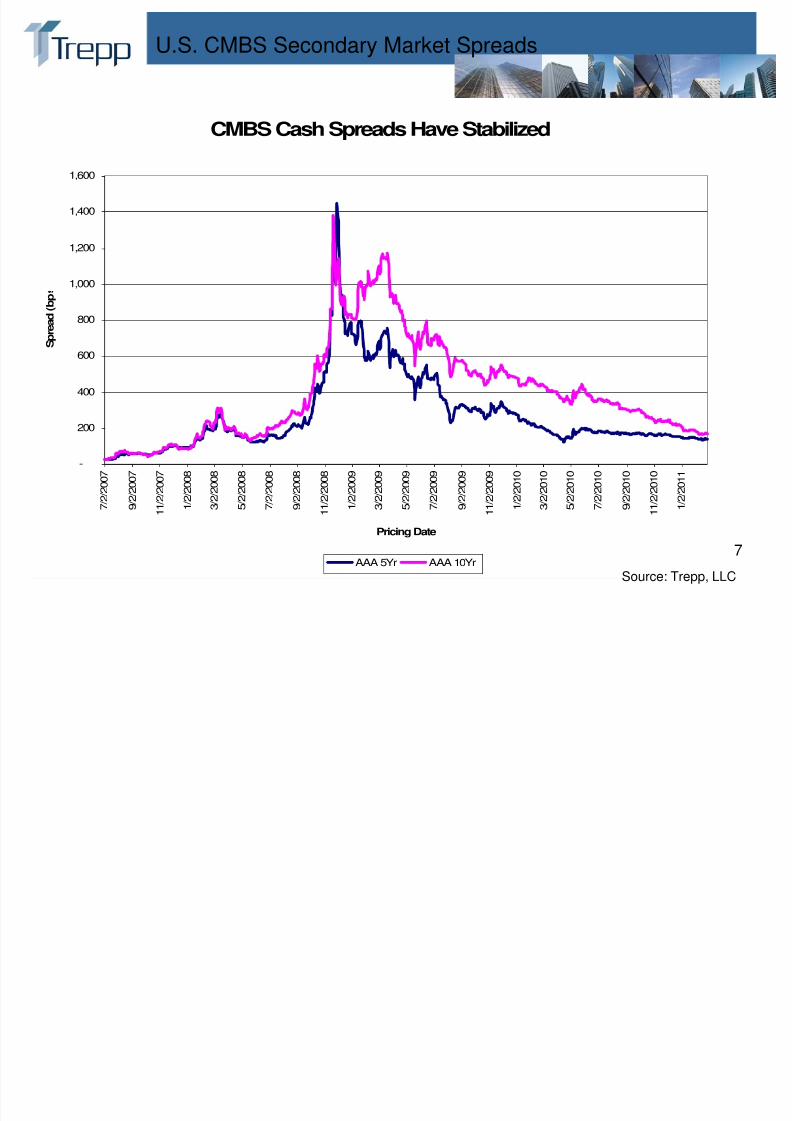
U.S. CMBS Secondary Market Spreads
CMBS Cash Spreads Have Stabilized
-
200
400
600
800
1,000
1,200
1,400
1,600
7 / 2 / 2 0 0 7
9 / 2 / 2 0 0 7
1 1 / 2 / 2 0 0 7
1 / 2 / 2 0 0 8
3 / 2 / 2 0 0 8
5 / 2 / 2 0 0 8
7 / 2 / 2 0 0 8
9 / 2 / 2 0 0 8
1 1 / 2 / 2 0 0 8
1 / 2 / 2 0 0 9
3 / 2 / 2 0 0 9
5 / 2 / 2 0 0 9
7 / 2 / 2 0 0 9
9 / 2 / 2 0 0 9
1 1 / 2 / 2 0 0 9
1 / 2 / 2 0 1 0
3 / 2 / 2 0 1 0
5 / 2 / 2 0 1 0
7 / 2 / 2 0 1 0
9 / 2 / 2 0 1 0
1 1 / 2 / 2 0 1 0
1 / 2 / 2 0 1 1
Pricing Date
S p r e a d ( b p
AAA 5Yr AAA 10Yr
Source: Trepp, LLC
8/3/2019 TREPP CMBS 2011 Q2
http://slidepdf.com/reader/full/trepp-cmbs-2011-q2 8/35
8
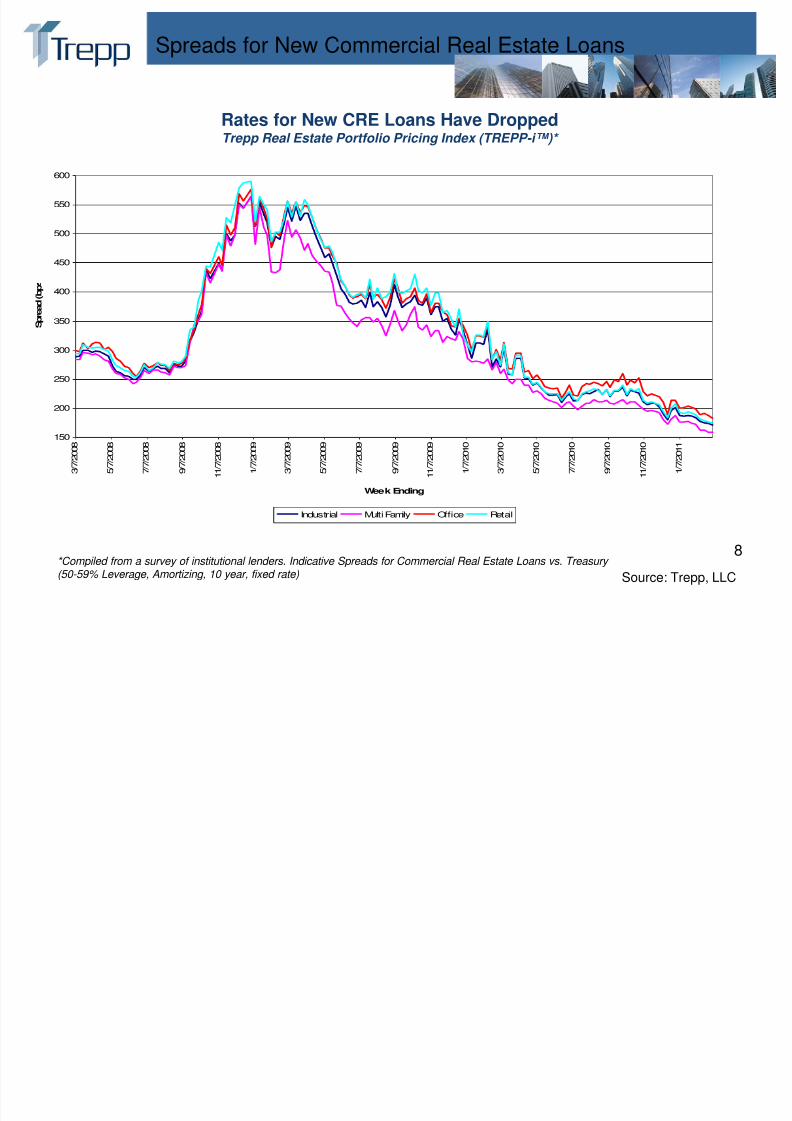
Spreads for New Commercial Real Estate Loans
*Compiled from a survey of institutional lenders. Indicative Spreads for Commercial Real Estate Loans vs. Treasury (50-59% Leverage, Amortizing, 10 year, fixed rate)
Rates for New CRE Loans Have DroppedTrepp Real Estate Portfolio Pricing Index (TREPP-i™)*
Source: Trepp, LLC
150
200
250
300
350
400
450
500
550
600
3 / 7 / 2 0 0 8
5 / 7 / 2 0 0 8
7 / 7 / 2 0 0 8
9 / 7 / 2 0 0 8
1 1 / 7 / 2 0 0 8
1 / 7 / 2 0 0 9
3 / 7 / 2 0 0 9
5 / 7 / 2 0 0 9
7 / 7 / 2 0 0 9
9 / 7 / 2 0 0 9
1 1 / 7 / 2 0 0 9
1 / 7 / 2 0 1 0
3 / 7 / 2 0 1 0
5 / 7 / 2 0 1 0
7 / 7 / 2 0 1 0
9 / 7 / 2 0 1 0
1 1 / 7 / 2 0 1 0
1 / 7 / 2 0 1 1
Week Ending
S p r e a d ( b p
Industrial Multi Family Office Retail
8/3/2019 TREPP CMBS 2011 Q2
http://slidepdf.com/reader/full/trepp-cmbs-2011-q2 9/35
9
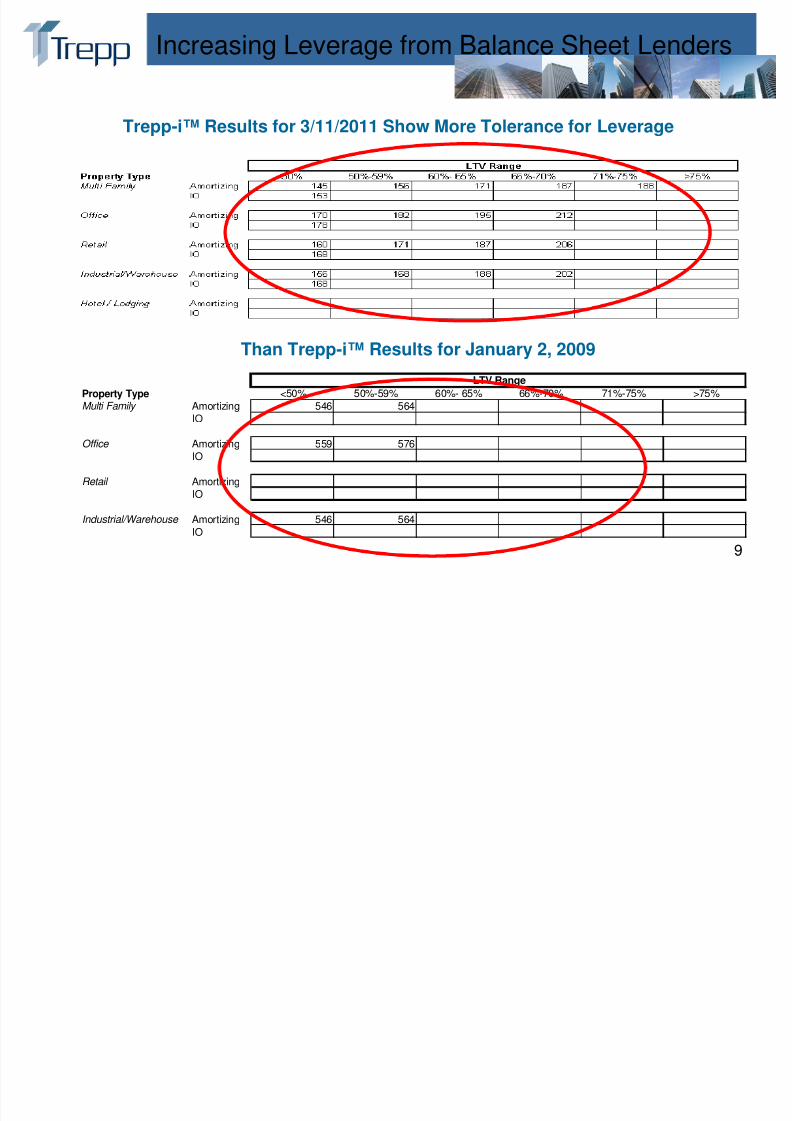
Increasing Leverage from Balance Sheet Lenders
Trepp-i™ Results for 3/11/2011 Show More Tolerance for Leverage
Than Trepp-i™ Results for January 2, 2009
Property Type <50% 50%-59% 60%- 65% 66%-70% 71%-75% >75%Multi Family Amortizing 546 564
IO
Office Amortizing 559 576IO
Retail AmortizingIO
Industrial/Warehouse Amortizing 546 564IO
LTV Range
8/3/2019 TREPP CMBS 2011 Q2
http://slidepdf.com/reader/full/trepp-cmbs-2011-q2 10/35
10
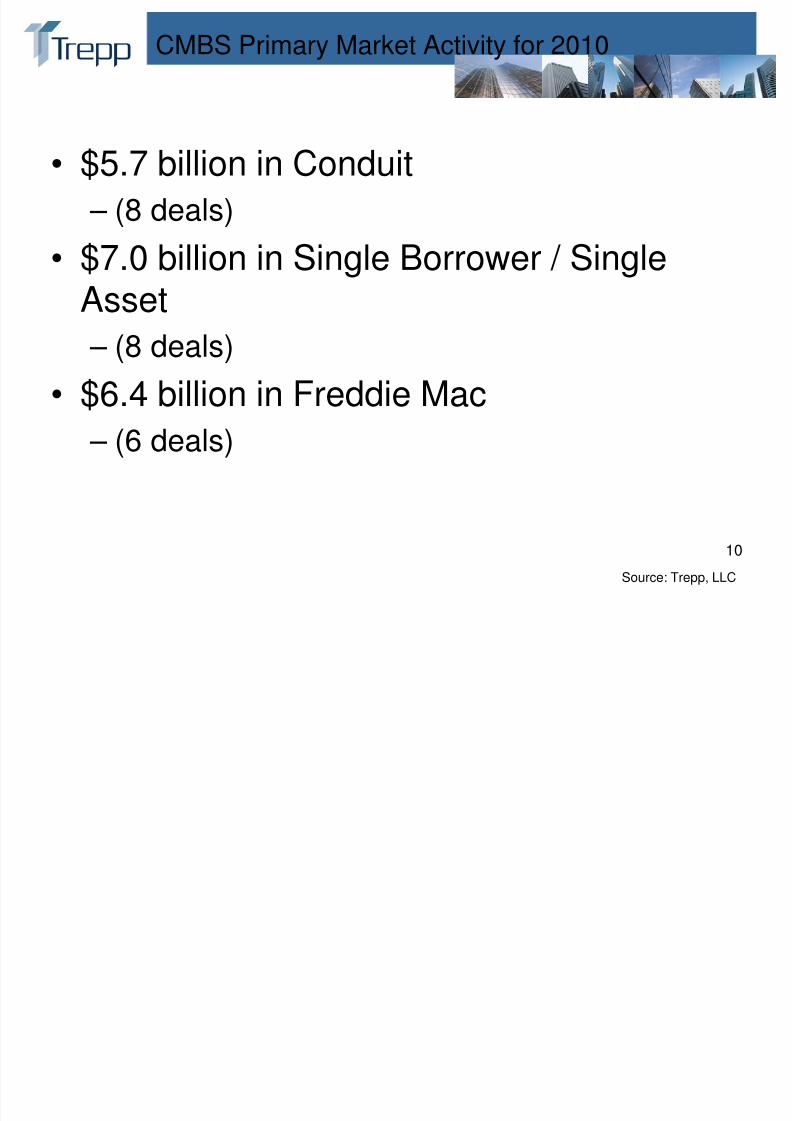
CMBS Primary Market Activity for 2010
• $5.7 billion in Conduit
– (8 deals)
• $7.0 billion in Single Borrower / Single
Asset – (8 deals)
• $6.4 billion in Freddie Mac
– (6 deals)
Source: Trepp, LLC
8/3/2019 TREPP CMBS 2011 Q2
http://slidepdf.com/reader/full/trepp-cmbs-2011-q2 11/35
11
CMBS 2.0
• Back to the Future – Addressing Risk
– Increased subordination levels – Lower Loan to Value
– Higher Debt Service Coverage
– More amortization• The “New” New Thing – Addressing Conflicts
– Certificate Administrator
– Operating Advisor – Excess Fee Reserves
– Voting Rights
Source: Trepp, LLC
8/3/2019 TREPP CMBS 2011 Q2
http://slidepdf.com/reader/full/trepp-cmbs-2011-q2 12/35
12
Loan Performance in Outstanding CMBS
8/3/2019 TREPP CMBS 2011 Q2
http://slidepdf.com/reader/full/trepp-cmbs-2011-q2 13/35
13
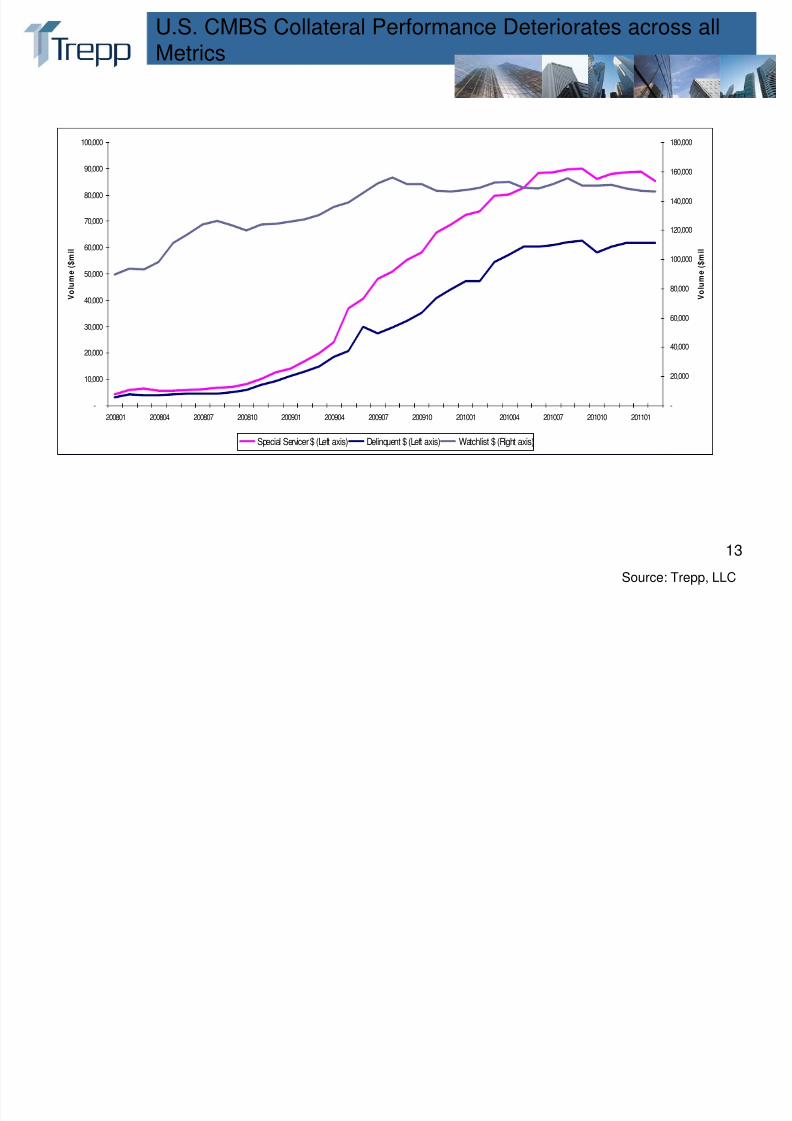
U.S. CMBS Collateral Performance Deteriorates across allMetrics
Source: Trepp, LLC
-
10,000
20,000
30,000
40,000
50,000
60,000
70,000
80,000
90,000
100,000
200801 200804 200807 200810 200901 200904 200907 200910 201001 201004 201007 201010 201101
V o l u m
e ( $ m
i l
-
20,000
40,000
60,000
80,000
100,000
120,000
140,000
160,000
180,000
V o l u m
e ( $ m
i l
Special Servicer $ (Left axis) Delinquent $ (Left axis) Watchlist $ (Right axis)
8/3/2019 TREPP CMBS 2011 Q2
http://slidepdf.com/reader/full/trepp-cmbs-2011-q2 14/35
14
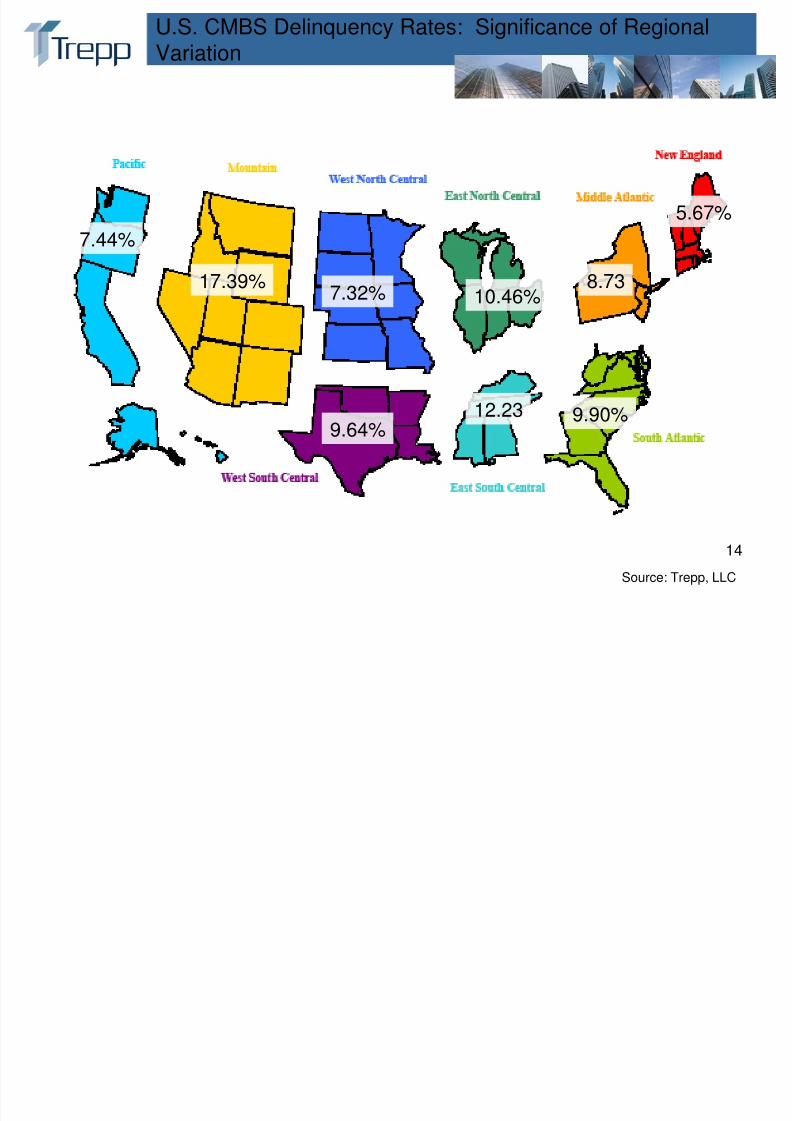
U.S. CMBS Delinquency Rates: Significance of RegionalVariation
10.46%
12.23
8.7317.39%
5.67%
7.32%
7.44%
9.64% 9.90%
Source: Trepp, LLC
8/3/2019 TREPP CMBS 2011 Q2
http://slidepdf.com/reader/full/trepp-cmbs-2011-q2 15/35
15
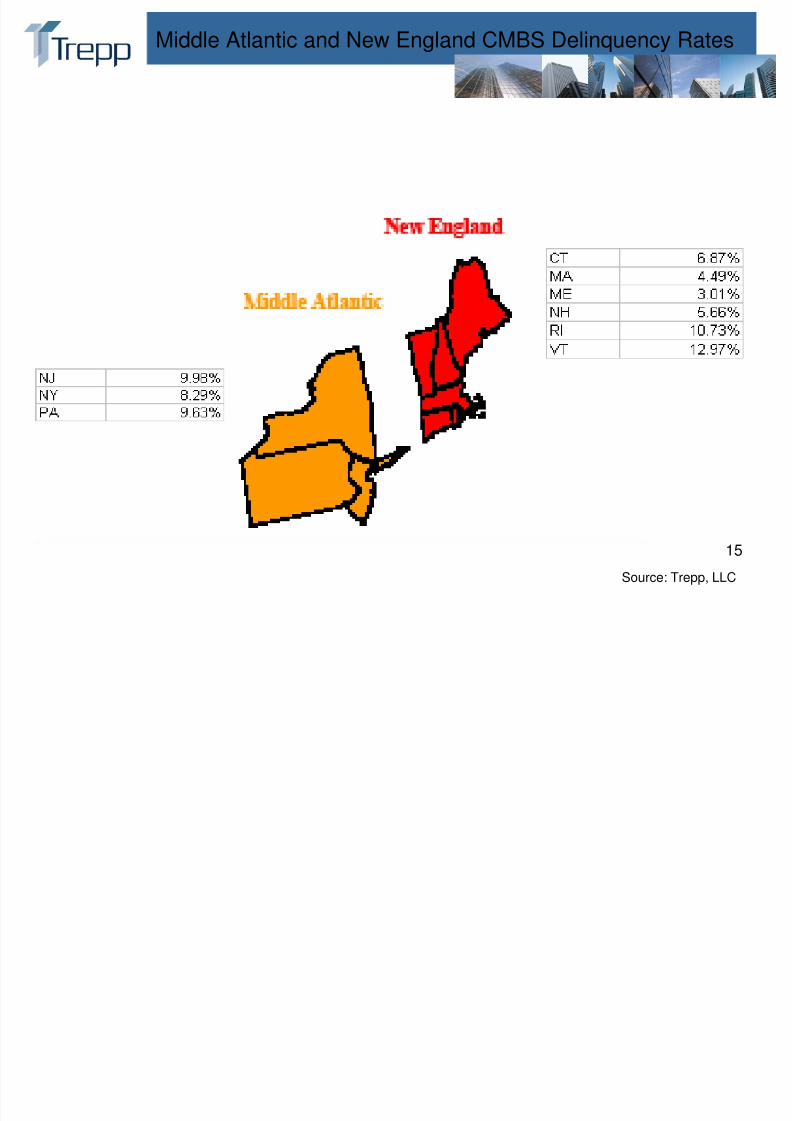
Middle Atlantic and New England CMBS Delinquency Rates
Source: Trepp, LLC
8/3/2019 TREPP CMBS 2011 Q2
http://slidepdf.com/reader/full/trepp-cmbs-2011-q2 16/35
16
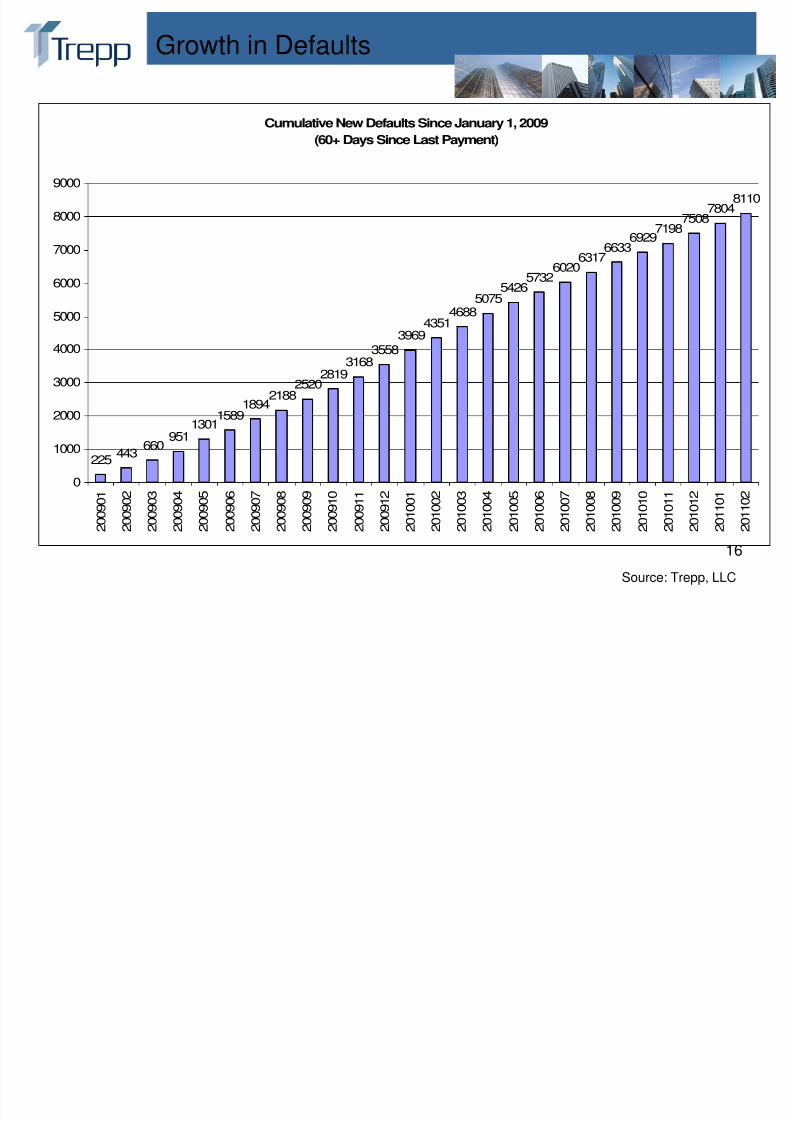
Growth in Defaults
Cumulative New Defaults Since January 1, 2009
(60+ Days Since Last Payment)
225443
660951
13011589
18942188
25202819
31683558
396943514688
50755426
57326020
63176633
69297198
75087804
8110
0
1000
2000
3000
4000
5000
6000
7000
8000
9000
2 0 0 9 0 1
2 0 0 9 0 2
2 0 0 9 0 3
2 0 0 9 0 4
2 0 0 9 0 5
2 0 0 9 0 6
2 0 0 9 0 7
2 0 0 9 0 8
2 0 0 9 0 9
2 0 0 9 1 0
2 0 0 9 1 1
2 0 0 9 1 2
2 0 1 0 0 1
2 0 1 0 0 2
2 0 1 0 0 3
2 0 1 0 0 4
2 0 1 0 0 5
2 0 1 0 0 6
2 0 1 0 0 7
2 0 1 0 0 8
2 0 1 0 0 9
2 0 1 0 1 0
2 0 1 0 1 1
2 0 1 0 1 2
2 0 1 1 0 1
2 0 1 1 0 2
Source: Trepp, LLC
8/3/2019 TREPP CMBS 2011 Q2
http://slidepdf.com/reader/full/trepp-cmbs-2011-q2 17/35
17
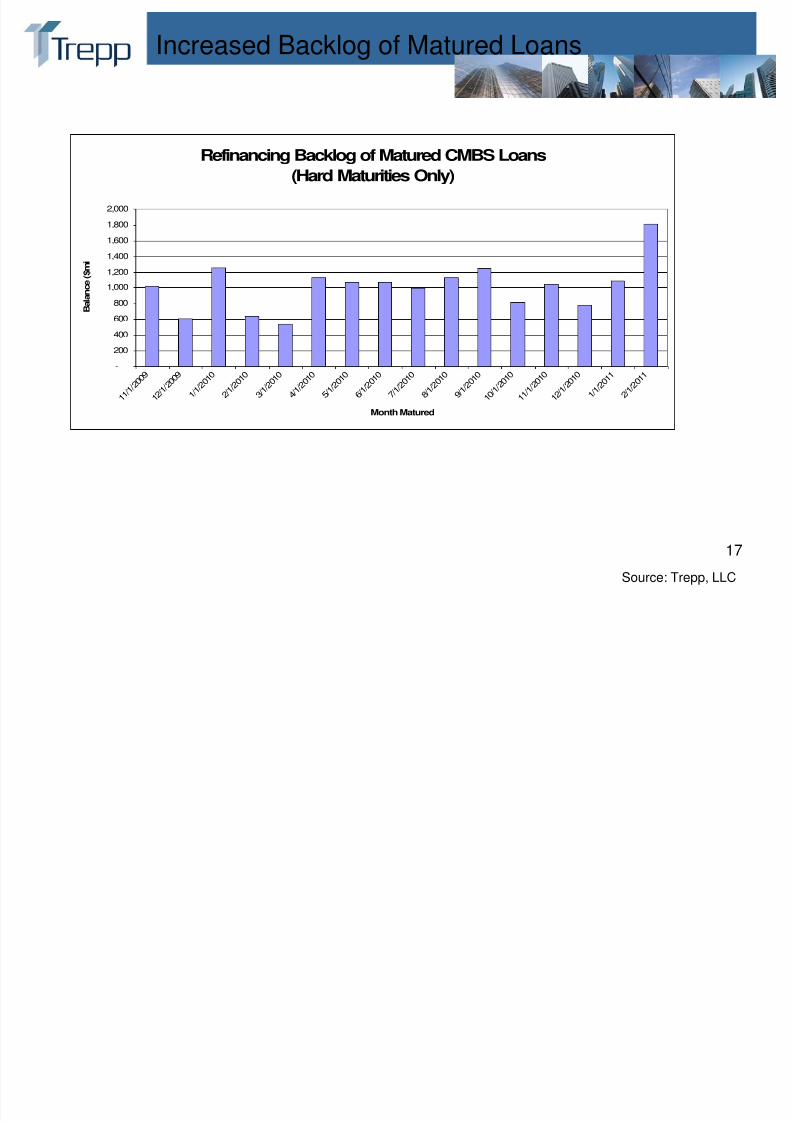
Increased Backlog of Matured Loans
Refinancing Backlog of Matured CMBS Loans
(Hard Maturities Only)
-
200
400
600
800
1,000
1,200
1,400
1,600
1,800
2,000
1 1 / 1 / 2 0 0 9
1 2 / 1 / 2 0 0 9
1 / 1 / 2 0 1 0
2 / 1 / 2 0 1 0
3 / 1 / 2 0 1 0
4 / 1 / 2 0 1 0
5 / 1 / 2 0 1 0
6 / 1 / 2 0 1 0
7 / 1 / 2 0 1 0
8 / 1 / 2 0 1 0
9 / 1 / 2 0 1 0
1 0 / 1 / 2 0 1 0
1 1 / 1 / 2 0 1 0
1 2 / 1 / 2 0 1 0
1 / 1 / 2 0 1 1
2 / 1 / 2 0 1 1
Month Matured
B
a l a n c e ( $ m i
Source: Trepp, LLC
8/3/2019 TREPP CMBS 2011 Q2
http://slidepdf.com/reader/full/trepp-cmbs-2011-q2 18/35
18
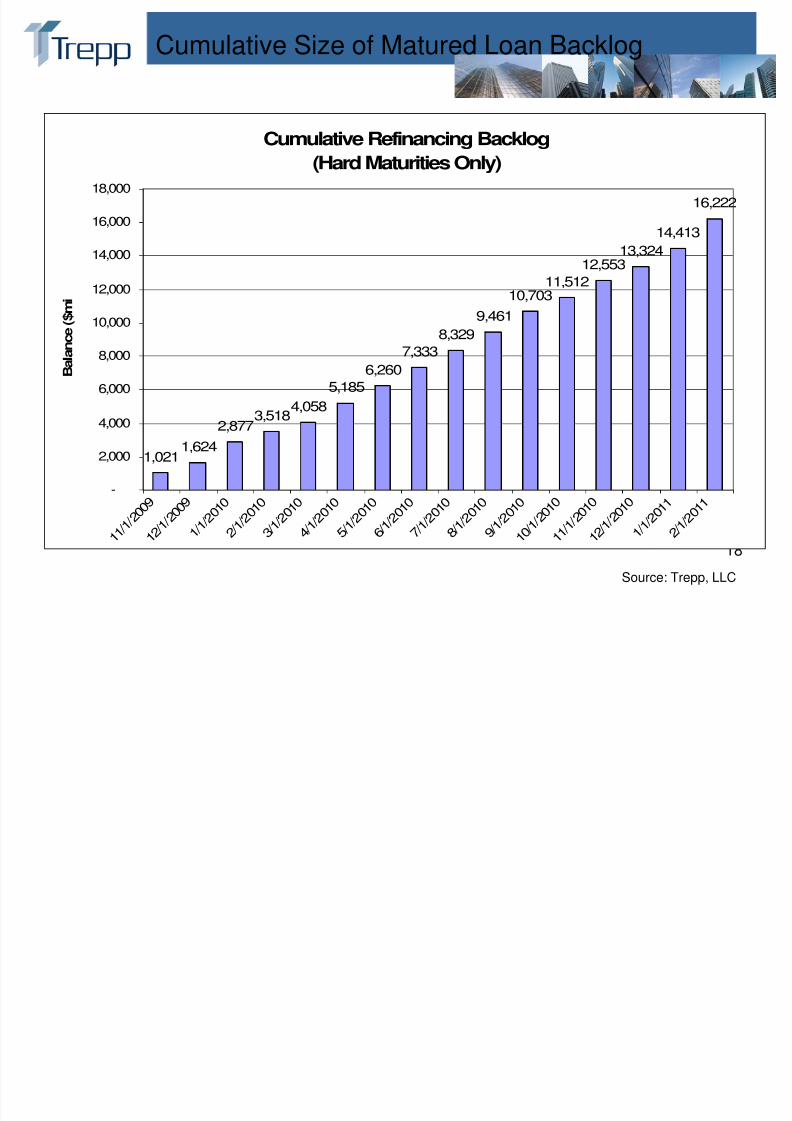
Cumulative Size of Matured Loan Backlog
Cumulative Refinancing Backlog
(Hard Maturities Only)
1,0211,624
2,8773,5184,058
5,185
6,260
7,333
8,3299,461
10,70311,512
12,55313,324
14,413
16,222
-
2,000
4,000
6,000
8,000
10,000
12,000
14,000
16,000
18,000
1 1 / 1 / 2
0 0 9
1 2 / 1 / 2
0 0 9
1 / 1 / 2
0 1 0
2 / 1 / 2
0 1 0
3 / 1 / 2
0 1 0
4 / 1 / 2
0 1 0
5 / 1 / 2
0 1 0
6 / 1 / 2
0 1 0
7 / 1 / 2
0 1 0
8 / 1 / 2
0 1 0
9 / 1 / 2
0 1 0
1 0 / 1 / 2
0 1 0
1 1 / 1 / 2
0 1 0
1 2 / 1 / 2
0 1 0
1 / 1 / 2
0 1 1
2 / 1 / 2
0 1 1
B a l a n c e ( $ m
i
Source: Trepp, LLC
8/3/2019 TREPP CMBS 2011 Q2
http://slidepdf.com/reader/full/trepp-cmbs-2011-q2 19/35
19
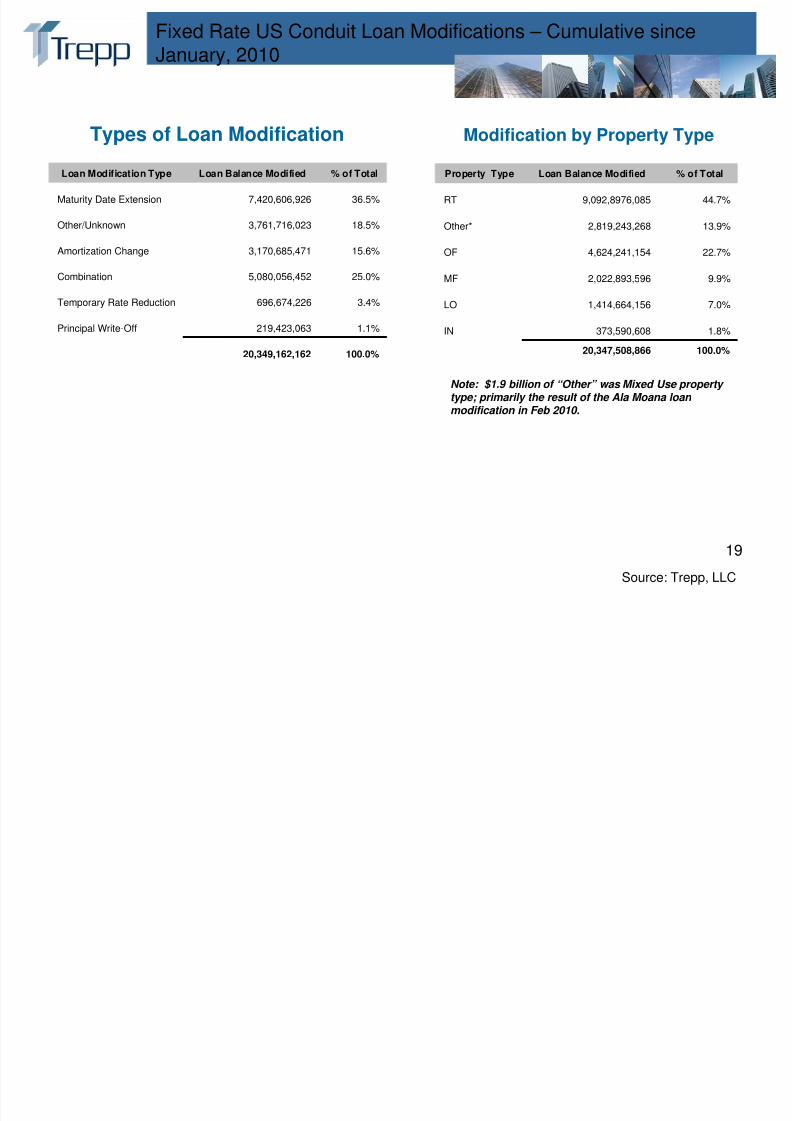
Fixed Rate US Conduit Loan Modifications – Cumulative sinceJanuary, 2010
Loan Modification Type Loan Balance Modified % of Total
Maturity Date Extension 7,420,606,926 36.5%
Other/Unknown 3,761,716,023 18.5%
Amortization Change 3,170,685,471 15.6%
Combination 5,080,056,452 25.0%
Temporary Rate Reduction 696,674,226 3.4%
Principal Write-Off 219,423,063 1.1%
20,349,162,162 100.0%
Property Type Loan Balance Modified % of Total
RT 9,092,8976,085 44.7%
Other* 2,819,243,268 13.9%
OF 4,624,241,154 22.7%
MF 2,022,893,596 9.9%
LO 1,414,664,156 7.0%
IN 373,590,608 1.8%
20,347,508,866 100.0%
Note: $1.9 billion of “Other” was Mixed Use property type; primarily the result of the Ala Moana loan
modification in Feb 2010.
Source: Trepp, LLC
Types of Loan Modification Modification by Property Type
8/3/2019 TREPP CMBS 2011 Q2
http://slidepdf.com/reader/full/trepp-cmbs-2011-q2 20/35
20
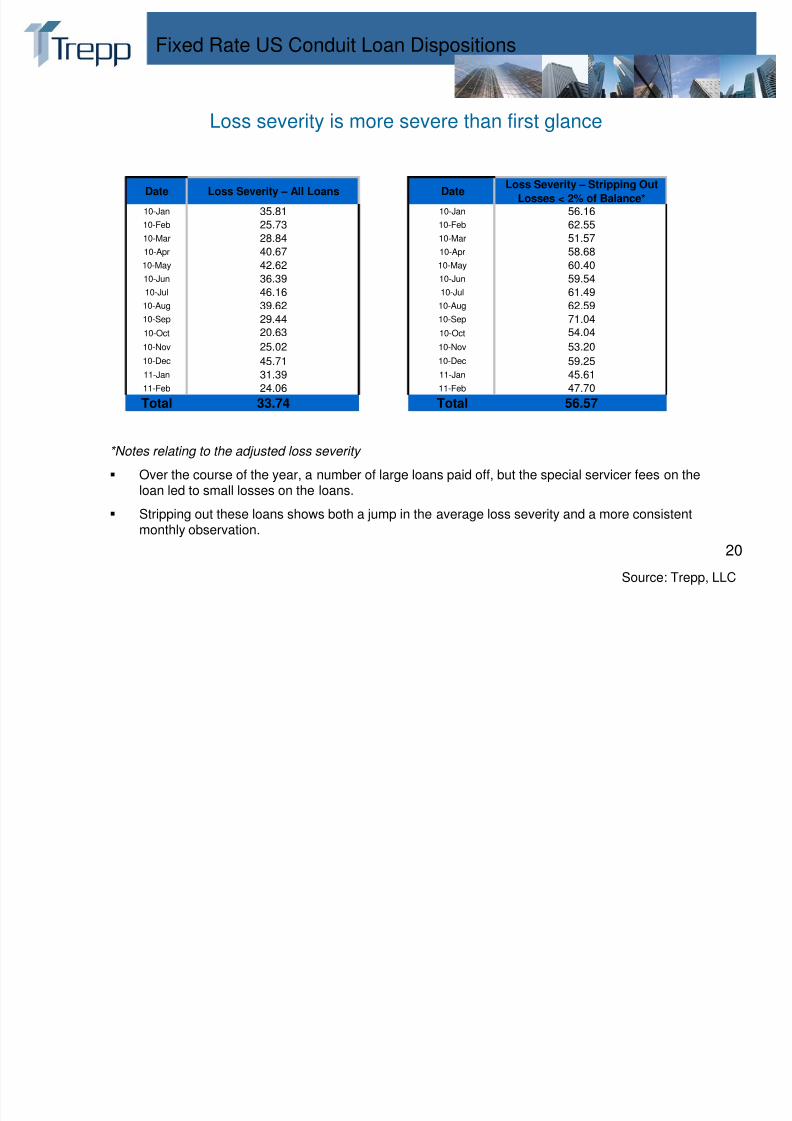
Fixed Rate US Conduit Loan Dispositions
*Notes relating to the adjusted loss severity
Over the course of the year, a number of large loans paid off, but the special servicer fees on theloan led to small losses on the loans.
Stripping out these loans shows both a jump in the average loss severity and a more consistentmonthly observation.
Source: Trepp, LLC
Loss severity is more severe than first glance
Date Loss Severity – All Loans DateLoss Severity – Stripping Out
Losses < 2% of Balance*
10-Jan 35.81 10-Jan 56.1610-Feb 25.73 10-Feb 62.5510-Mar 28.84 10-Mar 51.5710-Apr 40.67 10-Apr 58.6810-May 42.62 10-May 60.4010-Jun 36.39 10-Jun 59.5410-Jul 46.16 10-Jul 61.4910-Aug 39.62 10-Aug 62.5910-Sep 29.44 10-Sep 71.04
10-Oct 20.63 10-Oct 54.04
10-Nov 25.02 10-Nov 53.20
10-Dec 45.71 10-Dec 59.2511-Jan 31.39 11-Jan 45.6111-Feb 24.06 11-Feb 47.70
Total 33.74 Total 56.57

8/3/2019 TREPP CMBS 2011 Q2
http://slidepdf.com/reader/full/trepp-cmbs-2011-q2 21/35
21
Property Performance in Outstanding CMBS
8/3/2019 TREPP CMBS 2011 Q2
http://slidepdf.com/reader/full/trepp-cmbs-2011-q2 22/35
8/3/2019 TREPP CMBS 2011 Q2
http://slidepdf.com/reader/full/trepp-cmbs-2011-q2 23/35
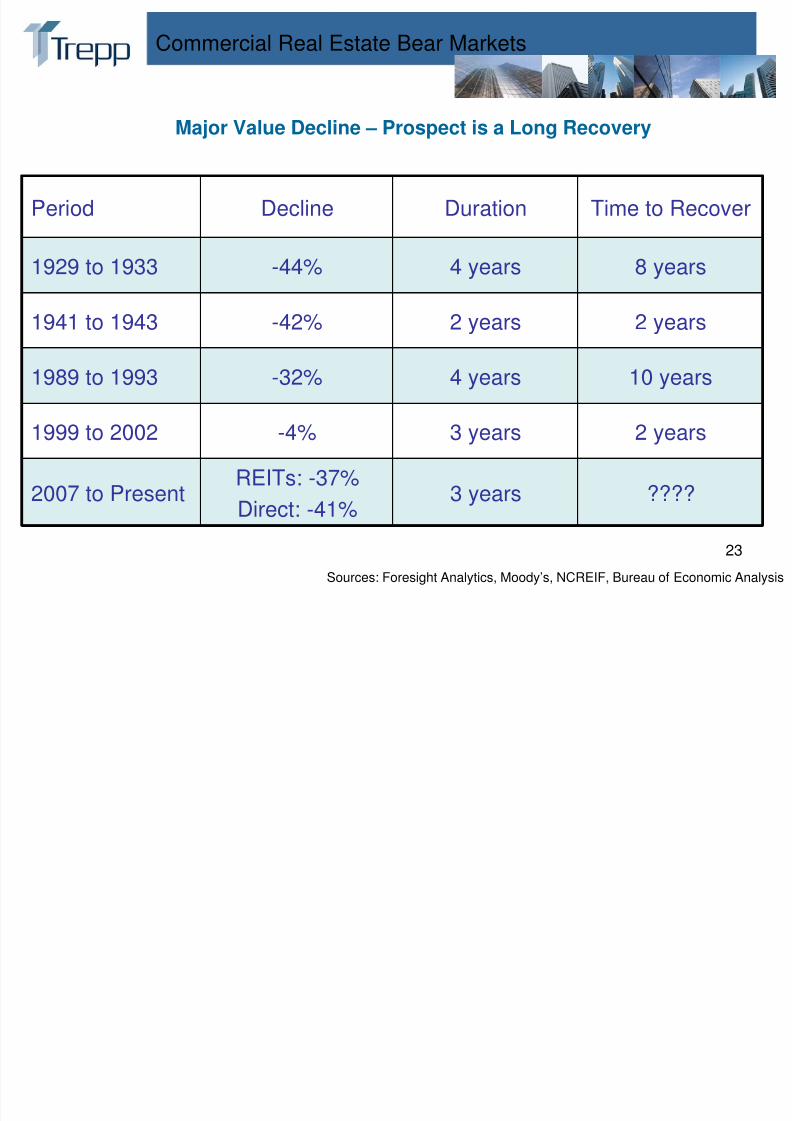
23
Commercial Real Estate Bear Markets
Sources: Foresight Analytics, Moody’s, NCREIF, Bureau of Economic Analysis
Period Decline Duration Time to Recover
1929 to 1933 -44% 4 years 8 years
1941 to 1943 -42% 2 years 2 years
1989 to 1993 -32% 4 years 10 years
1999 to 2002 -4% 3 years 2 years
2007 to PresentREITs: -37%
Direct: -41%
3 years ????
Major Value Decline – Prospect is a Long Recovery
8/3/2019 TREPP CMBS 2011 Q2
http://slidepdf.com/reader/full/trepp-cmbs-2011-q2 24/35
24
Measuring Property Performance
• Can the property pay the mortgage?
• Measured by “Debt Service Coverage Ratio”
DSCR = (Net Cash Flow) / (Mortgage Payments)
or
DSCR = (Net Operating Income) / (Mortgage Payments)
8/3/2019 TREPP CMBS 2011 Q2
http://slidepdf.com/reader/full/trepp-cmbs-2011-q2 25/35
25
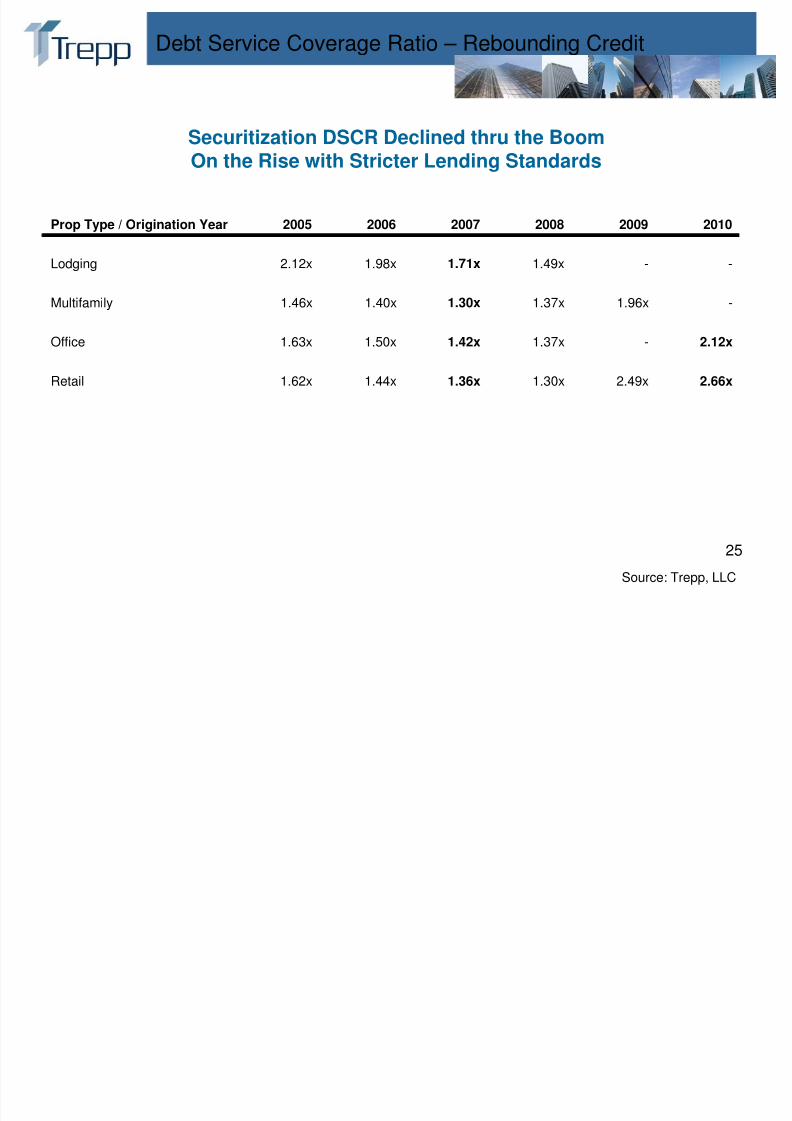
Debt Service Coverage Ratio – Rebounding Credit
Prop Type / Origination Year 2005 2006 2007 2008 2009 2010
Lodging 2.12x 1.98x 1.71x 1.49x - -
Multifamily 1.46x 1.40x 1.30x 1.37x 1.96x -
Office 1.63x 1.50x 1.42x 1.37x - 2.12x
Retail 1.62x 1.44x 1.36x 1.30x 2.49x 2.66x
Source: Trepp, LLC
Securitization DSCR Declined thru the BoomOn the Rise with Stricter Lending Standards

8/3/2019 TREPP CMBS 2011 Q2
http://slidepdf.com/reader/full/trepp-cmbs-2011-q2 26/35
26
2011 and Into the Future
8/3/2019 TREPP CMBS 2011 Q2
http://slidepdf.com/reader/full/trepp-cmbs-2011-q2 27/35
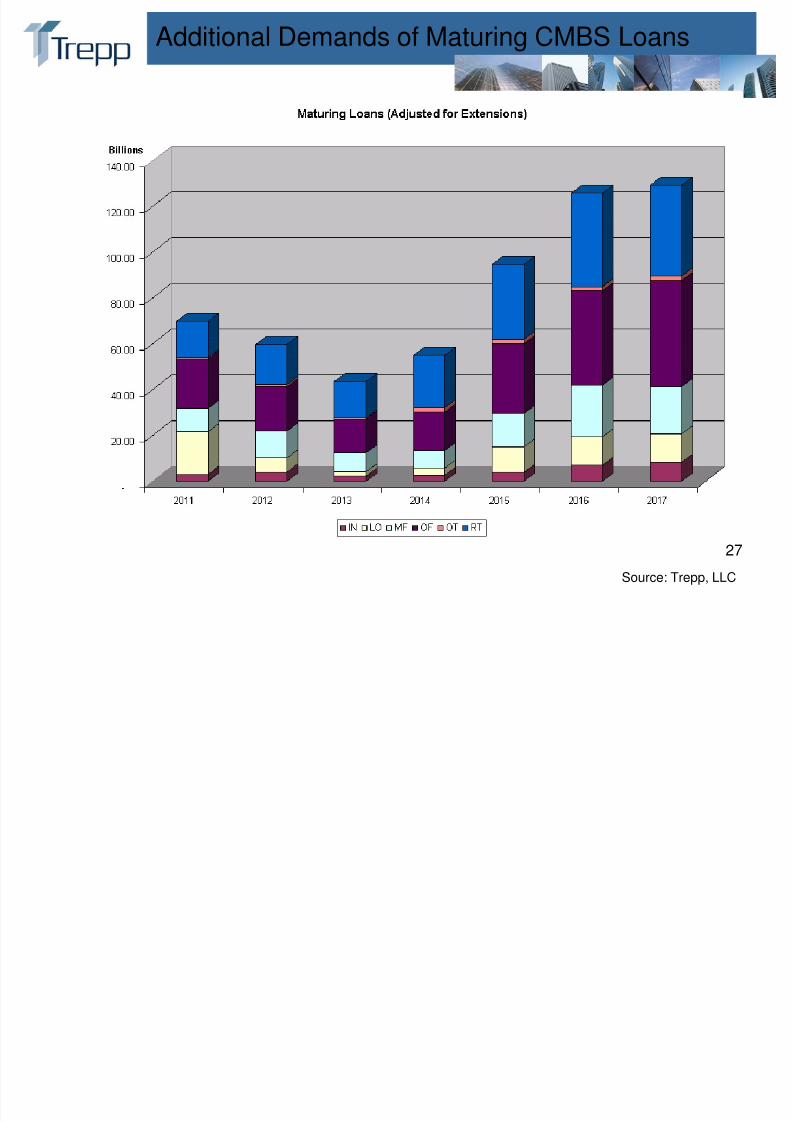
27
Additional Demands of Maturing CMBS Loans
Source: Trepp, LLC
8/3/2019 TREPP CMBS 2011 Q2
http://slidepdf.com/reader/full/trepp-cmbs-2011-q2 28/35
28
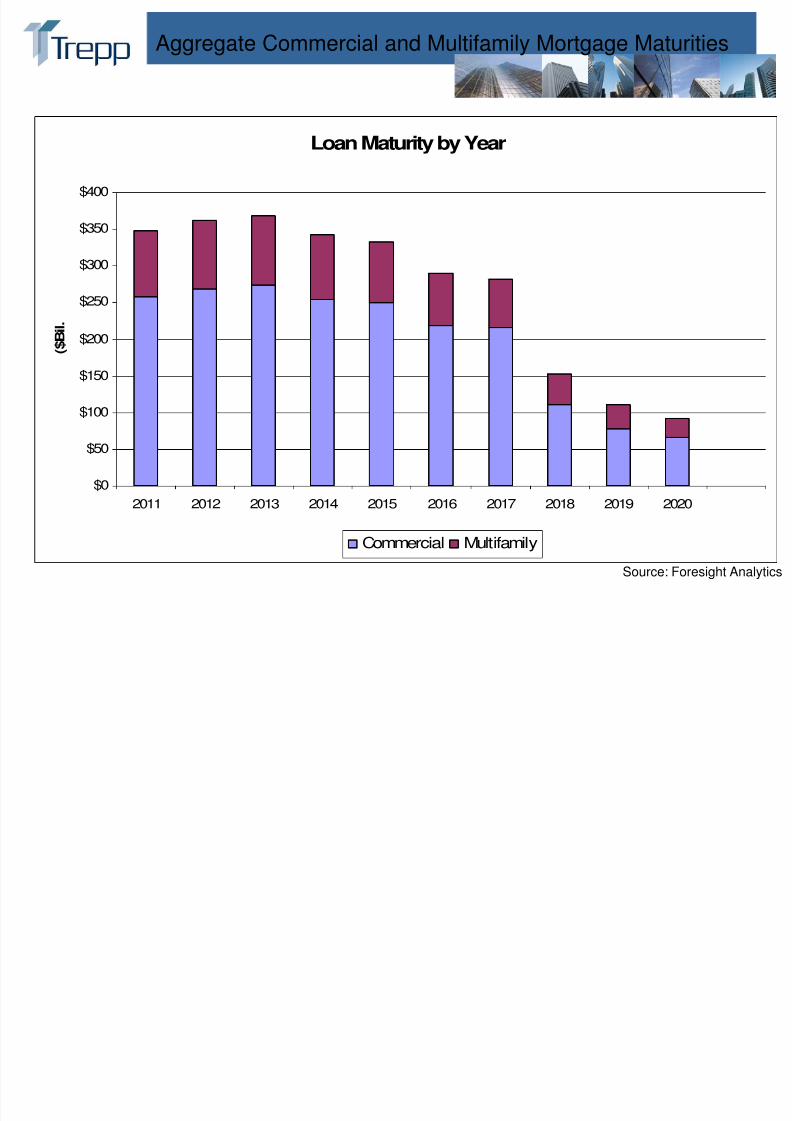
Aggregate Commercial and Multifamily Mortgage Maturities
Source: Foresight Analytics
Loan Maturity by Year
$0
$50
$100
$150
$200
$250
$300
$350
$400
2011 2012 2013 2014 2015 2016 2017 2018 2019 2020
( $ B i l .
Commercial Multifamily
8/3/2019 TREPP CMBS 2011 Q2
http://slidepdf.com/reader/full/trepp-cmbs-2011-q2 29/35
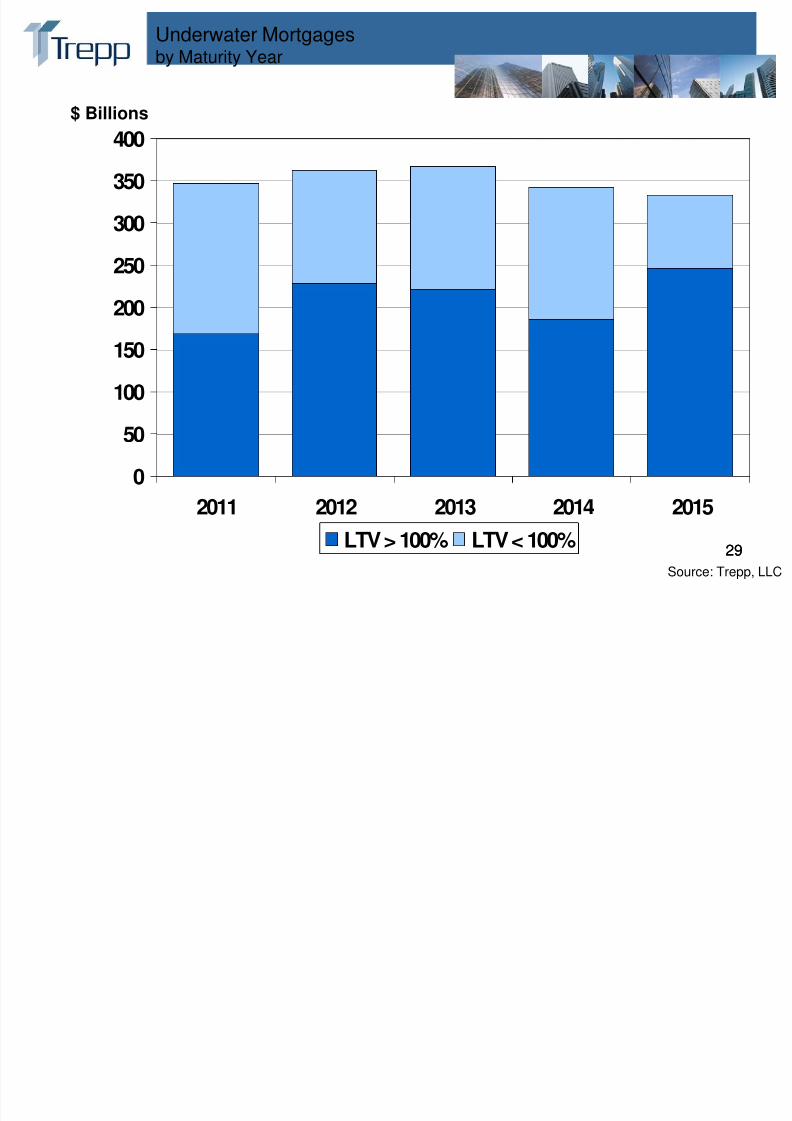
2929
Underwater Mortgagesby Maturity Year
0
50
100
150
200
250
300
350
400
2011 2012 2013 2014 2015
LTV > 100% LTV < 100%
Source: Trepp, LLC
$ Billions
8/3/2019 TREPP CMBS 2011 Q2
http://slidepdf.com/reader/full/trepp-cmbs-2011-q2 30/35
30
Looking Forward
• Dodd Frank• FDIC Proposals
• SEC Proposals• New lending platforms
• Covered Bonds

8/3/2019 TREPP CMBS 2011 Q2
http://slidepdf.com/reader/full/trepp-cmbs-2011-q2 31/35
31
Introduction to Trepp, LLC
8/3/2019 TREPP CMBS 2011 Q2
http://slidepdf.com/reader/full/trepp-cmbs-2011-q2 32/35
3232
about Trepp, LLC
• Trepp is the leading provider of analytics, information and technology to the global CMBS and
commercial mortgage finance industry
• Foresight Analytics is a division of Trepp
• 30 year history in structured finance with a focus on CMBS the past 15 years
• Headquartered in New York City with offices in San Francisco and London
• Deal coverage includes North American, European, and Asian CMBS as well as Commercial Real
Estate backed CDOs
• Largest commercially available database containing detailed information on over 1800 deals and
more than 100,000 loans which support close to $800 billion in securities
• Trepp is a wholly-owned subsidiary of DMG Information, which is a part of the Daily Mail Group, a
multi-billion pound media company in Britain.
8/3/2019 TREPP CMBS 2011 Q2
http://slidepdf.com/reader/full/trepp-cmbs-2011-q2 33/35
33
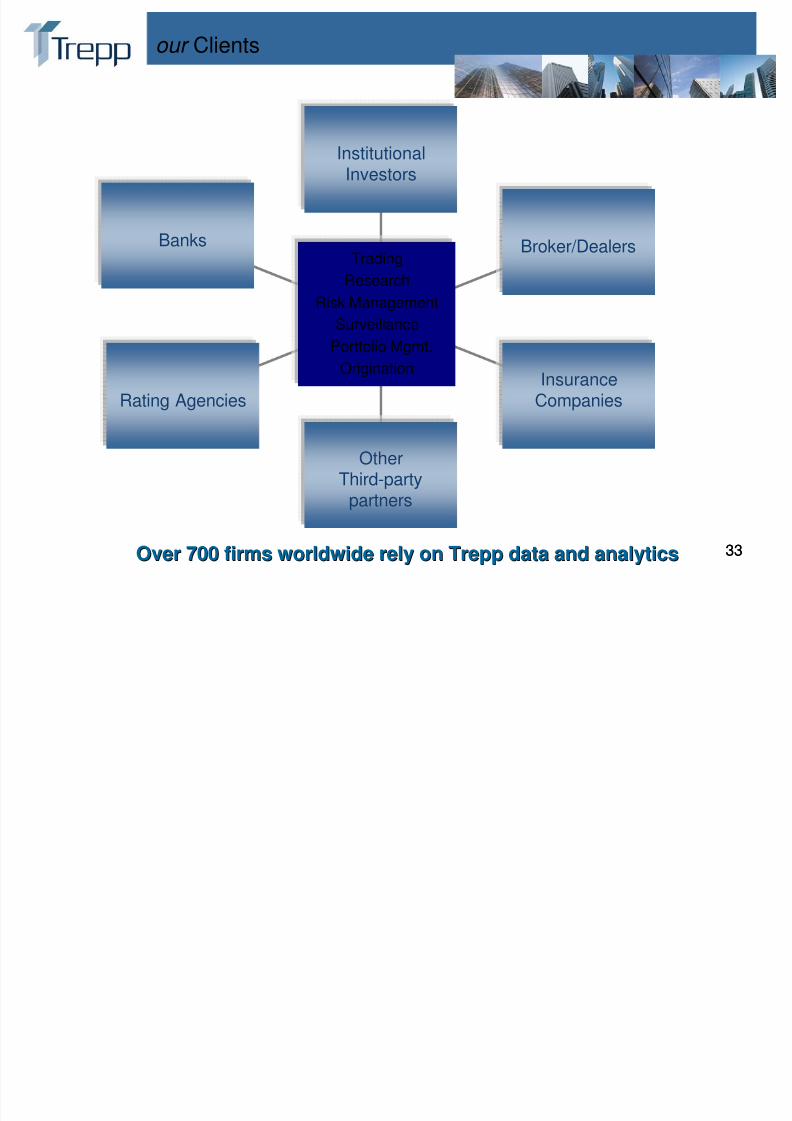
our Clients
Banks
Rating Agencies
OtherThird-party
partners
InsuranceCompanies
Broker/Dealers
InstitutionalInvestors
Trading
Research
Risk Management
Surveillance
Portfolio Mgmt.
Origination
Over 700 firms worldwide rely on Trepp data and analyticsOver 700 firms worldwide rely on Trepp data and analytics 33
8/3/2019 TREPP CMBS 2011 Q2
http://slidepdf.com/reader/full/trepp-cmbs-2011-q2 34/35
34
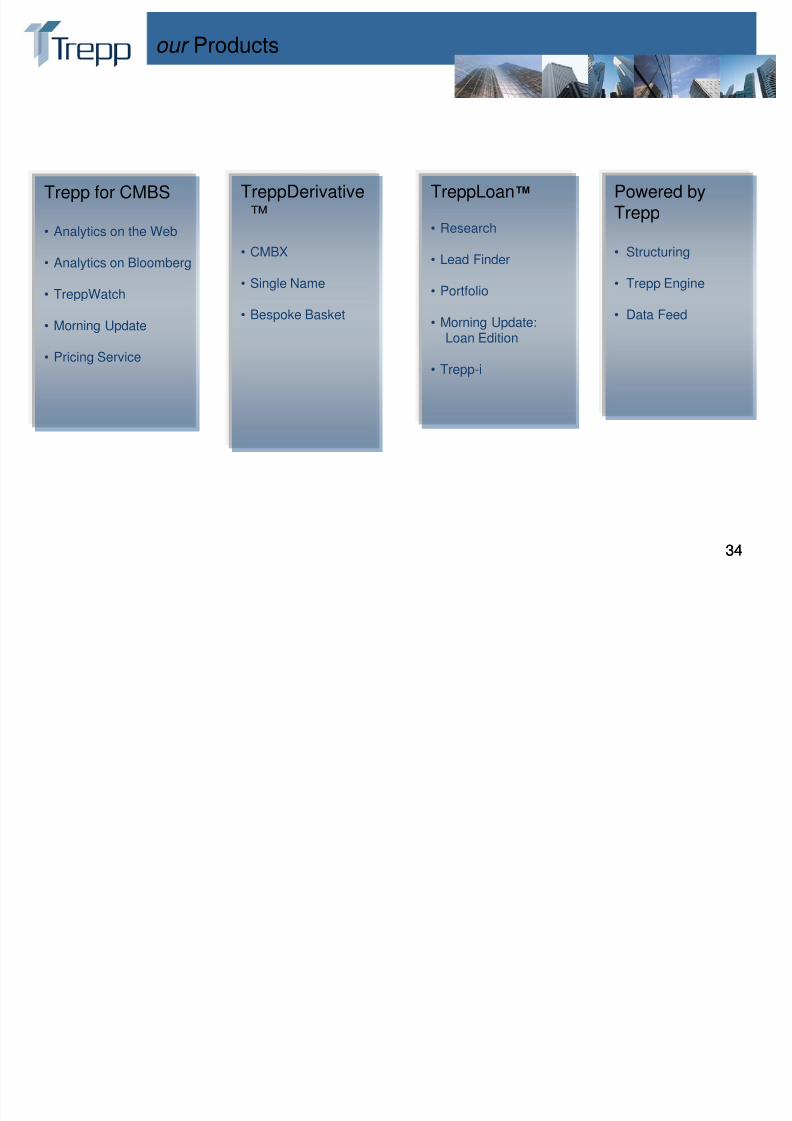
our Products
TreppLoan™
• Research
• Lead Finder
• Portfolio
• Morning Update:Loan Edition
• Trepp-i
Trepp for CMBS
• Analytics on the Web
• Analytics on Bloomberg
• TreppWatch
• Morning Update
• Pricing Service
Powered by
Trepp
• Structuring
• Trepp Engine
• Data Feed
TreppDerivative
™
• CMBX
• Single Name
• Bespoke Basket
34

8/3/2019 TREPP CMBS 2011 Q2
http://slidepdf.com/reader/full/trepp-cmbs-2011-q2 35/35
3535