Embed Size (px)
Citation preview
Qualcomm Technologies, Inc.
© 2010-2015 Qualcomm Technologies, Inc. and/or its affiliated companies. All rights reserved.
Trepn is a product of Qualcomm Technologies, Inc. Other Qualcomm products referenced herein are products of Qualcomm Technologies, Inc. or its subsidiaries.
Trepn™ Profiler Starter Edition User Guide
80-N2762-1 P
May 22, 2015

Qualcomm is a trademark of Qualcomm Incorporated, registered in the United States and other countries. Trepn is a trademark of Qualcomm Incorporated, registered in the United States and other countries. All Qualcomm Incorporated trademarks are used with permission. Other product and brand names may be trademarks or registered trademarks of their respective owners.
This technical data may be subject to U.S. and international export, re-export, or transfer (“export”) laws. Diversion contrary to U.S. and international law is strictly prohibited.
Qualcomm Technologies, Inc. 5775 Morehouse Drive San Diego, CA 92121
U.S.A.
Questions or comments: http://developer.qualcomm.com/Trepn
80-N2762-1 P MAY CONTAIN U.S. AND INTERNATIONAL EXPORT CONTROLLED INFORMATION 3 .
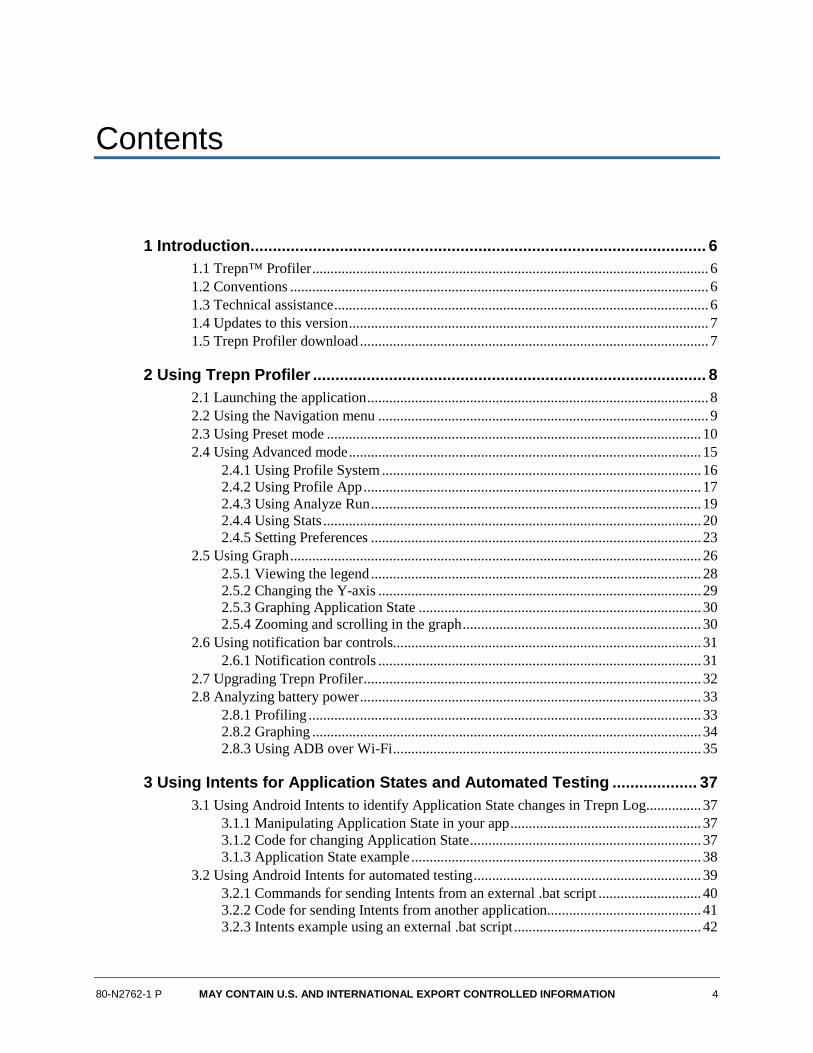
Revision history
Revision Date Description
A Nov 2010 Initial release B Jun 2011 Updated for Ver 1.2 and to incorporate Snapdragon™ MDP MSM8660 devices C Sep 2011 Updated for Ver 2.0; substantial changes to UI made with this revision D Dec 2012 Updated for Ver 3.4 E Jan 2013 Updated for Ver 3.5 F Mar 2013 Updated for Ver 3.6 G Apr 2013 Updated feature set for Ver 3.6 H Jul 2013 Updated for Ver 3.7 J Sep 2013 Updated for Ver 4.0 K Nov 2013 Updated for Ver 4.1; reorganized to conform to QTI standards L Mar 2014 Updated for Ver 4.2 M Apr 2014 Updated for Ver 5.0 N Dec 2014 Updated for Ver 5.1 P May 2015 Updated for Ver 6.0
Note: There is no Rev. I, O, Q, S, X, or Z per Mil. standards.
80-N2762-1 P MAY CONTAIN U.S. AND INTERNATIONAL EXPORT CONTROLLED INFORMATION 4
Contents
1 Introduction ...................................................................................................... 6 1.1 Trepn™ Profiler ............................................................................................................ 6 1.2 Conventions .................................................................................................................. 6 1.3 Technical assistance ...................................................................................................... 6 1.4 Updates to this version .................................................................................................. 7 1.5 Trepn Profiler download ............................................................................................... 7
2 Using Trepn Profiler ........................................................................................ 8 2.1 Launching the application ............................................................................................. 8 2.2 Using the Navigation menu .......................................................................................... 9 2.3 Using Preset mode ...................................................................................................... 10 2.4 Using Advanced mode ................................................................................................ 15
2.4.1 Using Profile System ....................................................................................... 16 2.4.2 Using Profile App ............................................................................................ 17 2.4.3 Using Analyze Run .......................................................................................... 19 2.4.4 Using Stats ....................................................................................................... 20 2.4.5 Setting Preferences .......................................................................................... 23
2.5 Using Graph ................................................................................................................ 26 2.5.1 Viewing the legend .......................................................................................... 28 2.5.2 Changing the Y-axis ........................................................................................ 29 2.5.3 Graphing Application State ............................................................................. 30 2.5.4 Zooming and scrolling in the graph ................................................................. 30
2.6 Using notification bar controls.................................................................................... 31 2.6.1 Notification controls ........................................................................................ 31
2.7 Upgrading Trepn Profiler ............................................................................................ 32 2.8 Analyzing battery power ............................................................................................. 33
2.8.1 Profiling ........................................................................................................... 33 2.8.2 Graphing .......................................................................................................... 34 2.8.3 Using ADB over Wi-Fi .................................................................................... 35
3 Using Intents for Application States and Automated Testing ................... 37 3.1 Using Android Intents to identify Application State changes in Trepn Log ............... 37
3.1.1 Manipulating Application State in your app .................................................... 37 3.1.2 Code for changing Application State ............................................................... 37 3.1.3 Application State example ............................................................................... 38
3.2 Using Android Intents for automated testing .............................................................. 39 3.2.1 Commands for sending Intents from an external .bat script ............................ 40 3.2.2 Code for sending Intents from another application.......................................... 41 3.2.3 Intents example using an external .bat script ................................................... 42
Trepn™ Profiler Starter Edition User Guide Contents
80-N2762-1 P MAY CONTAIN U.S. AND INTERNATIONAL EXPORT CONTROLLED INFORMATION 5 .
A Tips for Using Trepn Profiler Efficiently ..................................................... 44 A.1 Managing Trepn Profiler impact ................................................................................ 44
B Data Points .................................................................................................... 46 B.1 Normalized CPU loads ............................................................................................... 46 B.2 Power statistics ........................................................................................................... 46 B.3 CPU statistics ............................................................................................................. 47 B.4 Network statistics ....................................................................................................... 47 B.5 Other statistics ............................................................................................................ 48
C References ..................................................................................................... 49 C.1 Related documents ..................................................................................................... 49
80-N2762-1 P MAY CONTAIN U.S. AND INTERNATIONAL EXPORT CONTROLLED INFORMATION 6
1 Introduction
1.1 Trepn™ Profiler The Trepn Profiler is a diagnostic tool designed to measure and profile the power consumption of Android applications on mobile devices. The Trepn Profiler lets you track power, CPU, memory, and network usage to better understand and optimize application power performance. When used with Mobile Development Platform (MDP) devices based on the Qualcomm® Snapdragon™ Processor by Qualcomm Technologies, Inc., the Trepn Profiler is capable of displaying power consumption of individual hardware components.
Features include the ability to log stats and visualize information in real-time graphs. In addition, overlays allow you to analyze power values dynamically while using the app being profiled. Data can also be exported for offline analysis.
The Trepn Profiler is available in the following variants:
Starter Edition – Runs on most devices with Android 4.0 and higher.
Premier Edition – Runs on Snapdragon MDP devices only and includes special power monitoring capabilities for measuring the power deltas of individual hardware rails.
For more information on the Snapdragon MDP, see Qualcomm Developer Network – Development Devices & Boards (http://developer.qualcomm.com/dev/ development-devices/snapdragon-mdp).
1.2 Conventions Softkeys and touchscreen buttons appear in bold font.
This guide assumes that you are familiar with basic touchscreen usage, such as scrolling, tapping/double-tapping, and entering text on a touchscreen keyboard.
Shading indicates content that has been added or changed in this revision of the document.
1.3 Technical assistance NOTE: This section was added to this document revision.
Online support is provided for this product. For questions, check our FAQ first. If you don’t find an answer, try the Trepn Profiler product forum at developer.qualcomm.com. You can also provide feedback from within the Trepn Profiler application using the Feedback button in the navigation menu.
Trepn™ Profiler Starter Edition User Guide Introduction
80-N2762-1 P MAY CONTAIN U.S. AND INTERNATIONAL EXPORT CONTROLLED INFORMATION 7 .
1.4 Updates to this version Six new easy-to-use profiling presets
Colorful material design user interface
New Mobile Data Detective preset
New CPU Usage Monitor preset
Easy way get back to Trepn when overlays are active
Customization of presets in Advanced Mode
Slide out menu with easy access to Help, Advanced Mode and more
New Tutorial screens and improved Help
Other bug fixes, optimizations, and usability improvements
1.5 Trepn Profiler download To download the latest version, visit http://developer.qualcomm.com/Trepn.
80-N2762-1 P MAY CONTAIN U.S. AND INTERNATIONAL EXPORT CONTROLLED INFORMATION 8
2 Using Trepn Profiler
NOTE: Numerous changes were made in this chapter.
This chapter explains how to use the Trepn Profiler to profile and analyze Android devices and applications, and describes the various profiling features.
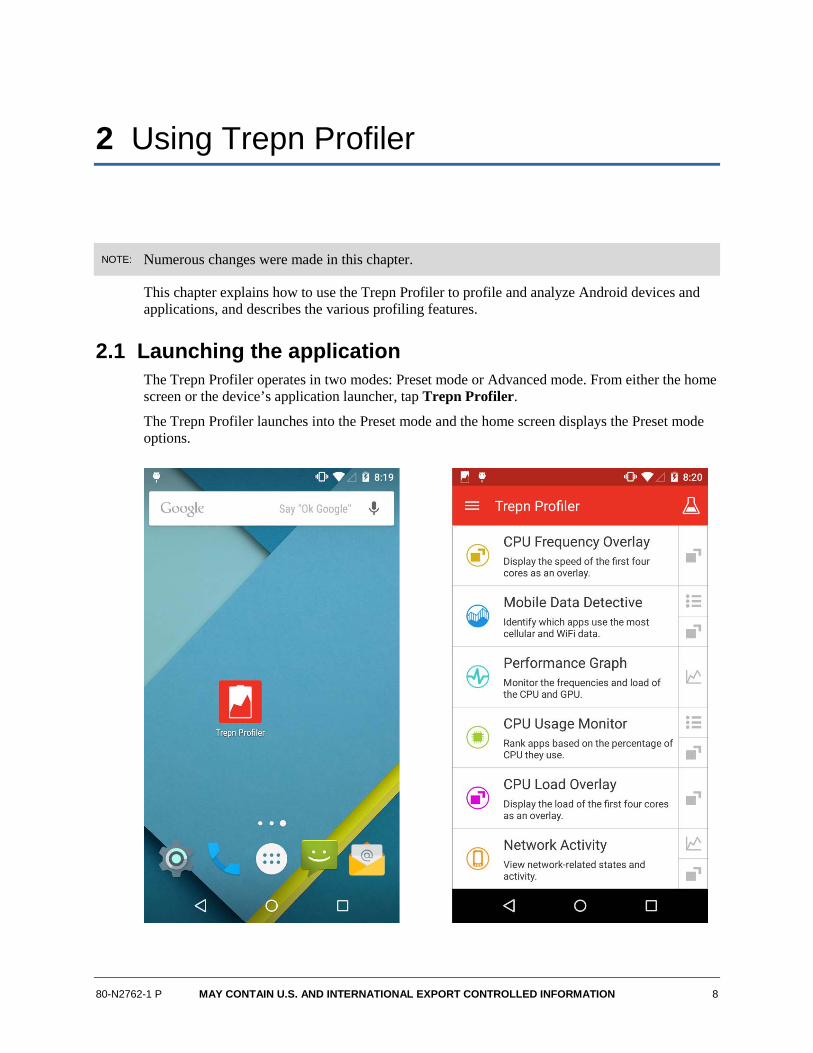
2.1 Launching the application
The Trepn Profiler operates in two modes: Preset mode or Advanced mode. From either the home screen or the device’s application launcher, tap Trepn Profiler.
The Trepn Profiler launches into the Preset mode and the home screen displays the Preset mode options.
Trepn™ Profiler Starter Edition User Guide Using Trepn Profiler
80-N2762-1 P MAY CONTAIN U.S. AND INTERNATIONAL EXPORT CONTROLLED INFORMATION 9 .
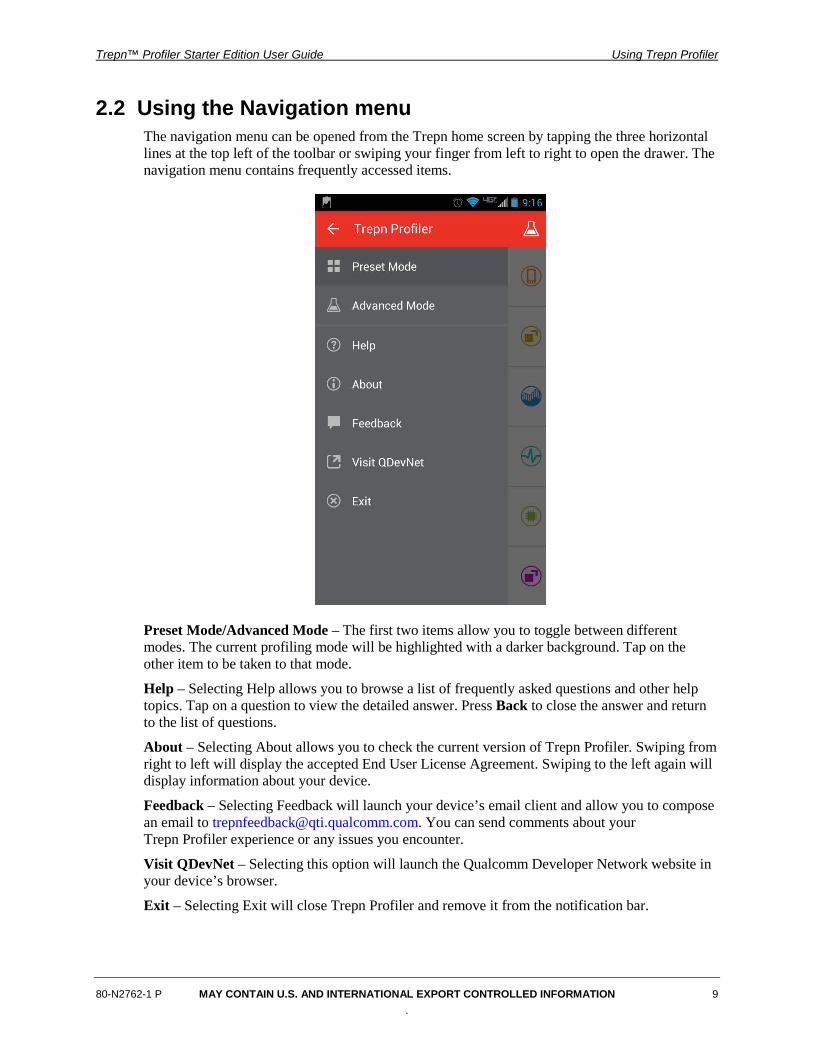
2.2 Using the Navigation menu The navigation menu can be opened from the Trepn home screen by tapping the three horizontal lines at the top left of the toolbar or swiping your finger from left to right to open the drawer. The navigation menu contains frequently accessed items.
Preset Mode/Advanced Mode – The first two items allow you to toggle between different modes. The current profiling mode will be highlighted with a darker background. Tap on the other item to be taken to that mode.
Help – Selecting Help allows you to browse a list of frequently asked questions and other help topics. Tap on a question to view the detailed answer. Press Back to close the answer and return to the list of questions.
About – Selecting About allows you to check the current version of Trepn Profiler. Swiping from right to left will display the accepted End User License Agreement. Swiping to the left again will display information about your device.
Feedback – Selecting Feedback will launch your device’s email client and allow you to compose an email to [email protected]. You can send comments about your Trepn Profiler experience or any issues you encounter.
Visit QDevNet – Selecting this option will launch the Qualcomm Developer Network website in your device’s browser.
Exit – Selecting Exit will close Trepn Profiler and remove it from the notification bar.
Trepn™ Profiler Starter Edition User Guide Using Trepn Profiler
80-N2762-1 P MAY CONTAIN U.S. AND INTERNATIONAL EXPORT CONTROLLED INFORMATION 10 .
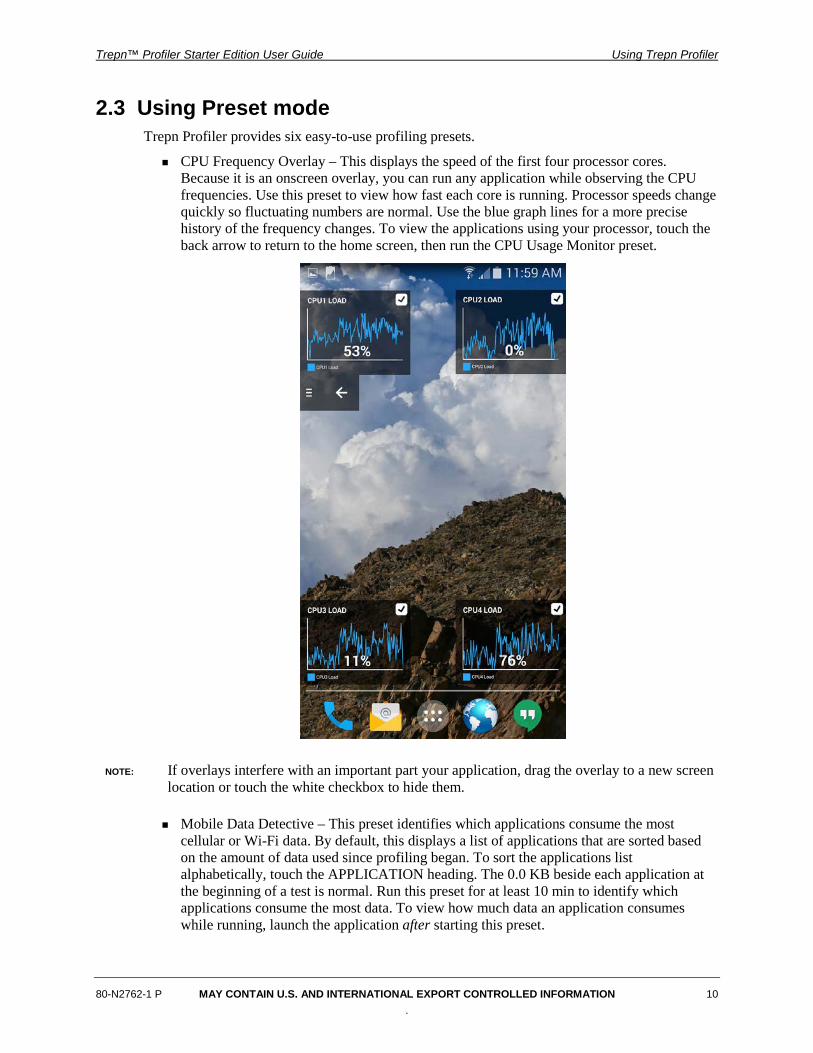
2.3 Using Preset mode Trepn Profiler provides six easy-to-use profiling presets.
CPU Frequency Overlay – This displays the speed of the first four processor cores. Because it is an onscreen overlay, you can run any application while observing the CPU frequencies. Use this preset to view how fast each core is running. Processor speeds change quickly so fluctuating numbers are normal. Use the blue graph lines for a more precise history of the frequency changes. To view the applications using your processor, touch the back arrow to return to the home screen, then run the CPU Usage Monitor preset.
NOTE: If overlays interfere with an important part your application, drag the overlay to a new screen location or touch the white checkbox to hide them.
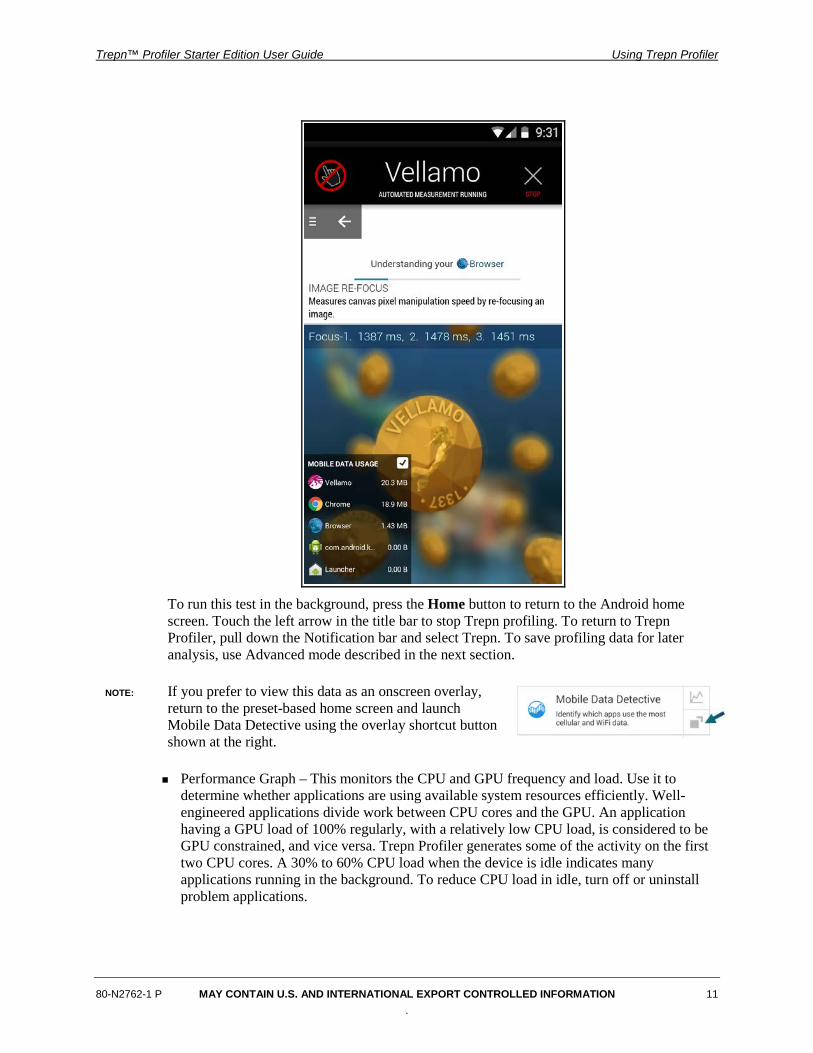
Mobile Data Detective – This preset identifies which applications consume the most cellular or Wi-Fi data. By default, this displays a list of applications that are sorted based on the amount of data used since profiling began. To sort the applications list alphabetically, touch the APPLICATION heading. The 0.0 KB beside each application at the beginning of a test is normal. Run this preset for at least 10 min to identify which applications consume the most data. To view how much data an application consumes while running, launch the application after starting this preset.
Trepn™ Profiler Starter Edition User Guide Using Trepn Profiler
80-N2762-1 P MAY CONTAIN U.S. AND INTERNATIONAL EXPORT CONTROLLED INFORMATION 11 .
To run this test in the background, press the Home button to return to the Android home screen. Touch the left arrow in the title bar to stop Trepn profiling. To return to Trepn Profiler, pull down the Notification bar and select Trepn. To save profiling data for later analysis, use Advanced mode described in the next section.
NOTE: If you prefer to view this data as an onscreen overlay, return to the preset-based home screen and launch Mobile Data Detective using the overlay shortcut button shown at the right.
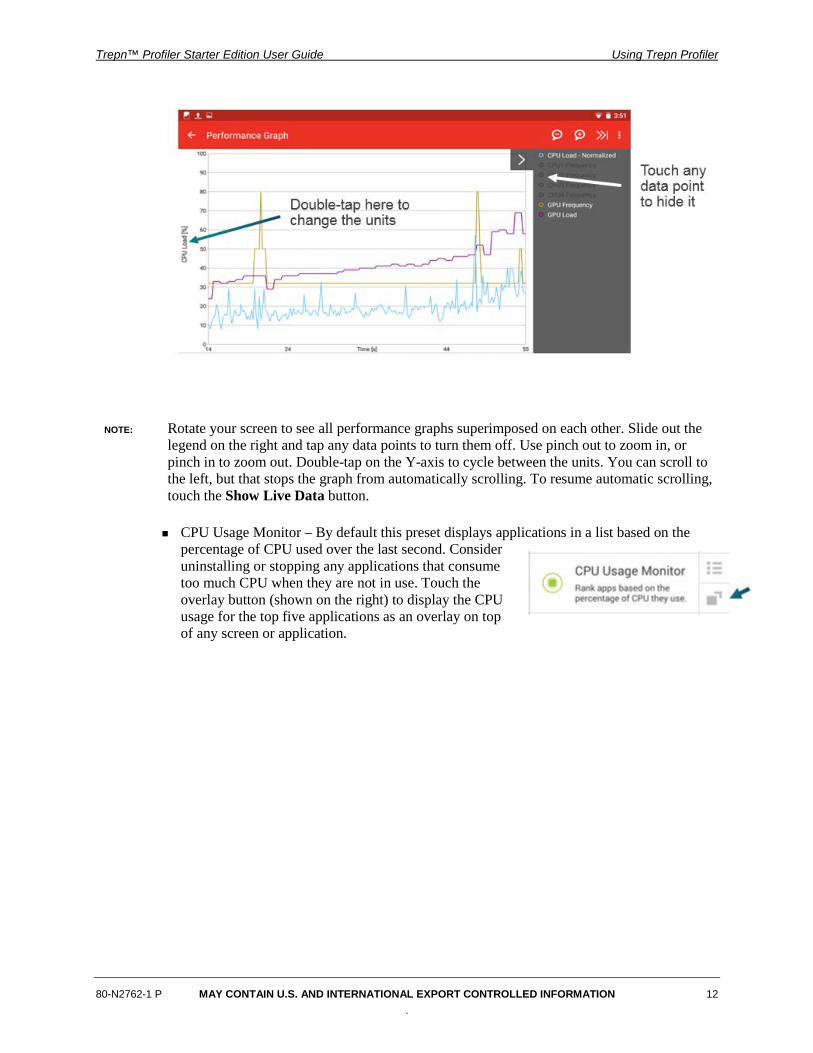
Performance Graph – This monitors the CPU and GPU frequency and load. Use it to determine whether applications are using available system resources efficiently. Well-engineered applications divide work between CPU cores and the GPU. An application having a GPU load of 100% regularly, with a relatively low CPU load, is considered to be GPU constrained, and vice versa. Trepn Profiler generates some of the activity on the first two CPU cores. A 30% to 60% CPU load when the device is idle indicates many applications running in the background. To reduce CPU load in idle, turn off or uninstall problem applications.
Trepn™ Profiler Starter Edition User Guide Using Trepn Profiler
80-N2762-1 P MAY CONTAIN U.S. AND INTERNATIONAL EXPORT CONTROLLED INFORMATION 12 .
NOTE: Rotate your screen to see all performance graphs superimposed on each other. Slide out the legend on the right and tap any data points to turn them off. Use pinch out to zoom in, or pinch in to zoom out. Double-tap on the Y-axis to cycle between the units. You can scroll to the left, but that stops the graph from automatically scrolling. To resume automatic scrolling, touch the Show Live Data button.
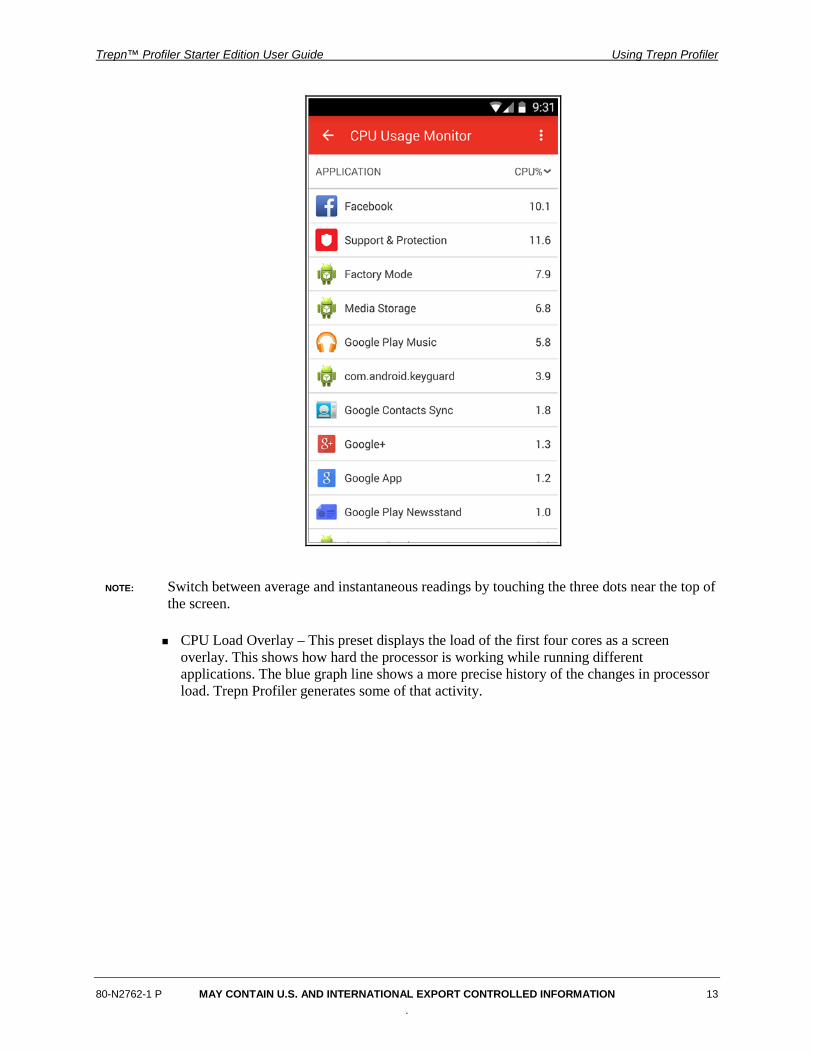
CPU Usage Monitor – By default this preset displays applications in a list based on the percentage of CPU used over the last second. Consider uninstalling or stopping any applications that consume too much CPU when they are not in use. Touch the overlay button (shown on the right) to display the CPU usage for the top five applications as an overlay on top of any screen or application.
Trepn™ Profiler Starter Edition User Guide Using Trepn Profiler
80-N2762-1 P MAY CONTAIN U.S. AND INTERNATIONAL EXPORT CONTROLLED INFORMATION 13 .
NOTE: Switch between average and instantaneous readings by touching the three dots near the top of the screen.
CPU Load Overlay – This preset displays the load of the first four cores as a screen overlay. This shows how hard the processor is working while running different applications. The blue graph line shows a more precise history of the changes in processor load. Trepn Profiler generates some of that activity.
Trepn™ Profiler Starter Edition User Guide Using Trepn Profiler
80-N2762-1 P MAY CONTAIN U.S. AND INTERNATIONAL EXPORT CONTROLLED INFORMATION 14 .
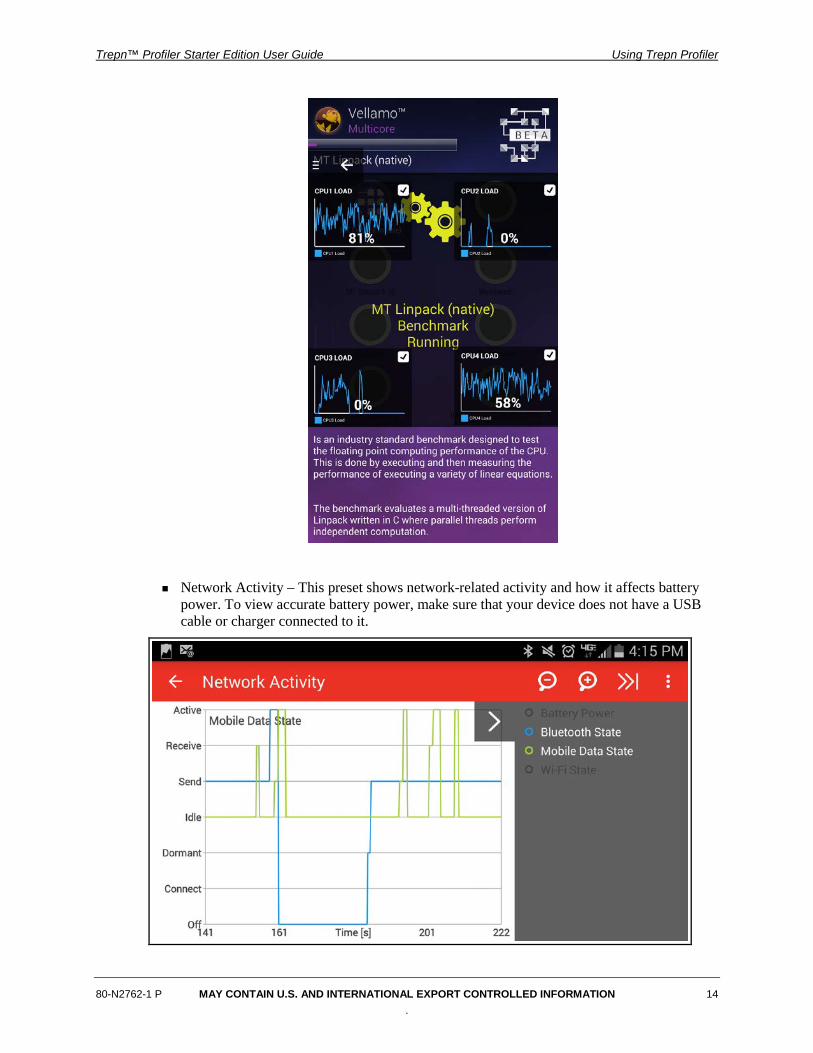
Network Activity – This preset shows network-related activity and how it affects battery power. To view accurate battery power, make sure that your device does not have a USB cable or charger connected to it.
Trepn™ Profiler Starter Edition User Guide Using Trepn Profiler
80-N2762-1 P MAY CONTAIN U.S. AND INTERNATIONAL EXPORT CONTROLLED INFORMATION 15 .
NOTE: Not all devices report accurate battery power readings. Refer to the Trepn Profiler FAQ for more information. The default view is a graph, but the data can also be viewed as an overlay. The mobile data overlay displays whether the cellular radio is active or idle.
The Network Activity graph view shows the following Mobile Data states:
Disconnected
Connecting
Connected but dormant
Connected but no traffic
Sending data
Receiving data
Sending and receiving data
NOTE: The cellular radio may not be active when Wi-Fi is turned on.
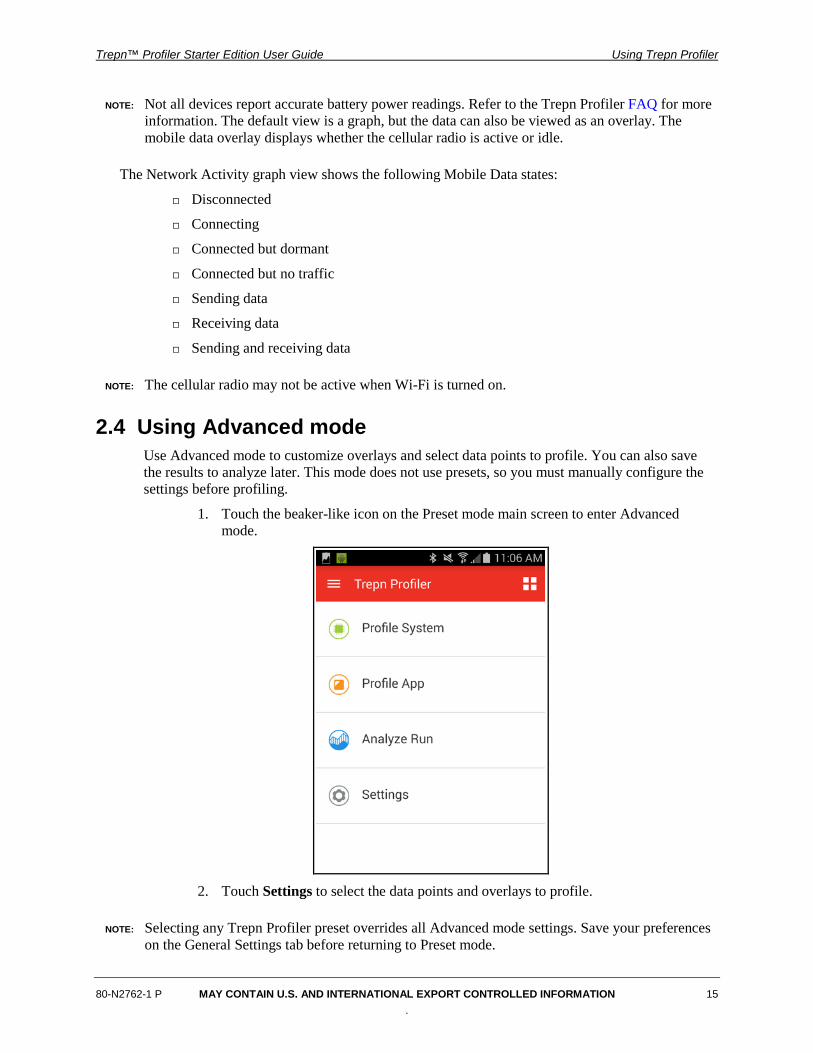
2.4 Using Advanced mode Use Advanced mode to customize overlays and select data points to profile. You can also save the results to analyze later. This mode does not use presets, so you must manually configure the settings before profiling.
1. Touch the beaker-like icon on the Preset mode main screen to enter Advanced mode.
2. Touch Settings to select the data points and overlays to profile.
NOTE: Selecting any Trepn Profiler preset overrides all Advanced mode settings. Save your preferences on the General Settings tab before returning to Preset mode.
Trepn™ Profiler Starter Edition User Guide Using Trepn Profiler
80-N2762-1 P MAY CONTAIN U.S. AND INTERNATIONAL EXPORT CONTROLLED INFORMATION 16 .
3. See Setting Preferences for more details on settings.
4. Touch the Back button to return to the Advanced mode home screen.
5. To begin profiling, touch Profile System or Profile App.
6. Select to view the data as an overlay, a graph, or text (Stats view).
7. When finished profiling, touch the Back button or return to Trepn Profiler from the Notification bar.
8. Touch Stop Profiling and select a save option. Use “Save as .db” if you want to analyze the session later.
9. To analyze a saved profile session, touch Analyze Run and select the file from the list.
Trepn Profiler remembers the last-used mode and automatically returns to it each time Trepn is launched. To return to Preset mode, use the navigation menu, or touch the icon that looks like four boxes.
The following subsections describe how to use the Advanced mode Trepn Profiler features.
2.4.1 Using Profile System To profile the Android device system:
1. Tap Profile System on the home screen. The Trepn Profiler starts logging data about the device.
Note: If connected to a power supply and battery power, Wakelocks, or Wifilocks data points are selected, a warning dialog appears. It is recommended that you do not plug in a power source while profiling these data points.
2. Tap Home on the device to return to the Android home screen.
3. Use the device normally.
Return to the Trepn Profiler to view logged data by opening the Trepn Profiler, where the following options are available:
Overlays – Allows you to return to the app/home screen and monitor the Trepn data while using the device
Graph – Opens the Graph
Stats – Opens the Stats
Stop Profiling – Opens a Save Session dialog and ends the session
NOTE: An easy way to return to the Trepn Profiler while profiling is to open the Android notification bar and tap the Trepn Profiler icon.
For each start and stop profiling event, the Trepn Profiler prints logs to logcat to correlate the start and stop times with any other logcat output.
When the Trepn Profiler starts profiling, the following message is output to logcat with the tag “Trepn”:
Trepn has Started Profiling.
Trepn™ Profiler Starter Edition User Guide Using Trepn Profiler
80-N2762-1 P MAY CONTAIN U.S. AND INTERNATIONAL EXPORT CONTROLLED INFORMATION 17 .
When Trepn stops profiling, the following message appears:
Trepn has Stopped Profiling.
2.4.2 Using Profile App
NOTE: See Setting Preferences before beginning a profile.
To profile an Android application:
1. Tap Profile App on the Trepn Profiler home screen.
2. In the select an application to profile dialog, scroll to the desired application and tap it. The Trepn Profiler may collect baseline data for a period specified by the Baseline Interval in General Preferences and then launch the application. Once the application launches, the Trepn Profiler begins capturing data.
Note: If connected to a power supply and battery power, Wakelocks, or Wifilocks data points are selected, a warning dialog appears. It is recommended that you do not plug in a power source while profiling these data points.
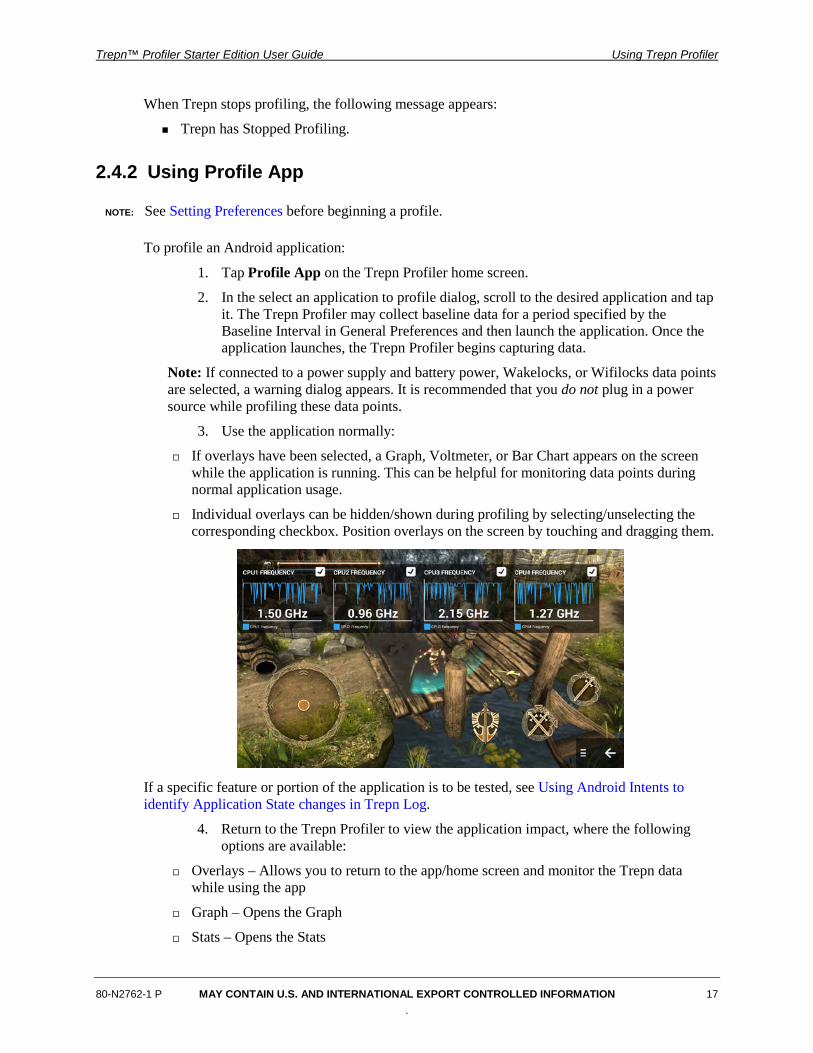
3. Use the application normally:
If overlays have been selected, a Graph, Voltmeter, or Bar Chart appears on the screen while the application is running. This can be helpful for monitoring data points during normal application usage.
Individual overlays can be hidden/shown during profiling by selecting/unselecting the corresponding checkbox. Position overlays on the screen by touching and dragging them.
If a specific feature or portion of the application is to be tested, see Using Android Intents to identify Application State changes in Trepn Log.
4. Return to the Trepn Profiler to view the application impact, where the following options are available:
Overlays – Allows you to return to the app/home screen and monitor the Trepn data while using the app
Graph – Opens the Graph
Stats – Opens the Stats
Trepn™ Profiler Starter Edition User Guide Using Trepn Profiler
80-N2762-1 P MAY CONTAIN U.S. AND INTERNATIONAL EXPORT CONTROLLED INFORMATION 18 .
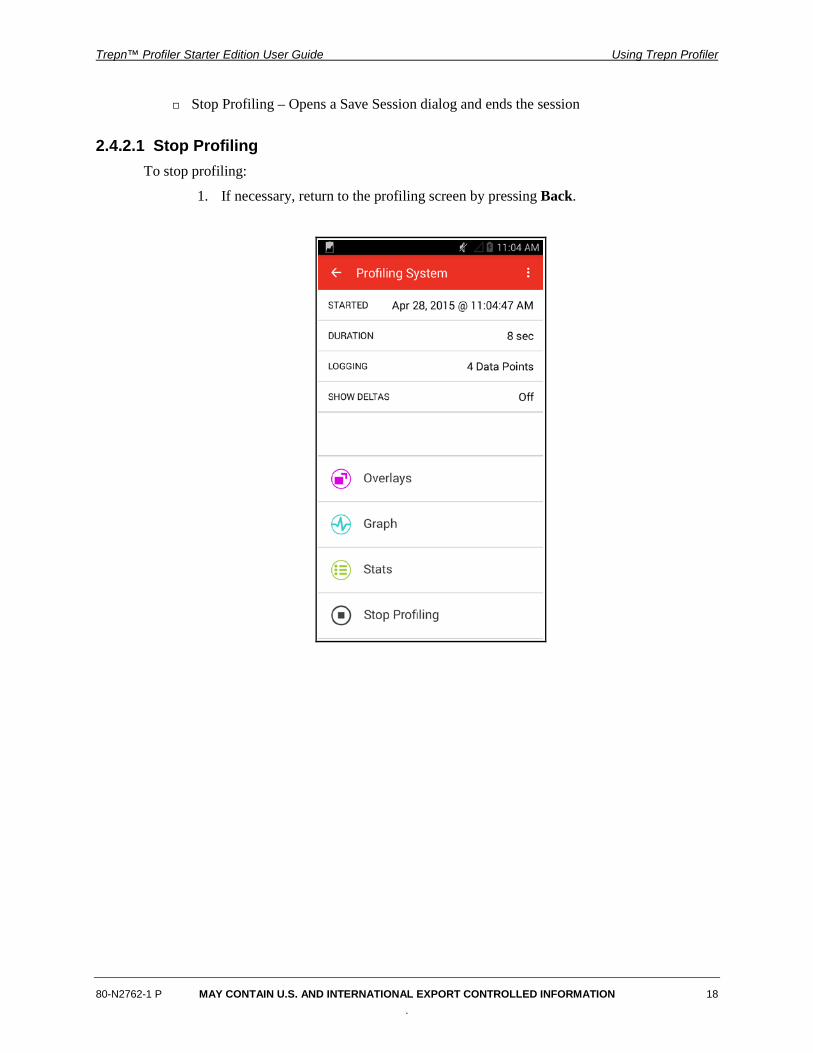
Stop Profiling – Opens a Save Session dialog and ends the session
2.4.2.1 Stop Profiling To stop profiling:
1. If necessary, return to the profiling screen by pressing Back.
Trepn™ Profiler Starter Edition User Guide Using Trepn Profiler
80-N2762-1 P MAY CONTAIN U.S. AND INTERNATIONAL EXPORT CONTROLLED INFORMATION 19 .
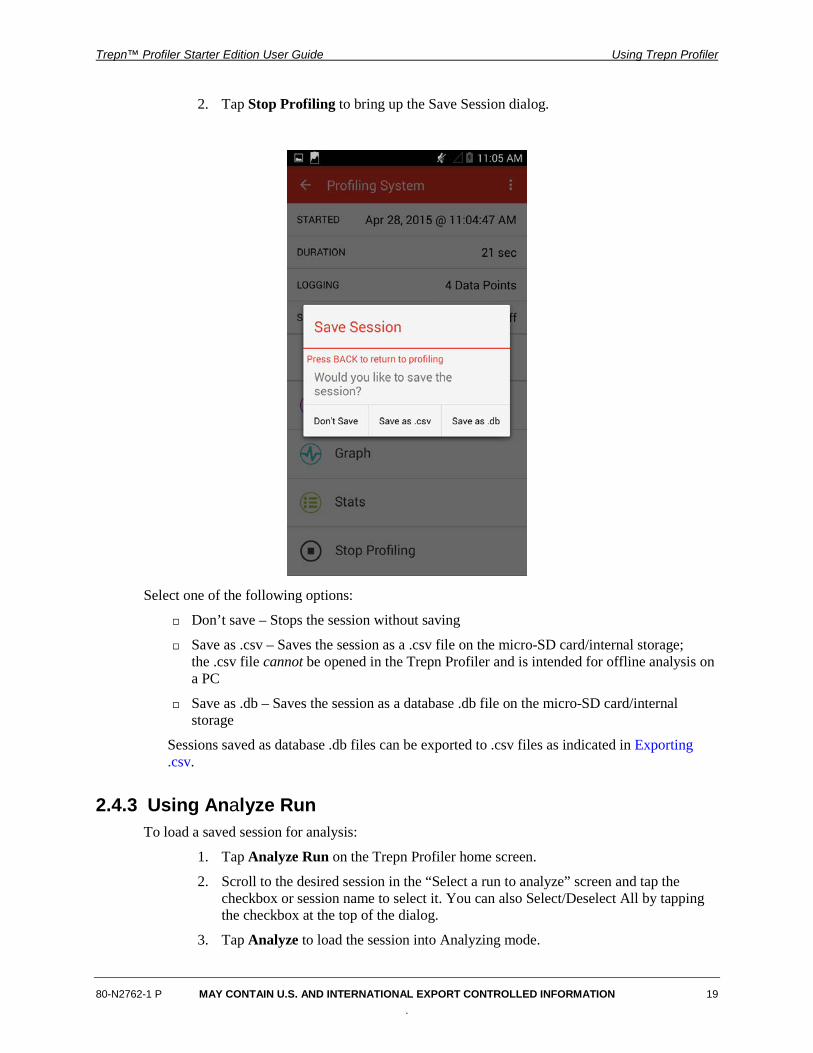
2. Tap Stop Profiling to bring up the Save Session dialog.
Select one of the following options:
Don’t save – Stops the session without saving
Save as .csv – Saves the session as a .csv file on the micro-SD card/internal storage; the .csv file cannot be opened in the Trepn Profiler and is intended for offline analysis on a PC
Save as .db – Saves the session as a database .db file on the micro-SD card/internal storage
Sessions saved as database .db files can be exported to .csv files as indicated in Exporting .csv.
2.4.3 Using Analyze Run To load a saved session for analysis:
1. Tap Analyze Run on the Trepn Profiler home screen.
2. Scroll to the desired session in the “Select a run to analyze” screen and tap the checkbox or session name to select it. You can also Select/Deselect All by tapping the checkbox at the top of the dialog.
3. Tap Analyze to load the session into Analyzing mode.
Trepn™ Profiler Starter Edition User Guide Using Trepn Profiler
80-N2762-1 P MAY CONTAIN U.S. AND INTERNATIONAL EXPORT CONTROLLED INFORMATION 20 .
2.4.3.1 Deleting Profiles To delete unwanted profiles:
1. Tap Analyze Run from the Trepn Profiler main menu screen.
2. In the Select run to analyze dialog, scroll to the desired session(s) and tap the checkboxes/names of the sessions to select them.
3. Tap Delete.
4. In the confirmation dialog, select OK to proceed with the deletion. There is no undo.
In addition, you can delete a profile you are viewing (in Analyzing mode) by tapping the Action Overflow icon at the top right of the action bar then tapping Delete Run. Finally, tap Yes to confirm.
2.4.3.2 Exporting .csv Trepn Profiler provides the option to export saved data as a .csv file directly from the UI in Analyzing mode.
To export a run to a .csv file:
1. From the Trepn Profiler main menu, tap Analyze Run.
2. In the Select run to analyze dialog, scroll to the name of the desired session, select it, and press Analyze to open the session. The session is loaded in the Trepn Profiler in Analyzing mode.
3. Tap the Action Overflow icon in the upper-right corner of the action bar.
4. Tap Export to .csv, choose the default name or tap the name field and enter a filename using the touchscreen keyboard.
5. Tap Export to save the run as a .csv file in the /sdcard/trepn/ directory on the micro-SD card/internal storage.
NOTE: It is not necessary to enter the .csv file extension when choosing the filename.
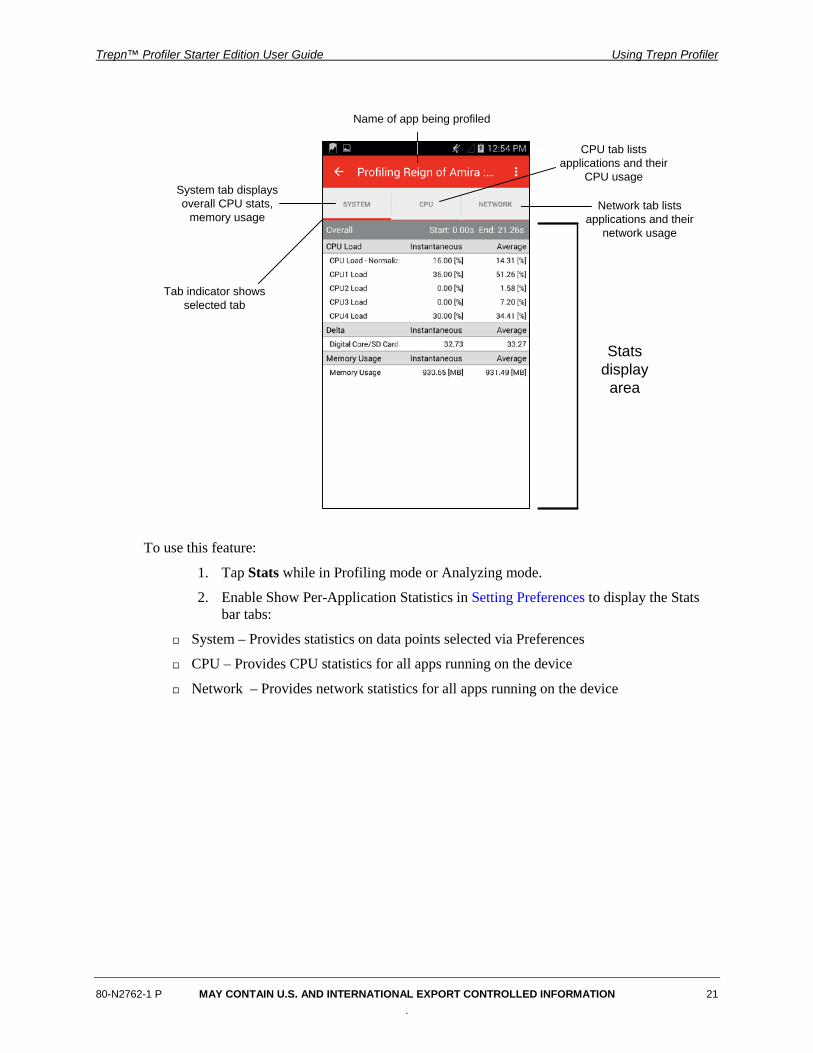
2.4.4 Using Stats The Trepn Profiler Stats displays computed values for power and CPU usage data points included in the session. A functional representation of Stats is shown below.
Trepn™ Profiler Starter Edition User Guide Using Trepn Profiler
80-N2762-1 P MAY CONTAIN U.S. AND INTERNATIONAL EXPORT CONTROLLED INFORMATION 21 .
Stats display area
System tab displays overall CPU stats,
memory usage
Name of app being profiled
Tab indicator shows selected tab
CPU tab lists applications and their
CPU usage
Network tab lists applications and their
network usage
To use this feature:
1. Tap Stats while in Profiling mode or Analyzing mode.
2. Enable Show Per-Application Statistics in Setting Preferences to display the Stats bar tabs:
System – Provides statistics on data points selected via Preferences
CPU – Provides CPU statistics for all apps running on the device
Network – Provides network statistics for all apps running on the device
Trepn™ Profiler Starter Edition User Guide Using Trepn Profiler
80-N2762-1 P MAY CONTAIN U.S. AND INTERNATIONAL EXPORT CONTROLLED INFORMATION 22 .
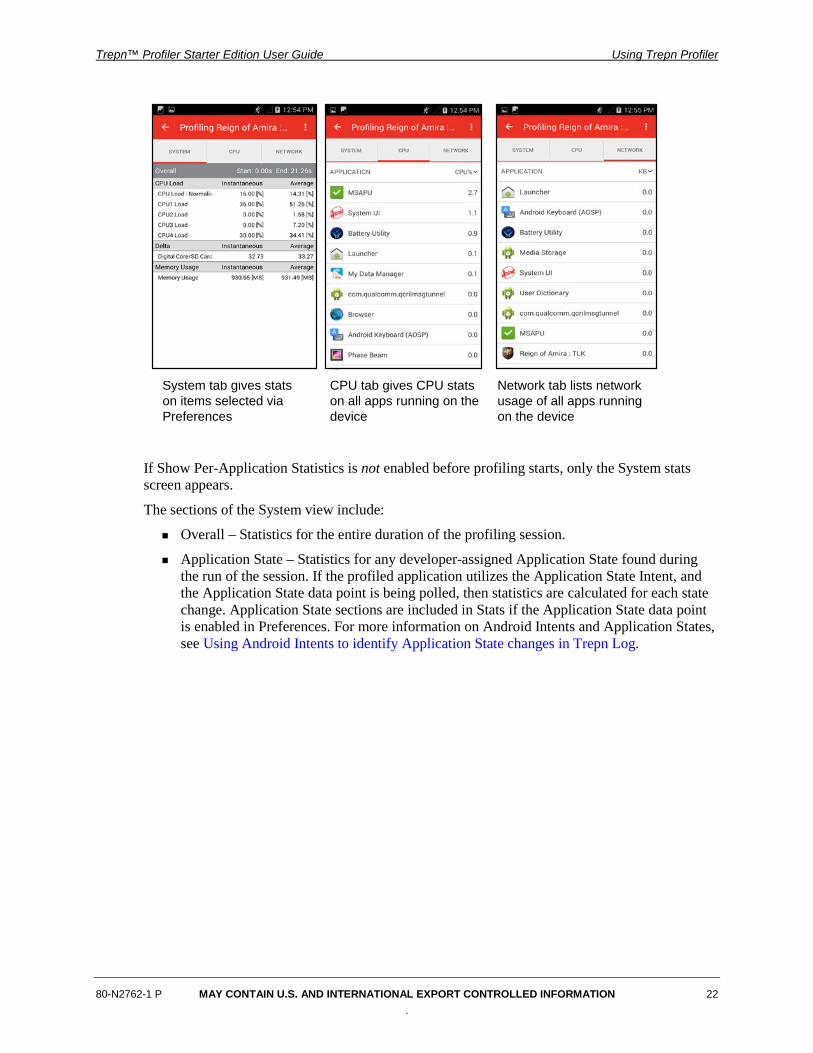
System tab gives stats on items selected via Preferences
Network tab lists network usage of all apps running on the device
CPU tab gives CPU stats on all apps running on the device
If Show Per-Application Statistics is not enabled before profiling starts, only the System stats screen appears.
The sections of the System view include:
Overall – Statistics for the entire duration of the profiling session.
Application State – Statistics for any developer-assigned Application State found during the run of the session. If the profiled application utilizes the Application State Intent, and the Application State data point is being polled, then statistics are calculated for each state change. Application State sections are included in Stats if the Application State data point is enabled in Preferences. For more information on Android Intents and Application States, see Using Android Intents to identify Application State changes in Trepn Log.
Trepn™ Profiler Starter Edition User Guide Using Trepn Profiler
80-N2762-1 P MAY CONTAIN U.S. AND INTERNATIONAL EXPORT CONTROLLED INFORMATION 23 .
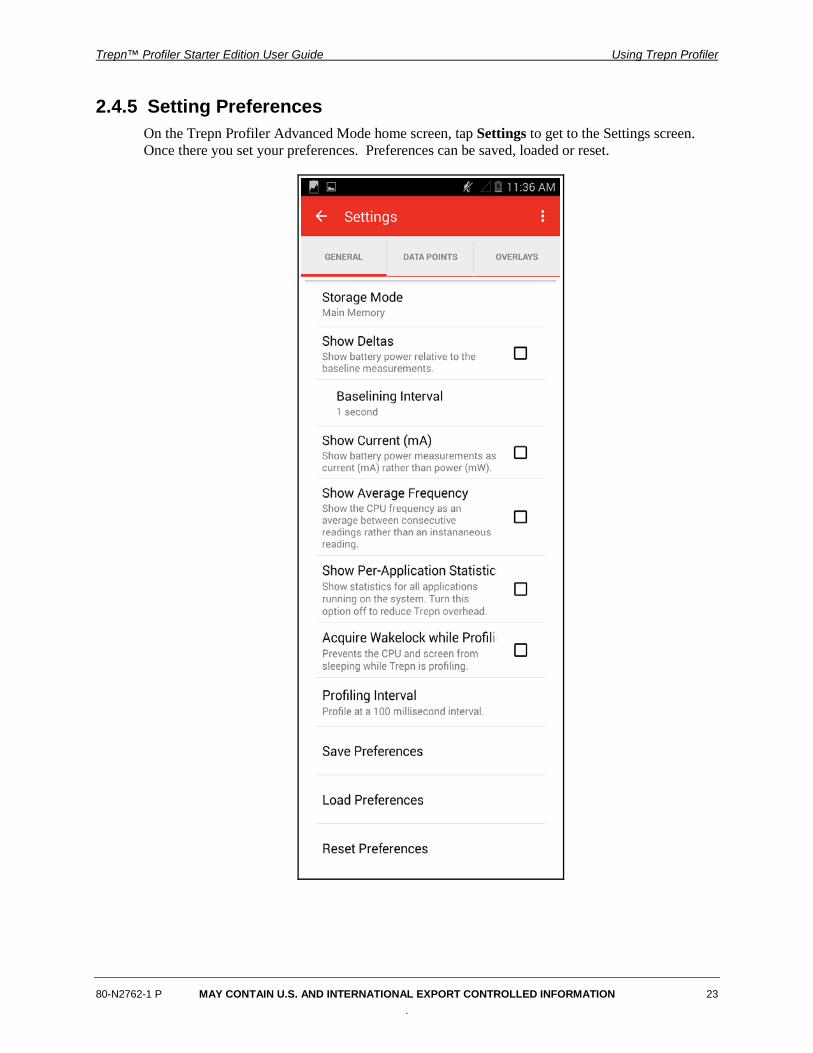
2.4.5 Setting Preferences On the Trepn Profiler Advanced Mode home screen, tap Settings to get to the Settings screen. Once there you set your preferences. Preferences can be saved, loaded or reset.
Trepn™ Profiler Starter Edition User Guide Using Trepn Profiler
80-N2762-1 P MAY CONTAIN U.S. AND INTERNATIONAL EXPORT CONTROLLED INFORMATION 24 .
The Trepn Profiler Settings screen has the following tabs:
General – Settings to set Storage mode, enable per-application statistics, and other options. Preferences are saved, loaded, and reset from this tab.
Data Points – Settings to select data points for profiling. See Appendix B for complete details.
Overlays – Settings to add small graphs to the touchscreen, allows you see broad readings of data points as you use the application.
2.4.5.1 General The General tab includes the following settings:
Storage Mode – Sets where Trepn Profiler saves data during profiling.
Database – Sessions are stored as database .db files on the micro-SD card/internal memory in the /sdcard/trepn/ directory. If no storage is available, Trepn still profiles, but no data is saved.
Main Memory – Sessions are stored in RAM. There is less system overhead using this option, but not all data is guaranteed to be saved. For a typical session, approximately the last hour of data is saved, but this can vary depending on the amount of data profiled in the session. Sessions can be saved when profiling is stopped as either a database .db file or a .csv file on the micro-SD card/internal memory. A micro-SD card/available space on internal storage does not have to be present in the device to profile using this option but needs to be present to save the data.
None – Data is not saved. This option significantly reduces Trepn overhead during profiling.
Show Deltas – Works in conjunction with the Baselining Interval to estimate the power usage of a profiled application by taking the Trepn Profiler/Android OS overhead into account.
Turning Show Deltas off shows the battery power as actual battery power usage.
Turning Show Deltas on shows battery power as estimated power usage of the profiled application (by removing an estimate of the power drain of the Android OS and the Trepn Profiler).
Baselining Interval – Changes the Baselining Interval. Expressed in seconds, the Baselining Interval is the amount of time Trepn Profiler collects baseline data before the start of profiling. The baseline timer only runs if Show Deltas is enabled and a power statistic is selected in the Data Points preferences. This improves how accurately Trepn can estimate the actual power usage, if available, of a profiled application. A larger baselining interval provides a more accurate estimate. This option is disabled if Show Deltas is not turned on.
2.4.5.2 Data points Data points are selected by tapping the checkbox beside each data point. See Appendix B for a complete list of data points that can be monitored.
Trepn™ Profiler Starter Edition User Guide Using Trepn Profiler
80-N2762-1 P MAY CONTAIN U.S. AND INTERNATIONAL EXPORT CONTROLLED INFORMATION 25 .
2.4.5.3 Overlays Overlays add small graphs to the touchscreen, letting you see broad readings of data points as you use the app. Overlays can be helpful in looking for power spikes and application state changes during normal usage of the application.
There are four default graph overlays, CPU1 Frequency, CPU2 Frequency, CPU3 Frequency, and CPU4 Frequency. These default overlays can be modified as desired or removed entirely. Reset Preferences returns them to their original settings.
To add a new overlay or edit an existing one:
1. Tap Settings→Overlays
2. Tap one of the overlays on the screen to bring up the overlay chooser dialog for that overlay.
3. Select the desired settings for that overlay:
Type:
– None – Do not show an overlay in this position.
– Graph – Allows up to two data points to be displayed as line graphs.
– Voltmeter – Allows only one data point to be displayed on a meter.
– Bar chart – Allows up to two data points to be displayed on a bar chart.
– CPU Usage – Displays the top five applications, sorted by CPU usage.
– Mobile Data Usage – Displays the top five applications, sorted by network usage.
Title –Trepn automatically prefills the overlay title when the first data point is selected. However, it may be necessary to clear the current name and reselect. Alternatively, enter your own name for the overlay.
Transparency – Sets the overlay transparency level. Move the slider to the right to make an overlay more opaque or to the left to make it more transparent. Note that the last set transparency level applies to all overlays.
Show Value on Graph – For graph overlays only, enabling this setting adds the instantaneous value of the data point onto the overlay when Trepn is profiling. The text color can be changed by tapping the colored square to the right of the checkbox. If more than one data point is selected for the overlay, the value is not displayed.
Data Points – Select the data point(s) to display in the overlay.
Colors – For graph and bar chart overlays, a colored box appears to the right of the data point when selecting. Tap this box to select the color for the line or bar chart of that data point. There are several default colors to choose from, or use a custom color by entering the color in hexadecimal format.
4. Tap OK to return to the screen showing all the overlays. The preview of the overlay changes to match the selected settings.
Overlay settings can be modified when Trepn is profiling. While Trepn is profiling and an overlay is visible, double-tap the overlay. A preferences dialog displays to allow changes to each of the items described in Step 3 above. The choice of data points is limited to the data points enabled before profiling began.
Trepn™ Profiler Starter Edition User Guide Using Trepn Profiler
80-N2762-1 P MAY CONTAIN U.S. AND INTERNATIONAL EXPORT CONTROLLED INFORMATION 26 .
The overlays can also be repositioned on the screen while Trepn is profiling by touching the overlay and dragging it to the desired location.
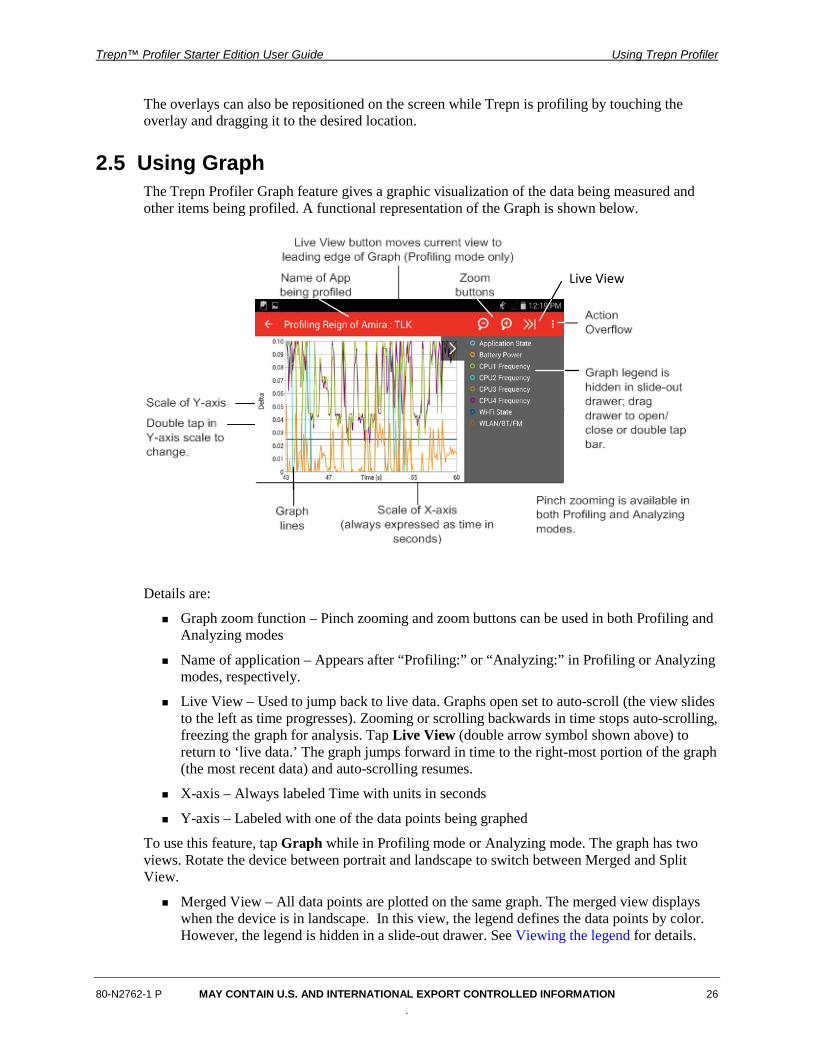
2.5 Using Graph The Trepn Profiler Graph feature gives a graphic visualization of the data being measured and other items being profiled. A functional representation of the Graph is shown below.
Live View
Details are:
Graph zoom function – Pinch zooming and zoom buttons can be used in both Profiling and Analyzing modes
Name of application – Appears after “Profiling:” or “Analyzing:” in Profiling or Analyzing modes, respectively.
Live View – Used to jump back to live data. Graphs open set to auto-scroll (the view slides to the left as time progresses). Zooming or scrolling backwards in time stops auto-scrolling, freezing the graph for analysis. Tap Live View (double arrow symbol shown above) to return to ‘live data.’ The graph jumps forward in time to the right-most portion of the graph (the most recent data) and auto-scrolling resumes.
X-axis – Always labeled Time with units in seconds
Y-axis – Labeled with one of the data points being graphed
To use this feature, tap Graph while in Profiling mode or Analyzing mode. The graph has two views. Rotate the device between portrait and landscape to switch between Merged and Split View.
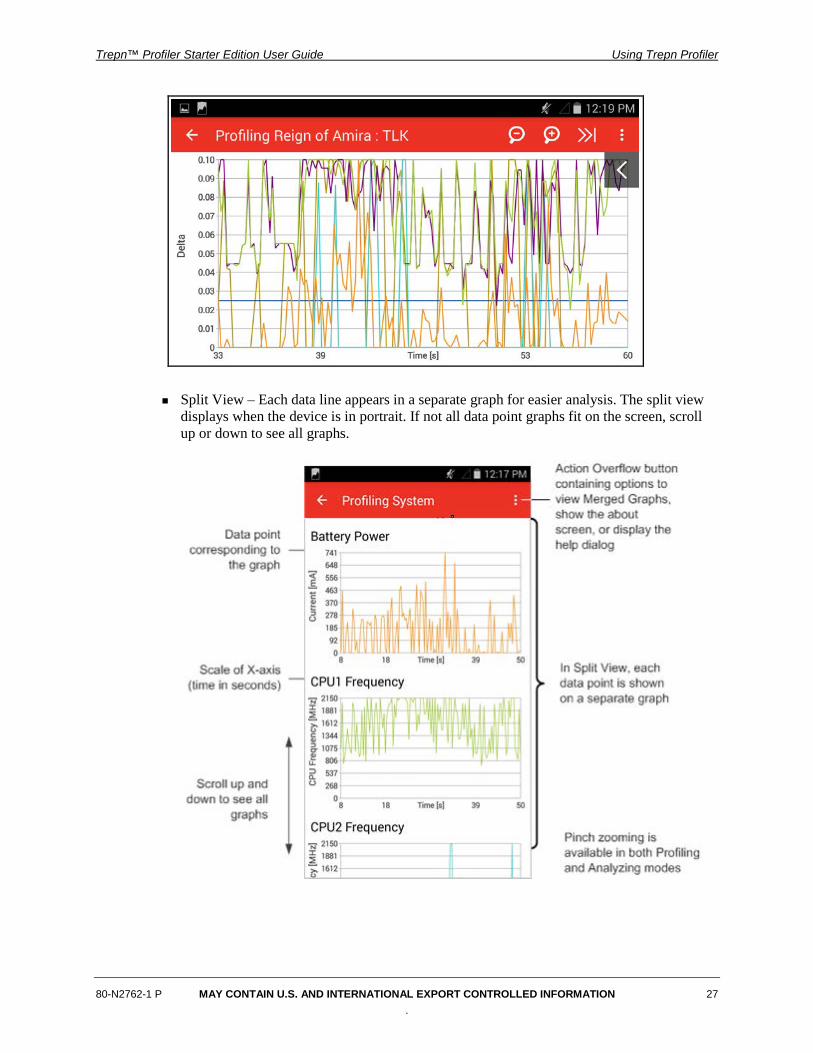
Merged View – All data points are plotted on the same graph. The merged view displays when the device is in landscape. In this view, the legend defines the data points by color. However, the legend is hidden in a slide-out drawer. See Viewing the legend for details.
Trepn™ Profiler Starter Edition User Guide Using Trepn Profiler
80-N2762-1 P MAY CONTAIN U.S. AND INTERNATIONAL EXPORT CONTROLLED INFORMATION 27 .
Split View – Each data line appears in a separate graph for easier analysis. The split view displays when the device is in portrait. If not all data point graphs fit on the screen, scroll up or down to see all graphs.
Trepn™ Profiler Starter Edition User Guide Using Trepn Profiler
80-N2762-1 P MAY CONTAIN U.S. AND INTERNATIONAL EXPORT CONTROLLED INFORMATION 28 .
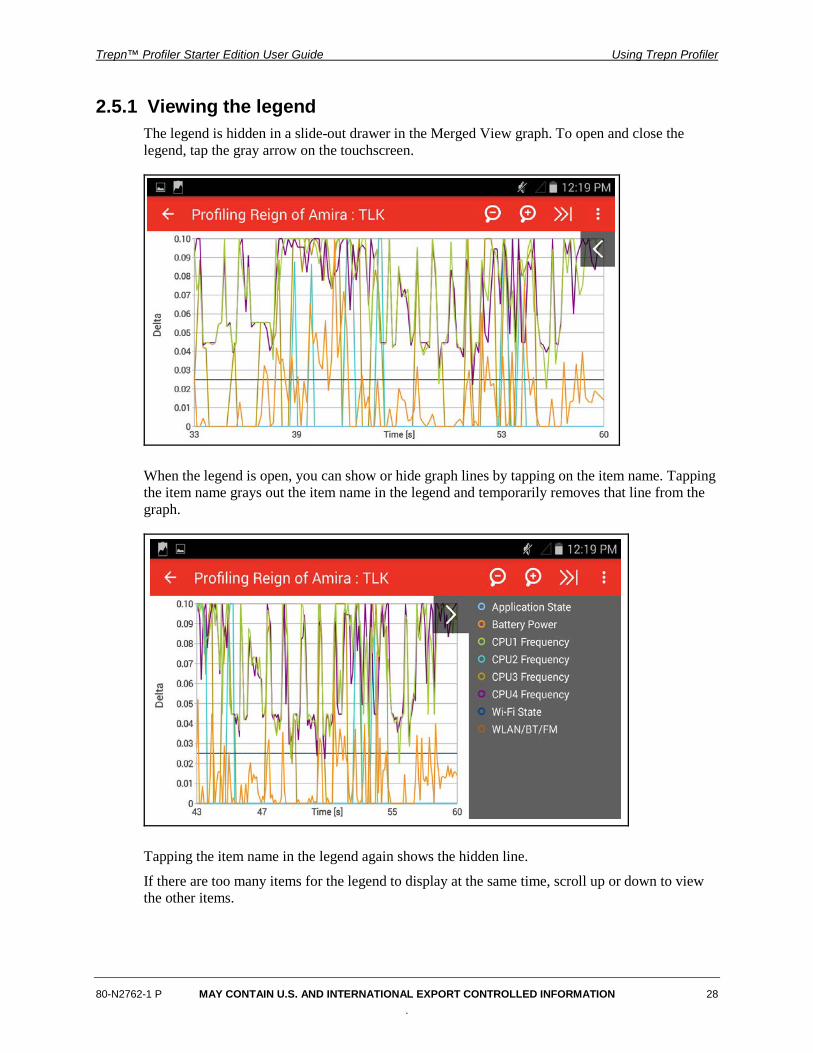
2.5.1 Viewing the legend The legend is hidden in a slide-out drawer in the Merged View graph. To open and close the legend, tap the gray arrow on the touchscreen.
When the legend is open, you can show or hide graph lines by tapping on the item name. Tapping the item name grays out the item name in the legend and temporarily removes that line from the graph.
Tapping the item name in the legend again shows the hidden line.
If there are too many items for the legend to display at the same time, scroll up or down to view the other items.
Trepn™ Profiler Starter Edition User Guide Using Trepn Profiler
80-N2762-1 P MAY CONTAIN U.S. AND INTERNATIONAL EXPORT CONTROLLED INFORMATION 29 .
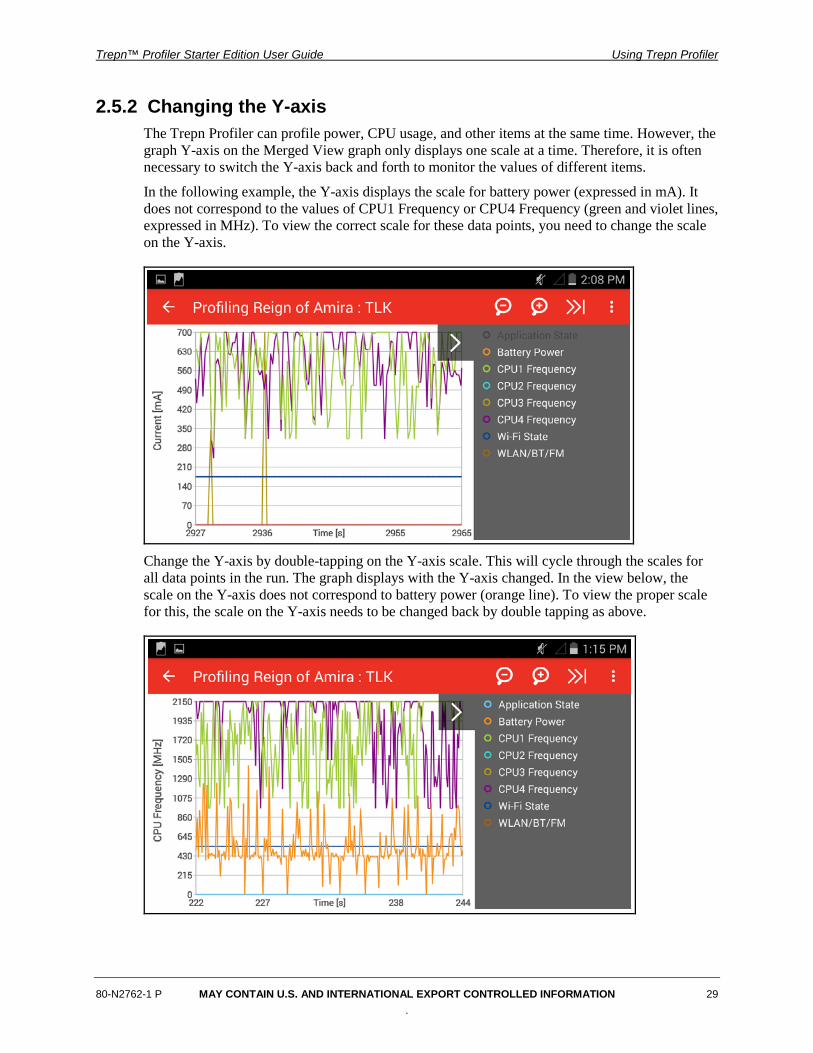
2.5.2 Changing the Y-axis The Trepn Profiler can profile power, CPU usage, and other items at the same time. However, the graph Y-axis on the Merged View graph only displays one scale at a time. Therefore, it is often necessary to switch the Y-axis back and forth to monitor the values of different items.
In the following example, the Y-axis displays the scale for battery power (expressed in mA). It does not correspond to the values of CPU1 Frequency or CPU4 Frequency (green and violet lines, expressed in MHz). To view the correct scale for these data points, you need to change the scale on the Y-axis.
Change the Y-axis by double-tapping on the Y-axis scale. This will cycle through the scales for all data points in the run. The graph displays with the Y-axis changed. In the view below, the scale on the Y-axis does not correspond to battery power (orange line). To view the proper scale for this, the scale on the Y-axis needs to be changed back by double tapping as above.
Trepn™ Profiler Starter Edition User Guide Using Trepn Profiler
80-N2762-1 P MAY CONTAIN U.S. AND INTERNATIONAL EXPORT CONTROLLED INFORMATION 30 .
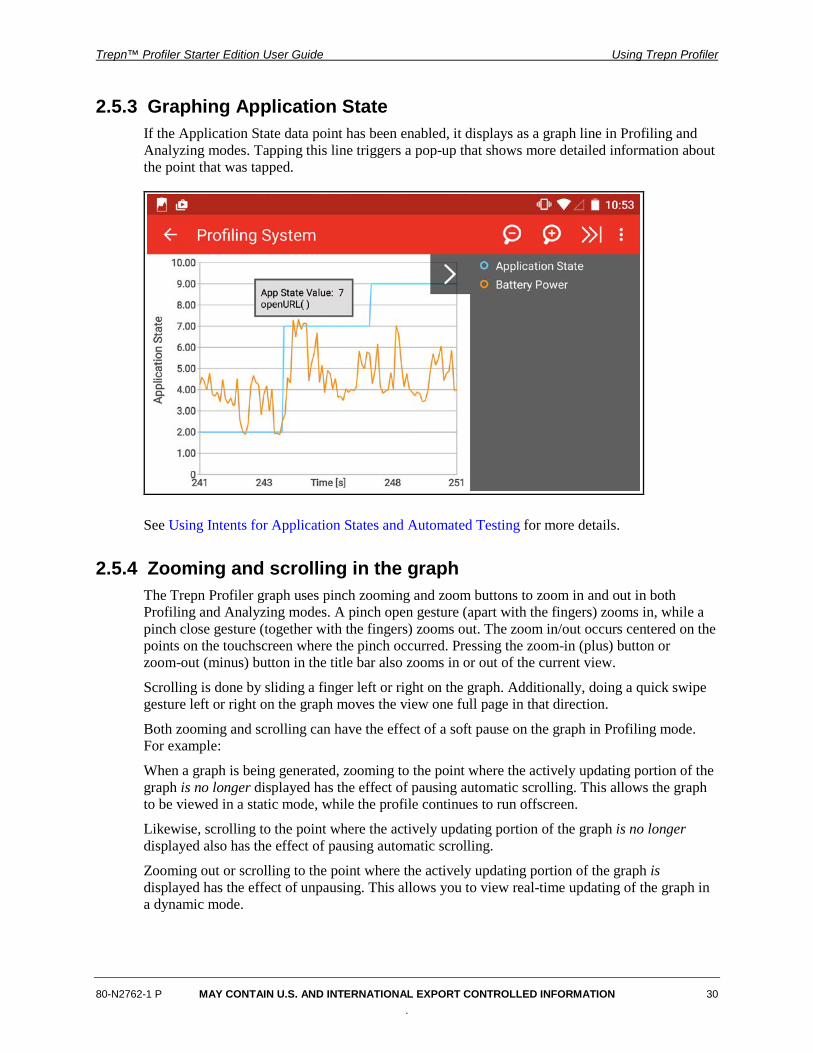
2.5.3 Graphing Application State If the Application State data point has been enabled, it displays as a graph line in Profiling and Analyzing modes. Tapping this line triggers a pop-up that shows more detailed information about the point that was tapped.
See Using Intents for Application States and Automated Testing for more details.
2.5.4 Zooming and scrolling in the graph The Trepn Profiler graph uses pinch zooming and zoom buttons to zoom in and out in both Profiling and Analyzing modes. A pinch open gesture (apart with the fingers) zooms in, while a pinch close gesture (together with the fingers) zooms out. The zoom in/out occurs centered on the points on the touchscreen where the pinch occurred. Pressing the zoom-in (plus) button or zoom-out (minus) button in the title bar also zooms in or out of the current view.
Scrolling is done by sliding a finger left or right on the graph. Additionally, doing a quick swipe gesture left or right on the graph moves the view one full page in that direction.
Both zooming and scrolling can have the effect of a soft pause on the graph in Profiling mode. For example:
When a graph is being generated, zooming to the point where the actively updating portion of the graph is no longer displayed has the effect of pausing automatic scrolling. This allows the graph to be viewed in a static mode, while the profile continues to run offscreen.
Likewise, scrolling to the point where the actively updating portion of the graph is no longer displayed also has the effect of pausing automatic scrolling.
Zooming out or scrolling to the point where the actively updating portion of the graph is displayed has the effect of unpausing. This allows you to view real-time updating of the graph in a dynamic mode.
Trepn™ Profiler Starter Edition User Guide Using Trepn Profiler
80-N2762-1 P MAY CONTAIN U.S. AND INTERNATIONAL EXPORT CONTROLLED INFORMATION 31 .
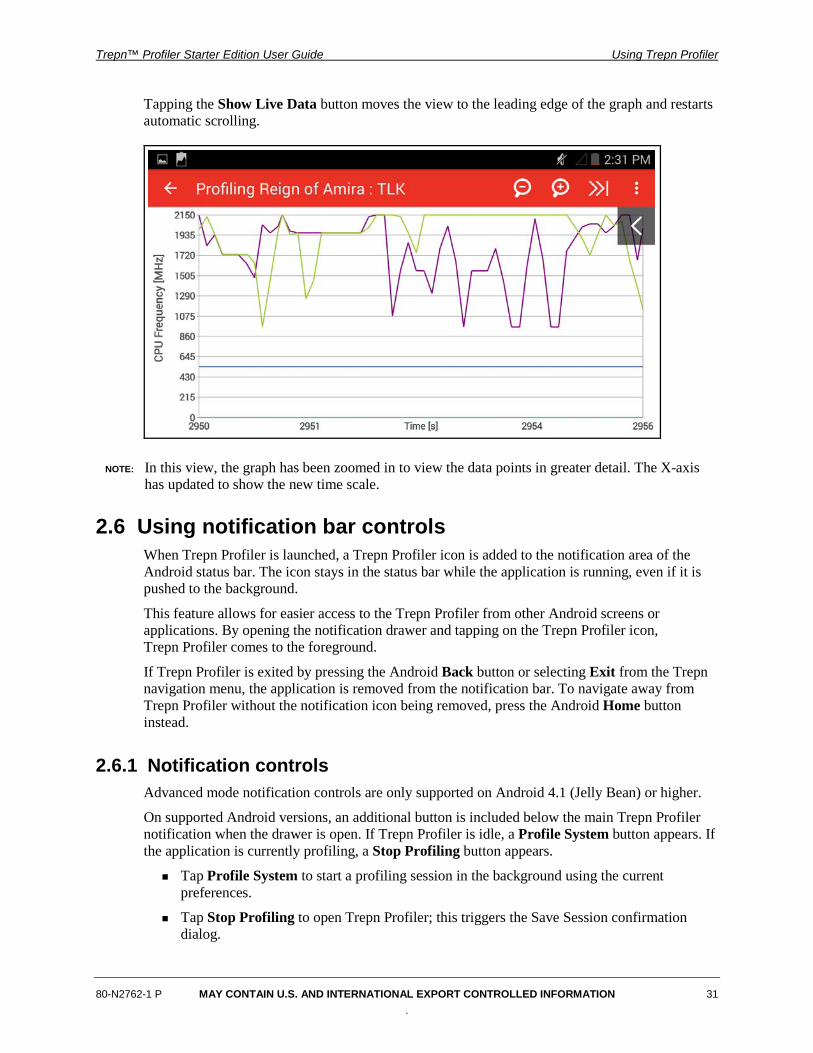
Tapping the Show Live Data button moves the view to the leading edge of the graph and restarts automatic scrolling.
NOTE: In this view, the graph has been zoomed in to view the data points in greater detail. The X-axis has updated to show the new time scale.
2.6 Using notification bar controls When Trepn Profiler is launched, a Trepn Profiler icon is added to the notification area of the Android status bar. The icon stays in the status bar while the application is running, even if it is pushed to the background.
This feature allows for easier access to the Trepn Profiler from other Android screens or applications. By opening the notification drawer and tapping on the Trepn Profiler icon, Trepn Profiler comes to the foreground.
If Trepn Profiler is exited by pressing the Android Back button or selecting Exit from the Trepn navigation menu, the application is removed from the notification bar. To navigate away from Trepn Profiler without the notification icon being removed, press the Android Home button instead.
2.6.1 Notification controls Advanced mode notification controls are only supported on Android 4.1 (Jelly Bean) or higher.
On supported Android versions, an additional button is included below the main Trepn Profiler notification when the drawer is open. If Trepn Profiler is idle, a Profile System button appears. If the application is currently profiling, a Stop Profiling button appears.
Tap Profile System to start a profiling session in the background using the current preferences.
Tap Stop Profiling to open Trepn Profiler; this triggers the Save Session confirmation dialog.
Trepn™ Profiler Starter Edition User Guide Using Trepn Profiler
80-N2762-1 P MAY CONTAIN U.S. AND INTERNATIONAL EXPORT CONTROLLED INFORMATION 32 .
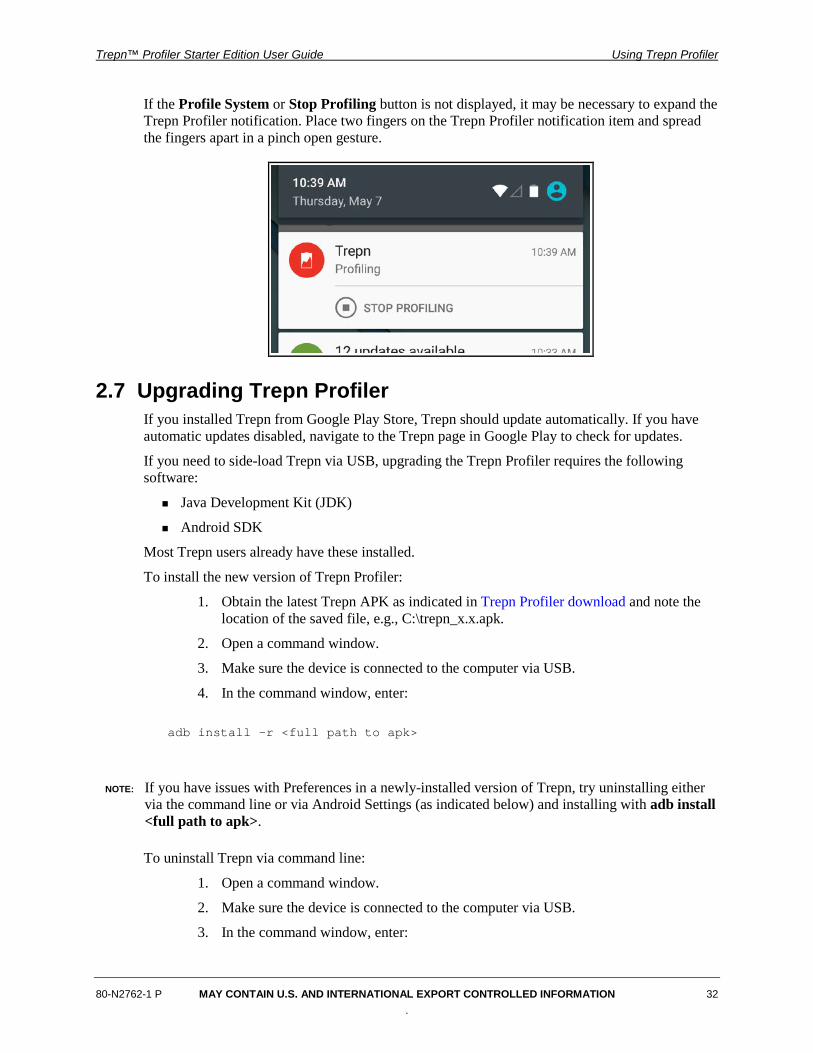
If the Profile System or Stop Profiling button is not displayed, it may be necessary to expand the Trepn Profiler notification. Place two fingers on the Trepn Profiler notification item and spread the fingers apart in a pinch open gesture.
2.7 Upgrading Trepn Profiler If you installed Trepn from Google Play Store, Trepn should update automatically. If you have automatic updates disabled, navigate to the Trepn page in Google Play to check for updates.
If you need to side-load Trepn via USB, upgrading the Trepn Profiler requires the following software:
Java Development Kit (JDK)
Android SDK
Most Trepn users already have these installed.
To install the new version of Trepn Profiler:
1. Obtain the latest Trepn APK as indicated in Trepn Profiler download and note the location of the saved file, e.g., C:\trepn_x.x.apk.
2. Open a command window.
3. Make sure the device is connected to the computer via USB.
4. In the command window, enter:
adb install -r <full path to apk>
NOTE: If you have issues with Preferences in a newly-installed version of Trepn, try uninstalling either via the command line or via Android Settings (as indicated below) and installing with adb install <full path to apk>.
To uninstall Trepn via command line:
1. Open a command window.
2. Make sure the device is connected to the computer via USB.
3. In the command window, enter:
Trepn™ Profiler Starter Edition User Guide Using Trepn Profiler
80-N2762-1 P MAY CONTAIN U.S. AND INTERNATIONAL EXPORT CONTROLLED INFORMATION 33 .
adb uninstall com.quicinc.trepn
To uninstall Trepn via Android Settings:
1. Navigate to Settings→Apps.
2. Tap Trepn Profiler.
3. Tap Uninstall.
4. At the Uninstall application dialog, tap OK to confirm.
2.8 Analyzing battery power
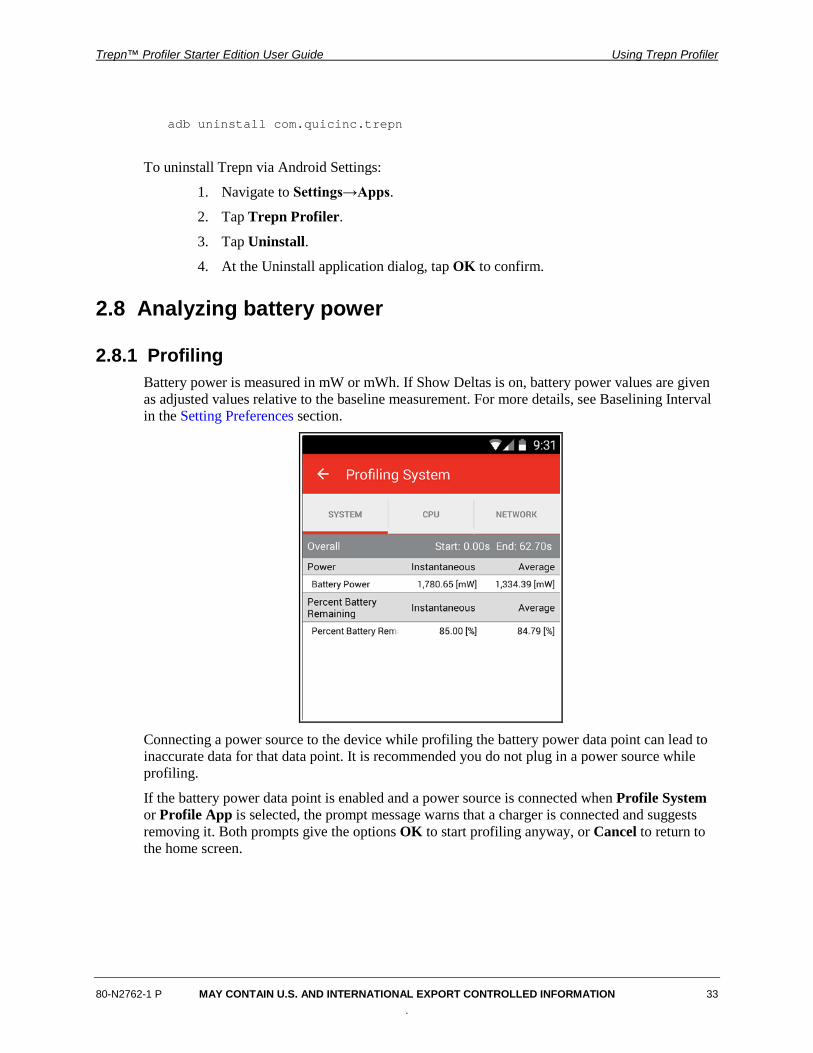
2.8.1 Profiling Battery power is measured in mW or mWh. If Show Deltas is on, battery power values are given as adjusted values relative to the baseline measurement. For more details, see Baselining Interval in the Setting Preferences section.
Connecting a power source to the device while profiling the battery power data point can lead to inaccurate data for that data point. It is recommended you do not plug in a power source while profiling.
If the battery power data point is enabled and a power source is connected when Profile System or Profile App is selected, the prompt message warns that a charger is connected and suggests removing it. Both prompts give the options OK to start profiling anyway, or Cancel to return to the home screen.
Trepn™ Profiler Starter Edition User Guide Using Trepn Profiler
80-N2762-1 P MAY CONTAIN U.S. AND INTERNATIONAL EXPORT CONTROLLED INFORMATION 34 .
If a power source gets plugged in while a profiling session is already running and Trepn Profiler is the foreground application, a prompt may display to warn that a charger has been connected. The prompt can be dismissed by pressing the OK button to continue.
NOTE: A power source can include a wall charger, USB cable, docking station, or any other powered connection.
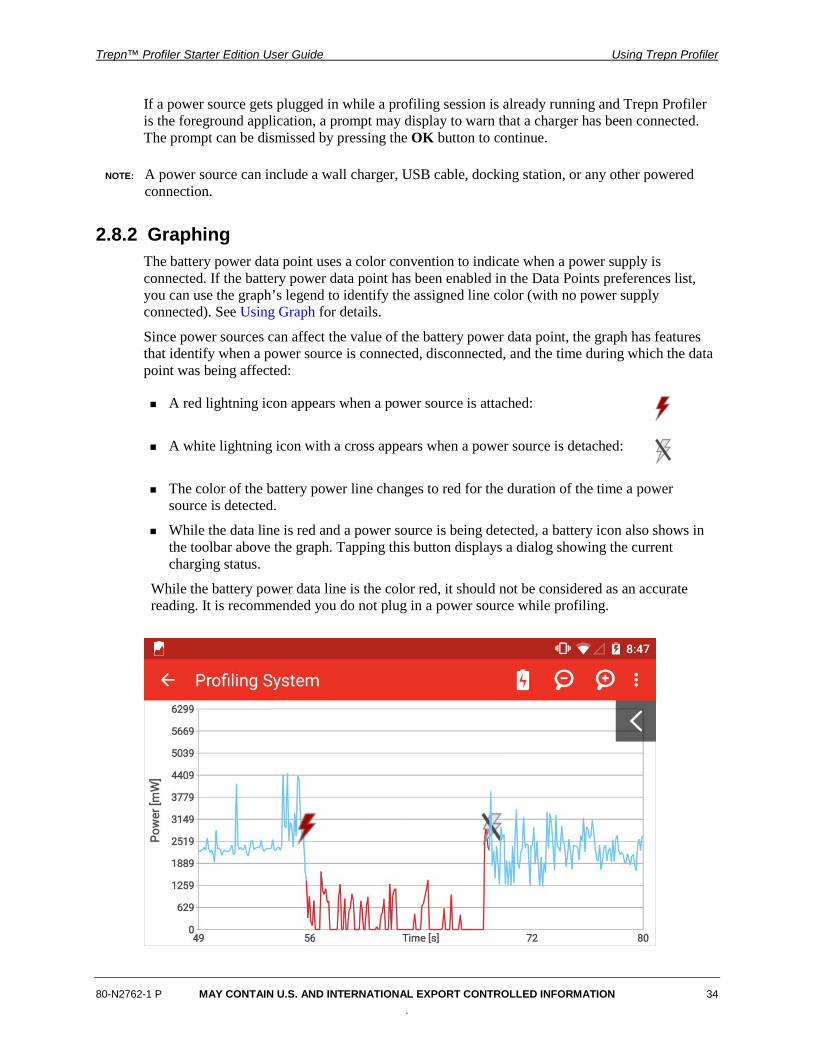
2.8.2 Graphing The battery power data point uses a color convention to indicate when a power supply is connected. If the battery power data point has been enabled in the Data Points preferences list, you can use the graph’s legend to identify the assigned line color (with no power supply connected). See Using Graph for details.
Since power sources can affect the value of the battery power data point, the graph has features that identify when a power source is connected, disconnected, and the time during which the data point was being affected:
A red lightning icon appears when a power source is attached:
A white lightning icon with a cross appears when a power source is detached:
The color of the battery power line changes to red for the duration of the time a power source is detected.
While the data line is red and a power source is being detected, a battery icon also shows in the toolbar above the graph. Tapping this button displays a dialog showing the current charging status.
While the battery power data line is the color red, it should not be considered as an accurate reading. It is recommended you do not plug in a power source while profiling.
Trepn™ Profiler Starter Edition User Guide Using Trepn Profiler
80-N2762-1 P MAY CONTAIN U.S. AND INTERNATIONAL EXPORT CONTROLLED INFORMATION 35 .
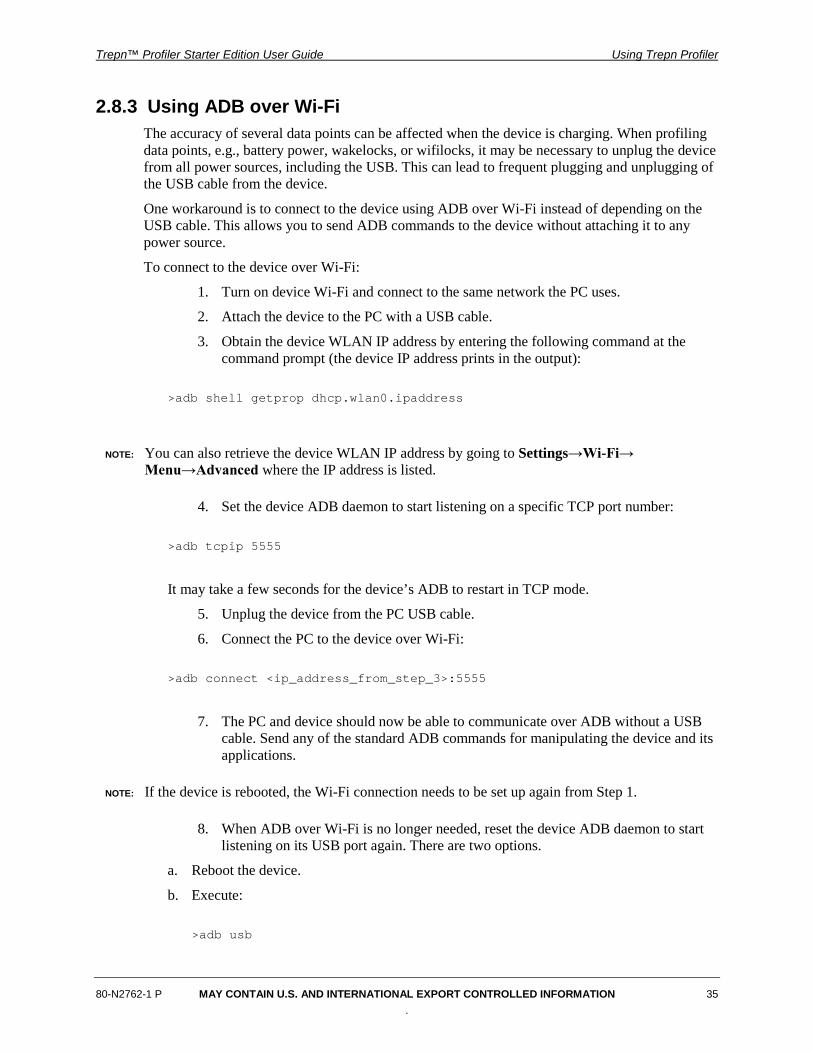
2.8.3 Using ADB over Wi-Fi The accuracy of several data points can be affected when the device is charging. When profiling data points, e.g., battery power, wakelocks, or wifilocks, it may be necessary to unplug the device from all power sources, including the USB. This can lead to frequent plugging and unplugging of the USB cable from the device.
One workaround is to connect to the device using ADB over Wi-Fi instead of depending on the USB cable. This allows you to send ADB commands to the device without attaching it to any power source.
To connect to the device over Wi-Fi:
1. Turn on device Wi-Fi and connect to the same network the PC uses.
2. Attach the device to the PC with a USB cable.
3. Obtain the device WLAN IP address by entering the following command at the command prompt (the device IP address prints in the output):
>adb shell getprop dhcp.wlan0.ipaddress
NOTE: You can also retrieve the device WLAN IP address by going to Settings→Wi-Fi→ Menu→Advanced where the IP address is listed.
4. Set the device ADB daemon to start listening on a specific TCP port number:
>adb tcpip 5555
It may take a few seconds for the device’s ADB to restart in TCP mode.
5. Unplug the device from the PC USB cable.
6. Connect the PC to the device over Wi-Fi:
>adb connect <ip_address_from_step_3>:5555
7. The PC and device should now be able to communicate over ADB without a USB cable. Send any of the standard ADB commands for manipulating the device and its applications.
NOTE: If the device is rebooted, the Wi-Fi connection needs to be set up again from Step 1.
8. When ADB over Wi-Fi is no longer needed, reset the device ADB daemon to start listening on its USB port again. There are two options.
a. Reboot the device.
b. Execute:
>adb usb

Trepn™ Profiler Starter Edition User Guide Using Trepn Profiler
80-N2762-1 P MAY CONTAIN U.S. AND INTERNATIONAL EXPORT CONTROLLED INFORMATION 36 .
9. To disconnect from the device while still leaving it in Wi-Fi mode to reconnect later, use this command:
>adb disconnect <ip_address_from_step_3>:5555
For more information on ADB commands, access the terminal’s ADB help:
>adb help
80-N2762-1 P MAY CONTAIN U.S. AND INTERNATIONAL EXPORT CONTROLLED INFORMATION 37
3 Using Intents for Application States and Automated Testing
3.1 Using Android Intents to identify Application State changes in Trepn Log
In its basic form, Trepn Profiler can be used as-is without changing the application. Use the Trepn Profiler to launch an application and observe graphs that illustrate how much CPU and power are being used through the lifetime of the application.
For best results, it is recommended to instrument your code to correlate application behavior with graph activity in the Trepn Profiler.
3.1.1 Manipulating Application State in your app One important feature of the Trepn Profiler is its ability to capture Android Intents from an application. The Trepn Profiler allows you to view the Application State with the other selected data points (power values, CPU loads, etc.), which can be extremely valuable in diagnosing a problem in the application. You can add the code snippet in Code for changing Application State into your application to send an Intent for the Trepn Profiler to change the Application State at that point. This allows for a definitive breakdown of usage consumption during specific portions of the application.
For example, say the application being profiled is communicating with a web server and a local SQLite database to get/send data. If the application is performing several requests and a spike in power consumption appears, it may not be clear which task in the application caused this consumption spike. The Application State allows the developer to track down exactly which part of the code is causing this spike.
Essentially, Application State aides in the diagnosis of resource consumption problems, so that you can solve the problem more efficiently.
3.1.2 Code for changing Application State The Trepn Profiler allows for simply sending a call to update the state, where the Trepn Profiler increments it by 1, or the Intent can include an integer value. When this integer value is included, the Trepn Profiler directly assigns the state to this supplied integer value. This is useful if the application has many states which can be confusing to monitor with auto-incremented values or if
Trepn™ Profiler Starter Edition User Guide Using Intents for Application States and Automated Testing
80-N2762-1 P MAY CONTAIN U.S. AND INTERNATIONAL EXPORT CONTROLLED INFORMATION 38 .
the application is alternating between the same states while running (going from state=1 to state=2 and back to state=1, etc.).
The applicable code for an auto-incrementing state is:
Intent stateUpdate = new Intent("com.quicinc.Trepn.UpdateAppState");
sendBroadcast(stateUpdate);
The applicable code for a developer-assigned state with a state description is:
Intent stateUpdate = new Intent("com.quicinc.Trepn.UpdateAppState");
stateUpdate.putExtra("com.quicinc.Trepn.UpdateAppState.Value", <int_value>);
stateUpdate.putExtra("com.quicinc.Trepn.UpdateAppState.Value.Desc", <string_value>);
sendBroadcast(stateUpdate);
In this code, change <int_value> to an integer value to correspond to what you want the Application State in the Trepn Profiler to be when that Intent is received. Change <string_value> to a string value corresponding to the description of that Application State when the Intent is received.
The value and description properties are both optional. If an Application State Intent does not include a value, it will simply increment the current value by one.
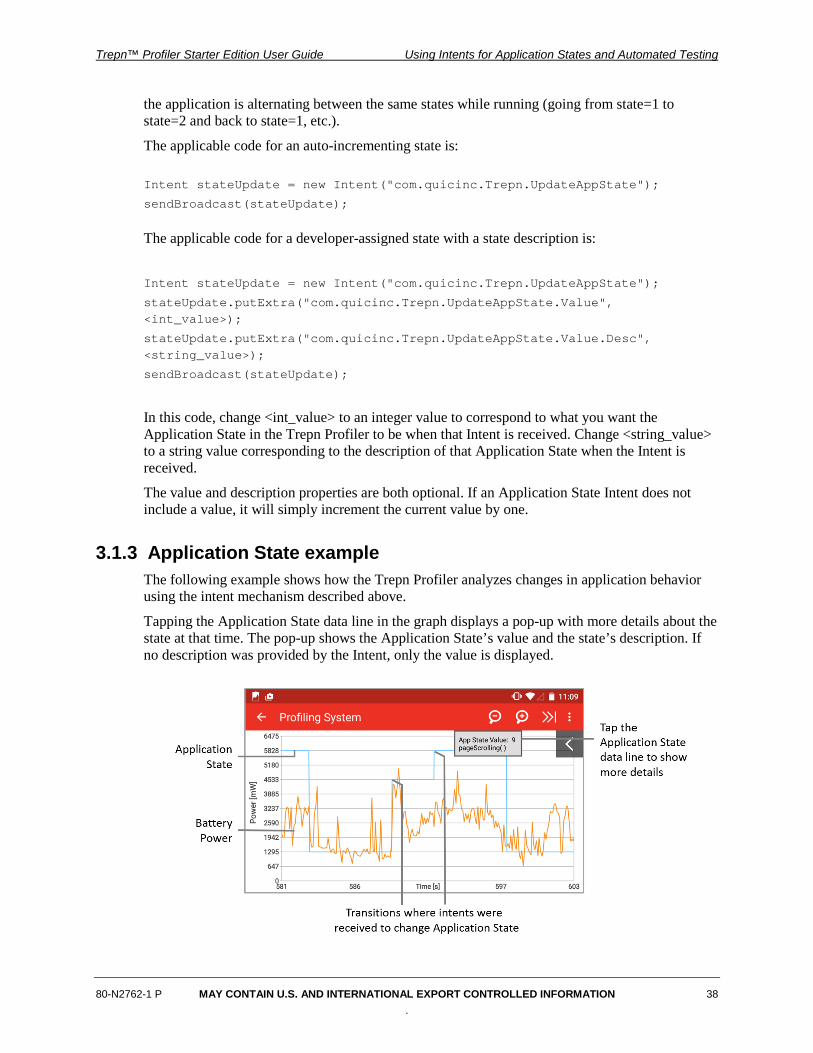
3.1.3 Application State example The following example shows how the Trepn Profiler analyzes changes in application behavior using the intent mechanism described above.
Tapping the Application State data line in the graph displays a pop-up with more details about the state at that time. The pop-up shows the Application State’s value and the state’s description. If no description was provided by the Intent, only the value is displayed.
Trepn™ Profiler Starter Edition User Guide Using Intents for Application States and Automated Testing
80-N2762-1 P MAY CONTAIN U.S. AND INTERNATIONAL EXPORT CONTROLLED INFORMATION 39 .
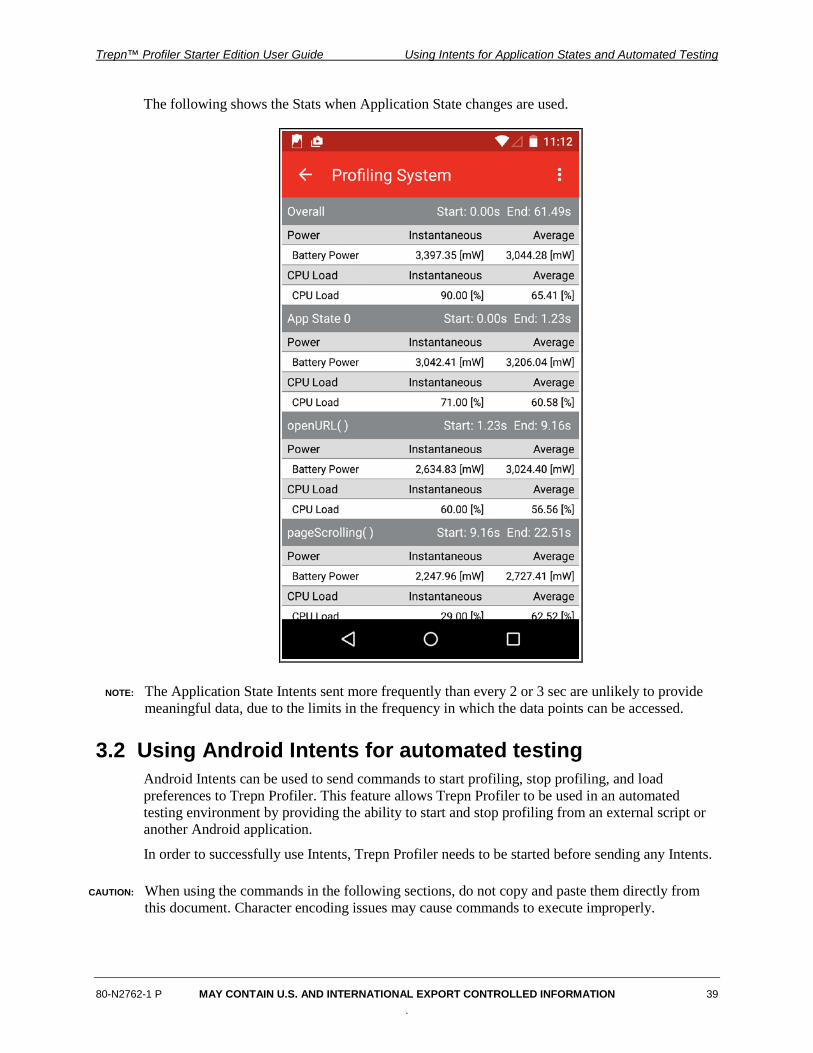
The following shows the Stats when Application State changes are used.
NOTE: The Application State Intents sent more frequently than every 2 or 3 sec are unlikely to provide meaningful data, due to the limits in the frequency in which the data points can be accessed.
3.2 Using Android Intents for automated testing Android Intents can be used to send commands to start profiling, stop profiling, and load preferences to Trepn Profiler. This feature allows Trepn Profiler to be used in an automated testing environment by providing the ability to start and stop profiling from an external script or another Android application.
In order to successfully use Intents, Trepn Profiler needs to be started before sending any Intents.
CAUTION: When using the commands in the following sections, do not copy and paste them directly from this document. Character encoding issues may cause commands to execute improperly.
Trepn™ Profiler Starter Edition User Guide Using Intents for Application States and Automated Testing
80-N2762-1 P MAY CONTAIN U.S. AND INTERNATIONAL EXPORT CONTROLLED INFORMATION 40 .
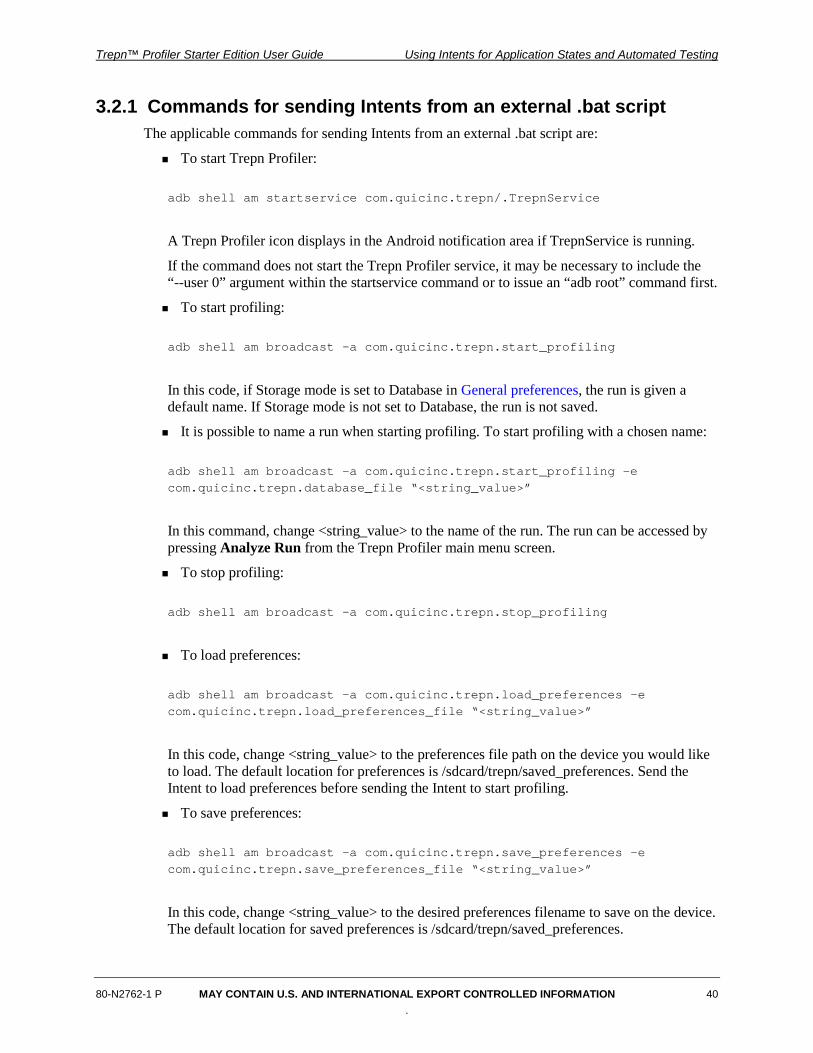
3.2.1 Commands for sending Intents from an external .bat script The applicable commands for sending Intents from an external .bat script are:
To start Trepn Profiler:
adb shell am startservice com.quicinc.trepn/.TrepnService
A Trepn Profiler icon displays in the Android notification area if TrepnService is running.
If the command does not start the Trepn Profiler service, it may be necessary to include the “--user 0” argument within the startservice command or to issue an “adb root” command first.
To start profiling:
adb shell am broadcast –a com.quicinc.trepn.start_profiling
In this code, if Storage mode is set to Database in General preferences, the run is given a default name. If Storage mode is not set to Database, the run is not saved.
It is possible to name a run when starting profiling. To start profiling with a chosen name:
adb shell am broadcast –a com.quicinc.trepn.start_profiling –e com.quicinc.trepn.database_file “<string_value>”
In this command, change <string_value> to the name of the run. The run can be accessed by pressing Analyze Run from the Trepn Profiler main menu screen.
To stop profiling:
adb shell am broadcast –a com.quicinc.trepn.stop_profiling
To load preferences:
adb shell am broadcast -a com.quicinc.trepn.load_preferences –e com.quicinc.trepn.load_preferences_file “<string_value>”
In this code, change <string_value> to the preferences file path on the device you would like to load. The default location for preferences is /sdcard/trepn/saved_preferences. Send the Intent to load preferences before sending the Intent to start profiling.
To save preferences:
adb shell am broadcast -a com.quicinc.trepn.save_preferences –e com.quicinc.trepn.save_preferences_file “<string_value>”
In this code, change <string_value> to the desired preferences filename to save on the device. The default location for saved preferences is /sdcard/trepn/saved_preferences.
Trepn™ Profiler Starter Edition User Guide Using Intents for Application States and Automated Testing
80-N2762-1 P MAY CONTAIN U.S. AND INTERNATIONAL EXPORT CONTROLLED INFORMATION 41 .
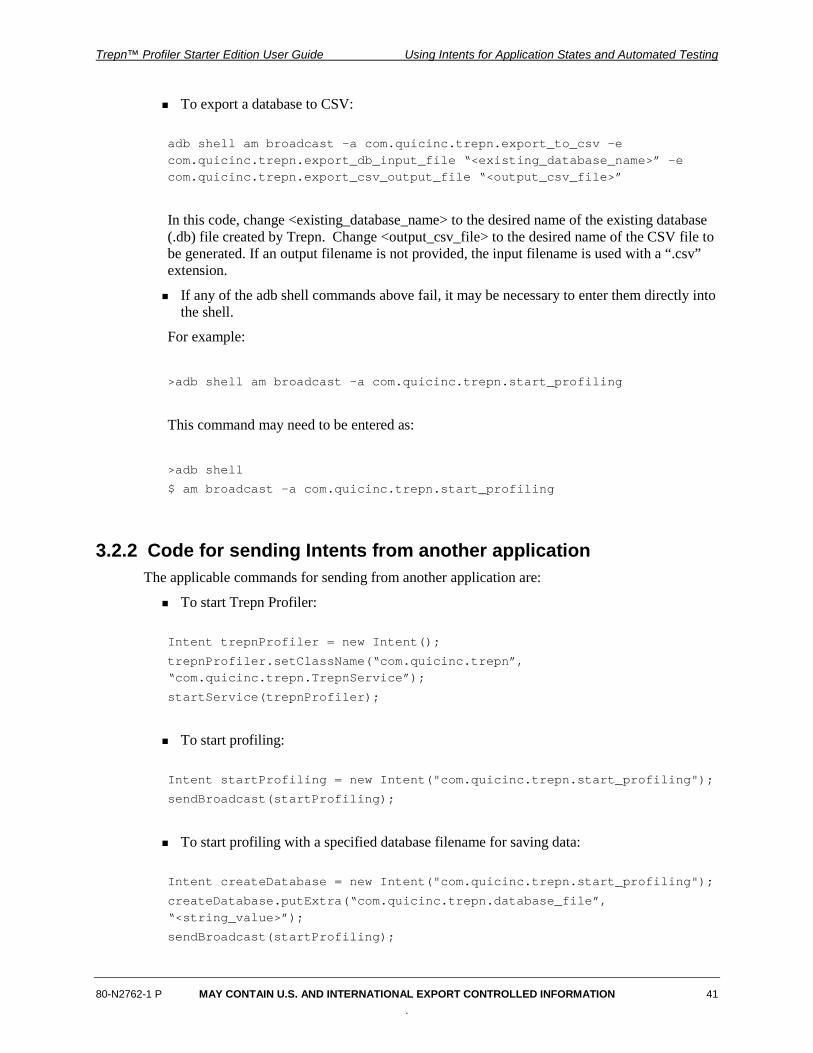
To export a database to CSV:
adb shell am broadcast -a com.quicinc.trepn.export_to_csv -e com.quicinc.trepn.export_db_input_file “<existing_database_name>” -e com.quicinc.trepn.export_csv_output_file “<output_csv_file>”
In this code, change <existing_database_name> to the desired name of the existing database (.db) file created by Trepn. Change <output_csv_file> to the desired name of the CSV file to be generated. If an output filename is not provided, the input filename is used with a “.csv” extension.
If any of the adb shell commands above fail, it may be necessary to enter them directly into the shell.
For example:
>adb shell am broadcast –a com.quicinc.trepn.start_profiling
This command may need to be entered as:
>adb shell
$ am broadcast –a com.quicinc.trepn.start_profiling
3.2.2 Code for sending Intents from another application The applicable commands for sending from another application are:
To start Trepn Profiler:
Intent trepnProfiler = new Intent();
trepnProfiler.setClassName(“com.quicinc.trepn”, “com.quicinc.trepn.TrepnService”);
startService(trepnProfiler);
To start profiling:
Intent startProfiling = new Intent("com.quicinc.trepn.start_profiling");
sendBroadcast(startProfiling);
To start profiling with a specified database filename for saving data:
Intent createDatabase = new Intent("com.quicinc.trepn.start_profiling");
createDatabase.putExtra(“com.quicinc.trepn.database_file”, “<string_value>”);
sendBroadcast(startProfiling);
Trepn™ Profiler Starter Edition User Guide Using Intents for Application States and Automated Testing
80-N2762-1 P MAY CONTAIN U.S. AND INTERNATIONAL EXPORT CONTROLLED INFORMATION 42 .
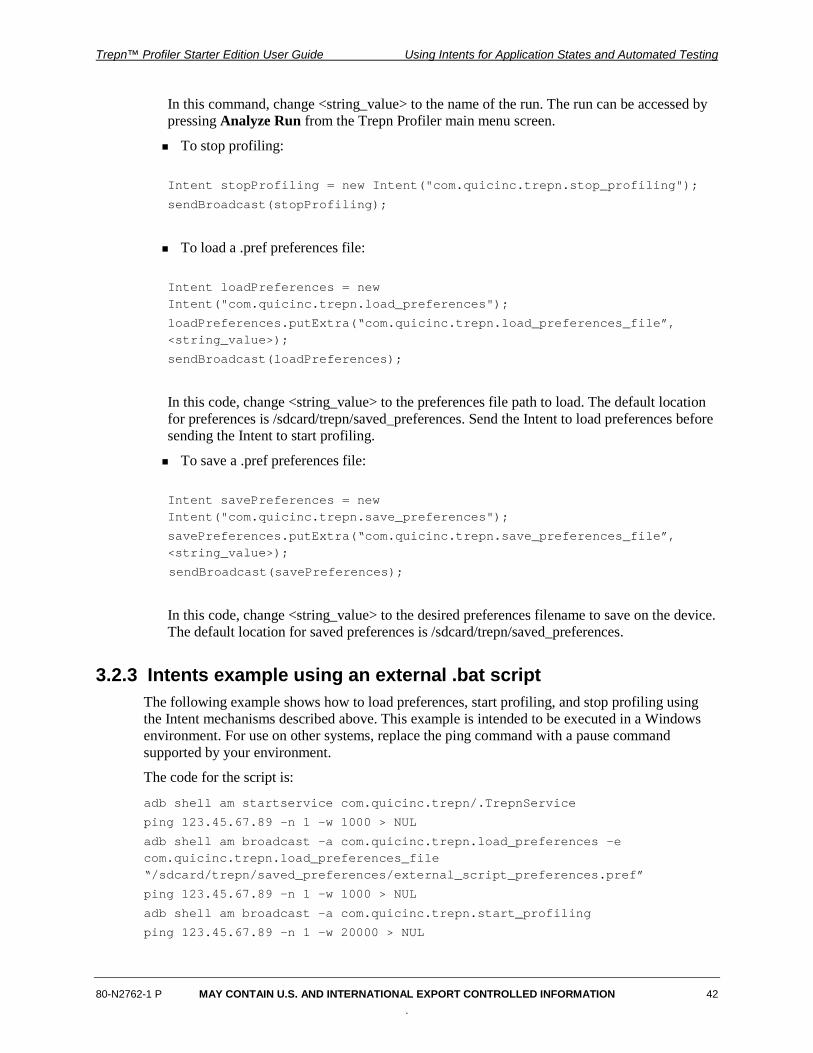
In this command, change <string_value> to the name of the run. The run can be accessed by pressing Analyze Run from the Trepn Profiler main menu screen.
To stop profiling:
Intent stopProfiling = new Intent("com.quicinc.trepn.stop_profiling");
sendBroadcast(stopProfiling);
To load a .pref preferences file:
Intent loadPreferences = new Intent("com.quicinc.trepn.load_preferences");
loadPreferences.putExtra(“com.quicinc.trepn.load_preferences_file”, <string_value>);
sendBroadcast(loadPreferences);
In this code, change <string_value> to the preferences file path to load. The default location for preferences is /sdcard/trepn/saved_preferences. Send the Intent to load preferences before sending the Intent to start profiling.
To save a .pref preferences file:
Intent savePreferences = new Intent("com.quicinc.trepn.save_preferences");
savePreferences.putExtra(“com.quicinc.trepn.save_preferences_file”, <string_value>);
sendBroadcast(savePreferences);
In this code, change <string_value> to the desired preferences filename to save on the device. The default location for saved preferences is /sdcard/trepn/saved_preferences.
3.2.3 Intents example using an external .bat script The following example shows how to load preferences, start profiling, and stop profiling using the Intent mechanisms described above. This example is intended to be executed in a Windows environment. For use on other systems, replace the ping command with a pause command supported by your environment.
The code for the script is:
adb shell am startservice com.quicinc.trepn/.TrepnService
ping 123.45.67.89 -n 1 -w 1000 > NUL
adb shell am broadcast -a com.quicinc.trepn.load_preferences –e com.quicinc.trepn.load_preferences_file “/sdcard/trepn/saved_preferences/external_script_preferences.pref”
ping 123.45.67.89 –n 1 –w 1000 > NUL
adb shell am broadcast –a com.quicinc.trepn.start_profiling
ping 123.45.67.89 –n 1 –w 20000 > NUL
Trepn™ Profiler Starter Edition User Guide Using Intents for Application States and Automated Testing
80-N2762-1 P MAY CONTAIN U.S. AND INTERNATIONAL EXPORT CONTROLLED INFORMATION 43 .
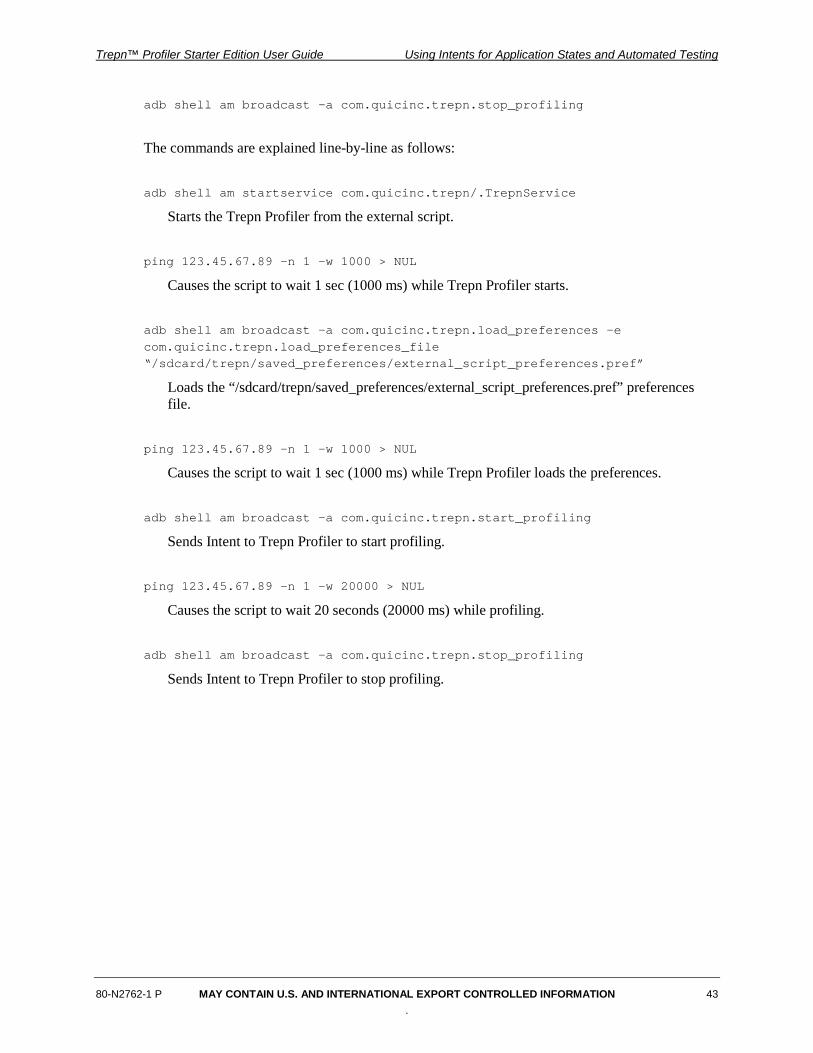
adb shell am broadcast –a com.quicinc.trepn.stop_profiling
The commands are explained line-by-line as follows:
adb shell am startservice com.quicinc.trepn/.TrepnService
Starts the Trepn Profiler from the external script.
ping 123.45.67.89 -n 1 -w 1000 > NUL
Causes the script to wait 1 sec (1000 ms) while Trepn Profiler starts.
adb shell am broadcast -a com.quicinc.trepn.load_preferences –e com.quicinc.trepn.load_preferences_file “/sdcard/trepn/saved_preferences/external_script_preferences.pref”
Loads the “/sdcard/trepn/saved_preferences/external_script_preferences.pref” preferences file.
ping 123.45.67.89 –n 1 –w 1000 > NUL
Causes the script to wait 1 sec (1000 ms) while Trepn Profiler loads the preferences.
adb shell am broadcast –a com.quicinc.trepn.start_profiling
Sends Intent to Trepn Profiler to start profiling.
ping 123.45.67.89 –n 1 –w 20000 > NUL
Causes the script to wait 20 seconds (20000 ms) while profiling.
adb shell am broadcast –a com.quicinc.trepn.stop_profiling
Sends Intent to Trepn Profiler to stop profiling.
80-N2762-1 P MAY CONTAIN U.S. AND INTERNATIONAL EXPORT CONTROLLED INFORMATION 44
A Tips for Using Trepn Profiler Efficiently
Trepn Profiler is an on-target profiler. While this offers the benefit of being easy to use, it also uses system resources on the target while profiling. The additional overhead may impact device performance or the application under test. If the overhead is too high, Trepn Profiler may also begin capturing data at less frequent intervals.
A.1 Managing Trepn Profiler impact Trepn Profiler includes many useful features but not all of them may be needed for every profiling session.
Here are some preference changes and tips to use Trepn Profiler more efficiently.
NOTE: For details on editing preferences, see Setting Preferences.
General preferences Storage Mode – Change the Storage Mode preference to None or Main Memory. Database
mode continuously saves data to a database on the micro-SD card/internal memory. This leads to higher CPU usage overhead than the other modes. The None Storage mode does not save any data points. The Main Memory Storage mode saves data in RAM and can be saved to a database or .csv file when profiling completes. Due to the limited RAM Android provides to Trepn Profiler, not all data is guaranteed to be saved. For a typical session, approximately the last hour of data is saved, but this varies depending on the amount of data profiled in the session. For more information on Storage Mode settings, see General preferences.
Show Per-Application Statistics – Turn this feature off to reduce overhead. This preference determines whether CPU and memory statistics are collected for all applications active during the profiling period. The amount of overhead varies depending on the number of active applications.
Polling Interval – Increasing the polling interval value reduces overhead. This preference sets the period between data-point readings. Increasing the polling interval decreases the sampling rate.
Data points Turn off unnecessary data points. Each additional data point contributes to CPU usage
overhead.
Although there is no theoretical maximum to the number of data points that can be traced, the frequency of polling decreases as an inverse of the number of data points selected. Therefore, a small number of data points produces a more frequent polling interval. If Trepn Profiler appears to slow down or produces sparse data points, turn off unnecessary data points from the polling set and trace one targeted subset at a time.
Trepn™ Profiler Starter Edition User Guide Tips for Using Trepn Profiler Efficiently
80-N2762-1 P MAY CONTAIN U.S. AND INTERNATIONAL EXPORT CONTROLLED INFORMATION 45
Overlays Turn off unnecessary overlays. Turning off unused overlays (by pressing on an overlay in
preferences and choosing overlay type, None) helps reduce overhead when Trepn Profiler is running in the background. For more information on overlays, see Overlays.
Additional usage tips Do not use Graph or Stats during profiling. These screens are frequently refreshed during
profiling and can lead to additional CPU usage overhead. For best performance, navigate away from Trepn by tapping Home after starting profiling. Trepn continues profiling data in the background. Combine with the above suggestions for maximum efficiency.
80-N2762-1 P MAY CONTAIN U.S. AND INTERNATIONAL EXPORT CONTROLLED INFORMATION 46
B Data Points
This appendix describes the data points Trepn Profiler can profile.
B.1 Normalized CPU loads The operating frequency of CPUs can be scaled down depending on the workload. CPU Load reports the usage with respect to the operating frequency. Normalized CPU Load reports the usage with respect to the maximum frequency. As a result, CPU Load shows the load with respect to the scaled potential and Normalized CPU Load shows the load with respect to the maximum potential.
Consider the following example:
A device has a single CPU with maximum frequency of 1000 MHz. Consider the case where the workload is low and the operating frequency is scaled down to 500 MHz. In 1 sec, there are 500M clock cycles. Assume the device uses 100M of those cycles for work and is idle for the remaining cycles. CPU Load would show 20% (100/500). However, the maximum potential of the CPU was 1000M cycles, so Normalized CPU Load would show 10% (100/1000).
B.2 Power statistics Power statistics are measured in mW or mWh. If Show Deltas is on, Power Stat values are given as adjusted values relative to the baseline measurement. Power values are available for the following:
Battery power1– Power the battery consumes
Battery status1 – Battery charging status, automatically selected when the battery power data point is selected, but not selectable individually. This data point appears in the .csv file if the battery power data point is profiled.
0 – Not charging
1 – Charging (USB)
2 – Charging (AC)
3 – Charging (generic source)
1 Not available on all devices.
Trepn™ Profiler Starter Edition User Guide Data Points
80-N2762-1 P MAY CONTAIN U.S. AND INTERNATIONAL EXPORT CONTROLLED INFORMATION 47
B.3 CPU statistics CPU Statistics include the following:
CPU Load – Load across all cores
CPU Load – Normalized2 – Normalized CPU load across all cores; see Normalized CPU loads for more information
CPUx Frequency3 – Clock speed for each CPU core
CPUx Load3 – Load for each CPU core
GPU2D0 Load2 – Usage for the first GPU core
GPU2D1 Load2 – Usage for the second GPU core
GPU Frequency2 – Clock speed for the 3D GPU core
GPU Load2 – Usage for the 3D GPU core
B.4 Network statistics Network statistics include:
Bluetooth® State – State of the Bluetooth radio
0 – Off
1 – Turning on
2 – On
3 – Turning off
Mobile Data State – State of the cellular radio
0 – Disconnected
1 – Connecting
2 – Connected, dormant
3 – Connected, no traffic
4 – Connected, sending traffic
5 – Connected, receiving traffic
6 – Connected, sending and receiving traffic
Wi-Fi RSSI Level – RSSI level for the Wi-Fi connection; values are expressed as dBm
Wi-Fi State – State of the Wi-Fi connection
0 – Wi-Fi currently being disabled
1 – Wi-Fi disabled
2 – Wi-Fi currently being enabled
3 – Wi-Fi enabled
2 Not available on all devices. 3 The ‘x’ corresponds to each CPU core number.
Trepn™ Profiler Starter Edition User Guide Data Points
80-N2762-1 P MAY CONTAIN U.S. AND INTERNATIONAL EXPORT CONTROLLED INFORMATION 48
4 – Wi-Fi in unknown state; occurs during enabling or disabling errors
B.5 Other statistics Other statistics include the following:
Application State – Data point for developers to instrument their application/code; Broadcast Intent for the Trepn Profiler to receive and update this value, allowing a more precise understanding of data points; value is a signed 32-bit integer. See Using Android Intents to identify Application State changes in Trepn Log for more information.
GPS State – Current state of the GPS system
0 – GPS stopped
1 – GPS unknown state
2 – GPS running
Memory usage – Total system memory usage
Percent battery remaining – Remaining charge in the battery
Screen brightness2 – Brightness level of the screen’s backlight
Screen State – State of the screen:
0 – Off
1 – On
Wakelocks4 – Instantaneous number of wakelocks being held
Wifilocks4 – Instantaneous number of wifilocks being held
4 Not supported on Android version 4.4 and higher.
80-N2762-1 P MAY CONTAIN U.S. AND INTERNATIONAL EXPORT CONTROLLED INFORMATION 49
C References
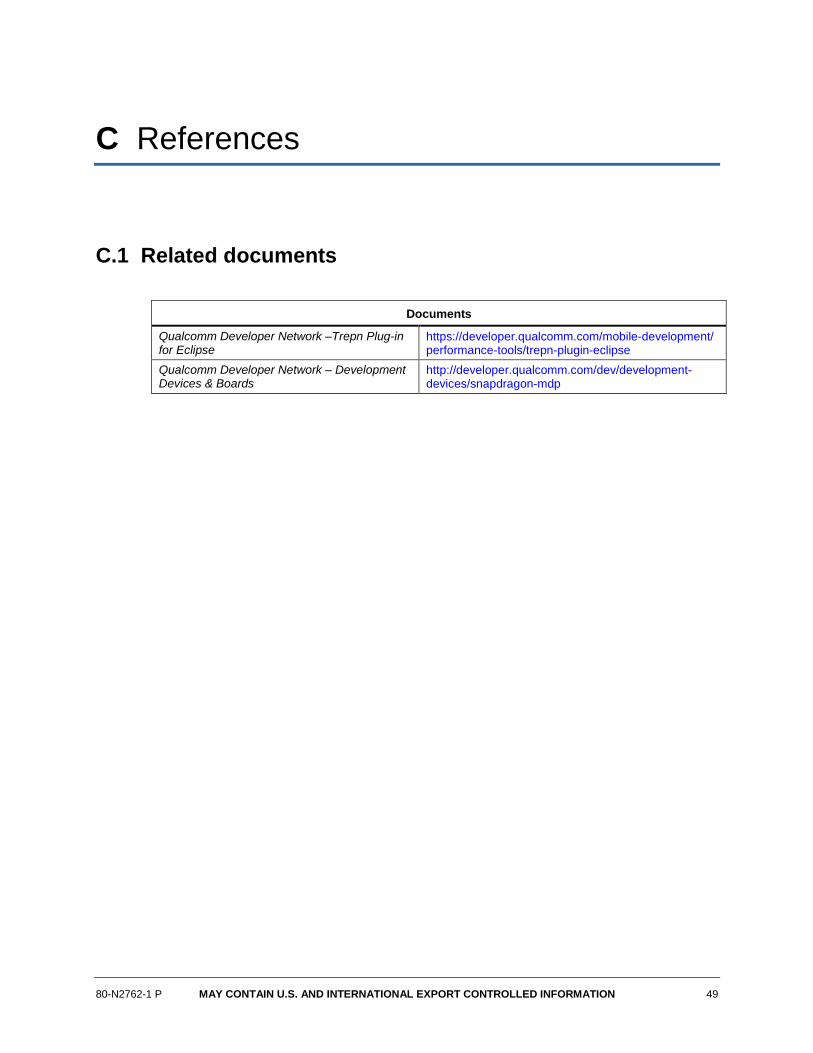
C.1 Related documents
Documents
Qualcomm Developer Network –Trepn Plug-in for Eclipse
https://developer.qualcomm.com/mobile-development/ performance-tools/trepn-plugin-eclipse
Qualcomm Developer Network – Development Devices & Boards
http://developer.qualcomm.com/dev/development-devices/snapdragon-mdp