Embed Size (px)
Citation preview

FEBRUARY 2012
Map Facts...Smelling Like Roses
Flash Forward...Future Industry and Occupation Employment Trends
Also Featuring...
Fast Facts...Leap Year
Entry Level PositionsEducation and Training Reclassification
Tr endsNEBRASKA WORKFORCE
College Placement...All State Colleges
Leap YearFast Facts
Economic Indicator
December 2011County Rates
Entry Level PositionsFeature Article
Smelling Like RosesMap Facts
Future Industry and Occupation Employment TrendsFlash Forward
All State CollegesCollege Placement
6
8
9
10
12
13
14
15
TABLE OF CONTENTS
Education and Training ReclassificationFeature Article 3
Openings and Expansions
16Industry Developments
FEBRUARY 2012
Map Facts...Smelling Like Roses
Flash Forward...Future Industry and Occupation Employment Trends
Also Featuring...
Fast Facts...Leap Year
Entry Level PositionsEducation and Training Reclassification
Tr endsNEBRASKA WORKFORCE
College Placement...All State Colleges

www.dol.nebraska.gov Nebraska Workforce Trends|February 2012
Feature Story
Lindsay Burford, Research Analyst
Most people do not walk into a business and say, “I would like to be your accountant.” Many occupations require a certain level of education and
training; therefore, people need to understand what kind of education and training will be expected of them before they start applying for their desired jobs. The Employment Projections program within the Bureau of Labor Statistics (BLS) develops and publishes occupational employment projections and related career information for hundreds of detailed occupations. Education and training classifications are included within this information.
However, BLS has spent the last few years replacing the education and training classification system as it has shown to be confusing. The old system combines several dimensions of education, training, and work experience into one classification system. For instance, if an occupation requires both postsecondary education and long term on-the-job training, one is overlooked and is categorized by which is deemed more necessary or significant (the education or training). Further, the old system did not include an option for occupations that did not require any postsecondary education.
Thus, in 2008, BLS proposed a new education and training classification system. The goal of the new system was to provide a more complete summary of how a worker enters and becomes competent within an occupation. Often times, education and training are required. A team of BLS economists began meeting to discuss possible alternatives to the existing categories. They issued a Federal Register
notice seeking feedback and comments on the new system. After receiving feedback and testing the new system in 2009, BLS made another announcement that it would continue to refine the system to better classify occupations by education and training categories. The Employment Projections program has finalized the updated system and has begun its release.
DifferencesThe old system assigned occupations to a single education or training category that describes the most significant source of education or training. However, the new system has three dimensions: entry level education, previous work experiences, and typical training. Further, the term “most significant source of education or training” from the old system has been replaced by clearly defining the categories as either needed to enter the occupation or to attain competency once an individual is employed in the occupation.
Developing the New SystemBLS economists used two sources of data to research and analyze information for about 750 occupations. First, the economists used the American Community Survey (a household survey produced by the Census Bureau) to look at workers’ educational attainment for people aged 18 to 29, ages 30 and older, and, finally, all workers in an occupation. Next, they examined the distribution of education levels of workers within the same occupation. The purpose of this examination was to control for the differences between educational attainment and educational requirements of the occupation; it allowed the economists to determine if there
BLS’s Education and Training
Reclassification
www.dol.nebraska.govNebraska Workforce Trends|February 2012
was more than one path into the occupation. Secondly, the BLS economists compared these results to surveys from O*Net (an online resource where workers and occupational experts are surveyed on education, work experience and training related to occupations).
Between these two research tools, the BLS economists began categorizing assignments to each occupation. As predicted, there were many occupations where there was more than one path to entry. In these instances, the economists assigned the education, experience, or training categories that best described the path that most workers need to enter or gain competency within that occupation.
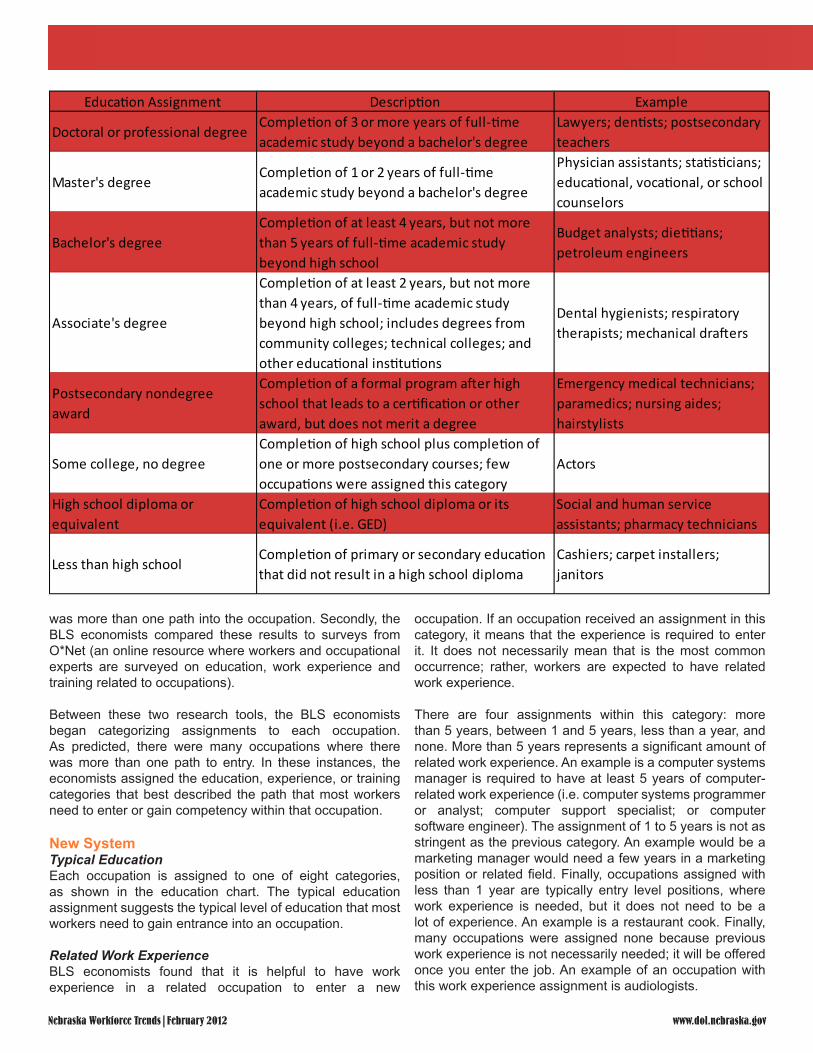
New SystemTypical EducationEach occupation is assigned to one of eight categories, as shown in the education chart. The typical education assignment suggests the typical level of education that most workers need to gain entrance into an occupation.
Related Work ExperienceBLS economists found that it is helpful to have work experience in a related occupation to enter a new
occupation. If an occupation received an assignment in this category, it means that the experience is required to enter it. It does not necessarily mean that is the most common occurrence; rather, workers are expected to have related work experience.
There are four assignments within this category: more than 5 years, between 1 and 5 years, less than a year, and none. More than 5 years represents a significant amount of related work experience. An example is a computer systems manager is required to have at least 5 years of computer-related work experience (i.e. computer systems programmer or analyst; computer support specialist; or computer software engineer). The assignment of 1 to 5 years is not as stringent as the previous category. An example would be a marketing manager would need a few years in a marketing position or related field. Finally, occupations assigned with less than 1 year are typically entry level positions, where work experience is needed, but it does not need to be a lot of experience. An example is a restaurant cook. Finally, many occupations were assigned none because previous work experience is not necessarily needed; it will be offered once you enter the job. An example of an occupation with this work experience assignment is audiologists.
Education Assignment Description Example
Doctoral or professional degreeCompletion of 3 or more years of full-time academic study beyond a bachelor's degree
Lawyers; dentists; postsecondary teachers
Master's degreeCompletion of 1 or 2 years of full-time academic study beyond a bachelor's degree
Physician assistants; statisticians; educational, vocational, or school counselors
Bachelor's degreeCompletion of at least 4 years, but not more than 5 years of full-time academic study beyond high school
Budget analysts; dietitians; petroleum engineers
Associate's degree
Completion of at least 2 years, but not more than 4 years, of full-time academic study beyond high school; includes degrees from community colleges; technical colleges; and other educational institutions
Dental hygienists; respiratory therapists; mechanical drafters
Postsecondary nondegree award
Completion of a formal program after high school that leads to a certification or other award, but does not merit a degree
Emergency medical technicians; paramedics; nursing aides; hairstylists
Some college, no degreeCompletion of high school plus completion of one or more postsecondary courses; few occupations were assigned this category
Actors
High school diploma or equivalent
Completion of high school diploma or its equivalent (i.e. GED)
Social and human service assistants; pharmacy technicians
Less than high schoolCompletion of primary or secondary education that did not result in a high school diploma
Cashiers; carpet installers; janitors
www.dol.nebraska.gov Nebraska Workforce Trends| February 2012
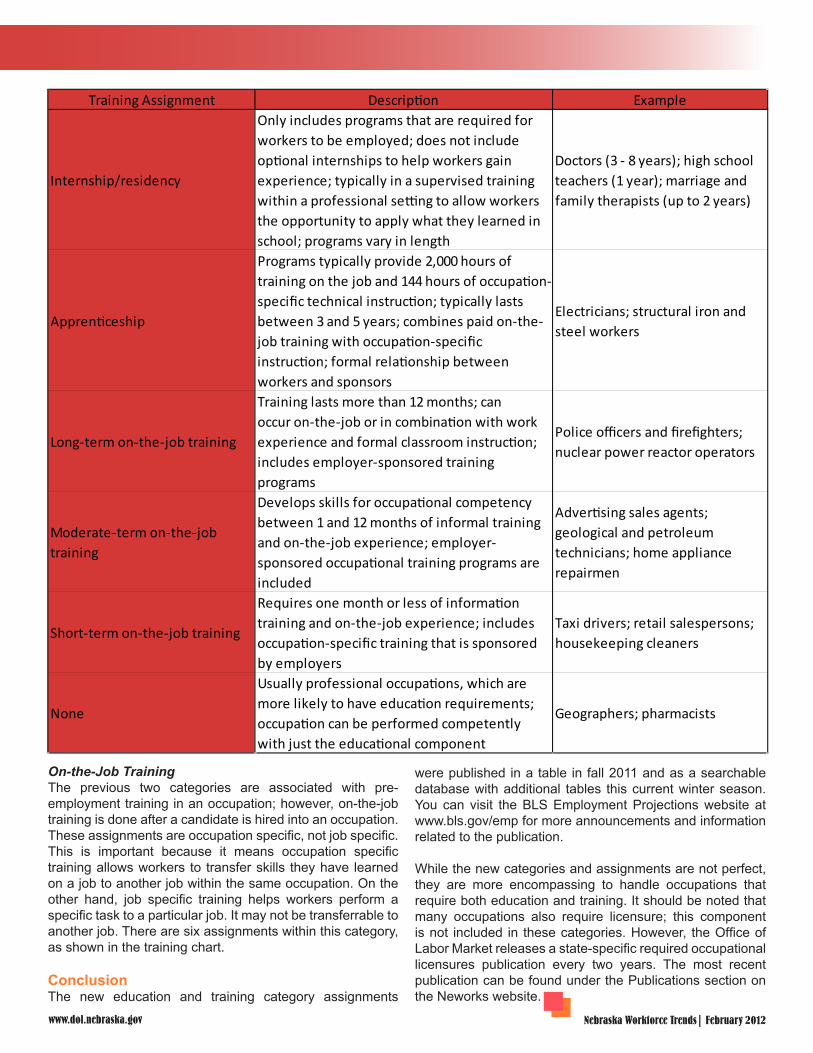
Training Assignment Description Example
Internship/residency
Only includes programs that are required for workers to be employed; does not include optional internships to help workers gain experience; typically in a supervised training within a professional setting to allow workers the opportunity to apply what they learned in school; programs vary in length
Doctors (3 - 8 years); high school teachers (1 year); marriage and family therapists (up to 2 years)
Apprenticeship
Programs typically provide 2,000 hours of training on the job and 144 hours of occupation-specific technical instruction; typically lasts between 3 and 5 years; combines paid on-the-job training with occupation-specific instruction; formal relationship between workers and sponsors
Electricians; structural iron and steel workers
Long-term on-the-job training
Training lasts more than 12 months; can occur on-the-job or in combination with work experience and formal classroom instruction; includes employer-sponsored training programs
Police officers and firefighters; nuclear power reactor operators
Moderate-term on-the-job training
Develops skills for occupational competency between 1 and 12 months of informal training and on-the-job experience; employer-sponsored occupational training programs are included
Advertising sales agents; geological and petroleum technicians; home appliance repairmen
Short-term on-the-job training
Requires one month or less of information training and on-the-job experience; includes occupation-specific training that is sponsored by employers
Taxi drivers; retail salespersons; housekeeping cleaners
None
Usually professional occupations, which are more likely to have education requirements; occupation can be performed competently with just the educational component
Geographers; pharmacists
On-the-Job TrainingThe previous two categories are associated with pre-employment training in an occupation; however, on-the-job training is done after a candidate is hired into an occupation. These assignments are occupation specific, not job specific. This is important because it means occupation specific training allows workers to transfer skills they have learned on a job to another job within the same occupation. On the other hand, job specific training helps workers perform a specific task to a particular job. It may not be transferrable to another job. There are six assignments within this category, as shown in the training chart.
ConclusionThe new education and training category assignments
were published in a table in fall 2011 and as a searchable database with additional tables this current winter season. You can visit the BLS Employment Projections website at www.bls.gov/emp for more announcements and information related to the publication.
While the new categories and assignments are not perfect, they are more encompassing to handle occupations that require both education and training. It should be noted that many occupations also require licensure; this component is not included in these categories. However, the Office of Labor Market releases a state-specific required occupational licensures publication every two years. The most recent publication can be found under the Publications section on the Neworks website.

www.dol.nebraska.govNebraska Workforce Trends|February 2012
Feature Story
Entry Level Positions Aaron Ziska, Research Analyst
www.dol.nebraska.gov Nebraska Workforce Trends| February 2012
Many individuals in the labor force are finding it harder and harder to land a job, let alone any semblance of a lifelong career. The competition is fierce, it is
coming from all over the world, and the pool of jobs to select from seems to be drying up more and more every day. Along with these factors, there are many impediments to achieving gainful employment; more and more requirements to be even considered for each job. This article examines possible experience and training requirements, specifically for entry-level positions.
Now, it seems like to be even remotely considered for a position, a person must have five to seven years of experience under their belt, along with something resembling a Master’s degree or higher. This is not the case, of course, but an exaggeration seemingly validated by the unemployed individual’s unfortunate circumstances. It can take hours to find even a handful of jobs that you fit the criteria for, and even longer to find ones that fit your current location and mobility status. It is not always the case that the requirements listed on a job post are written in stone; there can often be some room to maneuver around them if there are not any perfect applicants. So, it is in your best interest to at least apply for a position that you are interested in if your skills and experience are close to the position’s requirements (i.e. do not apply to be a brain surgeon with a high school diploma).
Not every position has these high requirements to be considered; in fact, there are lots of employment positions that require nothing more than on-the-job training. While they may not be the ultimate bread winning positions that a person is hoping for, they will at least help maintain the bottom line until the job hunter is either better suited to enter a higher paying position or finds something more suitable to their education level.
The following data is provided by the Nebraska Department of Labor’s Projections Unit which publishes new estimates once a year for short-term projections, both industry and occupational projections. The estimates are projected once every two years for long-term industry and occupational figures. Occupational projections are the source of the data that will be discussed in this article, but both industry and occupational projections are available on the Labor Market Information website, http://neworks.nebraska.gov/gsipub/index.asp?docid=433. Occupational projections include
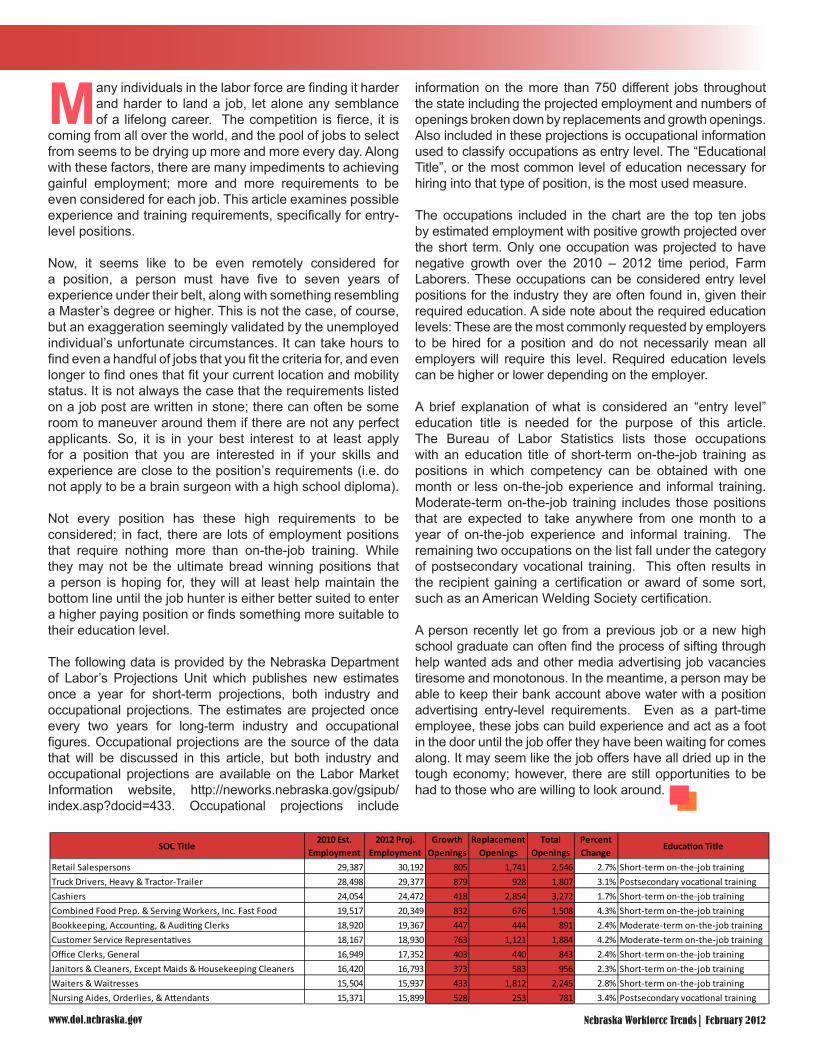
information on the more than 750 different jobs throughout the state including the projected employment and numbers of openings broken down by replacements and growth openings. Also included in these projections is occupational information used to classify occupations as entry level. The “Educational Title”, or the most common level of education necessary for hiring into that type of position, is the most used measure.
The occupations included in the chart are the top ten jobs by estimated employment with positive growth projected over the short term. Only one occupation was projected to have negative growth over the 2010 – 2012 time period, Farm Laborers. These occupations can be considered entry level positions for the industry they are often found in, given their required education. A side note about the required education levels: These are the most commonly requested by employers to be hired for a position and do not necessarily mean all employers will require this level. Required education levels can be higher or lower depending on the employer.
A brief explanation of what is considered an “entry level” education title is needed for the purpose of this article. The Bureau of Labor Statistics lists those occupations with an education title of short-term on-the-job training as positions in which competency can be obtained with one month or less on-the-job experience and informal training. Moderate-term on-the-job training includes those positions that are expected to take anywhere from one month to a year of on-the-job experience and informal training. The remaining two occupations on the list fall under the category of postsecondary vocational training. This often results in the recipient gaining a certification or award of some sort, such as an American Welding Society certification.
A person recently let go from a previous job or a new high school graduate can often find the process of sifting through help wanted ads and other media advertising job vacancies tiresome and monotonous. In the meantime, a person may be able to keep their bank account above water with a position advertising entry-level requirements. Even as a part-time employee, these jobs can build experience and act as a foot in the door until the job offer they have been waiting for comes along. It may seem like the job offers have all dried up in the tough economy; however, there are still opportunities to be had to those who are willing to look around.
SOC Title2010 Est.
Employment2012 Proj.
EmploymentGrowth
OpeningsReplacement
OpeningsTotal
Openings Percent Change
Education Title
Retail Salespersons 29,387 30,192 805 1,741 2,546 2.7% Short-term on-the-job trainingTruck Drivers, Heavy & Tractor-Trailer 28,498 29,377 879 928 1,807 3.1% Postsecondary vocational trainingCashiers 24,054 24,472 418 2,854 3,272 1.7% Short-term on-the-job trainingCombined Food Prep. & Serving Workers, Inc. Fast Food 19,517 20,349 832 676 1,508 4.3% Short-term on-the-job trainingBookkeeping, Accounting, & Auditing Clerks 18,920 19,367 447 444 891 2.4% Moderate-term on-the-job trainingCustomer Service Representatives 18,167 18,930 763 1,121 1,884 4.2% Moderate-term on-the-job trainingOffice Clerks, General 16,949 17,352 403 440 843 2.4% Short-term on-the-job trainingJanitors & Cleaners, Except Maids & Housekeeping Cleaners 16,420 16,793 373 583 956 2.3% Short-term on-the-job trainingWaiters & Waitresses 15,504 15,937 433 1,812 2,245 2.8% Short-term on-the-job trainingNursing Aides, Orderlies, & Attendants 15,371 15,899 528 253 781 3.4% Postsecondary vocational training
www.dol.nebraska.govNebraska Workforce Trends|February 2012
locations and an average of 80 employees. Statewide, there were 613 floral employees on average spread across 64 of Nebraska’s 93 counties.
One of the primary jobs at a florist is floral design. Floral Designers earned an average of $11.72 an hour during the second quarter of 2011. The average entry wage was $8.67 an hour and the average experienced wage was $13.25 an hour. Many florists also employ delivery drivers to get flowers to their intended destinations. Delivery drivers in the industry earned an average of $10.53 an hour.
Map Facts
Florist Locations in Nebraska
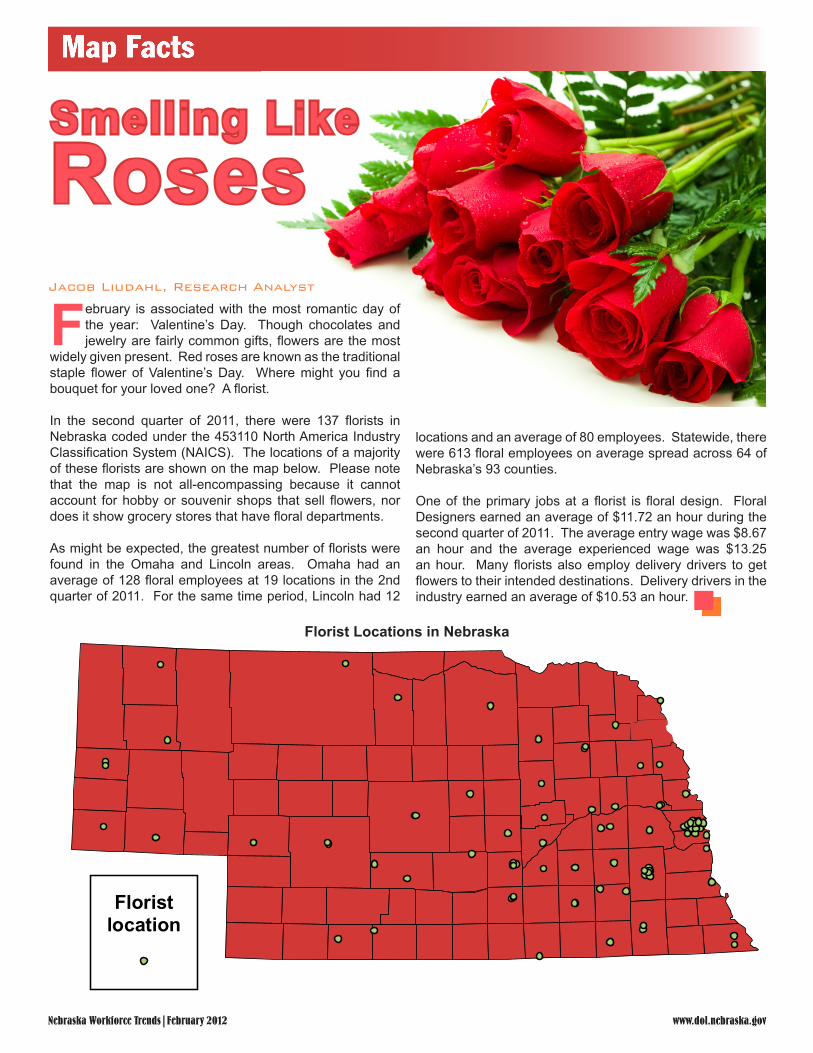
Jacob Liudahl, Research Analyst
February is associated with the most romantic day of the year: Valentine’s Day. Though chocolates and jewelry are fairly common gifts, flowers are the most
widely given present. Red roses are known as the traditional staple flower of Valentine’s Day. Where might you find a bouquet for your loved one? A florist.
In the second quarter of 2011, there were 137 florists in Nebraska coded under the 453110 North America Industry Classification System (NAICS). The locations of a majority of these florists are shown on the map below. Please note that the map is not all-encompassing because it cannot account for hobby or souvenir shops that sell flowers, nor does it show grocery stores that have floral departments.
As might be expected, the greatest number of florists were found in the Omaha and Lincoln areas. Omaha had an average of 128 floral employees at 19 locations in the 2nd quarter of 2011. For the same time period, Lincoln had 12
Smelling Like Roses
Floristlocation

www.dol.nebraska.gov Nebraska Workforce Trends|February 2012
Fast Facts
Jodie Meyer, Research Analyst
Leap Day is February 29th and makes 2012 a Leap Year with 366 days. Even with the extra day this year, February is still the shortest month.
Leap years are added to the calendar to help keep the calendar from getting “off” because the earth actually takes 365.242 days to orbit the sun. Adding the extra day every four years help to accommodate for the quarter of a day and keeps our holidays and seasons the same time of year every year.
Leap Years occur every four years in the Gregorian calendar, the current standard calendar in the United States and most of the world. The only exception is century years that are not divisible by 400. This is an additional measure to help keep the calendar on track.
In the British Isles it is tradition that women may propose marriage only in leap years.
Presidential elections in the United States and the summer Olympics occur every four years, generally in leap years.
People born on February 29th may be called a “leapling” or a “leaper” and in non-leap years often celebrate their birthday on February 28th or March 1st.
Famous Leap year birthdays include Actors Alex Rocco, Dennis Farina, Antonio Sabato Jr., and rapper Ja Rule.
In Nebraska, people born on February 29th have that date listed as their legal birthday on their birth certificate. However, according to the Nebraska Secretary of State’s Office, there is no regulation pertaining to when the birthday is celebrated on non-leap years. For milestone birthdays, such as turning 18 or 21, the birthday generally would be after the occurrence of February 29th which would mean on March 1st.
Leap Day falls during the work week for most people this year, but this does not actually mean an extra day of work in 2012. The number of weekdays in a year varies between 260 and 261 based on what day of the week a year starts on.
Leap
Source: National Geographic; Nebraska Health and Human Services; Nebraska Secretary of State; Encyclopedia Britannica
Year2012
www.dol.nebraska.govNebraska Workforce Trends|February 2012
Flash Forward
Jodie Meyer, Research Analyst
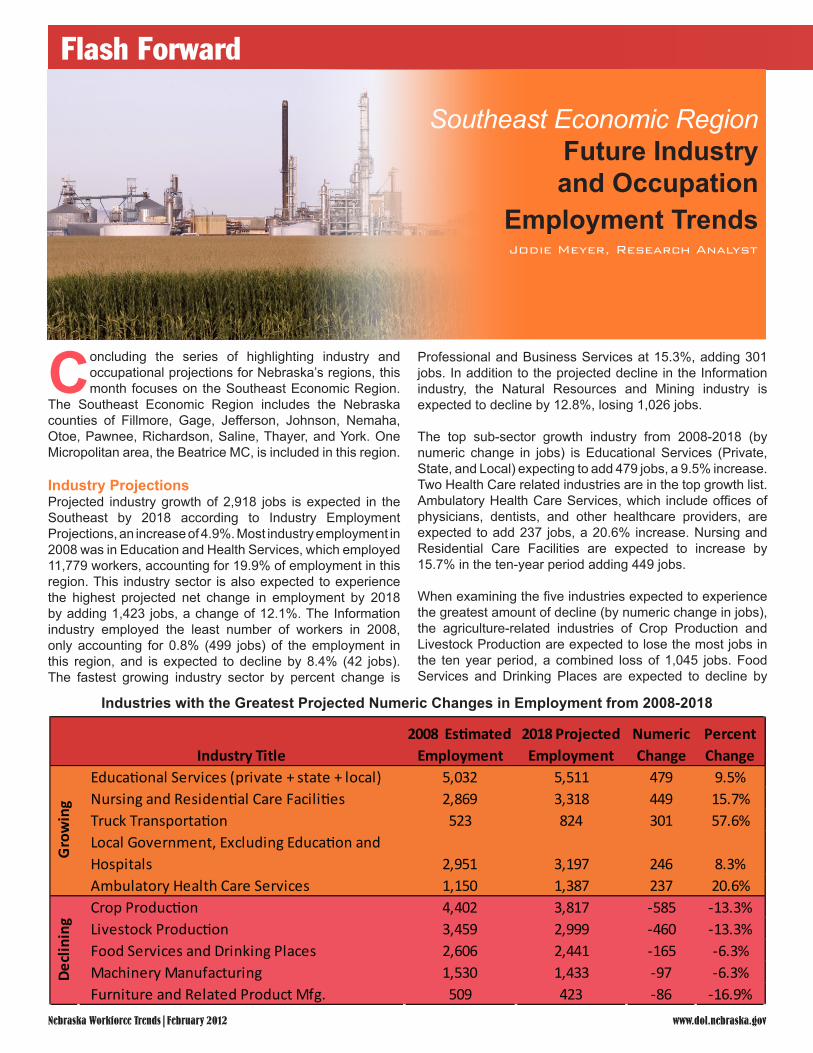
Concluding the series of highlighting industry and occupational projections for Nebraska’s regions, this month focuses on the Southeast Economic Region.
The Southeast Economic Region includes the Nebraska counties of Fillmore, Gage, Jefferson, Johnson, Nemaha, Otoe, Pawnee, Richardson, Saline, Thayer, and York. One Micropolitan area, the Beatrice MC, is included in this region.
Industry ProjectionsProjected industry growth of 2,918 jobs is expected in the Southeast by 2018 according to Industry Employment Projections, an increase of 4.9%. Most industry employment in 2008 was in Education and Health Services, which employed 11,779 workers, accounting for 19.9% of employment in this region. This industry sector is also expected to experience the highest projected net change in employment by 2018 by adding 1,423 jobs, a change of 12.1%. The Information industry employed the least number of workers in 2008, only accounting for 0.8% (499 jobs) of the employment in this region, and is expected to decline by 8.4% (42 jobs). The fastest growing industry sector by percent change is
Professional and Business Services at 15.3%, adding 301 jobs. In addition to the projected decline in the Information industry, the Natural Resources and Mining industry is expected to decline by 12.8%, losing 1,026 jobs.
The top sub-sector growth industry from 2008-2018 (by numeric change in jobs) is Educational Services (Private, State, and Local) expecting to add 479 jobs, a 9.5% increase. Two Health Care related industries are in the top growth list. Ambulatory Health Care Services, which include offices of physicians, dentists, and other healthcare providers, are expected to add 237 jobs, a 20.6% increase. Nursing and Residential Care Facilities are expected to increase by 15.7% in the ten-year period adding 449 jobs.
When examining the five industries expected to experience the greatest amount of decline (by numeric change in jobs), the agriculture-related industries of Crop Production and Livestock Production are expected to lose the most jobs in the ten year period, a combined loss of 1,045 jobs. Food Services and Drinking Places are expected to decline by
Industry Title2008 Estimated
Employment2018 Projected Employment
Numeric Change
Percent Change
Educational Services (private + state + local) 5,032 5,511 479 9.5%Nursing and Residential Care Facilities 2,869 3,318 449 15.7%Truck Transportation 523 824 301 57.6%Local Government, Excluding Education and Hospitals 2,951 3,197 246 8.3%Ambulatory Health Care Services 1,150 1,387 237 20.6%Crop Production 4,402 3,817 -585 -13.3%Livestock Production 3,459 2,999 -460 -13.3%Food Services and Drinking Places 2,606 2,441 -165 -6.3%Machinery Manufacturing 1,530 1,433 -97 -6.3%Furniture and Related Product Mfg. 509 423 -86 -16.9%
Gro
win
gDe
clin
ing
Industries with the Greatest Projected Numeric Changes in Employment from 2008-2018
Southeast Economic RegionFuture Industry and Occupation
Employment Trends
www.dol.nebraska.gov Nebraska Workforce Trends| February 2012
165 jobs, a 6.3% decline. Rounding out the bottom five are Machinery Manufacturing and Furniture and Related Product Manufacturing.
Occupational ProjectionsIndustry employment is an important component of the employment picture in a region. It is also important to examine the types of occupations that will experience growth and decline as a result of changes in industry employment throughout the state.
There is expected to be overall occupational growth in the Southeast according to the 2008-2018 Occupational Projections. The total projected numeric employment change over the ten-year period is 2,918 jobs, a 4.9% increase. A total of 18,128 job openings are expected in the Southeast from 2008-2018, with 4,331 jobs expected from growth and 13,797 from replacements. Replacement openings account for 76.1% of all job openings. This mirrors the statewide trend and can in part be attributed to the high number of Nebraska workers reaching retirement age within the next 10 years.
In 2008, Production occupations employed 8,407 workers, making it the largest occupational category in the Southeast and accounting for 14.2% of the region’s occupational employment. Production occupations are also expected to experience the largest net change in employment with 689 jobs projected to be added by 2018, an increase of 8.2%. Healthcare Support occupations are the fastest growing occupational category by percent change, adding 365 jobs, a 15.5% increase. Legal occupations employed the least amount of workers in 2008, only employing 119 or 0.2% of the region’s occupational employment. This occupational category is expected to stay small with only 16 jobs expected to be added in the ten-year period. Farming, Fishing and Forestry occupations is the occupational category expecting the largest decline at 709 jobs, a decrease of 13.1%.
The highest number of total job openings is expected in Production occupations with 2,846 total openings- 858
from job growth and 1,988 from replacements. The lowest number of openings is projected for Legal occupations, with only 34 openings expected- 16 from growth and 18 from replacements.
Production occupations are also projected to have the most replacement openings with 1,988, or 69.9%, of the 2,846 total job openings expected to come from replacements. Farming, Fishing, and Forestry occupations are projected to have only two growth openings, the least of any category, with 1,448, or 99.9%, of its total openings expected to be from replacements. The largest percentage of total openings attributed to growth is projected in Healthcare Support occupations where 59.6% (367) of the 616 total openings projected are to be from growth.
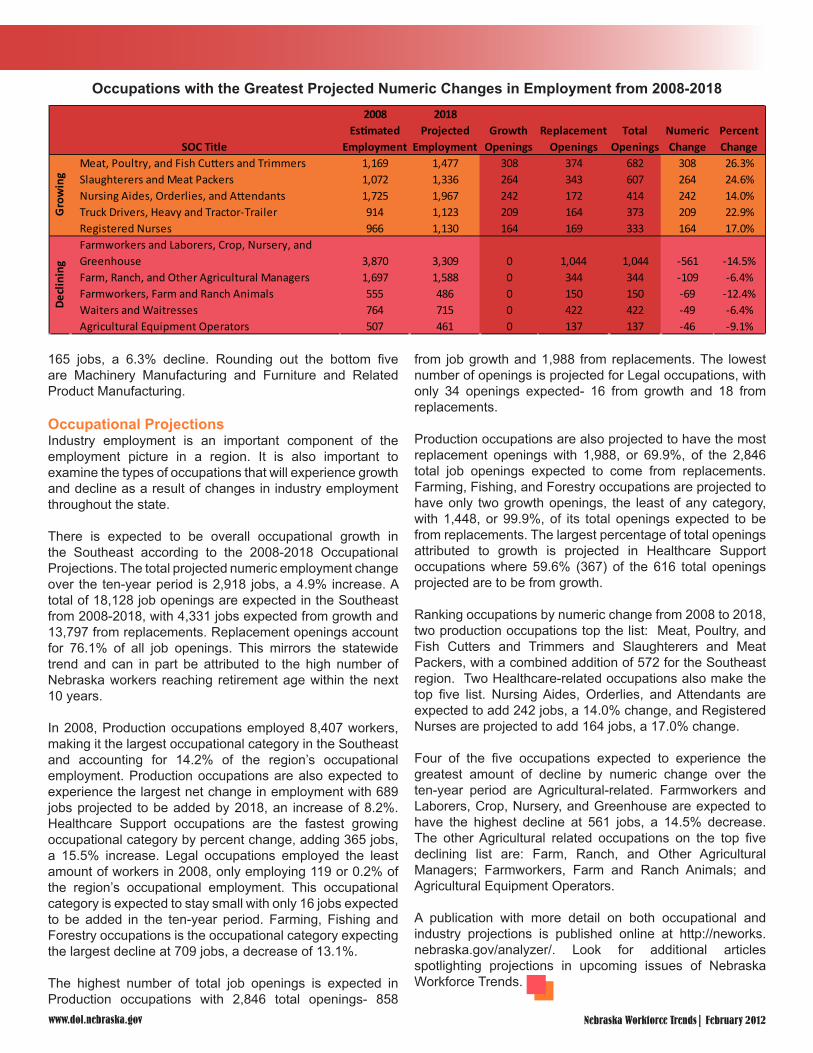
Ranking occupations by numeric change from 2008 to 2018, two production occupations top the list: Meat, Poultry, and Fish Cutters and Trimmers and Slaughterers and Meat Packers, with a combined addition of 572 for the Southeast region. Two Healthcare-related occupations also make the top five list. Nursing Aides, Orderlies, and Attendants are expected to add 242 jobs, a 14.0% change, and Registered Nurses are projected to add 164 jobs, a 17.0% change.
Four of the five occupations expected to experience the greatest amount of decline by numeric change over the ten-year period are Agricultural-related. Farmworkers and Laborers, Crop, Nursery, and Greenhouse are expected to have the highest decline at 561 jobs, a 14.5% decrease. The other Agricultural related occupations on the top five declining list are: Farm, Ranch, and Other Agricultural Managers; Farmworkers, Farm and Ranch Animals; and Agricultural Equipment Operators.
A publication with more detail on both occupational and industry projections is published online at http://neworks.nebraska.gov/analyzer/. Look for additional articles spotlighting projections in upcoming issues of Nebraska Workforce Trends.
SOC Title
2008 Estimated
Employment
2018 Projected
EmploymentGrowth
OpeningsReplacement
OpeningsTotal
OpeningsNumeric Change
Percent Change
Meat, Poultry, and Fish Cutters and Trimmers 1,169 1,477 308 374 682 308 26.3%Slaughterers and Meat Packers 1,072 1,336 264 343 607 264 24.6%Nursing Aides, Orderlies, and Attendants 1,725 1,967 242 172 414 242 14.0%Truck Drivers, Heavy and Tractor-Trailer 914 1,123 209 164 373 209 22.9%Registered Nurses 966 1,130 164 169 333 164 17.0%Farmworkers and Laborers, Crop, Nursery, and Greenhouse 3,870 3,309 0 1,044 1,044 -561 -14.5%Farm, Ranch, and Other Agricultural Managers 1,697 1,588 0 344 344 -109 -6.4%Farmworkers, Farm and Ranch Animals 555 486 0 150 150 -69 -12.4%Waiters and Waitresses 764 715 0 422 422 -49 -6.4%Agricultural Equipment Operators 507 461 0 137 137 -46 -9.1%
Gro
win
gDe
clin
ing
Occupations with the Greatest Projected Numeric Changes in Employment from 2008-2018
www.dol.nebraska.govNebraska Workforce Trends|February 2012
Economic Indicators
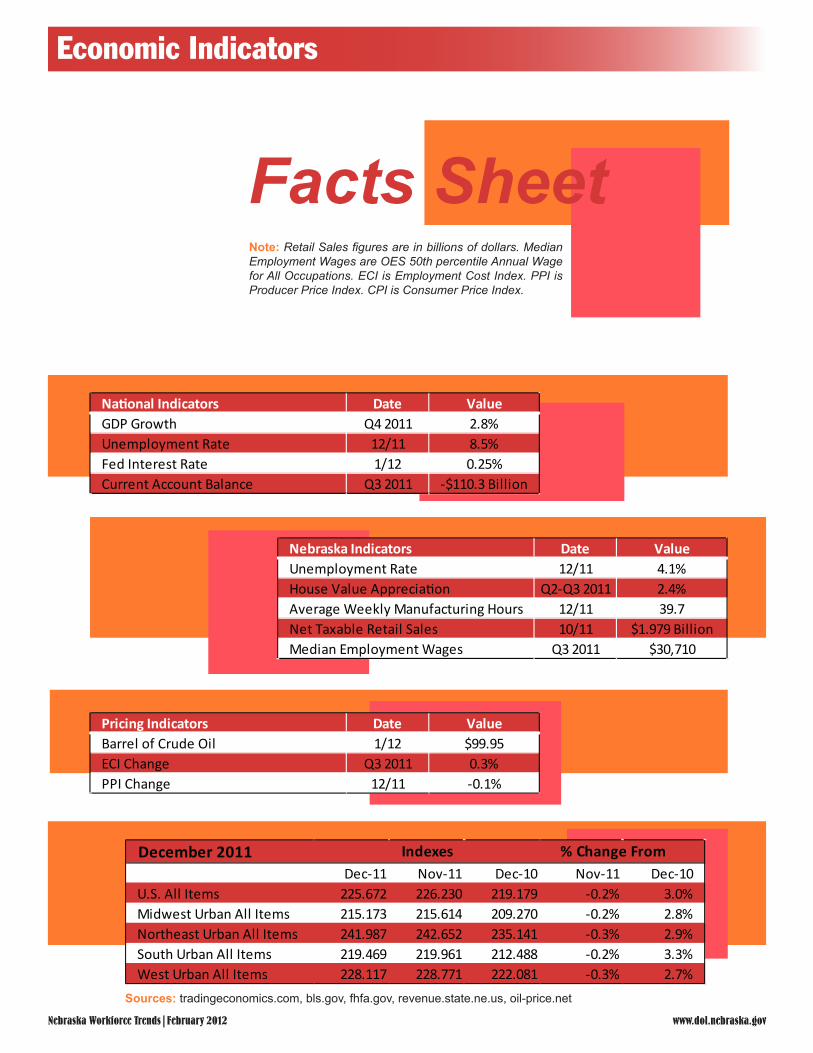
Note: Retail Sales figures are in billions of dollars. Median Employment Wages are OES 50th percentile Annual Wage for All Occupations. ECI is Employment Cost Index. PPI is Producer Price Index. CPI is Consumer Price Index.
National Indicators Date ValueGDP Growth Q4 2011 2.8%Unemployment Rate 12/11 8.5%Fed Interest Rate 1/12 0.25%Current Account Balance Q3 2011 -$110.3 Billion
Nebraska Indicators Date ValueUnemployment Rate 12/11 4.1%House Value Appreciation Q2-Q3 2011 2.4%Average Weekly Manufacturing Hours 12/11 39.7Net Taxable Retail Sales 10/11 $1.979 BillionMedian Employment Wages Q3 2011 $30,710
Pricing Indicators Date ValueBarrel of Crude Oil 1/12 $99.95ECI Change Q3 2011 0.3%PPI Change 12/11 -0.1%
December 2011Dec-11 Nov-11 Dec-10 Nov-11 Dec-10
U.S. All Items 225.672 226.230 219.179 -0.2% 3.0%Midwest Urban All Items 215.173 215.614 209.270 -0.2% 2.8%Northeast Urban All Items 241.987 242.652 235.141 -0.3% 2.9%South Urban All Items 219.469 219.961 212.488 -0.2% 3.3%West Urban All Items 228.117 228.771 222.081 -0.3% 2.7%
Indexes % Change From
Facts Sheet
Sources: tradingeconomics.com, bls.gov, fhfa.gov, revenue.state.ne.us, oil-price.net
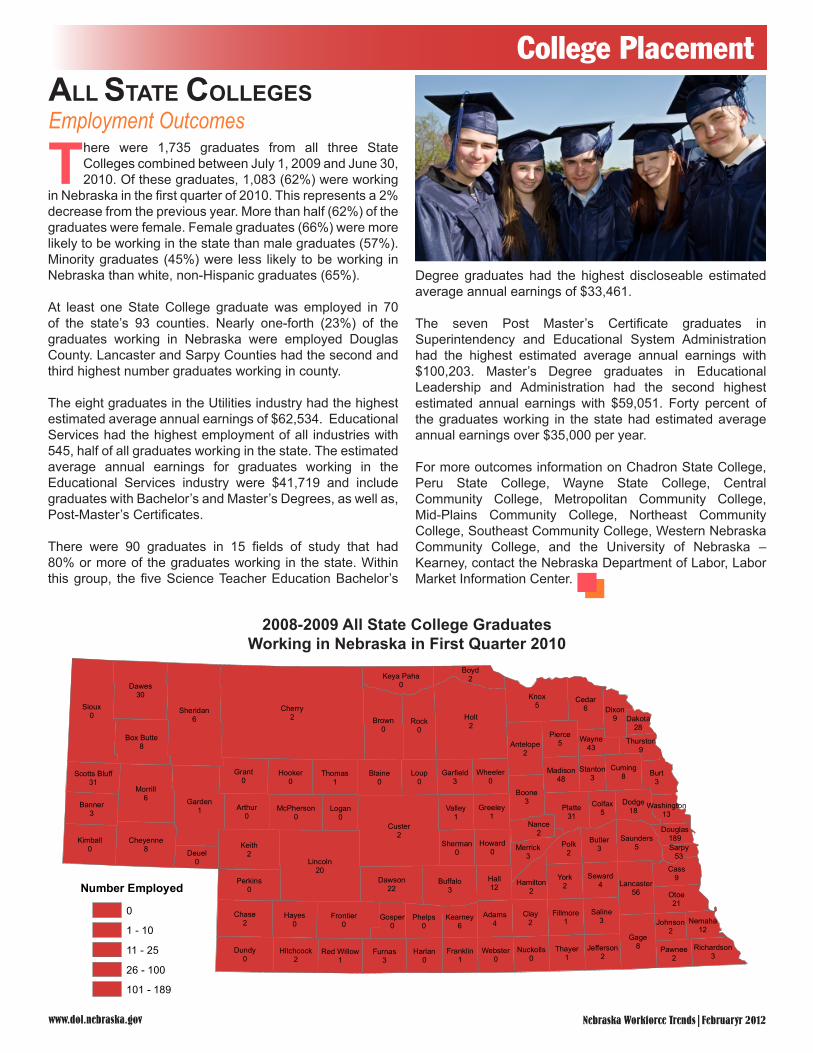
Degree graduates had the highest discloseable estimated average annual earnings of $33,461.
The seven Post Master’s Certificate graduates in Superintendency and Educational System Administration had the highest estimated average annual earnings with $100,203. Master’s Degree graduates in Educational Leadership and Administration had the second highest estimated annual earnings with $59,051. Forty percent of the graduates working in the state had estimated average annual earnings over $35,000 per year.
For more outcomes information on Chadron State College, Peru State College, Wayne State College, Central Community College, Metropolitan Community College, Mid-Plains Community College, Northeast Community College, Southeast Community College, Western Nebraska Community College, and the University of Nebraska – Kearney, contact the Nebraska Department of Labor, Labor Market Information Center.
www.dol.nebraska.gov Nebraska Workforce Trends|Februaryr 2012
2008-2009 All State College GraduatesWorking in Nebraska in First Quarter 2010
ALL STATE COLLEGESEmployment Outcomes
College Placement
There were 1,735 graduates from all three State Colleges combined between July 1, 2009 and June 30, 2010. Of these graduates, 1,083 (62%) were working
in Nebraska in the first quarter of 2010. This represents a 2% decrease from the previous year. More than half (62%) of the graduates were female. Female graduates (66%) were more likely to be working in the state than male graduates (57%). Minority graduates (45%) were less likely to be working in Nebraska than white, non-Hispanic graduates (65%).
At least one State College graduate was employed in 70 of the state’s 93 counties. Nearly one-forth (23%) of the graduates working in Nebraska were employed Douglas County. Lancaster and Sarpy Counties had the second and third highest number graduates working in county.
The eight graduates in the Utilities industry had the highest estimated average annual earnings of $62,534. Educational Services had the highest employment of all industries with 545, half of all graduates working in the state. The estimated average annual earnings for graduates working in the Educational Services industry were $41,719 and include graduates with Bachelor’s and Master’s Degrees, as well as, Post-Master’s Certificates.
There were 90 graduates in 15 fields of study that had 80% or more of the graduates working in the state. Within this group, the five Science Teacher Education Bachelor’s
Cherry2 Holt
2
Custer2
Sioux0
Lincoln20
Sheridan6
Morrill6 Garden
1
Knox5
Keith2
Dawes30
Rock0
Brown0
Gage8
Hall12
Dundy0
Chase2
Buffalo3
Grant0
Clay2
Kimball0
York2
Frontier0
Otoe21
Dawson22
Cedar6
Platte31
Arthur0
Burt3
Perkins0
Cheyenne8
Hayes0
Blaine0
Loup0
Box Butte8
Cass9
Boone3Banner
3
Polk2
Butler3
Furnas3
Hooker0
Antelope2
Saline3
Valley1
Pierce5
Logan0
Thomas1
Lancaster56
Dixon9
Harlan0
Adams4
Thayer1
Dodge18
Phelps0
Saunders5
McPherson0
Deuel0
Howard0
Cuming8
Seward4
Greeley1
Fillmore1
Hitchcock2
Garfield3
Franklin1
Keya Paha0
Webster0
Nance2
Madison48
Wheeler0
Nuckolls0
Colfax5
Gosper0
Scotts Bluff31
Jefferson2
Wayne43
Sherman0
Red Willow1
Kearney6
Hamilton2
Pawnee2
Richardson3
Johnson2
Douglas189
Boyd2
Merrick3
Stanton3
Nemaha12
Thurston9
Sarpy53
Dakota28
Washington13
Number Employed
0
1 - 10
11 - 25
26 - 100
101 - 189
www.dol.nebraska.govNebraska Workforce Trends|February 2012
County Rates
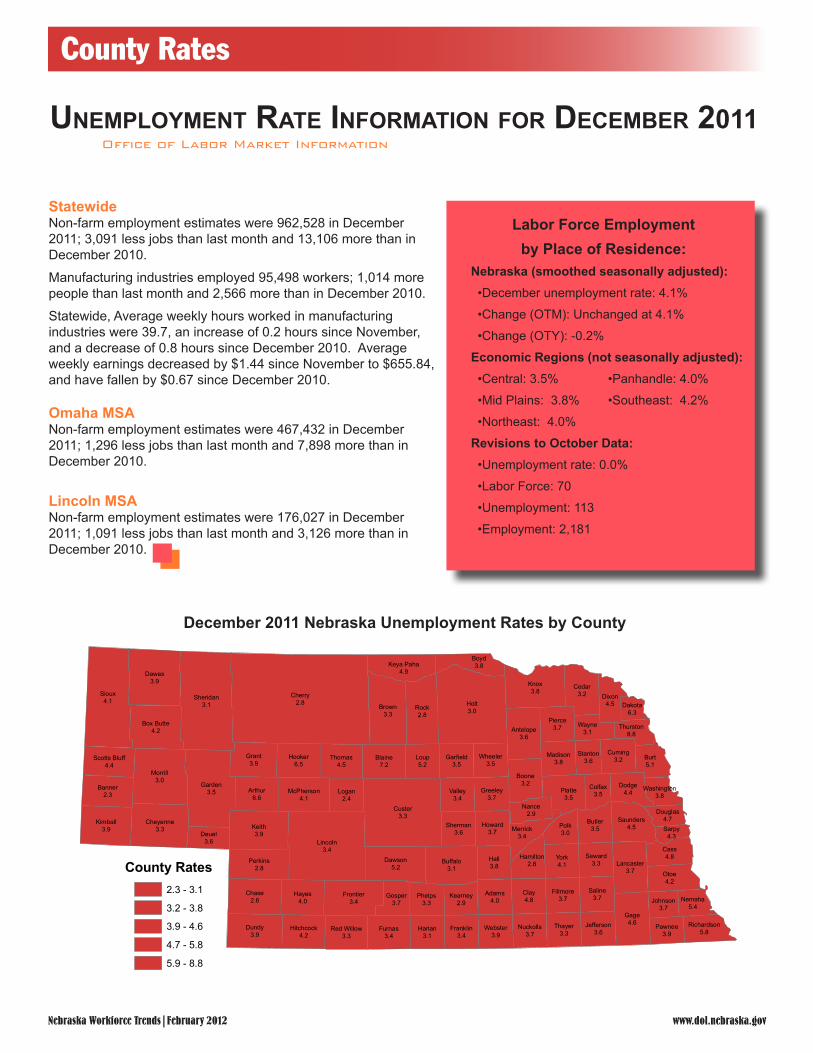
Statewide Non-farm employment estimates were 962,528 in December 2011; 3,091 less jobs than last month and 13,106 more than in December 2010.
Manufacturing industries employed 95,498 workers; 1,014 more people than last month and 2,566 more than in December 2010.
Statewide, Average weekly hours worked in manufacturing industries were 39.7, an increase of 0.2 hours since November, and a decrease of 0.8 hours since December 2010. Average weekly earnings decreased by $1.44 since November to $655.84, and have fallen by $0.67 since December 2010. Omaha MSA Non-farm employment estimates were 467,432 in December 2011; 1,296 less jobs than last month and 7,898 more than in December 2010.
Lincoln MSA Non-farm employment estimates were 176,027 in December 2011; 1,091 less jobs than last month and 3,126 more than in December 2010.
December 2011 Nebraska Unemployment Rates by County
Office of Labor Market Information
Unemployment Rate InfoRmatIon foR DecembeR 2011
Labor Force Employment by Place of Residence:
Nebraska (smoothed seasonally adjusted): •December unemployment rate: 4.1%
•Change (OTM): Unchanged at 4.1%
•Change (OTY): -0.2%
Economic Regions (not seasonally adjusted):•Central: 3.5% •Panhandle: 4.0%
•Mid Plains: 3.8% •Southeast: 4.2%
•Northeast: 4.0%
Revisions to October Data:•Unemployment rate: 0.0%
•Labor Force: 70
•Unemployment: 113
•Employment: 2,181
Cherry2.8 Holt
3.0
Custer3.3
Sioux4.1
Lincoln3.4
Sheridan3.1
Morrill3.0
Garden3.5
Knox3.8
Keith3.9
Dawes3.9
Rock2.8
Brown3.3
Gage4.6
Hall3.8
Dundy3.9
Chase2.6
Buffalo3.1
Grant3.9
Clay4.8
Kimball3.9
York4.1
Frontier3.4
Otoe4.2
Dawson5.2
Cedar3.2
Platte3.5
Arthur6.6
Burt5.1
Perkins2.8
Cheyenne3.3
Hayes4.0
Blaine7.2
Loup5.2
Box Butte4.2
Cass4.8
Boyd3.8
Boone3.2Banner
2.3
Polk3.0
Butler3.5
Furnas3.4
Hooker6.5
Antelope3.6
Saline3.7
Valley3.4
Pierce3.7
Logan2.4
Thomas4.5
Lancaster3.7
Dixon4.5
Harlan3.1
Adams4.0
Thayer3.3
Dodge4.4
Phelps3.3
Saunders4.5
McPherson4.1
Deuel3.6
Howard3.7
Cuming3.2
Seward3.3
Greeley3.7
Fillmore3.7
Hitchcock4.2
Garfield3.5
Franklin3.4
Keya Paha4.9
Webster3.9
Nance2.9
Madison3.8
Wheeler3.5
Nuckolls3.7
Merrick3.4
Colfax3.5
Gosper3.7
Scotts Bluff4.4
Jefferson3.6
Wayne3.1
Sherman3.6
Red Willow3.3
Kearney2.9
Hamilton2.8
Stanton3.6
Pawnee3.9
Richardson5.8
Nemaha5.4
Johnson3.7
Thurston8.8
Douglas4.7
Dakota6.3
Sarpy4.3
Washington3.8
December 2011 County Rates
County Rates2.3 - 3.1
3.2 - 3.8
3.9 - 4.6
4.7 - 5.8
5.9 - 8.8

www.dol.nebraska.gov Nebraska Workforce Trends|February 2012
Note: The following information is obtained through a monthly survey of Nebraska’s Career Centers. Openings and expansions that were not publicly reported or reported to Career Center Managers in confidence are not listed. If you own or know of a business which is opening or expanding, please email [email protected] with you information.
Lincoln•Granite Transformations, a new business to Lincoln with their main store in Omaha, opened at 4400 S 70th St with 2 employees.•The Myotherapy Institute, a massage therapy training center, opened at 70th and Pioneers. •Business openings or expansions in Lincoln reported by the Lincoln Chamber of Commerce include: Viergutz International - consumer services, marketing and advertising firmMarkay Performing Arts - voice and theater lessons, performing, etc., 2723 N. 48th StreetAR Solutions - collection agency specializing in medical collections
Omaha•The following businesses reportedly opened or expanded their operations:Emerging Terrain - non-profit that transforms urban space, 1717 Vinton, 4 employeesConsolidated Concrete Plant - satellite cement batch plant, 13th and Capehart Rd Woodhouse Nissan - Kennedy Freeway and Chandler RD in Bellevue, relocated to new site.Harrison Heights Senior Village - low-income housing, 7544 GertrudeAccucut & AccuQuilt - makes craft supplies, relocating to Sarpy Co from Fremont, 40 employeesScooters – coffeehouse, 120 & Fort, 15 employeesPerformance Chrysler - new in Bellevue, 50 employeesFuddruckers - 156th and Maple, 20 employeesJimmy Johns – Blair, 10 employeesWalmart - Hiway 30 East in Blair, 100 employeesRana 88 - new restaurant, Midtown CrossingNT Nails - new nail salon, Mid Town Crossing, 5 employeesLockton-Nebraska Co - insurance company, 202 N 129th, 5 employeesPearl Optical - eye care and eye wear, Twin Creek in Bellevue, 6 employeesLonghorn Steakhouse - 3040 S 143rd Plz, 85 employeesSalvation Army - new administrative offices at 108th and Burke Ave. Parliament Pub - new location at 1212 HarneyFamily Fun Center XL - relocating to 10765 M StAmerican Title - adding 25 workersShucks Fish House - 20th & Leavenworth – added another
Openings and Expansions Jacob Liudahl, Research Analyst
Openings & Expansions
locationBland & Assoc. - moved to new location- 450 Regency Prkwy, added 30 employeesWoodhouse Auto Group - bought Ford dealership in PlattsmouthMutual of Omaha Financial Services - adding 35 employees First National Bank - adding 100 employees
NortheastNorfolk•The following businesses opened in the Norfolk area:Kookaburras Kloset - new and slightly used kids clothes, 2 employeesHealing Hearts and Minds Therapy Services - licensed therapist, 3 employeesSelectel Wireless - cell phones and pay-as-you-go contracts, 3 employees Simply Divine Dessert Shoppe - dessert boutique, 2 employeesLittle Caesars - hot and ready pizzas, 20 employees Eclipse Hair and Beauty - beauty salon, 2 employees Creative Revolution Marketing Agency - full service marketing and advertising agency, 2 employees
Fremont•Natura Pet Products is beginning the second phase of their $10 million, 40,000-square-foot expansion, expected to add 20-25 new jobs to the plant which currently employs 150 workers.
Panhandle RegionScottsbluff•Miss Lucy’s House of Glamour, a beauty business, opened in Sidney with 2 employees.
www.dol.nebraska.govNebraska Workforce Trends|February 2012
Industry Developments
TOTAL NONFARMJanet Oenbring, Research Analyst
Nationally, over-the-month non-seasonally adjusted employment showed little movement (-0.2% or -219,000 jobs), a normal occurrence in December. Only one major industry rose, two fell, and seven were stable. Over-the-year non-seasonally adjusted employment gained 1,671,000 jobs (1.3%). Since December 2010, it has trended up between 0.7% and 1.3% each month.
Since last month, Nebraska Total Nonfarm employment was essentially unchanged at 962,528 jobs, typical for December. Three major industries increased, four decreased, and three were level. Over the year, Total Nonfarm employment expanded by 13,106 (1.4%). Since March 2011, the yearly growth has been higher than any month in the past five years. Since January 2011, over-the-year employment has
regularly improved the most in Professional and Business Services and Trade, Transportation, and Utilities. Since last December, those industries added 6,299 jobs and 3,035 jobs, respectively. Together, they have made up 61% to 83% of the annual growth each month of 2011.
The Lincoln MSA employment peaked in October 2011 at 177,849 jobs, but has dropped by 1,822 jobs over the past two months. The majority of the losses were from Professional and Business Services cutting 1,529 jobs during this time. Since December 2010, Lincoln MSA employment has advanced by 3,126 jobs (1.8%) with the majority of additions (86%) coming from Professional and Business Services (1,534 jobs) and Trade, Transportation, and Utilities (1,161 jobs). In the Omaha MSA, over-the-month employment showed little movement at 467,432. Since last year, there has been an increase of 1.7% (7,898 jobs). The majority of the yearly gains came from three industries - Professional and Business Services (3,601 jobs); Education and Health (3,080 jobs); and Trade, Transportation, and Utilities (2,216 jobs).
MINING AND CONSTRUCTIONOver the month, statewide employment in Mining and Construction experienced a large seasonal decline to 39,789 jobs (-3,258 jobs or -7.6%) with the majority of the loss coming from Specialty Trade Contractors (-2,151 jobs or -7.7%). Over the year, employment went down by -1.8%, which is less than the reductions the past three Decembers (-2.4% to -10.9%).
Since last month, employment in the Lincoln MSA dropped by 334 to 6,159 jobs (-5.1%). Over-the-year employment cut out 291 workers (-4.5%). In the Omaha MSA, from November to December employment dropped by 1,506 to 19,032 jobs
Responsibilities for the Current Employment Statistics (CES) estimates of monthly industry employment for the state and metropolitan areas (Lincoln & Omaha) changed from the Nebraska Department of Labor to the Bureau of Labor Statistics (BLS) in April 2011. This transition happened in all states. Concurrent with this transition, BLS implemented several methodological changes to the estimation approach across states. The new estimation process reduces local economic knowledge in the process and may result in more month to month variability of the estimates, particularly in the smaller states. More detailed information on the changes to procedures for producing CES estimates is available on the BLS Web site at http://www.bls.gov/sae/cesprocs.htm
Industry Developments

www.dol.nebraska.gov Nebraska Workforce Trends| February 2012
(-7.3%). Since December 2010, employment has fallen by 995 jobs with the decrease occurring mainly in Specialty Trade Contractors (-1,269 jobs).
MANUFACTURING From November to December this year, statewide Manufacturing added 1,014 jobs to 95,498 (1.1%). Monthly growth at or above 1.0% has only occurred four times in the past five years. December’s over-the-year improvement of 2.8% (2,566 jobs) is mostly attributable to the employment gains in Durable Goods (2,171 jobs or 5.2%).
Since last year, Lincoln MSA employment increased by 262 to 13,004 jobs (2.1%) with the upswing attributable to Durable Goods (318 jobs or 4.0%). Over the year, employment in the Omaha MSA has grown every month in 2011 (0.5% to 3.2%). Since last December, employment increased by 1,001 jobs to 32,391 (3.2%), which is the largest over-the-year increase in any month in the past five years. The majority of the increase came from Durable Goods (726 jobs or 6.4%).
TRADE, TRANSPORTATION, AND UTILITIESSince last month, statewide employment trended up by 1,804 to 206,468 jobs (0.9%) with the majority of the increase coming from seasonal Retail Trade (1,657 jobs). Since December 2010, employment progressed by 3,035 jobs (1.5%). The bulk of the year’s upsurges have been due to Retail Trade adding 2,681 jobs (2.5%).
Employment in the Lincoln MSA reached its peak last month at 34,207 jobs and fell by 201 jobs this month. Since December 2010, employment has risen by 1,161 workers (3.5%) with Retail Trade accountable for the majority of the expansion (734 jobs). From November to December, Omaha MSA employment increased by 895 to 100,199 jobs (0.9%). Over the past year, employment advanced by 2,216 jobs (2.3%) with Retail Trade accountable for 1,663 jobs (3.1%).
INFORMATION
Statewide over-the-month employment remained stable at 17,250 jobs; common for December. Since December 2010, employment increased by 2.6% (444 jobs), which is a
continuation of its +2.0% growth from the prior four months.
Since December 2010, employment in the Lincoln MSA declined by 2.8% to 2,177 jobs. In the Omaha MSA, over-the-year employment is down 3.8% to 10,482 jobs.
FINANCIAL ACTIVITIES
Over the month, statewide employment held steady at 68,405 jobs, as is typical for December. Over the year, employment increased slightly (0.5% or 312 jobs). The Finance and Insurance industry gained 400 jobs (0.7%) over the year.
Employment in the Lincoln MSA achieved its peak in June 2011 at 13,446. December employment was just off this high at 13,399, which translates to an over-the-year increase of 198 jobs (1.5%). In the Omaha MSA, over-the-year employment was sustained at 39,852 jobs (79 jobs or 0.2%) with Real Estate and Rental and Leasing contributing 109 jobs (2.0%).
PROFESSIONAL AND BUSINESS SERVICES
After reaching its peak of 113,896 in October, employment fell by 3,795 jobs in the past two months. The decline is due to the loss of 4,605 jobs in Administrative and Waste Services during the past two months. Despite this drop, over-the-year statewide employment has grown by 6,299 jobs (6.1%). Over-the-year employment increases have been between 4.5% and 10.8% during the past year. The majority of the yearly employment growth came from Administrative and Waste Services, gaining 6.3% since December 2010 (2,748 jobs).
The Lincoln MSA employment surged the majority of the year to max out in October at 21,018; however, it has since fallen by 1,529 jobs to 19,489. Over the year, Professional and Business Services employment has escalated by 8.5% (1,534 jobs), with the Administrative and Waste Services industry primarily responsible for the advancement (1,569 jobs). Employment in the Omaha MSA peaked at 67,957 jobs in September 2011. Over the year, the industry grew 5.6% (3,601 jobs) with much of the increase due to Professional, Scientific and Technical Services (2,446 jobs or 9.2%).
www.dol.nebraska.govNebraska Workforce Trends|February 2012
EDUCATION AND HEALTH SERVICES Over-the-month employment showed little movement to 138,988 jobs (0.4%). Over-the-year employment was up by 1,968 jobs (1.4%), due mostly to the increase in Nursing and Residential Care Facilities (724 jobs).
Employment in the Lincoln MSA grew by 1.8% since December 2010 (454 jobs). Since December 2010, Omaha MSA employment rose by 3,080 to 73,428 jobs (4.4%). The majority of the yearly expansion is attributable to Health Care and Social Assistance (2,882 jobs or 4.8%).
LEISURE AND HOSPITALITYStatewide employment peaked in August 2011 at 86,432 jobs. Since then it has fallen by 7,467 jobs (-8.6%) with the majority of the losses coming from Arts, Entertainment, and Recreation (-4,215 jobs or -29.6%), followed by Accommodation and Food Services (-3,252 jobs or -4.5%). Over-the-year employment had been expanding from November 2010 to October 2011
ranging from 0.7% to 2.4%; however, employment declined by 0.7% in November and 0.2% this month.
In the Lincoln MSA, employment peaked in October at 16,870 jobs and shed 841 jobs in the past two months. Over-the-year employment gains were markedly lower than recent months at 0.5%. Since last year, Omaha MSA employment grew 366 to 42,187 jobs (0.9%) with Accommodation and Food Services gaining 732 jobs (2.0%).
OTHER SERVICESSince last month, statewide employment increased by 372 to 37,367 jobs (1.0%) with Repair and Maintenance contributing the bulk (295 jobs or 3.0%). Over-the-year employment grew by 415 jobs with gains coming mainly from Religious, Grantmaking, Civic, Professional, and Similar Organizations (308 jobs).
Over-the-year employment in the Lincoln MSA grew slightly by 46 to 7,026 jobs (0.7%). In the Omaha MSA, over-the-year employment has lost 487 jobs to 17,446 jobs (-2.7%).
Dec-11 Nov-11 Dec-10Numeric Change
Percent Change
Numeric Change
Percent Change
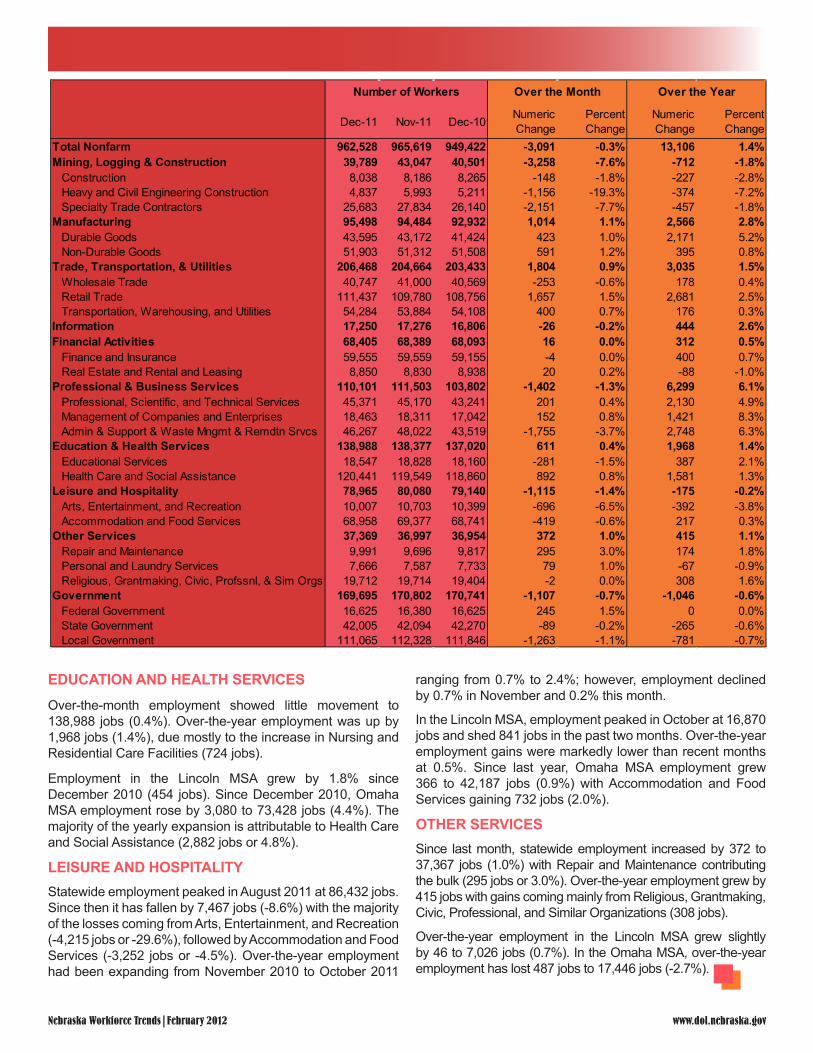
Total Nonfarm 962,528 965,619 949,422 -3,091 -0.3% 13,106 1.4%Mining, Logging & Construction 39,789 43,047 40,501 -3,258 -7.6% -712 -1.8%
Construction 8,038 8,186 8,265 -148 -1.8% -227 -2.8%Heavy and Civil Engineering Construction 4,837 5,993 5,211 -1,156 -19.3% -374 -7.2%Specialty Trade Contractors 25,683 27,834 26,140 -2,151 -7.7% -457 -1.8%
Manufacturing 95,498 94,484 92,932 1,014 1.1% 2,566 2.8%Durable Goods 43,595 43,172 41,424 423 1.0% 2,171 5.2%Non-Durable Goods 51,903 51,312 51,508 591 1.2% 395 0.8%
Trade, Transportation, & Utilities 206,468 204,664 203,433 1,804 0.9% 3,035 1.5%Wholesale Trade 40,747 41,000 40,569 -253 -0.6% 178 0.4%Retail Trade 111,437 109,780 108,756 1,657 1.5% 2,681 2.5%Transportation, Warehousing, and Utilities 54,284 53,884 54,108 400 0.7% 176 0.3%
Information 17,250 17,276 16,806 -26 -0.2% 444 2.6%Financial Activities 68,405 68,389 68,093 16 0.0% 312 0.5%
Finance and Insurance 59,555 59,559 59,155 -4 0.0% 400 0.7%Real Estate and Rental and Leasing 8,850 8,830 8,938 20 0.2% -88 -1.0%
Professional & Business Services 110,101 111,503 103,802 -1,402 -1.3% 6,299 6.1%Professional, Scientific, and Technical Services 45,371 45,170 43,241 201 0.4% 2,130 4.9%Management of Companies and Enterprises 18,463 18,311 17,042 152 0.8% 1,421 8.3%Admin & Support & Waste Mngmt & Remdtn Srvcs 46,267 48,022 43,519 -1,755 -3.7% 2,748 6.3%
Education & Health Services 138,988 138,377 137,020 611 0.4% 1,968 1.4%Educational Services 18,547 18,828 18,160 -281 -1.5% 387 2.1%Health Care and Social Assistance 120,441 119,549 118,860 892 0.8% 1,581 1.3%
Leisure and Hospitality 78,965 80,080 79,140 -1,115 -1.4% -175 -0.2%Arts, Entertainment, and Recreation 10,007 10,703 10,399 -696 -6.5% -392 -3.8%Accommodation and Food Services 68,958 69,377 68,741 -419 -0.6% 217 0.3%
Other Services 37,369 36,997 36,954 372 1.0% 415 1.1%Repair and Maintenance 9,991 9,696 9,817 295 3.0% 174 1.8%Personal and Laundry Services 7,666 7,587 7,733 79 1.0% -67 -0.9%Religious, Grantmaking, Civic, Profssnl, & Sim Orgs 19,712 19,714 19,404 -2 0.0% 308 1.6%
Government 169,695 170,802 170,741 -1,107 -0.7% -1,046 -0.6%Federal Government 16,625 16,380 16,625 245 1.5% 0 0.0%State Government 42,005 42,094 42,270 -89 -0.2% -265 -0.6%Local Government 111,065 112,328 111,846 -1,263 -1.1% -781 -0.7%
Number of Workers Over the Month Over the Year
www.dol.nebraska.gov Nebraska Workforce Trends|February 2012
Commissioner of Labor Catherine D. Lang
LMI AdministratorPhil Baker
EditorScott Hunzeker
EditorJacob Liudahl
Graphic DesignerKristin Brehmer
Credits
Nebraska Workforce Trends is published by the Nebraska Department of Labor - Labor Market Information Center in cooperation with the U.S. Department of Labor, Bureau of Labor Statistics.
DEPARTMENT OF LABOR