Embed Size (px)
Citation preview

Trends in Workplace Flexibility
A Report by WorldatWork,
Underwritten by FlexJobs
September 2015
About WorldatWork® – The Total Rewards Association
WorldatWork (www.worldatwork.org) is a nonprofit human resources association for
professionals and organizations focused on compensation, benefits, work-life effec-
tiveness and total rewards – strategies to attract, motivate and retain an engaged and
productive workforce. WorldatWork and its affiliates provide comprehensive education,
certification, research, advocacy and community, enhancing careers of professionals
and, ultimately, achieving better results for the organizations they serve. WorldatWork
has more than 65,000 members and subscribers worldwide; 80 percent of Fortune 500
companies employ a WorldatWork member. Founded in 1955, WorldatWork is affiliated
with more than 70 local human resources associations and has offices in Scottsdale,
Ariz., and Washington, D.C.
WorldatWork Society of Certified Professionals® is the certifying body for six presti-
gious designations: the Certified Compensation Professional® (CCP®), Certified Benefits
Professional® (CBP), Global Remuneration Professional (GRP®), Work-Life Certified
Professional® (WLCP®), Certified Sales Compensation Professional (CSCP)™ and
Certified Executive Compensation Professional (CECP)™.
The WorldatWork group of registered marks also includes: Alliance for Work-Life
Progress or AWLP, workspan and WorldatWork Journal.
Contact:
WorldatWork Customer Relations
14040 N. Northsight Blvd.
Scottsdale, Arizona USA
85260-3601
Toll free: 877-951-9191
Fax 480-483-8352
©2015 WorldatWork Any laws, regulations or other legal requirements noted in this publication are, to the best of the publisher’s knowledge, accurate and current
as of this report’s publishing date. WorldatWork is providing this information with the understanding that WorldatWork is not engaged, directly or by implication, in
rendering legal, accounting or other related professional services. You are urged to consult with an attorney, accountant or other qualified professional concerning
your own specific situation and any questions that you may have related to that.
No portion of this publication may be reproduced in any form without express written permission from WorldatWork.
About FlexJobs
FlexJobs is the leading online service for professionals seeking telecommuting,
flexible schedules, part-time, and freelance jobs. With flexible job listings in over 100
career categories, and opportunities ranging from entry-level to executive, freelance
to full-time, FlexJobs offers job-seekers a safe, easy, and efficient way to find
professional and legitimate flexible job listings. Having helped over one million
people in their job searches, FlexJobs has appeared on CNN and Marketplace
Money and in TIME, Forbes, Fortune, and many other trusted media outlets.
Trends in Workplace Flexibility WorldatWork 1
Introduction & Methodology
This report summarizes the results of a May 2015 survey of WorldatWork members, “Trends in Workplace Flexibility,” to gather information about current trends in workplace flexibility practices. This survey is designed to measure flexibility options offered to employees and commonly used flexible work arrangements. It also analyzes how these programs are managed.
On May 20, 2015, the survey opened to U.S., Canadian and international WorldatWork members. Members were notified of the survey through direct, electronic invitations as well as targeted messages through Facebook and LinkedIn.
The survey closed on June 19, 2015, with 379 responses. The dataset was cleaned and analyzed using statistical software. Any duplicate records were removed, resulting in a final data set of 375 responses. Data comparisons with any relevant, statistically significant differences are noted in this report.
The demographics of the survey sample and the respondents are similar to the WorldatWork membership as a whole. The typical WorldatWork member works at the managerial level or higher in the headquarters of a large company in North America.
The frequencies or response distributions listed in the report show the number of times or percentage of times a value appears in a data set. Due to rounding, frequencies of data responses provided in this survey may not total 100%.
WorldatWork conducted similar trends in flexibility program surveys in 2013 and 2010. These reports can be viewed on the WorldatWork website. Where possible, historical comparisons from data gathered in the previous survey are shown.
Trends in Workplace Flexibility WorldatWork 2
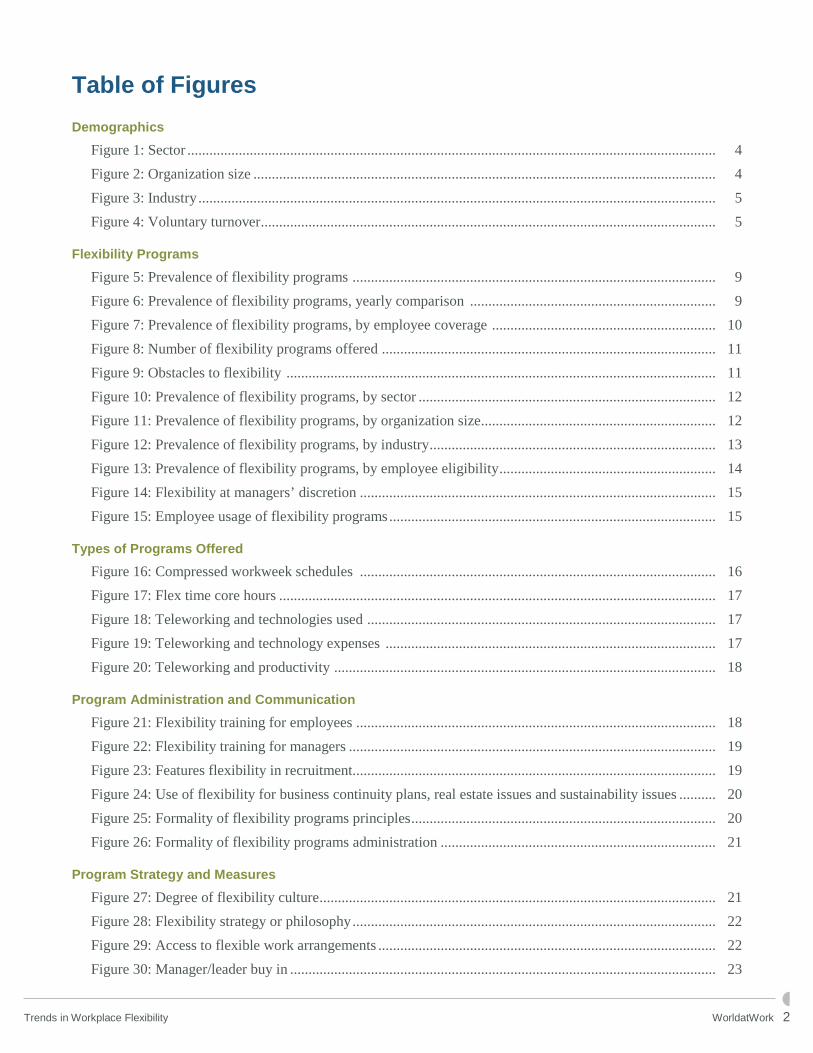
Table of Figures Demographics
Figure 1: Sector ................................................................................................................................................ 4 Figure 2: Organization size .............................................................................................................................. 4 Figure 3: Industry ............................................................................................................................................. 5 Figure 4: Voluntary turnover ............................................................................................................................ 5
Flexibility Programs
Figure 5: Prevalence of flexibility programs ................................................................................................... 9 Figure 6: Prevalence of flexibility programs, yearly comparison ................................................................... 9 Figure 7: Prevalence of flexibility programs, by employee coverage ............................................................. 10 Figure 8: Number of flexibility programs offered ........................................................................................... 11 Figure 9: Obstacles to flexibility ..................................................................................................................... 11 Figure 10: Prevalence of flexibility programs, by sector ................................................................................. 12 Figure 11: Prevalence of flexibility programs, by organization size ................................................................ 12 Figure 12: Prevalence of flexibility programs, by industry .............................................................................. 13 Figure 13: Prevalence of flexibility programs, by employee eligibility ........................................................... 14 Figure 14: Flexibility at managers’ discretion ................................................................................................. 15 Figure 15: Employee usage of flexibility programs ......................................................................................... 15
Types of Programs Offered Figure 16: Compressed workweek schedules ................................................................................................. 16 Figure 17: Flex time core hours ....................................................................................................................... 17 Figure 18: Teleworking and technologies used ............................................................................................... 17 Figure 19: Teleworking and technology expenses .......................................................................................... 17 Figure 20: Teleworking and productivity ........................................................................................................ 18
Program Administration and Communication
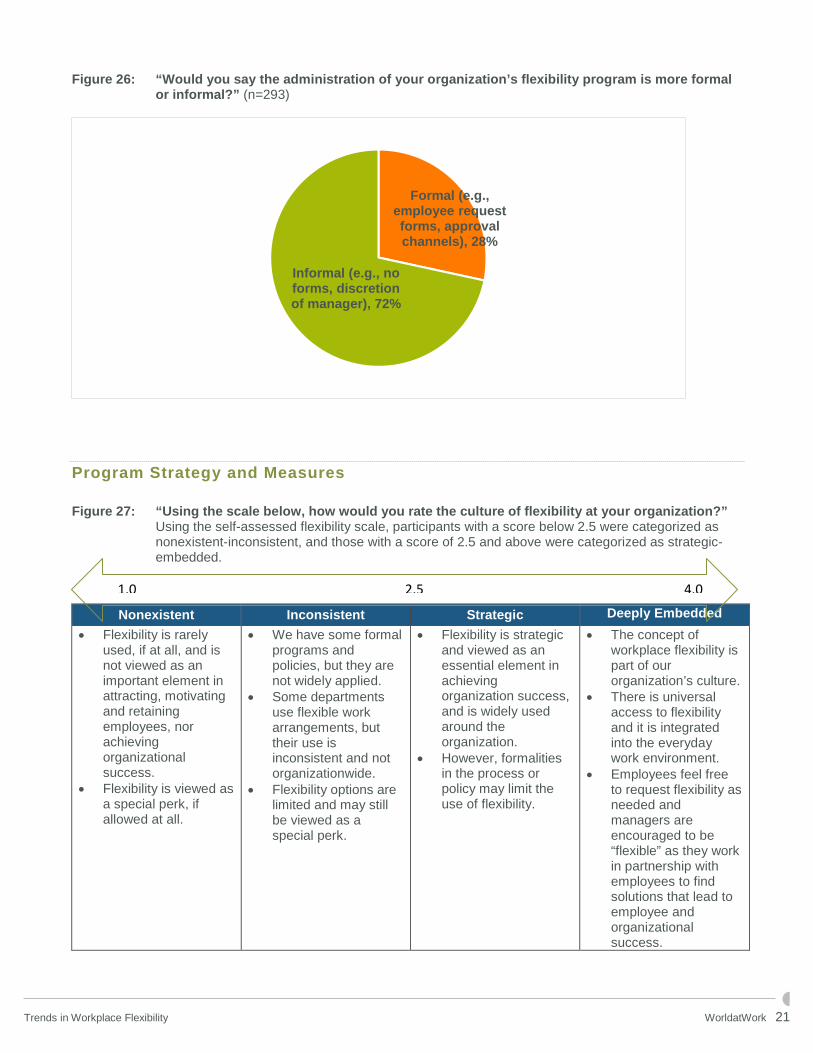
Figure 21: Flexibility training for employees .................................................................................................. 18 Figure 22: Flexibility training for managers .................................................................................................... 19 Figure 23: Features flexibility in recruitment ................................................................................................... 19 Figure 24: Use of flexibility for business continuity plans, real estate issues and sustainability issues .......... 20 Figure 25: Formality of flexibility programs principles ................................................................................... 20 Figure 26: Formality of flexibility programs administration ........................................................................... 21
Program Strategy and Measures
Figure 27: Degree of flexibility culture ............................................................................................................ 21 Figure 28: Flexibility strategy or philosophy ................................................................................................... 22 Figure 29: Access to flexible work arrangements ............................................................................................ 22 Figure 30: Manager/leader buy in .................................................................................................................... 23
Trends in Workplace Flexibility WorldatWork 3
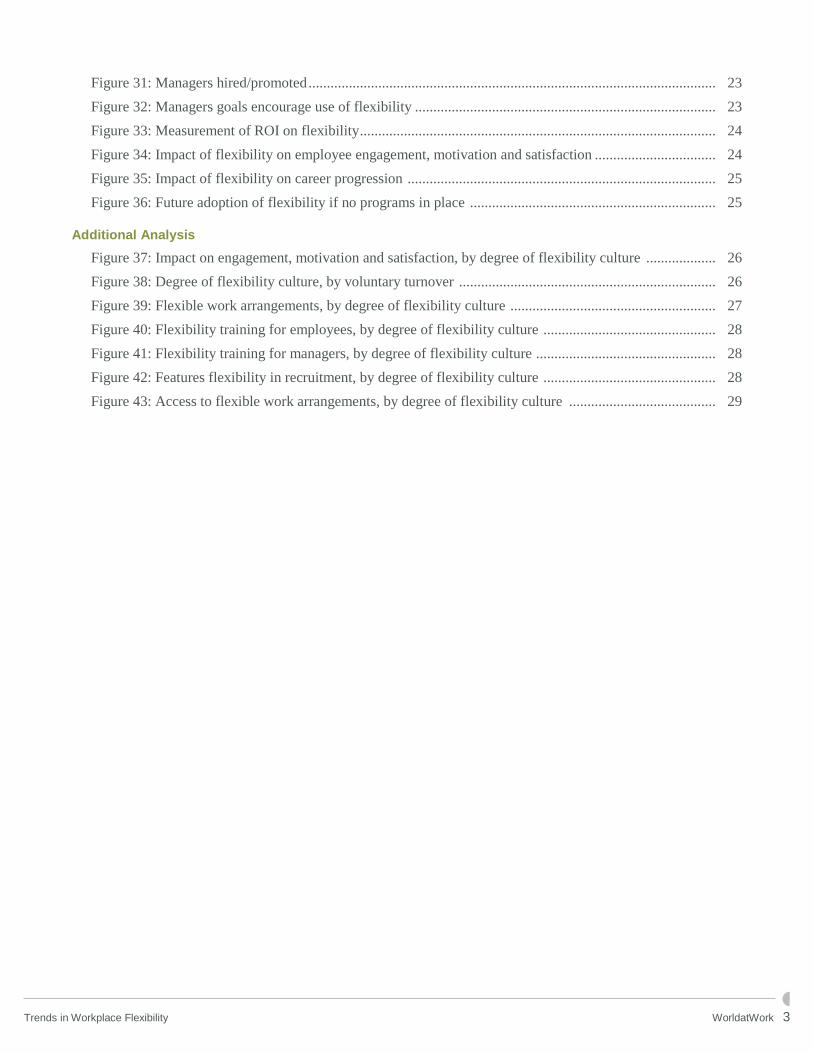
Figure 31: Managers hired/promoted ............................................................................................................... 23 Figure 32: Managers goals encourage use of flexibility .................................................................................. 23 Figure 33: Measurement of ROI on flexibility ................................................................................................. 24 Figure 34: Impact of flexibility on employee engagement, motivation and satisfaction ................................. 24 Figure 35: Impact of flexibility on career progression .................................................................................... 25 Figure 36: Future adoption of flexibility if no programs in place ................................................................... 25
Additional Analysis
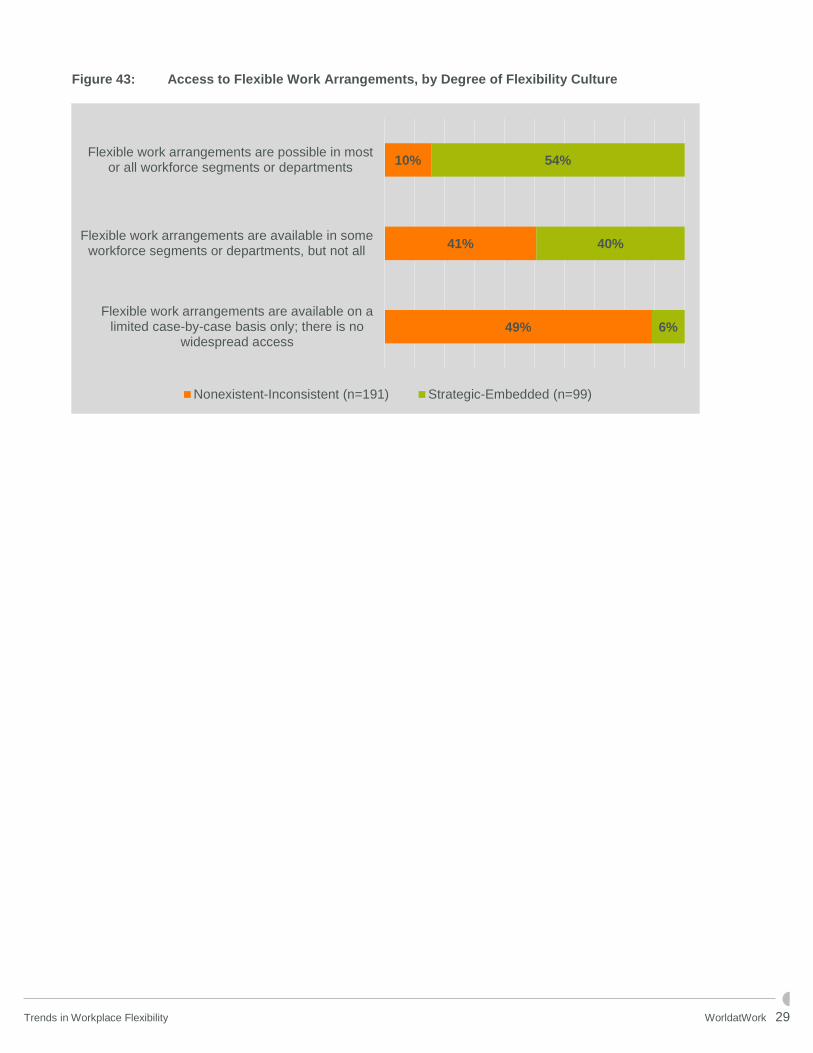
Figure 37: Impact on engagement, motivation and satisfaction, by degree of flexibility culture ................... 26 Figure 38: Degree of flexibility culture, by voluntary turnover ...................................................................... 26 Figure 39: Flexible work arrangements, by degree of flexibility culture ........................................................ 27 Figure 40: Flexibility training for employees, by degree of flexibility culture ............................................... 28 Figure 41: Flexibility training for managers, by degree of flexibility culture ................................................. 28 Figure 42: Features flexibility in recruitment, by degree of flexibility culture ............................................... 28 Figure 43: Access to flexible work arrangements, by degree of flexibility culture ........................................ 29
Trends in Workplace Flexibility WorldatWork 4
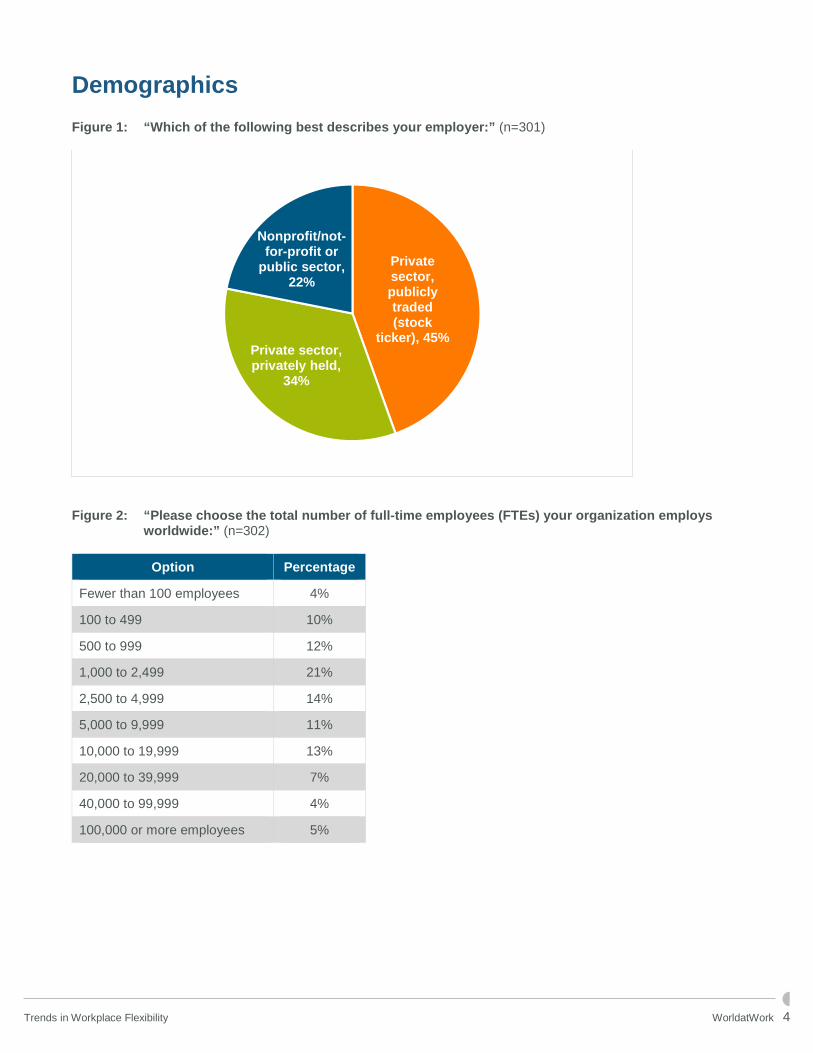
Demographics Figure 1: “Which of the following best describes your employer:” (n=301)
Figure 2: “Please choose the total number of full-time employees (FTEs) your organization employs
worldwide:” (n=302)
Option Percentage
Fewer than 100 employees 4%
100 to 499 10%
500 to 999 12%
1,000 to 2,499 21%
2,500 to 4,999 14%
5,000 to 9,999 11%
10,000 to 19,999 13%
20,000 to 39,999 7%
40,000 to 99,999 4%
100,000 or more employees 5%
Private sector, publicly traded (stock
ticker), 45%Private sector, privately held,
34%
Nonprofit/not-for-profit or
public sector, 22%
Trends in Workplace Flexibility WorldatWork 5
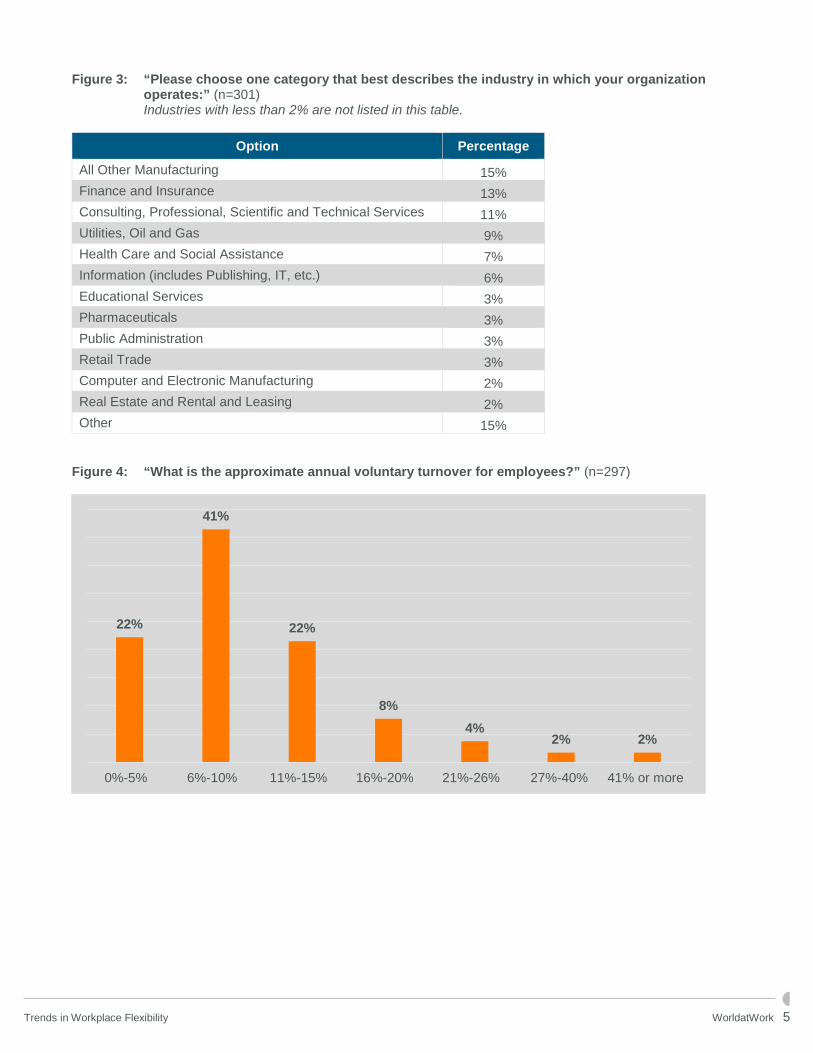
Figure 3: “Please choose one category that best describes the industry in which your organization operates:” (n=301)
Industries with less than 2% are not listed in this table.
Option Percentage
All Other Manufacturing 15% Finance and Insurance 13% Consulting, Professional, Scientific and Technical Services 11% Utilities, Oil and Gas 9% Health Care and Social Assistance 7% Information (includes Publishing, IT, etc.) 6% Educational Services 3% Pharmaceuticals 3% Public Administration 3% Retail Trade 3% Computer and Electronic Manufacturing 2% Real Estate and Rental and Leasing 2% Other 15%
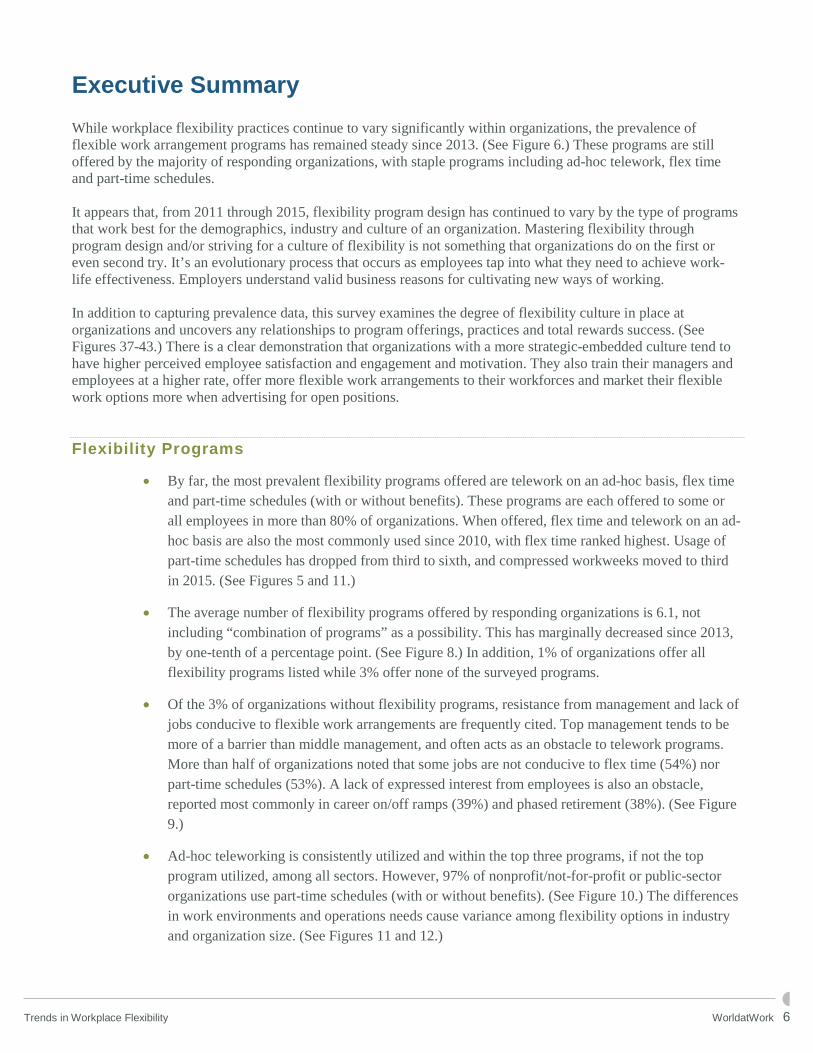
Figure 4: “What is the approximate annual voluntary turnover for employees?” (n=297)
22%
41%
22%
8%4%
2% 2%
0%-5% 6%-10% 11%-15% 16%-20% 21%-26% 27%-40% 41% or more
Trends in Workplace Flexibility WorldatWork 6
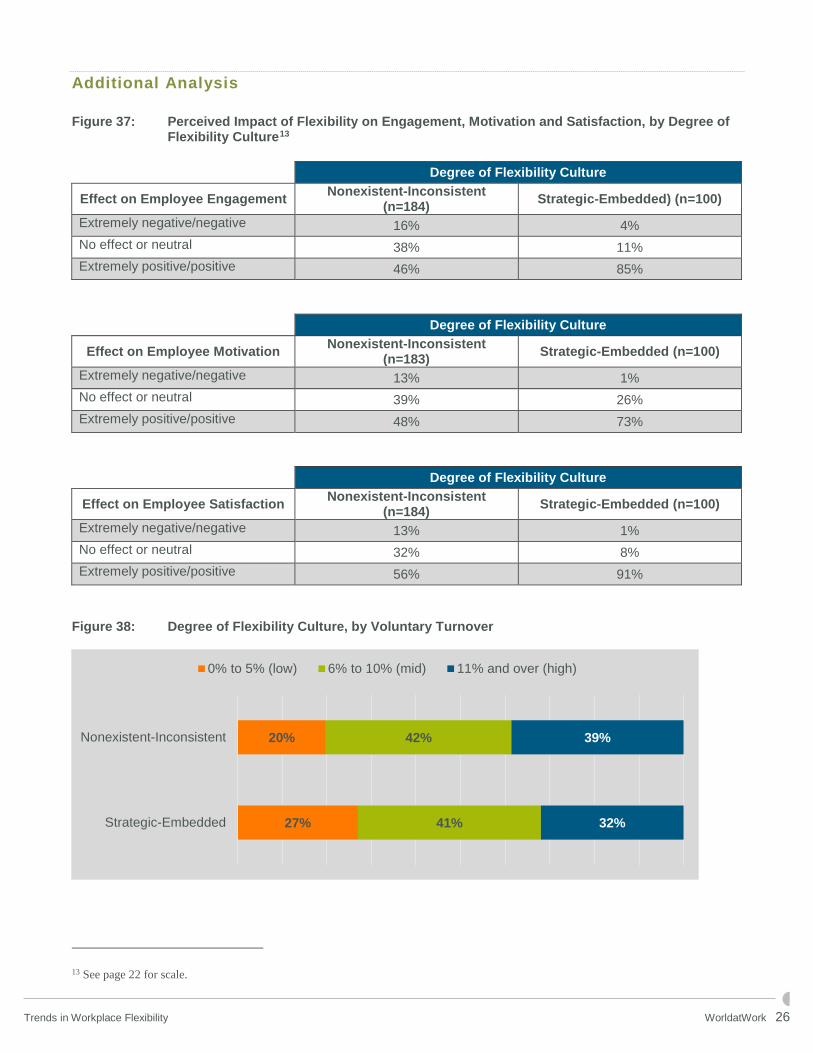
Executive Summary While workplace flexibility practices continue to vary significantly within organizations, the prevalence of flexible work arrangement programs has remained steady since 2013. (See Figure 6.) These programs are still offered by the majority of responding organizations, with staple programs including ad-hoc telework, flex time and part-time schedules. It appears that, from 2011 through 2015, flexibility program design has continued to vary by the type of programs that work best for the demographics, industry and culture of an organization. Mastering flexibility through program design and/or striving for a culture of flexibility is not something that organizations do on the first or even second try. It’s an evolutionary process that occurs as employees tap into what they need to achieve work-life effectiveness. Employers understand valid business reasons for cultivating new ways of working. In addition to capturing prevalence data, this survey examines the degree of flexibility culture in place at organizations and uncovers any relationships to program offerings, practices and total rewards success. (See Figures 37-43.) There is a clear demonstration that organizations with a more strategic-embedded culture tend to have higher perceived employee satisfaction and engagement and motivation. They also train their managers and employees at a higher rate, offer more flexible work arrangements to their workforces and market their flexible work options more when advertising for open positions.
Flexibility Programs
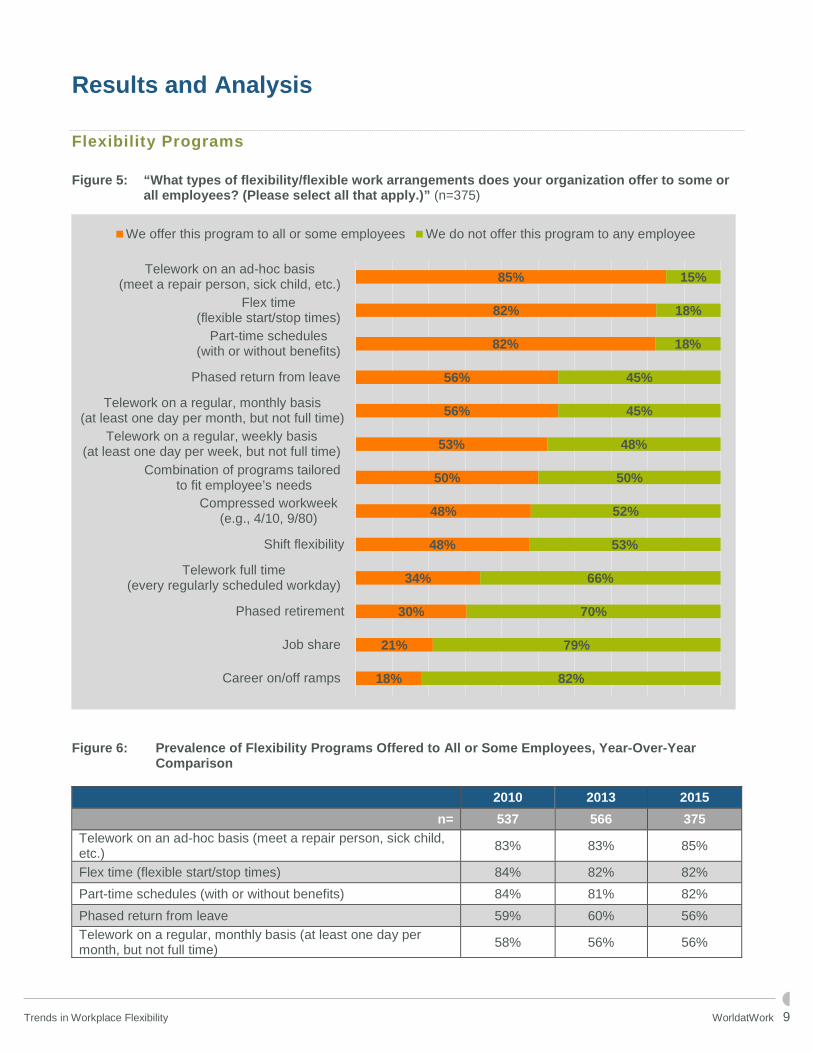
• By far, the most prevalent flexibility programs offered are telework on an ad-hoc basis, flex time and part-time schedules (with or without benefits). These programs are each offered to some or all employees in more than 80% of organizations. When offered, flex time and telework on an ad-hoc basis are also the most commonly used since 2010, with flex time ranked highest. Usage of part-time schedules has dropped from third to sixth, and compressed workweeks moved to third in 2015. (See Figures 5 and 11.)
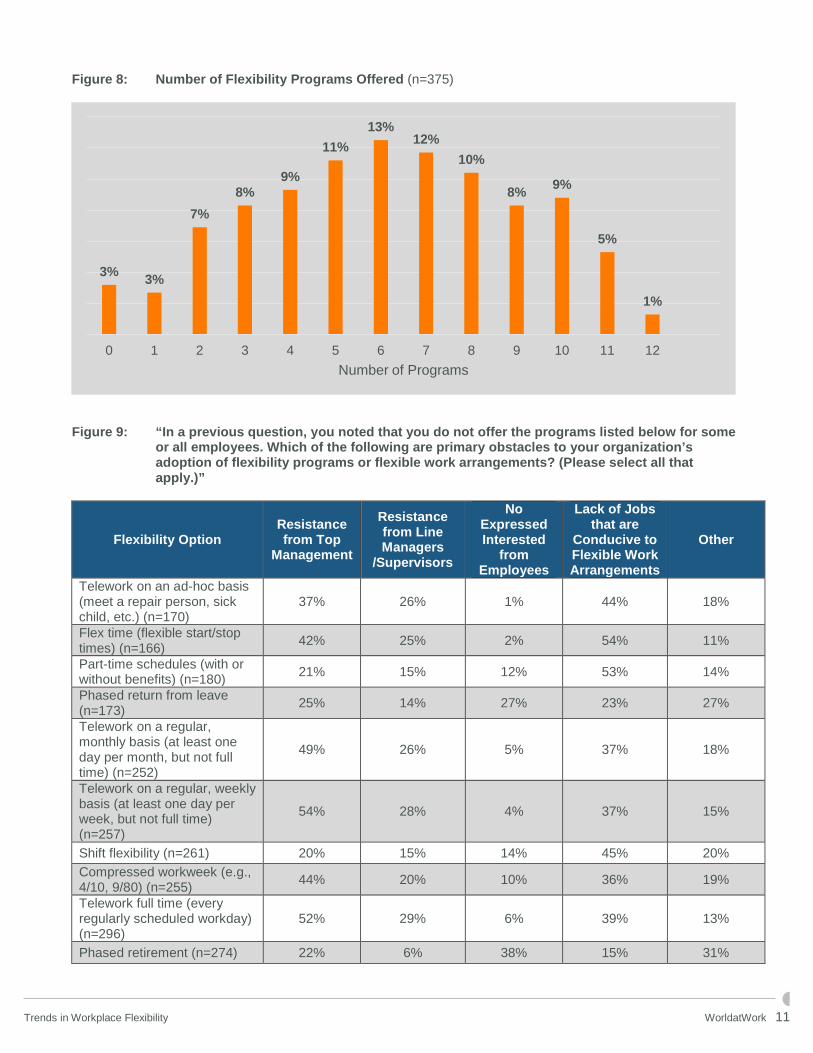
• The average number of flexibility programs offered by responding organizations is 6.1, not including “combination of programs” as a possibility. This has marginally decreased since 2013, by one-tenth of a percentage point. (See Figure 8.) In addition, 1% of organizations offer all flexibility programs listed while 3% offer none of the surveyed programs.
• Of the 3% of organizations without flexibility programs, resistance from management and lack of jobs conducive to flexible work arrangements are frequently cited. Top management tends to be more of a barrier than middle management, and often acts as an obstacle to telework programs. More than half of organizations noted that some jobs are not conducive to flex time (54%) nor part-time schedules (53%). A lack of expressed interest from employees is also an obstacle, reported most commonly in career on/off ramps (39%) and phased retirement (38%). (See Figure 9.)
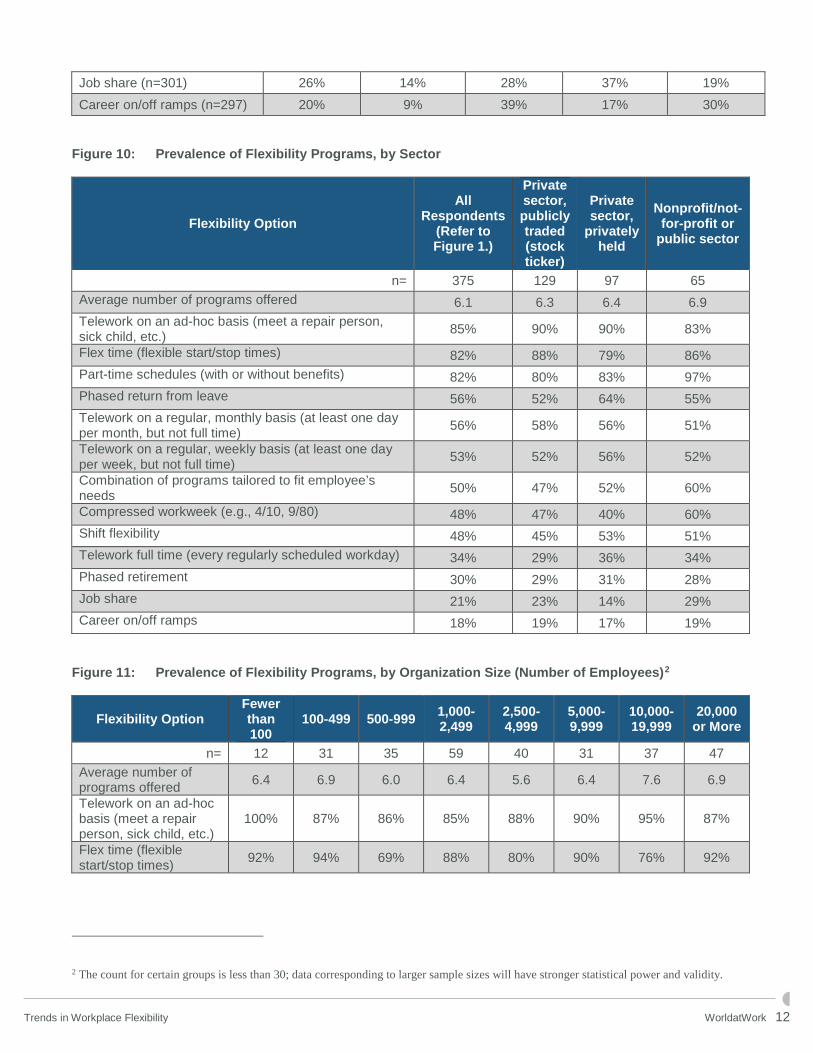
• Ad-hoc teleworking is consistently utilized and within the top three programs, if not the top program utilized, among all sectors. However, 97% of nonprofit/not-for-profit or public-sector organizations use part-time schedules (with or without benefits). (See Figure 10.) The differences in work environments and operations needs cause variance among flexibility options in industry and organization size. (See Figures 11 and 12.)
Trends in Workplace Flexibility WorldatWork 7
• Over two-thirds of managers (67%) offer flexibility to all or most of their employees either at their own discretion, or they are generally encouraged to find mutually beneficial solutions. However, 21% of managers do not offer informal flexibility programs at their discretion. (See Figure 14.)
Types of Programs Offered
• A 4/10 schedule (work four, 10 hour days with one day off) remains the most common compressed workweek arrangement in 2015. However, this has dropped by 20 percentage points. Gaining in popularity are a lack of a specific flexibility schedule in place or employees developing a schedule with supervisors (28%) and a 4/9 workweek (work four, nine hour days with one half day off) (20%). (See Figure 16.)
• Core work hours are typical with flex time. For half of responding organizations, hours vary by business unit/department. While 34% of organizations agree that all or most employees are required to work during the core hours, and on average the hours of 9 a.m. to 4 p.m. This has remained unchanged since 2010. (See Figure 17.)
• 66% of organizations cover the purchase of laptops for their teleworkers, by far the most provided expense. (See Figure 19.) Technology purchases are the greatest expense covered by employers, and teleworkers utilize the following products regularly: virtual private network (VPN) (86%), instant messaging (74%), communication and collaboration software such as WebEx (70%) and telephone systems (61%). (See Figure 18.)
• While many managers still find it difficult to estimate the productivity of teleworking employees, 48% believe teleworkers are equally as productive as in-office employees. This trend has inversely shifted since 2013 where only 36% of organizations agreed teleworking employees were equally as productive, and 53% of managers found it difficult to estimate teleworker productivity. (See Figure 20.)
Program Administration and Communication
• Flexibility training for managers and employees remains a rarity in many organizations. Training is not specifically provided for employees nor managers about how to be successful with flexible work arrangements. (See Figures 21 and 22.)
• 44% of organizations do not feature or market flexibility as a key employee benefit when attempting to attract new employees. (See Figure 23.)
• More than three quarters of organizations (82%) have a written business continuity plan that involves the use of flexibility in response to a disaster or circumstances that may prevent operations as normal. Not nearly as many organizations have, or are considering, the use of flexibility as a strategy for real estate issues (24%) or green or corporate sustainability initiatives (20%). (See Figure 24.)
• While more organizations agree that the guiding principles of their flexibility programs are formal (37%) than the administration of the programs (28%), a majority of organizations believe
Trends in Workplace Flexibility WorldatWork 8
both the principles and administration are informal. (See Figures 25 and 26.) Informal flexibility is defined as no written strategy/philosophy, no/few written policies, as well as no forms or at the discretion of managers for administration.
Program Strategy and Measures
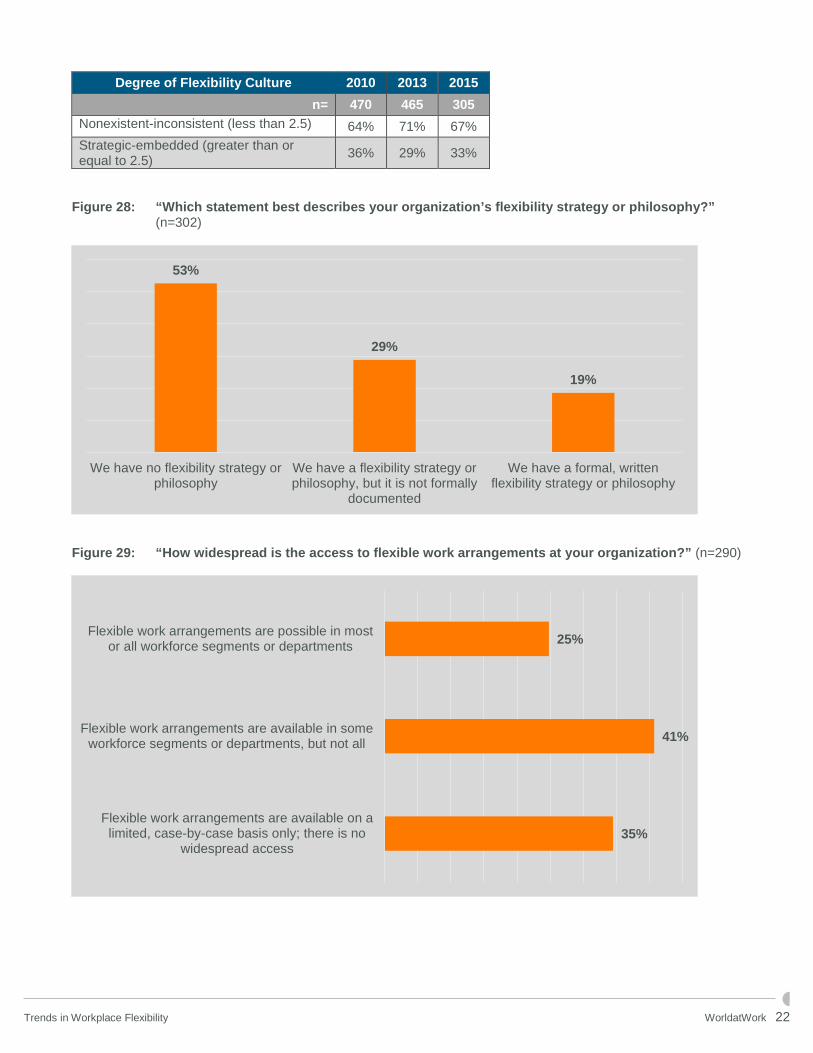
• 53% of organizations do not have a flexibility strategy or philosophy. However, of those that do, only 19% have a formal, written document. (See Figure 28.)
• The access of flexible work arrangements often depends on workforce segments or departments, but is not widespread to all employees in 41% of organizations. (See Figure 29.)
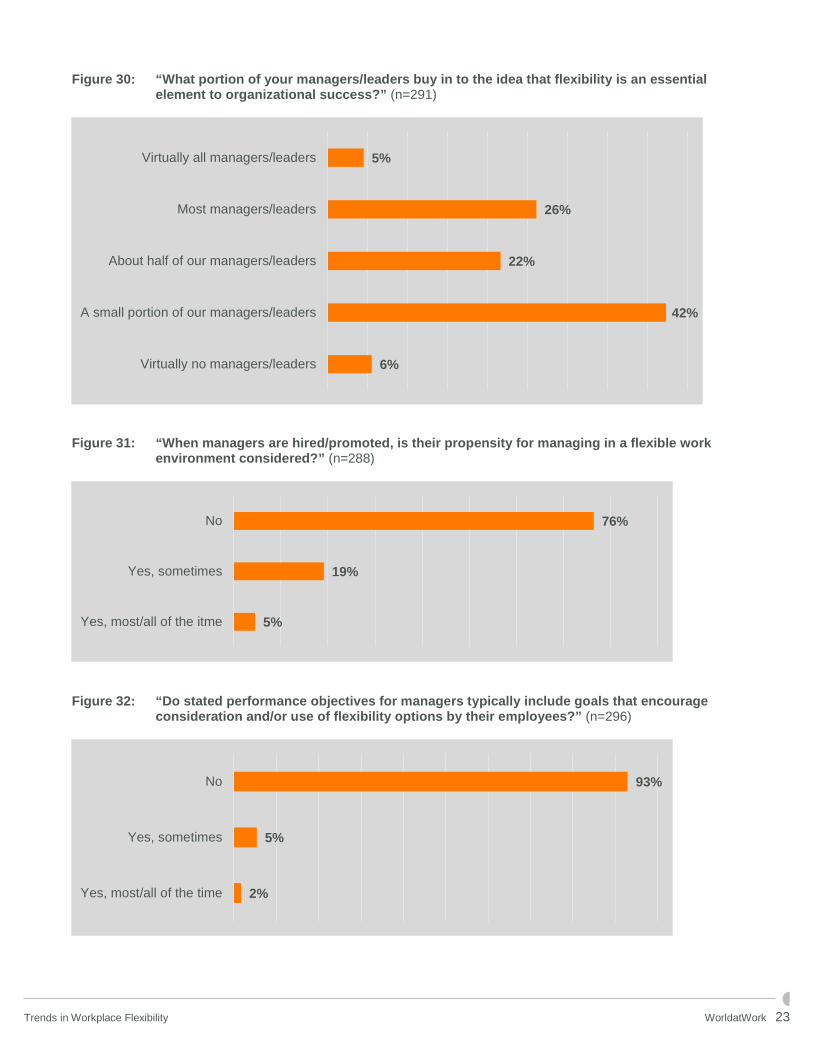
• Frequently, only a small portion of managers/leaders (42%) buy in to the idea that flexibility is an essential element to organizational success. (See Figure 26.) When managers are hired or promoted, 76% of organizations do not consider their propensity for managing in a flexible work environment. (See Figure 31.) Furthermore, 93% of a managers stated performance objectives do not typically include goals that encourage consideration and/or use of flexibility options by their employees. (See Figure 32.)
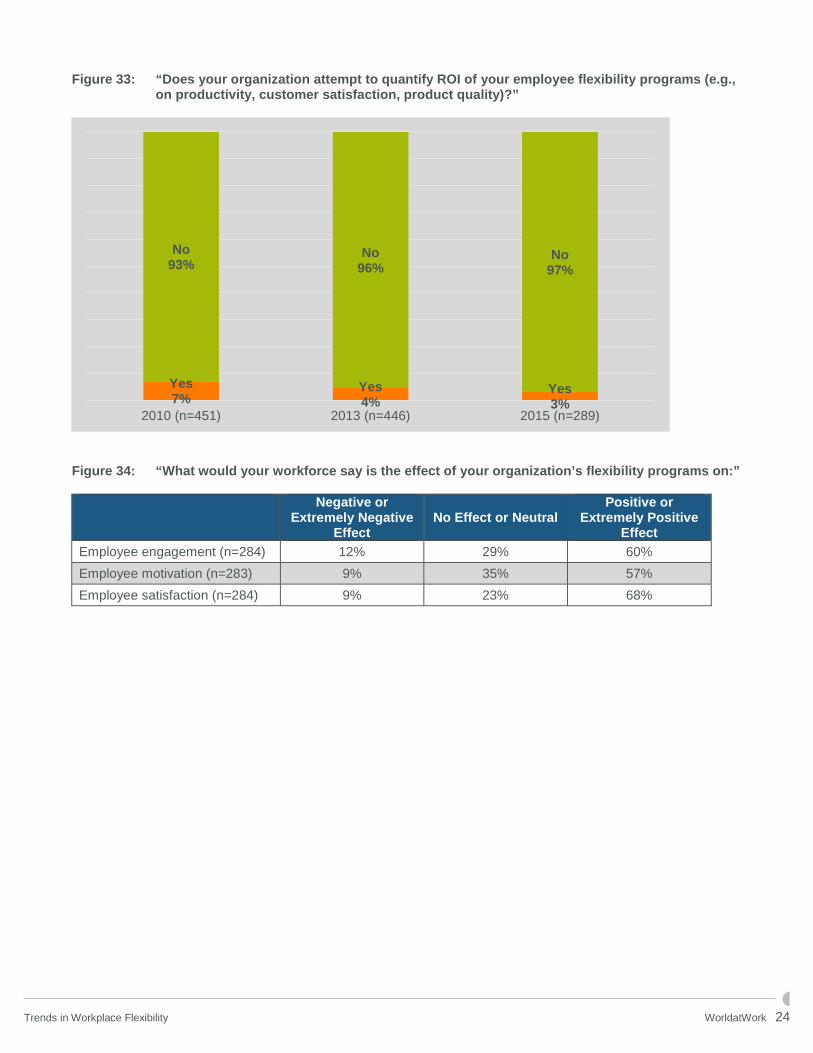
• Only 3% of organizations attempt to quantify the ROI of flexibility programs by measuring items such as productivity, employee engagement and performance rating. (See Figure 33.)
• Workplace flexibility is believed to have a positive effect on engagement, motivation and satisfaction, although to a lesser degree since 2010. More than half of participants anticipate their workforce would say there is a positive or extremely positive effect on employee engagement (60%), motivation (57%) and satisfaction (68%). (See Figure 34.)
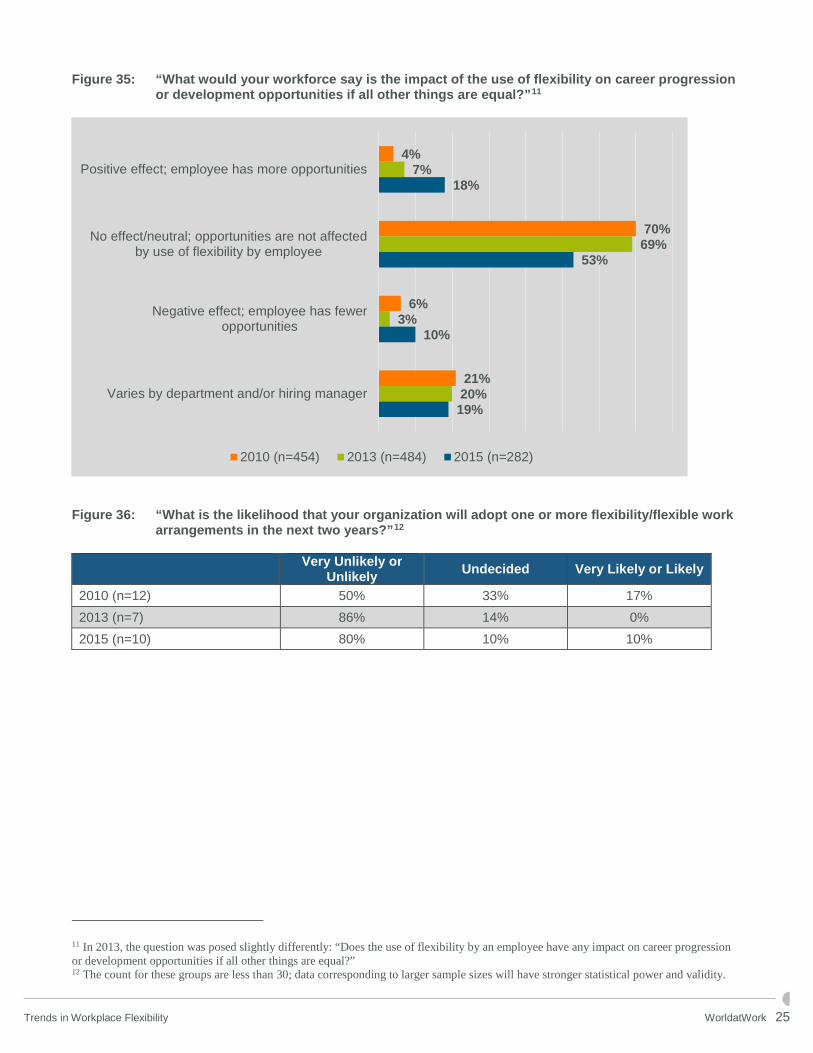
• More organizations are feeling that their workforces would say that career progression or development are positively impacted, causing employees to have more opportunities. This has increased to 18% in 2015, an 11 percentage point shift since 2013. However, 10% of organizations also believe their workforces would agree there is a negative effect, a 7 percentage point rise. While growths have occurred both in positive and negative effects, the majority of organizations (53%) continue to agree that career progression or development opportunities are not impacted by an employee’s use of flexibility. This has largely declined from 69% in 2013. (See Figure 35.)
Trends in Workplace Flexibility WorldatWork 9
Results and Analysis
Flexibility Programs Figure 5: “What types of flexibility/flexible work arrangements does your organization offer to some or
all employees? (Please select all that apply.)” (n=375)
Figure 6: Prevalence of Flexibility Programs Offered to All or Some Employees, Year-Over-Year
Comparison
2010 2013 2015 n= 537 566 375
Telework on an ad-hoc basis (meet a repair person, sick child, etc.) 83% 83% 85%
Flex time (flexible start/stop times) 84% 82% 82% Part-time schedules (with or without benefits) 84% 81% 82% Phased return from leave 59% 60% 56% Telework on a regular, monthly basis (at least one day per month, but not full time) 58% 56% 56%
18%
21%
30%
34%
48%
48%
50%
53%
56%
56%
82%
82%
85%
82%
79%
70%
66%
53%
52%
50%
48%
45%
45%
18%
18%
15%
Career on/off ramps
Job share
Phased retirement
Telework full time(every regularly scheduled workday)
Shift flexibility
Compressed workweek(e.g., 4/10, 9/80)
Combination of programs tailoredto fit employee’s needs
Telework on a regular, weekly basis(at least one day per week, but not full time)
Telework on a regular, monthly basis(at least one day per month, but not full time)
Phased return from leave
Part-time schedules(with or without benefits)
Flex time(flexible start/stop times)
Telework on an ad-hoc basis(meet a repair person, sick child, etc.)
We offer this program to all or some employees We do not offer this program to any employee
Trends in Workplace Flexibility WorldatWork 10
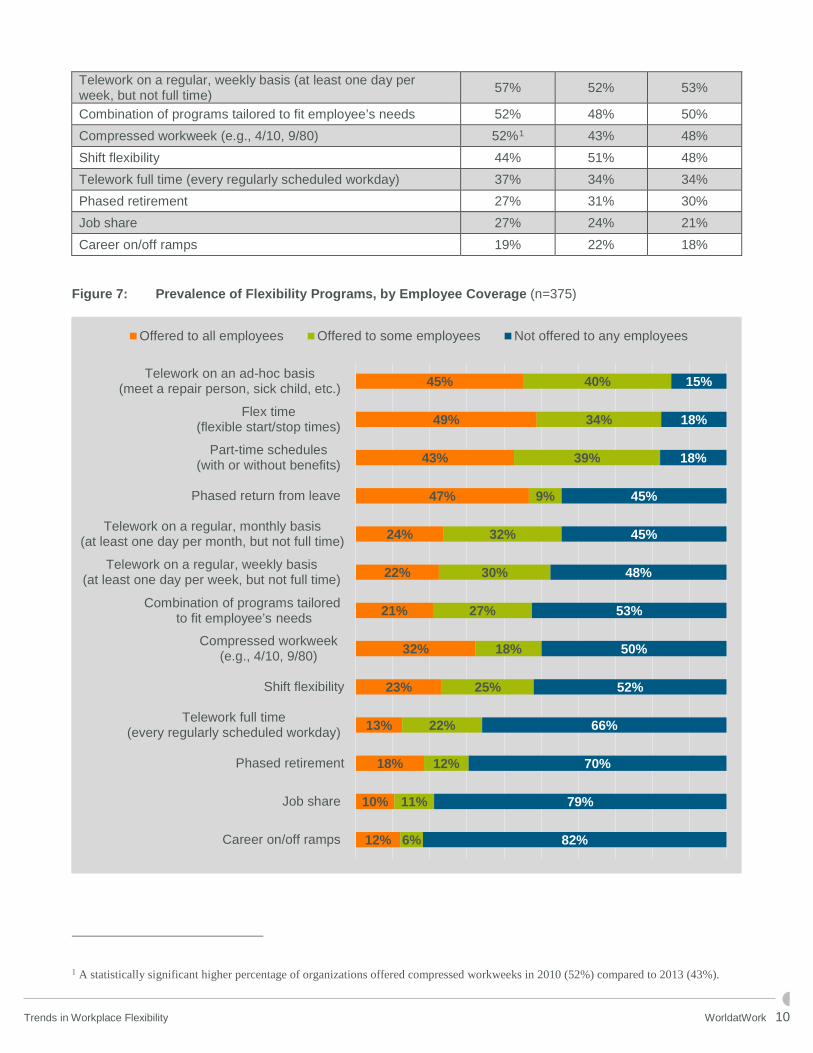
Telework on a regular, weekly basis (at least one day per week, but not full time) 57% 52% 53%
Combination of programs tailored to fit employee’s needs 52% 48% 50% Compressed workweek (e.g., 4/10, 9/80) 52%1 43% 48% Shift flexibility 44% 51% 48% Telework full time (every regularly scheduled workday) 37% 34% 34% Phased retirement 27% 31% 30% Job share 27% 24% 21% Career on/off ramps 19% 22% 18%
Figure 7: Prevalence of Flexibility Programs, by Employee Coverage (n=375)
1 A statistically significant higher percentage of organizations offered compressed workweeks in 2010 (52%) compared to 2013 (43%).
12%
10%
18%
13%
23%
32%
21%
22%
24%
47%
43%
49%
45%
6%
11%
12%
22%
25%
18%
27%
30%
32%
9%
39%
34%
40%
82%
79%
70%
66%
52%
50%
53%
48%
45%
45%
18%
18%
15%
Career on/off ramps
Job share
Phased retirement
Telework full time(every regularly scheduled workday)
Shift flexibility
Compressed workweek(e.g., 4/10, 9/80)
Combination of programs tailoredto fit employee’s needs
Telework on a regular, weekly basis(at least one day per week, but not full time)
Telework on a regular, monthly basis(at least one day per month, but not full time)
Phased return from leave
Part-time schedules(with or without benefits)
Flex time(flexible start/stop times)
Telework on an ad-hoc basis(meet a repair person, sick child, etc.)
Offered to all employees Offered to some employees Not offered to any employees
Trends in Workplace Flexibility WorldatWork 11
Figure 8: Number of Flexibility Programs Offered (n=375)
Figure 9: “In a previous question, you noted that you do not offer the programs listed below for some
or all employees. Which of the following are primary obstacles to your organization’s adoption of flexibility programs or flexible work arrangements? (Please select all that apply.)”
Flexibility Option Resistance from Top
Management
Resistance from Line Managers
/Supervisors
No Expressed Interested
from Employees
Lack of Jobs that are
Conducive to Flexible Work Arrangements
Other
Telework on an ad-hoc basis (meet a repair person, sick child, etc.) (n=170)
37% 26% 1% 44% 18%
Flex time (flexible start/stop times) (n=166) 42% 25% 2% 54% 11%
Part-time schedules (with or without benefits) (n=180) 21% 15% 12% 53% 14%
Phased return from leave (n=173) 25% 14% 27% 23% 27%
Telework on a regular, monthly basis (at least one day per month, but not full time) (n=252)
49% 26% 5% 37% 18%
Telework on a regular, weekly basis (at least one day per week, but not full time) (n=257)
54% 28% 4% 37% 15%
Shift flexibility (n=261) 20% 15% 14% 45% 20% Compressed workweek (e.g., 4/10, 9/80) (n=255) 44% 20% 10% 36% 19%
Telework full time (every regularly scheduled workday) (n=296)
52% 29% 6% 39% 13%
Phased retirement (n=274) 22% 6% 38% 15% 31%
3% 3%
7%8%
9%
11%13%
12%10%
8% 9%
5%
1%
0 1 2 3 4 5 6 7 8 9 10 11 12Number of Programs
Trends in Workplace Flexibility WorldatWork 12
Job share (n=301) 26% 14% 28% 37% 19% Career on/off ramps (n=297) 20% 9% 39% 17% 30%
Figure 10: Prevalence of Flexibility Programs, by Sector
Flexibility Option All
Respondents (Refer to Figure 1.)
Private sector, publicly traded (stock ticker)
Private sector,
privately held
Nonprofit/not-for-profit or
public sector
n= 375 129 97 65 Average number of programs offered 6.1 6.3 6.4 6.9 Telework on an ad-hoc basis (meet a repair person, sick child, etc.) 85% 90% 90% 83%
Flex time (flexible start/stop times) 82% 88% 79% 86% Part-time schedules (with or without benefits) 82% 80% 83% 97% Phased return from leave 56% 52% 64% 55% Telework on a regular, monthly basis (at least one day per month, but not full time) 56% 58% 56% 51%
Telework on a regular, weekly basis (at least one day per week, but not full time) 53% 52% 56% 52%
Combination of programs tailored to fit employee’s needs 50% 47% 52% 60%
Compressed workweek (e.g., 4/10, 9/80) 48% 47% 40% 60% Shift flexibility 48% 45% 53% 51% Telework full time (every regularly scheduled workday) 34% 29% 36% 34% Phased retirement 30% 29% 31% 28% Job share 21% 23% 14% 29% Career on/off ramps 18% 19% 17% 19%
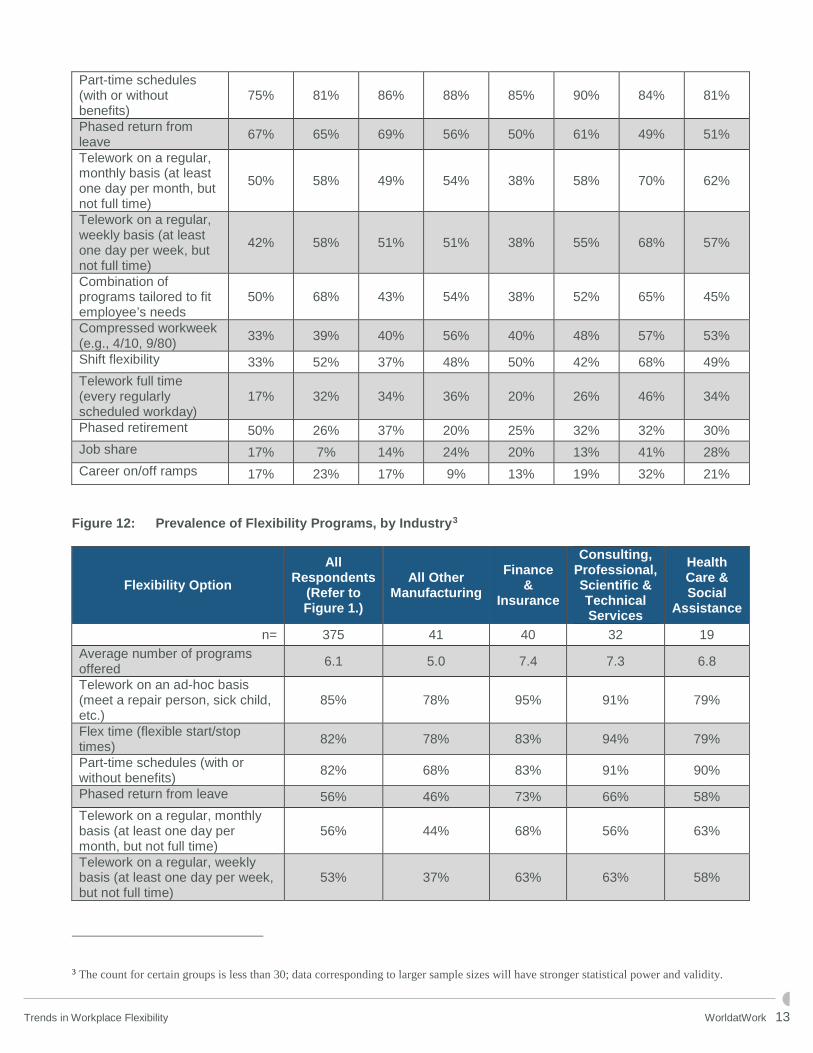
Figure 11: Prevalence of Flexibility Programs, by Organization Size (Number of Employees)2
Flexibility Option Fewer than 100
100-499 500-999 1,000-2,499
2,500-4,999
5,000-9,999
10,000-19,999
20,000 or More
n= 12 31 35 59 40 31 37 47 Average number of programs offered 6.4 6.9 6.0 6.4 5.6 6.4 7.6 6.9
Telework on an ad-hoc basis (meet a repair person, sick child, etc.)
100% 87% 86% 85% 88% 90% 95% 87%
Flex time (flexible start/stop times) 92% 94% 69% 88% 80% 90% 76% 92%
2 The count for certain groups is less than 30; data corresponding to larger sample sizes will have stronger statistical power and validity.
Trends in Workplace Flexibility WorldatWork 13
Part-time schedules (with or without benefits)
75% 81% 86% 88% 85% 90% 84% 81%
Phased return from leave 67% 65% 69% 56% 50% 61% 49% 51%
Telework on a regular, monthly basis (at least one day per month, but not full time)
50% 58% 49% 54% 38% 58% 70% 62%
Telework on a regular, weekly basis (at least one day per week, but not full time)
42% 58% 51% 51% 38% 55% 68% 57%
Combination of programs tailored to fit employee’s needs
50% 68% 43% 54% 38% 52% 65% 45%
Compressed workweek (e.g., 4/10, 9/80) 33% 39% 40% 56% 40% 48% 57% 53%
Shift flexibility 33% 52% 37% 48% 50% 42% 68% 49% Telework full time (every regularly scheduled workday)
17% 32% 34% 36% 20% 26% 46% 34%
Phased retirement 50% 26% 37% 20% 25% 32% 32% 30% Job share 17% 7% 14% 24% 20% 13% 41% 28% Career on/off ramps 17% 23% 17% 9% 13% 19% 32% 21%
Figure 12: Prevalence of Flexibility Programs, by Industry3
Flexibility Option All
Respondents (Refer to Figure 1.)
All Other Manufacturing
Finance &
Insurance
Consulting, Professional, Scientific & Technical Services
Health Care & Social
Assistance
n= 375 41 40 32 19 Average number of programs offered 6.1 5.0 7.4 7.3 6.8
Telework on an ad-hoc basis (meet a repair person, sick child, etc.)
85% 78% 95% 91% 79%
Flex time (flexible start/stop times) 82% 78% 83% 94% 79%
Part-time schedules (with or without benefits) 82% 68% 83% 91% 90%
Phased return from leave 56% 46% 73% 66% 58% Telework on a regular, monthly basis (at least one day per month, but not full time)
56% 44% 68% 56% 63%
Telework on a regular, weekly basis (at least one day per week, but not full time)
53% 37% 63% 63% 58%
3 The count for certain groups is less than 30; data corresponding to larger sample sizes will have stronger statistical power and validity.
Trends in Workplace Flexibility WorldatWork 14
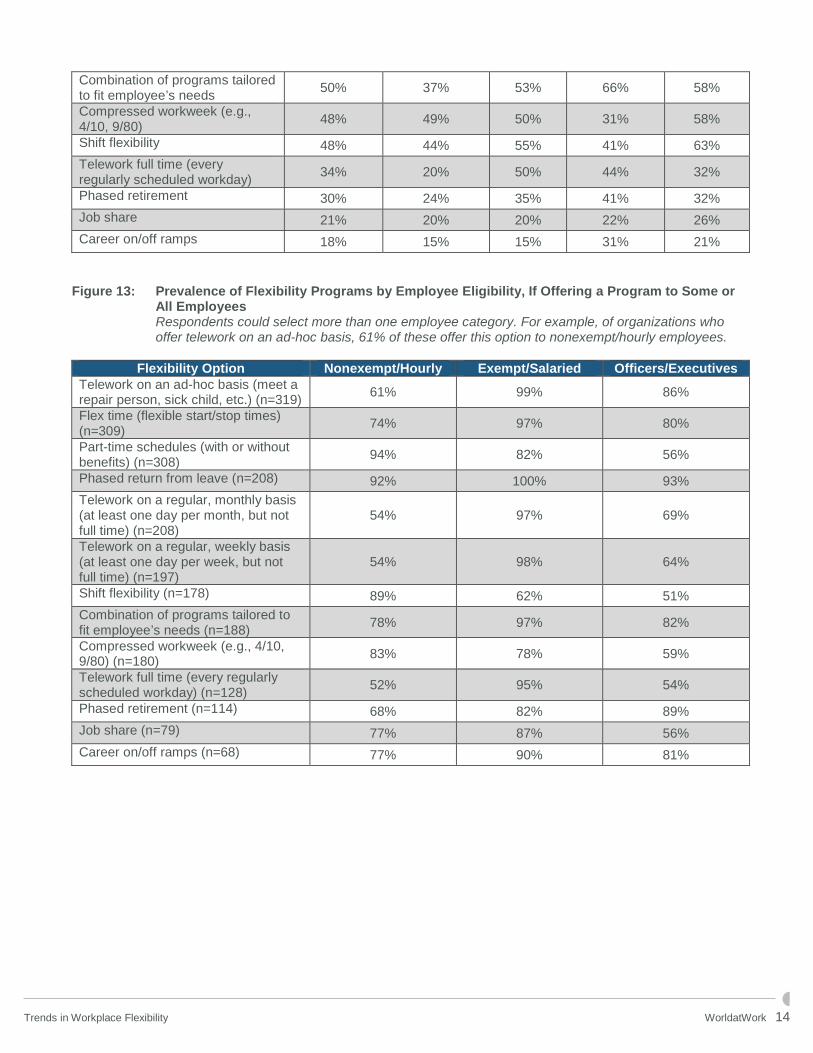
Combination of programs tailored to fit employee’s needs 50% 37% 53% 66% 58%
Compressed workweek (e.g., 4/10, 9/80) 48% 49% 50% 31% 58%
Shift flexibility 48% 44% 55% 41% 63% Telework full time (every regularly scheduled workday) 34% 20% 50% 44% 32%
Phased retirement 30% 24% 35% 41% 32% Job share 21% 20% 20% 22% 26% Career on/off ramps 18% 15% 15% 31% 21%
Figure 13: Prevalence of Flexibility Programs by Employee Eligibility, If Offering a Program to Some or
All Employees Respondents could select more than one employee category. For example, of organizations who
offer telework on an ad-hoc basis, 61% of these offer this option to nonexempt/hourly employees.
Flexibility Option Nonexempt/Hourly Exempt/Salaried Officers/Executives Telework on an ad-hoc basis (meet a repair person, sick child, etc.) (n=319) 61% 99% 86%
Flex time (flexible start/stop times) (n=309) 74% 97% 80%
Part-time schedules (with or without benefits) (n=308) 94% 82% 56%
Phased return from leave (n=208) 92% 100% 93% Telework on a regular, monthly basis (at least one day per month, but not full time) (n=208)
54% 97% 69%
Telework on a regular, weekly basis (at least one day per week, but not full time) (n=197)
54% 98% 64%
Shift flexibility (n=178) 89% 62% 51% Combination of programs tailored to fit employee’s needs (n=188) 78% 97% 82%
Compressed workweek (e.g., 4/10, 9/80) (n=180) 83% 78% 59%
Telework full time (every regularly scheduled workday) (n=128) 52% 95% 54%
Phased retirement (n=114) 68% 82% 89% Job share (n=79) 77% 87% 56% Career on/off ramps (n=68) 77% 90% 81%
Trends in Workplace Flexibility WorldatWork 15
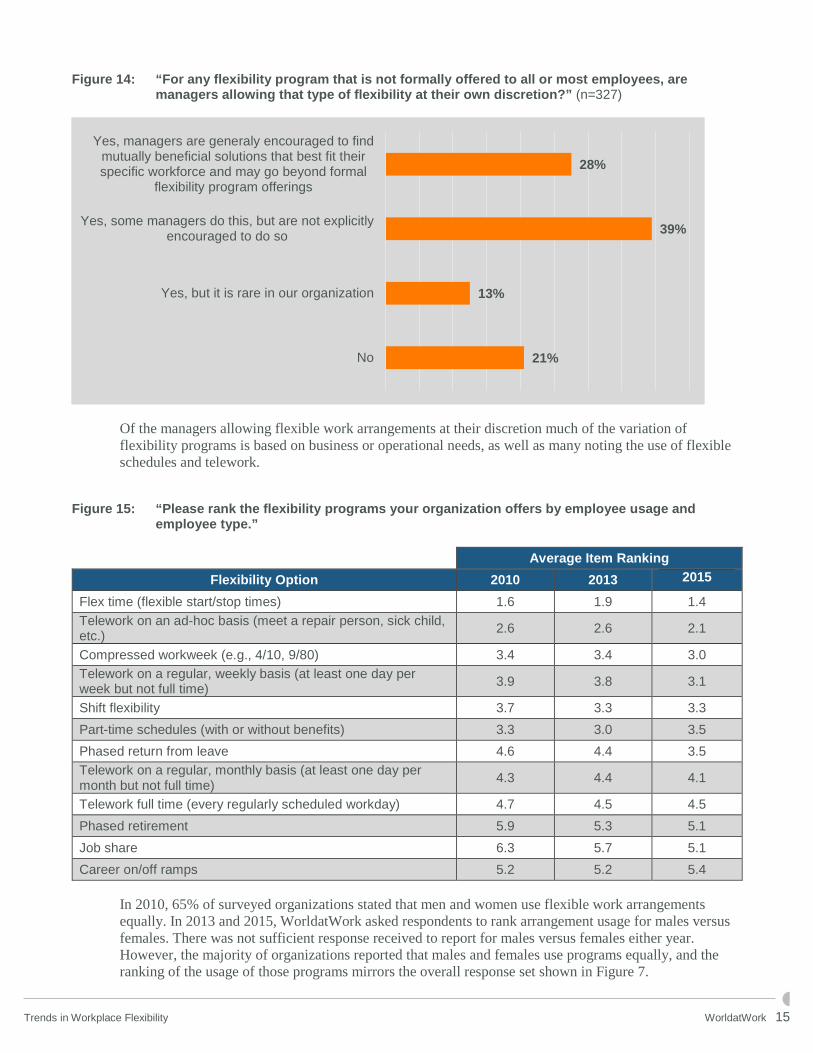
Figure 14: “For any flexibility program that is not formally offered to all or most employees, are managers allowing that type of flexibility at their own discretion?” (n=327)
Of the managers allowing flexible work arrangements at their discretion much of the variation of flexibility programs is based on business or operational needs, as well as many noting the use of flexible schedules and telework.
Figure 15: “Please rank the flexibility programs your organization offers by employee usage and
employee type.”
Average Item Ranking Flexibility Option 2010 2013 2015
Flex time (flexible start/stop times) 1.6 1.9 1.4 Telework on an ad-hoc basis (meet a repair person, sick child, etc.) 2.6 2.6 2.1
Compressed workweek (e.g., 4/10, 9/80) 3.4 3.4 3.0 Telework on a regular, weekly basis (at least one day per week but not full time) 3.9 3.8 3.1
Shift flexibility 3.7 3.3 3.3 Part-time schedules (with or without benefits) 3.3 3.0 3.5 Phased return from leave 4.6 4.4 3.5 Telework on a regular, monthly basis (at least one day per month but not full time) 4.3 4.4 4.1
Telework full time (every regularly scheduled workday) 4.7 4.5 4.5 Phased retirement 5.9 5.3 5.1 Job share 6.3 5.7 5.1 Career on/off ramps 5.2 5.2 5.4
In 2010, 65% of surveyed organizations stated that men and women use flexible work arrangements equally. In 2013 and 2015, WorldatWork asked respondents to rank arrangement usage for males versus females. There was not sufficient response received to report for males versus females either year. However, the majority of organizations reported that males and females use programs equally, and the ranking of the usage of those programs mirrors the overall response set shown in Figure 7.
28%
39%
13%
21%
Yes, managers are generaly encouraged to findmutually beneficial solutions that best fit theirspecific workforce and may go beyond formal
flexibility program offerings
Yes, some managers do this, but are not explicitlyencouraged to do so
Yes, but it is rare in our organization
No
Trends in Workplace Flexibility WorldatWork 16
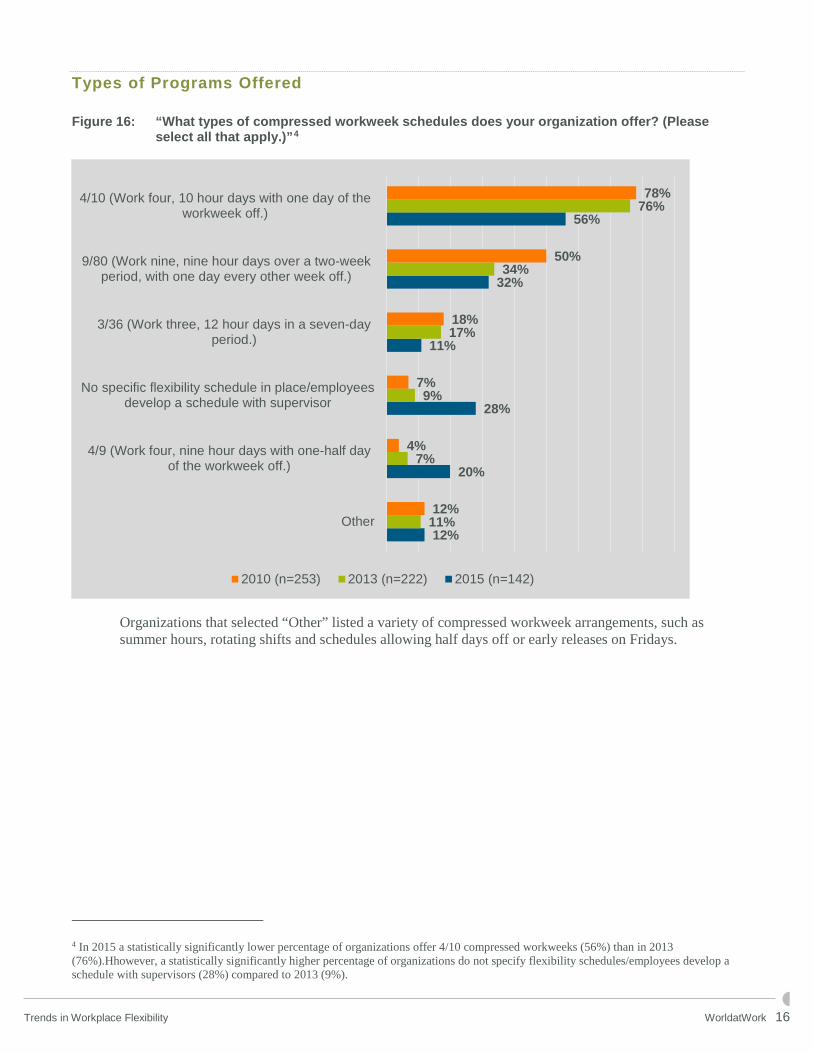
Types of Programs Offered Figure 16: “What types of compressed workweek schedules does your organization offer? (Please
select all that apply.)”4
Organizations that selected “Other” listed a variety of compressed workweek arrangements, such as summer hours, rotating shifts and schedules allowing half days off or early releases on Fridays.
4 In 2015 a statistically significantly lower percentage of organizations offer 4/10 compressed workweeks (56%) than in 2013 (76%).Hhowever, a statistically significantly higher percentage of organizations do not specify flexibility schedules/employees develop a schedule with supervisors (28%) compared to 2013 (9%).
12%
20%
28%
11%
32%
56%
11%
7%
9%
17%
34%
76%
12%
4%
7%
18%
50%
78%
Other
4/9 (Work four, nine hour days with one-half dayof the workweek off.)
No specific flexibility schedule in place/employeesdevelop a schedule with supervisor
3/36 (Work three, 12 hour days in a seven-dayperiod.)
9/80 (Work nine, nine hour days over a two-weekperiod, with one day every other week off.)
4/10 (Work four, 10 hour days with one day of theworkweek off.)
2010 (n=253) 2013 (n=222) 2015 (n=142)
Trends in Workplace Flexibility WorldatWork 17
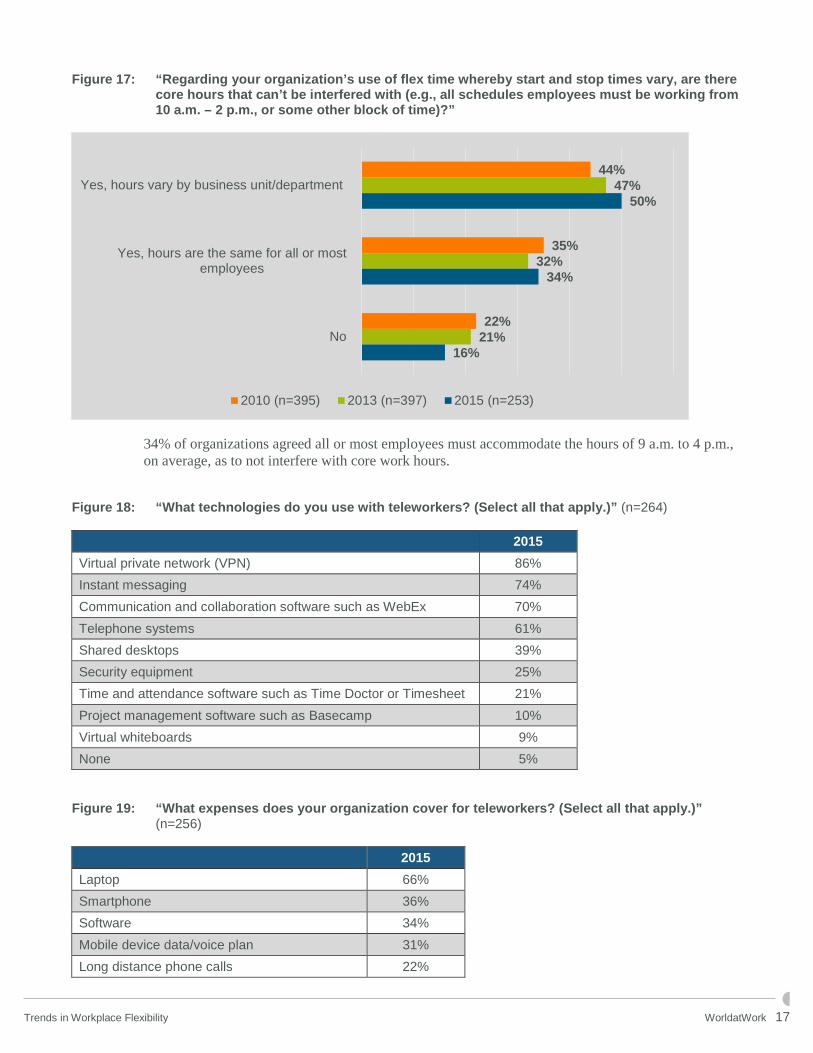
Figure 17: “Regarding your organization’s use of flex time whereby start and stop times vary, are there core hours that can’t be interfered with (e.g., all schedules employees must be working from 10 a.m. – 2 p.m., or some other block of time)?”
34% of organizations agreed all or most employees must accommodate the hours of 9 a.m. to 4 p.m., on average, as to not interfere with core work hours.
Figure 18: “What technologies do you use with teleworkers? (Select all that apply.)” (n=264)
2015 Virtual private network (VPN) 86% Instant messaging 74% Communication and collaboration software such as WebEx 70% Telephone systems 61% Shared desktops 39% Security equipment 25% Time and attendance software such as Time Doctor or Timesheet 21% Project management software such as Basecamp 10% Virtual whiteboards 9% None 5%
Figure 19: “What expenses does your organization cover for teleworkers? (Select all that apply.)”
(n=256)
2015 Laptop 66% Smartphone 36% Software 34% Mobile device data/voice plan 31% Long distance phone calls 22%
44%
35%
22%
47%
32%
21%
50%
34%
16%
Yes, hours vary by business unit/department
Yes, hours are the same for all or mostemployees
No
2010 (n=395) 2013 (n=397) 2015 (n=253)
Trends in Workplace Flexibility WorldatWork 18
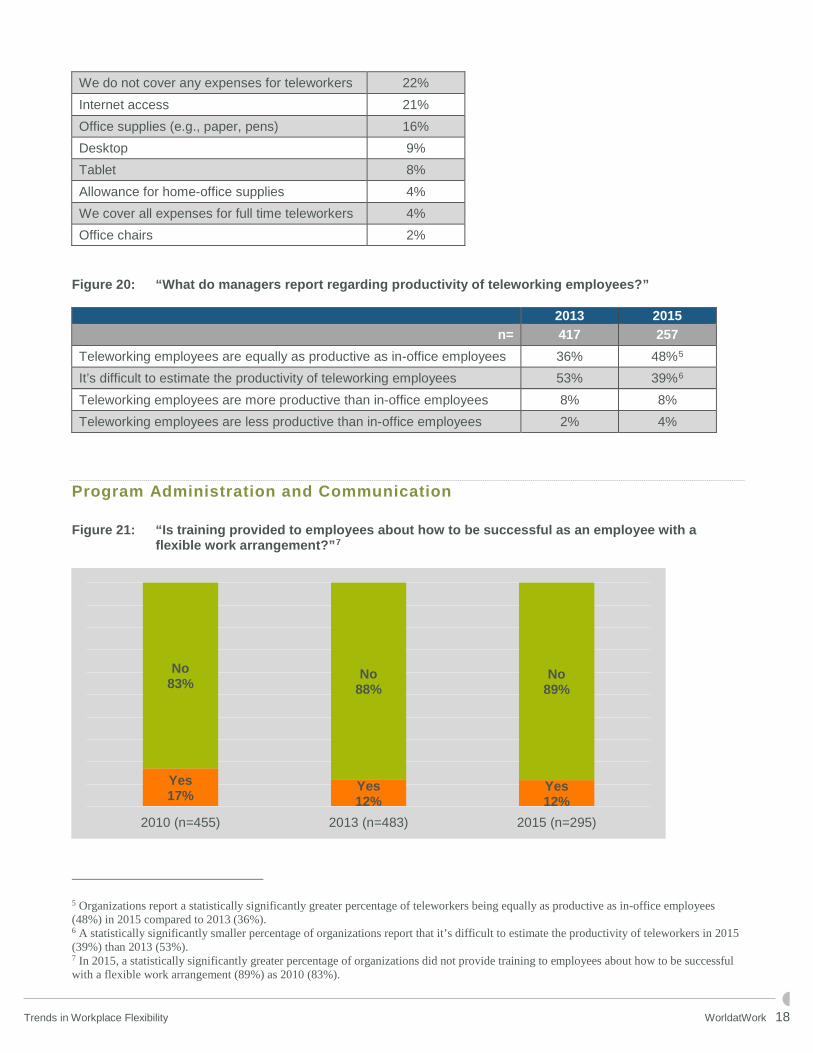
We do not cover any expenses for teleworkers 22% Internet access 21% Office supplies (e.g., paper, pens) 16% Desktop 9% Tablet 8% Allowance for home-office supplies 4% We cover all expenses for full time teleworkers 4% Office chairs 2%
Figure 20: “What do managers report regarding productivity of teleworking employees?”
2013 2015 n= 417 257
Teleworking employees are equally as productive as in-office employees 36% 48%5 It’s difficult to estimate the productivity of teleworking employees 53% 39%6 Teleworking employees are more productive than in-office employees 8% 8% Teleworking employees are less productive than in-office employees 2% 4%
Program Administration and Communication Figure 21: “Is training provided to employees about how to be successful as an employee with a
flexible work arrangement?”7
5 Organizations report a statistically significantly greater percentage of teleworkers being equally as productive as in-office employees (48%) in 2015 compared to 2013 (36%). 6 A statistically significantly smaller percentage of organizations report that it’s difficult to estimate the productivity of teleworkers in 2015 (39%) than 2013 (53%). 7 In 2015, a statistically significantly greater percentage of organizations did not provide training to employees about how to be successful with a flexible work arrangement (89%) as 2010 (83%).
Yes12%
Yes12%
Yes17%
No89%
No88%
No83%
2015 (n=295)2013 (n=483)2010 (n=455)
Trends in Workplace Flexibility WorldatWork 19
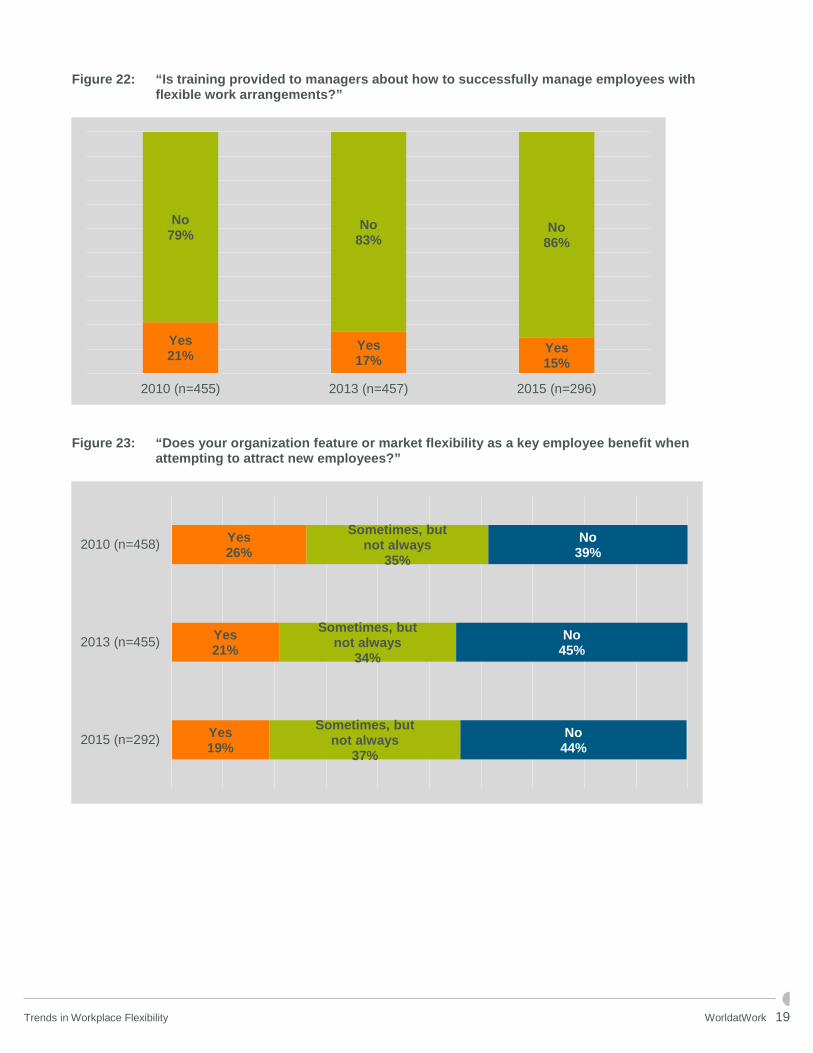
Figure 22: “Is training provided to managers about how to successfully manage employees with flexible work arrangements?”
Figure 23: “Does your organization feature or market flexibility as a key employee benefit when
attempting to attract new employees?”
Yes15%
Yes17%
Yes21%
No86%
No83%
No79%
2015 (n=296)2013 (n=457)2010 (n=455)
Yes 19%
Yes 21%
Yes 26%
Sometimes, but not always
37%
Sometimes, but not always
34%
Sometimes, but not always
35%
No 44%
No 45%
No 39%
2015 (n=292)
2013 (n=455)
2010 (n=458)
Trends in Workplace Flexibility WorldatWork 20
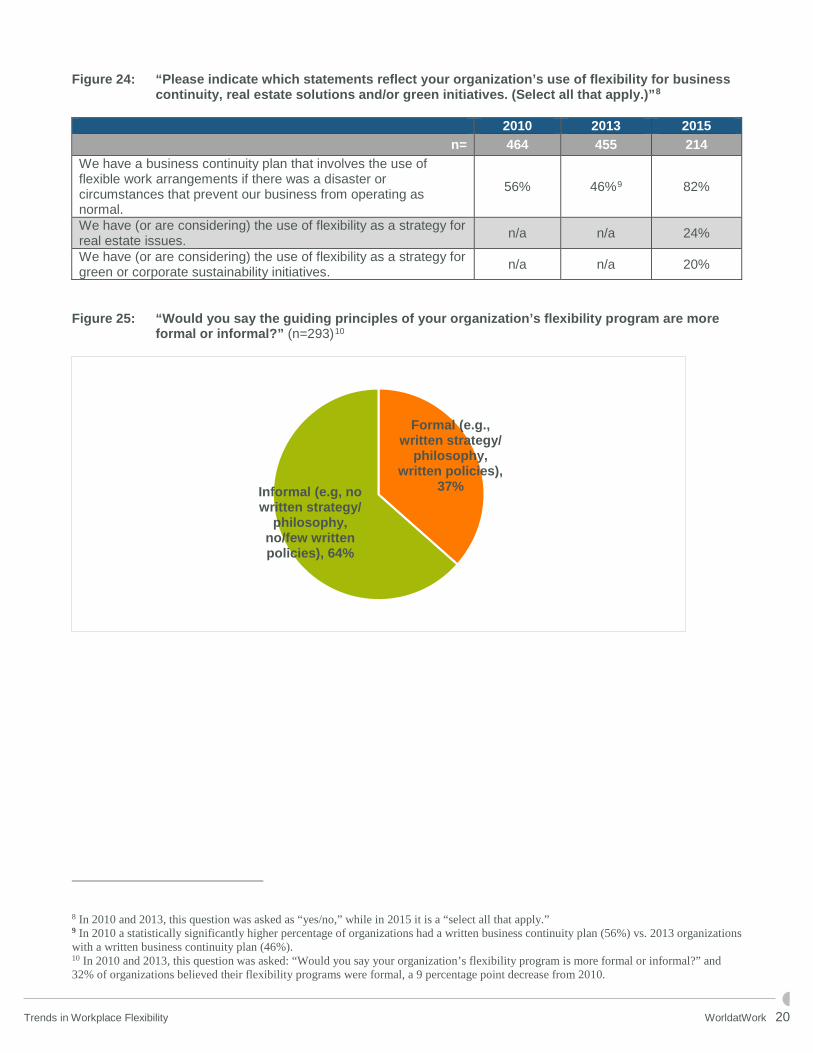
Figure 24: “Please indicate which statements reflect your organization’s use of flexibility for business continuity, real estate solutions and/or green initiatives. (Select all that apply.)”8
2010 2013 2015
n= 464 455 214 We have a business continuity plan that involves the use of flexible work arrangements if there was a disaster or circumstances that prevent our business from operating as normal.
56% 46%9 82%
We have (or are considering) the use of flexibility as a strategy for real estate issues. n/a n/a 24%
We have (or are considering) the use of flexibility as a strategy for green or corporate sustainability initiatives. n/a n/a 20%
Figure 25: “Would you say the guiding principles of your organization’s flexibility program are more
formal or informal?” (n=293)10
8 In 2010 and 2013, this question was asked as “yes/no,” while in 2015 it is a “select all that apply.” 9 In 2010 a statistically significantly higher percentage of organizations had a written business continuity plan (56%) vs. 2013 organizations with a written business continuity plan (46%). 10 In 2010 and 2013, this question was asked: “Would you say your organization’s flexibility program is more formal or informal?” and 32% of organizations believed their flexibility programs were formal, a 9 percentage point decrease from 2010.
Formal (e.g., written strategy/
philosophy, written policies),
37%Informal (e.g, no written strategy/
philosophy, no/few written policies), 64%
Trends in Workplace Flexibility WorldatWork 21
Figure 26: “Would you say the administration of your organization’s flexibility program is more formal or informal?” (n=293)
Program Strategy and Measures Figure 27: “Using the scale below, how would you rate the culture of flexibility at your organization?”
Using the self-assessed flexibility scale, participants with a score below 2.5 were categorized as nonexistent-inconsistent, and those with a score of 2.5 and above were categorized as strategic-embedded.
Nonexistent Inconsistent Strategic Deeply Embedded • Flexibility is rarely
used, if at all, and is not viewed as an important element in attracting, motivating and retaining employees, nor achieving organizational success.
• Flexibility is viewed as a special perk, if allowed at all.
• We have some formal programs and policies, but they are not widely applied.
• Some departments use flexible work arrangements, but their use is inconsistent and not organizationwide.
• Flexibility options are limited and may still be viewed as a special perk.
• Flexibility is strategic and viewed as an essential element in achieving organization success, and is widely used around the organization.
• However, formalities in the process or policy may limit the use of flexibility.
• The concept of workplace flexibility is part of our organization’s culture.
• There is universal access to flexibility and it is integrated into the everyday work environment.
• Employees feel free to request flexibility as needed and managers are encouraged to be “flexible” as they work in partnership with employees to find solutions that lead to employee and organizational success.
Formal (e.g., employee request forms, approval channels), 28%
Informal (e.g., no forms, discretion of manager), 72%
1.0 2.5 4.0
Trends in Workplace Flexibility WorldatWork 22
Degree of Flexibility Culture 2010 2013 2015 n= 470 465 305
Nonexistent-inconsistent (less than 2.5) 64% 71% 67% Strategic-embedded (greater than or equal to 2.5) 36% 29% 33%
Figure 28: “Which statement best describes your organization’s flexibility strategy or philosophy?”
(n=302)
Figure 29: “How widespread is the access to flexible work arrangements at your organization?” (n=290)
53%
29%
19%
We have no flexibility strategy orphilosophy
We have a flexibility strategy orphilosophy, but it is not formally
documented
We have a formal, writtenflexibility strategy or philosophy
35%
41%
25%
Flexible work arrangements are available on alimited, case-by-case basis only; there is no
widespread access
Flexible work arrangements are available in someworkforce segments or departments, but not all
Flexible work arrangements are possible in mostor all workforce segments or departments
Trends in Workplace Flexibility WorldatWork 23
Figure 30: “What portion of your managers/leaders buy in to the idea that flexibility is an essential element to organizational success?” (n=291)
Figure 31: “When managers are hired/promoted, is their propensity for managing in a flexible work
environment considered?” (n=288)
Figure 32: “Do stated performance objectives for managers typically include goals that encourage
consideration and/or use of flexibility options by their employees?” (n=296)
6%
42%
22%
26%
5%
Virtually no managers/leaders
A small portion of our managers/leaders
About half of our managers/leaders
Most managers/leaders
Virtually all managers/leaders
5%
19%
76%
Yes, most/all of the itme
Yes, sometimes
No
2%
5%
93%
Yes, most/all of the time
Yes, sometimes
No
Trends in Workplace Flexibility WorldatWork 24
Figure 33: “Does your organization attempt to quantify ROI of your employee flexibility programs (e.g., on productivity, customer satisfaction, product quality)?”
Figure 34: “What would your workforce say is the effect of your organization’s flexibility programs on:” Negative or
Extremely Negative Effect
No Effect or Neutral Positive or
Extremely Positive Effect
Employee engagement (n=284) 12% 29% 60% Employee motivation (n=283) 9% 35% 57% Employee satisfaction (n=284) 9% 23% 68%
Yes3%
Yes4%
Yes7%
No97%
No96%
No93%
2015 (n=289)2013 (n=446)2010 (n=451)
Trends in Workplace Flexibility WorldatWork 25
Figure 35: “What would your workforce say is the impact of the use of flexibility on career progression or development opportunities if all other things are equal?”11
Figure 36: “What is the likelihood that your organization will adopt one or more flexibility/flexible work
arrangements in the next two years?”12 Very Unlikely or
Unlikely Undecided Very Likely or Likely
2010 (n=12) 50% 33% 17% 2013 (n=7) 86% 14% 0% 2015 (n=10) 80% 10% 10%
11 In 2013, the question was posed slightly differently: “Does the use of flexibility by an employee have any impact on career progression or development opportunities if all other things are equal?” 12 The count for these groups are less than 30; data corresponding to larger sample sizes will have stronger statistical power and validity.
4%
70%
6%
21%
7%
69%
3%
20%
18%
53%
10%
19%
Positive effect; employee has more opportunities
No effect/neutral; opportunities are not affectedby use of flexibility by employee
Negative effect; employee has feweropportunities
Varies by department and/or hiring manager
2010 (n=454) 2013 (n=484) 2015 (n=282)
Trends in Workplace Flexibility WorldatWork 26
Additional Analysis Figure 37: Perceived Impact of Flexibility on Engagement, Motivation and Satisfaction, by Degree of
Flexibility Culture13
Degree of Flexibility Culture
Effect on Employee Engagement Nonexistent-Inconsistent (n=184) Strategic-Embedded) (n=100)
Extremely negative/negative 16% 4% No effect or neutral 38% 11% Extremely positive/positive 46% 85%
Degree of Flexibility Culture
Effect on Employee Motivation Nonexistent-Inconsistent (n=183) Strategic-Embedded (n=100)
Extremely negative/negative 13% 1% No effect or neutral 39% 26% Extremely positive/positive 48% 73%
Degree of Flexibility Culture
Effect on Employee Satisfaction Nonexistent-Inconsistent (n=184) Strategic-Embedded (n=100)
Extremely negative/negative 13% 1% No effect or neutral 32% 8% Extremely positive/positive 56% 91%
Figure 38: Degree of Flexibility Culture, by Voluntary Turnover
13 See page 22 for scale.
20%
27%
42%
41%
39%
32%
Nonexistent-Inconsistent
Strategic-Embedded
0% to 5% (low) 6% to 10% (mid) 11% and over (high)
Trends in Workplace Flexibility WorldatWork 27
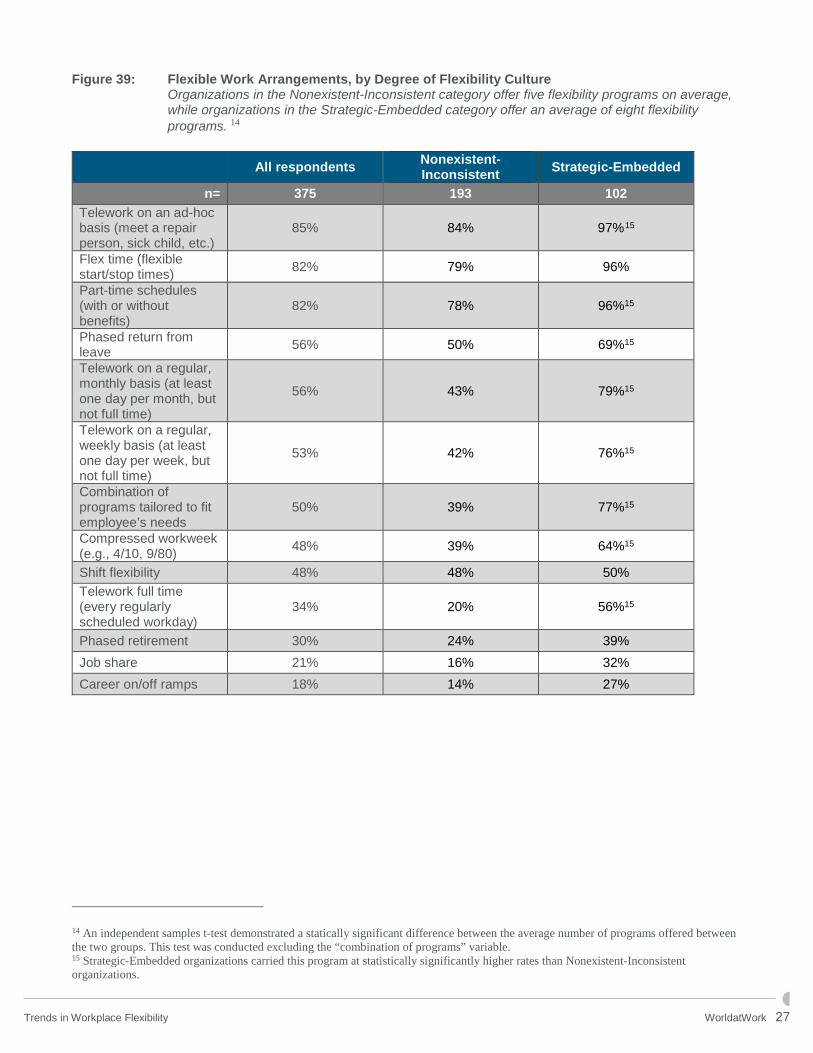
Figure 39: Flexible Work Arrangements, by Degree of Flexibility Culture Organizations in the Nonexistent-Inconsistent category offer five flexibility programs on average, while organizations in the Strategic-Embedded category offer an average of eight flexibility programs. 14
All respondents Nonexistent-
Inconsistent Strategic-Embedded
n= 375 193 102 Telework on an ad-hoc basis (meet a repair person, sick child, etc.)
85% 84% 97%15
Flex time (flexible start/stop times) 82% 79% 96%
Part-time schedules (with or without benefits)
82% 78% 96%15
Phased return from leave 56% 50% 69%15
Telework on a regular, monthly basis (at least one day per month, but not full time)
56% 43% 79%15
Telework on a regular, weekly basis (at least one day per week, but not full time)
53% 42% 76%15
Combination of programs tailored to fit employee’s needs
50% 39% 77%15
Compressed workweek (e.g., 4/10, 9/80) 48% 39% 64%15
Shift flexibility 48% 48% 50% Telework full time (every regularly scheduled workday)
34% 20% 56%15
Phased retirement 30% 24% 39% Job share 21% 16% 32% Career on/off ramps 18% 14% 27%
14 An independent samples t-test demonstrated a statically significant difference between the average number of programs offered between the two groups. This test was conducted excluding the “combination of programs” variable. 15 Strategic-Embedded organizations carried this program at statistically significantly higher rates than Nonexistent-Inconsistent organizations.
Trends in Workplace Flexibility WorldatWork 28
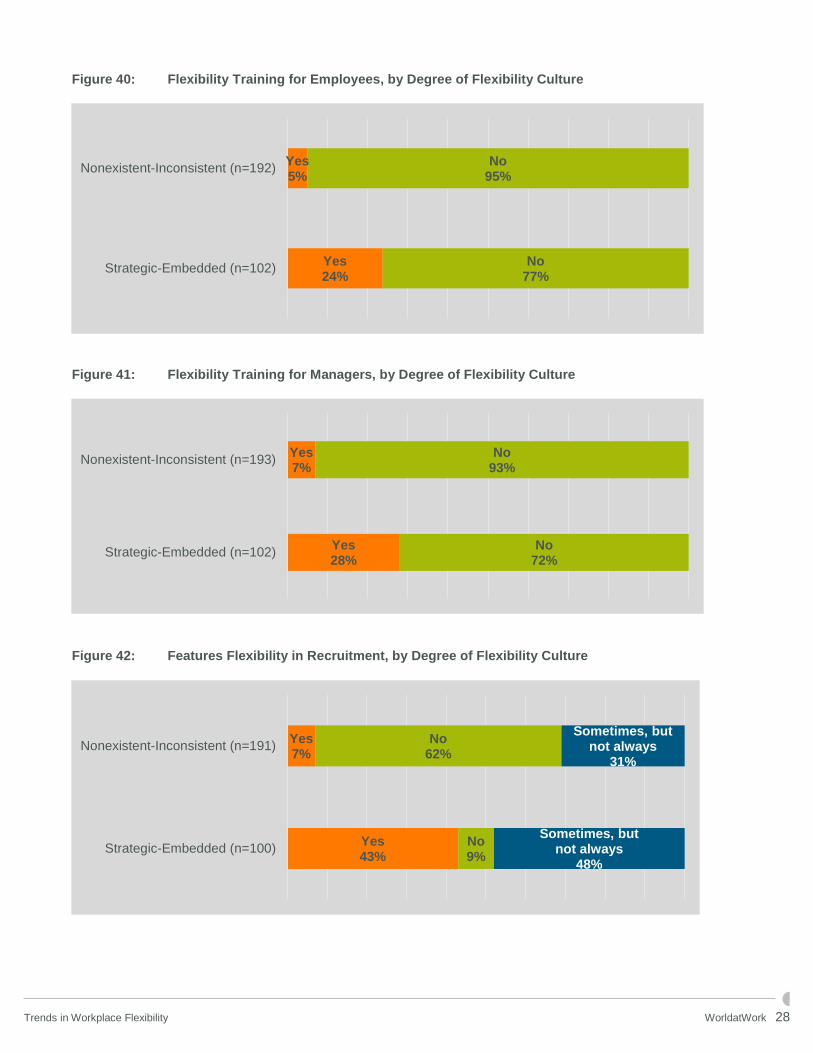
Figure 40: Flexibility Training for Employees, by Degree of Flexibility Culture
Figure 41: Flexibility Training for Managers, by Degree of Flexibility Culture
Figure 42: Features Flexibility in Recruitment, by Degree of Flexibility Culture
Yes5%
Yes24%
No95%
No77%
Nonexistent-Inconsistent (n=192)
Strategic-Embedded (n=102)
Yes7%
Yes28%
No93%
No72%
Nonexistent-Inconsistent (n=193)
Strategic-Embedded (n=102)
Yes7%
Yes43%
No62%
No9%
Sometimes, but not always
31%
Sometimes, but not always
48%
Nonexistent-Inconsistent (n=191)
Strategic-Embedded (n=100)
Trends in Workplace Flexibility WorldatWork 29
Figure 43: Access to Flexible Work Arrangements, by Degree of Flexibility Culture
49%
41%
10%
6%
40%
54%
Flexible work arrangements are available on alimited case-by-case basis only; there is no
widespread access
Flexible work arrangements are available in someworkforce segments or departments, but not all
Flexible work arrangements are possible in mostor all workforce segments or departments
Nonexistent-Inconsistent (n=191) Strategic-Embedded (n=99)
Trends in Workplace Flexibility WorldatWork 30
Participating Organizations
2020 AAM Abt Associates ACS Technologies AgStar Financial Services Alaska Airlines Alkermes Alta Resources American Family Insurance Amplify Federal Credit Union Anheuser-Busch Employees' Credit Union ANSYS Inc. Aon Apogee Enterprises Inc. Associated Universities Inc. Astron Solutions Atlantic Central AutoNation Avendra LLC Barclaycard Barry Callebaut Baxter Corporation Canada BBA Aviation Big Heart Pet Brands Bill Barrett Corp. Blue Cross Blue Shield of Arizona Blue Diamond Growers BMC Software Bridgestone Americas Bristow Group Inc. BRP Inc. Build-A-Bear Workshop Campbell & Company LP Canadian Pharmacists Association Canon USA Canon Virginia Inc. Capital One Cars.com CIMA+ Citizens Property Insurance Corp. City of Philadelphia City of Calgary City of Kitchener Community Coffee Company LLC Connecticut Children's Medical Center Continental Automotive Systems Inc. CoreLink Administrative Solutions CST Brands Inc. Dalhousie University Delta Dental of Michigan Employers Resource Association
Encana Equinix Equity Office Ericsson Fannie Mae Farm Credit Services of America Federal Deposit Insurance Corp. Federal Reserve Bank of Kansas City Fellowes Inc. Fike Corp. First West Credit Union FirstEnergy Frank's International FutureSense Inc. GameStop Gilead Sciences Glazer's Inc. Grande Cheese Co. GreenStone Farm Credit Services GROWMARK Inc. HCC Insurance Holdings Inc. Helmerich & Payne Inc. Hess Honda of South Carolina HR Solutions Group of West Michigan HubSpot Hunter Douglas Inc. Hutchinson Technology Inc. Hyundai Capital Canada Inc. ICW Group Idaho National Laboratory IMI Precision Engineering Ingersoll Rand PLC Institute for Defense Analyses Intact Financial Corp. Ironwood Pharmaceuticals Jordan Valley Water Conservancy District Kellogg Kennedy Health Kettering Health Network Lancaster General Health LDS Church Level 3 Communications LG&E LifeWay Christian Resources LL Global LMI Longnecker & Associates LoyaltyOne Manulife/John Hancock Mary Kay Inc.
Trends in Workplace Flexibility WorldatWork 31
Maui Jim Inc. McCormick & Company Inc. McGladrey MICROMO Electronics Inc. MidCountry Financial Missouri Department of Conservation MVP Health Care MWH Global Nasdaq National Fuel Gas National Renewable Energy National Security Agency NEC Corporation of America Nordson Corp. NorthStar Financial Services Group LLC Novartis OCI Enterprises Inc. OhioHealth OHL Olympus Corporation of the Americas On Assignment Inc. ON Semiconductor Orora Oshkosh Corp. Owens Corning LLC Peabody Energy Pick n Pay Piramal Enterprises Limited Points Athabasca Contracting LP PwC Regency Centers Rhode Island School of Design Robertshaw Ryerson University Safety National Casualty Corp. Salt River Project Samsung Santee Cooper Saskatchewan Indian Gaming Authority Savannah River Remediation Schwan's Shared Services LLC
Shell Oil Smith & Nephew Snapchat Inc. Splunk St. Lawrence Seaway Management Corporation Stage Stores Inc. StandardAero State of Colorado STIHL Inc. Stonegate Mortgage Corp. Teacher Retirement System of Texas Teekay Corp. The Boeing Co. The Croner Co. The Samuel Roberts Noble Foundation Inc. The Taubman Co. The Warranty Group Toyota Motor Sales USA Inc. TransAlta Corp. UFA ULTA Union County Local Government United Data Technologies United Service Organizations Inc. University of Michigan Hospitals & Health Centers University of Minnesota Physicians University of Missouri University of St. Thomas Urban Science Vail Valley Medical Center Vantiv Virbac Vodafone Waggener Edstrom Communications Western National Insurance Group Wolseley Canada Xavier University Xylem Inc. Yellow Pages (Canada) YKK Corporation of America YMCA of Greater Rochester