Embed Size (px)
Citation preview

Memorandumfor the House of CommonsInternational Development Committee
Trends in total UK Official Development Assistance and the Department for International Development’s expenditure
DECEMBER 2015

Our vision is to help the nation spend wisely.
Our public audit perspective helps Parliament hold government to account and improve public services.
The National Audit Office scrutinises public spending for Parliament and is independent of government. The Comptroller and Auditor General (C&AG), Sir Amyas Morse KCB, is an Officer of the House of Commons and leads the NAO, which employs some 810 people. The C&AG certifies the accounts of all government departments and many other public sector bodies. He has statutory authority to examine and report to Parliament on whether departments and the bodies they fund have used their resources efficiently, effectively, and with economy. Our studies evaluate the value for money of public spending, nationally and locally. Our recommendations and reports on good practice help government improve public services, and our work led to audited savings of £1.15 billion in 2014.

This document can be found on the National Audit
Office website at www.nao.org.uk
For further information about the National Audit Office
please contact:
National Audit Office
Press Office
157-197 Buckingham Palace Road
Victoria
London
SW1W 9SP
Tel: 020 7798 7400
Email: [email protected]
Contents
Introduction and summary 4
Objective of this memorandum 4
Key points 5
Part One 7
How has UK ODA grown and what is the split between DFID and other departments? 7
Part Two 10
How much ODA goes to multilateral organisations? 10
Part Three 13
What type of organisations receive DFID’s bilateral aid? 13
Part Four 16
What is the focus of DFID’s country programmes? 16
Part Five 19
What is the income level of countries that receive UK bilateral ODA? 19
Part Six 22
How much do DFID's teams spend? 22
Part Seven 25
How have DFID's operating costs changed? 25

4 Introduction and summary Trends in total UK Official Development Assistance and the
Department for International Development’s expenditure
Introduction and summary
Objective of this memorandum
1 The International Development Committee (the Committee) is considering the
resource allocation processes used by the Department for International Development
(DFID).
2 This memorandum provides an overview of trends in spending on aid. It is in 7
parts. It has been designed to complement a note by the Independent Commission for
Aid Impact on DFID’s approach to resource allocation.
3 This memorandum draws on, and updates, our recent work for the Committee, in
particular our Short Guide to DFID,1 and the Comptroller and Auditor General's report
on DFID’s management of the Official Development Assistance target.2
4 This memorandum uses Official Development Assistance (ODA) data published
each year by DFID, most recently in December 2015.3 ODA is the internationally
agreed definition of aid spending and is measured for a calendar year. We also draw
on other data published by DFID for its financial year spending where these data
provide more detail than is available from ODA data.4 All financial values in this
memorandum are in cash (i.e. nominal terms), consistent with the sources.
1 National Audit Office, A Short Guide to the Department for International Development, July 2015. 2 Comptroller and Auditor General, Department for International Development: Managing the Official Development Assistance target, Session 2014-15, HC 950, National Audit Office, January 2015. 3 Department for International Development, Statistics on International Development 2015, December 2015. 4 We use values included in DFID's Annual Report and Accounts and in its statistics Gross Public Expenditure (GPEX) on international development.

Trends in total UK Official Development Assistance and the Department for International
Development’s expenditure Introduction and summary 5
Key points
Composition and trends in total UK ODA
5 Total UK ODA rose by 30% to £11,424 million in 2013 as the UK spent 0.7% of
gross national income (GNI) on overseas aid for the first time. In 2014 ODA grew by
3% to £11,726 million and for the second year the UK spent 0.7% of GNI on aid
(paragraph 1.1 and Figure 1).
6 In 2014, DFID ODA was £10,084 million, 86% of total UK ODA. Between 2009
and 2013, DFID's share of total UK ODA ranged from 87% to 90%. The proportion fell
to 86% in 2014 because of changes in the way the UK's contribution to European
Union (EU) development spending was allocated to UK government departments’
budgets (paragraphs 1.2 to 1.3 and Figure 1).
7 There were 4 main sources of non-DFID ODA in 2014. Non-DFID ODA
totalled £1,642 million in 2014. Over 70% of this was accounted for by the EU (£442
million), the Foreign & Commonwealth Office (£366 million), the Department of Energy
& Climate Change (£192 million) and the Conflict Pool (£180 million).5 Of the other
elements of non-DFID ODA, Home Office ODA grew the most in 2014, to £136 million.
This followed a review that increased the range of Home Office funded activities that
are included as ODA. Most of the Home Office's ODA supports refugees in the UK
(paragraphs 1.4 to 1.5, and Figure 2).
8 Core funding to multilateral organisations is growing quicker than bilateral
ODA. In 2014, multilateral ODA accounted for 42% of all ODA, up 8 percentage points
from 2009. The EU and the World Bank are the main recipients of UK multilateral
ODA. Together, these accounted for 58% of the total in 2014 (paragraphs 2.2 to 2.4
and Figures 3 and 4).
9 The proportion of country-specific bilateral ODA going to low-income
countries has been more than 60% in each of the 4 years to 2014. DFID reported
the benefiting country for just over £4,000 million of the UK's 2014 bilateral ODA. Of
this, 64% went to the least developed countries and other low-income countries. While
DFID's country-specific bilateral ODA goes mainly to low-income-countries (68% in
2014), most non-DFID country-specific bilateral ODA goes to lower-middle-income
countries (59%) or upper-middle-income countries (13%) (paragraphs 5.1 to 5.2 and
5.5 to 5.6 and Figures 9 and 10).
Composition and trends in DFID's spending
10 In 2014, over 60% of all DFID's ODA was routed through multilateral
organisations. DFID gave multilateral organisations £4,218 million in core funding in
2014 to use in line with their mandate. DFID also gave multilateral organisations
£2,031 million to undertake activities in specific countries or regions or for a specific
purpose (paragraph 2.5 and Figure 5).
11 Within DFID's bilateral programme, humanitarian assistance has grown
5 From April 2015, the Conflict Pool became the Conflict, Stability and Security Fund.

6 Introduction and summary Trends in total UK Official Development Assistance and the
Department for International Development’s expenditure
more quickly than development spending. Between 2011-12 and 2013-14,
humanitarian assistance grew by 145% to reach £866 million. Over the same period,
bilateral development spending grew by 21% to reach £4,658 million. Spending on
technical cooperation was the element of DFID's bilateral development programme
that grew the fastest between 2011-12 and 2013-14 – up 71% to £901 million.
Development spending through partner governments was £1,168 million in 2013-14,
similar to the level in 2009-10 (paragraphs 3.2 to 3.6, and Figure 6).
12 Around a third of DFID's total spending is managed by the teams
responsible for its 28 priority country programmes, with most of this spending
concentrated on a small number of countries. In 2014-15, five countries accounted
for 41% of total country programme spending of £3,131 million, with the top 10
countries accounting for two thirds. Eight countries have been in the largest 10
programmes in each of the last 5 years (paragraphs 4.2 to 4.4 and Figure 7).
13 DFID's country programme spending is increasingly in fragile countries. In
2010-11, fragile countries accounted for 73% of DFID's country programme spending;
by 2014-15, this had risen to 84%. DFID had 5 programmes in excess of £50 million in
non-fragile countries in 2014-15 (paragraph 4.6 and Figure 8).
14 DFID lived within limits HM Treasury set for its operating costs for the 4 years to
2014-15. Over this period, DFID's operating costs grew by 21% in cash terms (13% in
real terms) to reach £228 million, as it increased its staffing to manage its larger aid
programme. DFID's overall spending grew at a faster rate (26%) to £9,777 million. As
a result, the proportion of DFID's total spending used to meet its operating costs
fell slightly from 2.4% in 2010-11 to 2.3% in 2014-15 (paragraphs 7.2 and 7.6, and
Figures 12 and 13).

Trends in total UK Official Development Assistance and the Department for International
Development’s expenditure Part One 7
Part One
How has UK ODA grown and what is the split between DFID and other departments?
ODA rose rapidly in 2013 but returned to lower growth in 2014
1.1 Official Development Assistance (ODA) is reported on a calendar year basis.
Between 2012 and 2013, ODA rose by 30% to £11,424 million as the UK spent 0.7%
of gross national income (GNI) on overseas aid for the first time (Figure 1). In 2014,
ODA grew by 3% to £11,726 million, and the UK spent 0.7% of GNI on aid for a
second time based on the method of calculating GNI that was in place when 2014
departmental budgets were set in 2010.6
Figure 1: Total UK ODA and the split between DFID’s ODA and other ODA
Source: Department for International Development, Statistics on International Development 2015, December 2015,
Additional tables, Table A2.
6 The Department reported in December 2015 that, based on the National Accounts methodology for GNI (ESA 1995 unadjusted) that was in use in 2010 when spending decisions were made, the ODA:GNI ratio for 2014 is 0.70. It also reported that, based on the latest National Accounts methodology for estimating GNI (ESA 2010), the ODA:GNI ratio for 2014 is 0.66. The equivalent figures for the 2013 ODI:GNI ratio were 0.70% and 0.67%.
2009 2010 2011 2012 2013 2014
Total ODA 7,301 8,529 8,629 8,802 11,424 11,726
Non-DFID ODA 927 1,066 906 1,184 1,409 1,642
DFID ODA 6,374 7,463 7,722 7,618 10,016 10,084
87.3%87.5% 89.5% 86.5%
87.7% 86.0%
12.7%
12.5% 10.5% 13.5%
12.3% 14.0%
0
2,000
4,000
6,000
8,000
10,000
12,000
£ million

8 Part One Trends in total UK Official Development Assistance and the Department for
International Development’s expenditure
DFID accounted for 86% of total ODA in 2014
1.2 The proportion of total ODA spent by the Department for International
Development (DFID) was between 87% and 90% in the 5 years to 2013 (Figure 1). In
2014, the proportion fell slightly to 86%.
1.3 The reduction in 2014 was due to changes in the way the UK's support for the
European Union's (EU) development spending on ODA-eligible countries is split
between DFID and other department.7 Most of the UK’s support to EU development
spending is funded from the UK’s contribution to the main EU budget (see paragraph
2.4). HM Treasury decides how this contribution is split between UK departments.
Over 70% of non-DFID ODA is accounted for by the EU, FCO,
DECC and the Conflict Pool
1.4 In 2014, non-DFID ODA totalled £1,642 million. Of the 17 different elements of
non-DFID ODA in 2014, four accounted for 72% of the total (Figure 2).
The sums attributed to other government departments for the EU's development
spending rose from £124 million in 2013 to £442 million in 2014. This increase
reflected changes in HM Treasury’s approach to attribution (paragraph 1.3).
The Foreign & Commonwealth Office (FCO) was the department that contributed
the highest amount of ODA in 2014 after DFID, some £366 million. FCO's ODA
includes some of the funding it provides to the British Council, the cost of
diplomatic activities in support of aid programmes and contributions to
multilateral organisations.
The Department of Energy & Climate Change's (DECC) ODA fell by over half to
£192 million in 2014. DECC’s ODA includes contributions to the Climate
Investment Funds.8
ODA spending by the Conflict Pool in 2014 was £180 million, including £29
million through DFID. The Conflict Pool – now the Conflict, Stability and Security
Fund – is managed jointly by DFID, FCO and the Ministry of Defence.9
7 Department for International Development, Statistics on International Development 2015, December 2015, page 13. 8 The Climate Investment Funds help 72 developing countries to pilot low-emissions and climate-resilient development. They are administered by multilateral development banks. 9 The Conflict Pool has been the principal mechanism by which the government has allocated joint resources in support of its commitments to prevent and tackle conflict through discretionary conflict prevention, stabilisation, and peacekeeping activities.

Trends in total UK Official Development Assistance and the Department for International
Development’s expenditure Part One 9
Figure 2: Composition of non-DFID ODA
NOTES
1. Gift aid is paid to charities by HM Revenue & Customs on donations made by UK taxpayers if the donations are
spent on ODA-eligible activities.
2. BIS is the Department for Business Innovation & Skills. DEFRA is the Department for Environment, Food & Rural
Affairs. CDC is the UK's development finance institution.
3. 'Other' comprises: Scottish Government (£12 million in 2014); Department of Health (£11 million); Department for
Work & Pensions (£8 million); Export Credits Guarantee Department (£3 million); Ministry of Defence (£2 million);
Colonial Pensions (£2 million); BBC World Service (£2 million); and Welsh Government (£1 million). In 2013, 'Other'
also included Department for Culture, Media & Support.
Source: Department for International Development, Statistics on International Development 2015, December 2015,
Additional tables, Table A3.
1.5 Of the other elements of non-DFID ODA, the fastest growing was Home Office
ODA. This increased by over 300% from £33 million in 2013 to £136 million in 2014.
Most Home Office ODA goes to support refugees in the UK. DFID reported the
increase in Home Office ODA was as a result of a joint review carried out by DFID and
the Home Office in 2014 drawing on advice from the Organisation for Economic
Co-operation and Development (OECD).10 The review has increased the range of
Home Office funded activities that are included as ODA.11
1.6 In February 2015, the Independent Commission for Aid Impact reported that
there was no single place where stakeholders could find a clear explanation of the
amounts and objectives of non-DFID ODA. It recommended that DFID improve
transparency by including in its publication Statistics on International Development a
summary of the main activities claimed as ODA.12 DFID responded by adding
additional material to the December 2015 publication.
10 OECD's Development Assistance Committee defines ODA. 11 DFID reported in December 2015 that Home Office ODA "now includes the cost of supporting all asylum seekers, for the first 12 months compared with only those eventually granted refugee status previously. This is in line with OECD DAC directives and best practice across DAC members. In addition Home Office identified new areas of ODA eligible expenditure which could not previously be separated out." 12 Independent Commission for Aid Impact, A preliminary investigation of Official Development Assistance (ODA) spent by departments other than DFID, February 2015.

10 Part Two Trends in total UK Official Development Assistance and the Department for
International Development’s expenditure
Part Two
How much ODA goes to multilateral organisations?
ODA going as core funding to multilateral organisations is growing
quicker than bilateral ODA, and now accounts for 42% of all ODA
2.1 Multilateral Official Development Assistance (ODA) is the core funding the UK
provides to multilateral organisations. Each multilateral organisation determines how it
uses the core funding it receives from donors such as the UK, in ways which are in
line with its mandate and agreed by its governing body.
2.2 Multilateral ODA accounted for 42% of total UK ODA in 2014, up 8 percentage
points on the level in 2009 (Figure 3). Multilateral ODA accounted for £209 million
(69%) of the £302 million growth in total UK ODA between 2013 and 2014. The growth
in multilateral ODA in 2014 was driven by a £529 million increase, to £1,641 million, in
the Department for International Development's (DFID) core contributions to the
International Development Association, the World Bank's fund for the poorest
countries.
Figure 3: Total UK ODA and the multilateral and bilateral split
Source: Department for International Development, Statistics on International Development 2015, December 2015,
Additional tables, Table A1a.

Trends in total UK Official Development Assistance and the Department for International
Development’s expenditure Part Two 11
The World Bank and the EU are the main recipients of UK
multilateral ODA, accounting for 58% in 2014
2.3 The World Bank was the largest recipient of UK multilateral ODA in 2014
(Figure 4). In 2014, it received 34% (£1,667 million) of total UK multilateral ODA, up
from 26% in 2013. DFID provided all of the UK ODA that went to the World Bank in
2014, with £1,641 million (98%) going to the International Development Association.
2.4 The EU received £1,168 million (24%) of UK multilateral ODA in 2014. The main
elements were:
the UK’s contribution to the EU's development budget (£816 million in 2014) –
DFID does not have any control over the size of the UK's contribution; and
DFID’s payments to the European Development Fund (£328 million).
Figure 4: UK multilateral ODA by type of organisation
NOTE
1. Other multilateral assistance in 2014 included: Strategic Climate Fund (£274 million), Global Alliance for Vaccines
and Immunization (£269 million), Clean Technology Fund (£112 million) and Private Infrastructure Investment Group
(£74 million).
Source: Department for International Development, Statistics on International Development 2015, December 2015,
Additional tables, Table A11.

12 Part Two Trends in total UK Official Development Assistance and the Department for
International Development’s expenditure
Over 60% of all DFID's ODA goes through multilateral
organisations
2.5 In 2014, DFID gave multilateral organisations £6,249 million of funding, some
62% of its total ODA (Figure 5).13 This funding comprised:
£4,218 million in core funding (42% of DFID's total ODA); and
£2,031 million in bilateral funding (20% of DFID's total ODA) – this funding was
for multilateral organisations to undertake programmes in a specific country or
region or for a purpose specified by DFID.
Figure 5: DFID ODA going to multilateral organisations in 2014
NOTE
1. The composition of DFID's bilateral aid is examined in more detail at page 13.
Source: Department for International Development, Statistics on International Development 2015, December 2015,
Additional tables, Table A2.
13 In the 4 previous years the range had been from 58% to 64%.

Trends in total UK Official Development Assistance and the Department for International
Development’s expenditure Part Three 13
Part Three
What type of organisations receive DFID’s bilateral aid?
3.1 Bilateral aid is spending that is earmarked for a specific country, region or
project. It is a mix of humanitarian assistance and development assistance. The
figures the Department for International Development (DFID) publishes on the UK's
total bilateral Official Development Assistance (ODA) do not show what type of
organisations receive this funding. The analysis below, therefore, only covers DFID’s
bilateral spending. Data on DFID's bilateral spending is available for the period up to
2013-14.14
DFID's bilateral humanitarian assistance grew much more rapidly
than its development assistance in the 2 years to 2013-14
3.2 DFID's spending on humanitarian assistance grew by 145% in the 2 years to
2013-14, reaching £866 million (Figure 6). Over the same period, its bilateral
development assistance grew by 21% to £4,658 million. DFID routes most of its
humanitarian assistance through multilateral organisations and non-governmental
organisations.
3.3 In March 2015, the previous International Development Committee
recommended that DFID set a ceiling for spending on humanitarian assistance and
set out criteria for deciding in which parts of the world it will spend large amounts on
humanitarian assistance.15 In September 2015, the government responded. It said:
"The Government disagrees that a ceiling should be set for humanitarian
assistance. The caseload has risen significantly, but the UK does not allocate a
disproportionate percentage of its ODA to humanitarian assistance. The
Government spent 10% of ODA as humanitarian assistance in 2013 in
comparison to 11-15% allocated by US and Nordic donors."16
14 DFID is due to publish data for 2014-15 in January 2016. 15 House of Commons International Development Committee, Department for International Development's Performance in 2013-2014: the Departmental Annual Report 2013-14, Thirteenth Report of Session 2014-15, March 2015. 16 House of Commons International Development Committee, Department for International Development’s Performance in 2013-14: the Departmental Annual Report 2013-14: Government Response to the Committee's Thirteenth Report of Session 2014-15, Fourth Special Report of Session 2015–16, September 2015

14 Part Three Trends in total UK Official Development Assistance and the Department for International Development’s expenditure
Figure 6: DFID's bilateral aid by delivery route
Source: National Audit Office presentation of Department for International Development data, GPEX tables 2013-14: December 2014, Table 1

Trends in total UK Official Development Assistance and the Department for International
Development’s expenditure Part Three 15
DFID delivers its bilateral development assistance through a
number of routes
3.4 More of DFID's bilateral development assistance goes via multilateral
organisations than any other route. In 2013-14, multilateral organisations received
£1,437 million to run development programmes. DFID also gave multilateral
organisations bilateral funding to provide humanitarian assistance (2013-14 value not
known).
3.5 The 2 routes for delivering bilateral development assistance that grew quickest
between 2011-12 and 2013-14 were:
technical cooperation, which reached £901 million in 2013-14 (up 71% in 2
years) – technical cooperation is often provided by contractors;17 and
non-governmental organisations, which reached £1,000 million in 2013-14 (up
35% in 2 years).
3.6 The total amount of bilateral development assistance DFID provided through
developing countries’ governments did not change significantly between 2009-10
(£1,153 million) and 2013-14 (£1,168 million). DFID provides assistance through
governments in 2 ways.
Budget support (£567 million in 2013-14): contributions to developing countries
for them to spend in support of government policy and their expenditure
programmes whose long-term objective is to reduce poverty. Funds are spent
using the overseas governments’ own financial management, procurement and
accountability systems to increase ownership and long-term sustainability.
Other financial aid (£601 million): funding of projects and programmes, such as
sector-wide programmes, not classified as budget support.
17 Technical cooperation includes activities designed to enhance the knowledge, skills, expertise or productive capability of people in developing countries. It also covers funding of services that contribute to the design or implementation of development projects and programmes.

16 Part Four Trends in total UK Official Development Assistance and the Department for
International Development’s expenditure
Part Four
What is the focus of DFID’s country programmes?
Most of DFID's spending through its 28 priority country
programmes goes to 10 countries
4.1 In 2011, the Department for International Development (DFID) decided that it
would focus its bilateral aid on 28 priority countries with the aim of targeting its support
where it would make the biggest difference.18 DFID reports the size of each of its
country programmes for its 28 priority countries. These programmes are managed by
teams based overseas (Figure 7).19
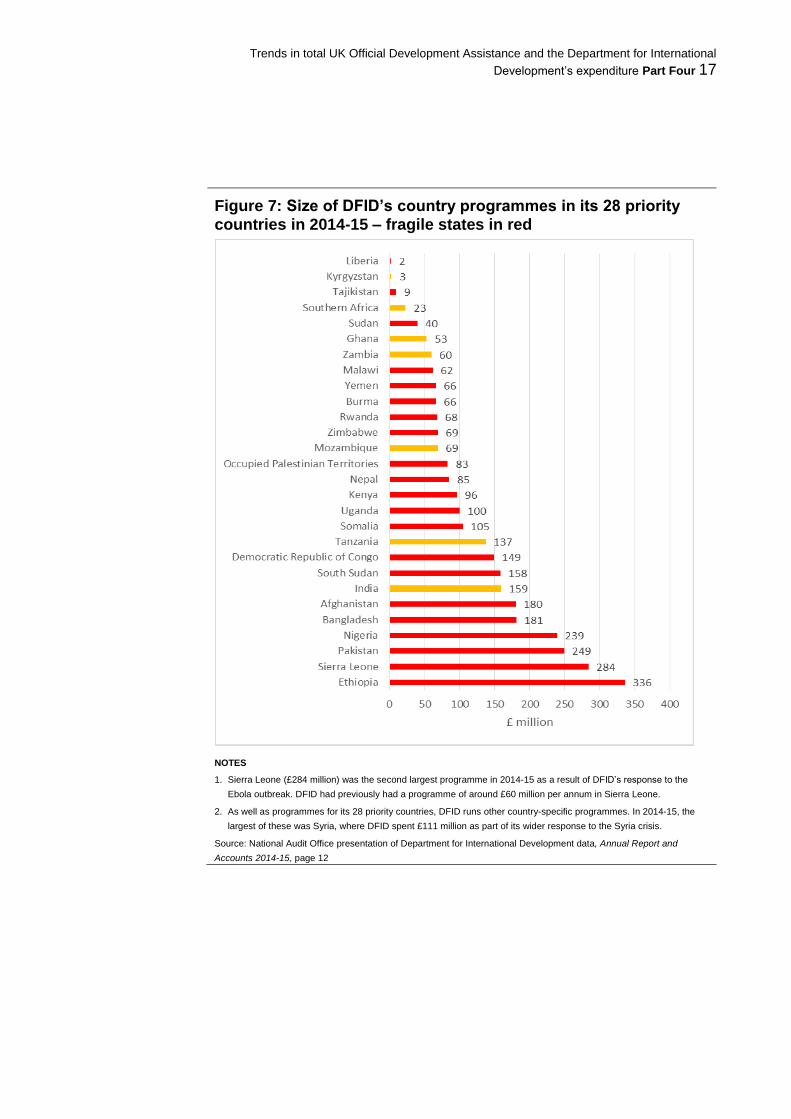
4.2 In 2014-15, DFID spent £3,131 million through its 28 priority country
programmes, up from £2,546 million in 2010-11. Throughout the period 2010-11 to
2014-15, DFID's 28 country programmes have accounted for around a third of its total
spending each year.
4.3 Most of DFID's spending through its 28 priority country programmes is
concentrated on a small number of countries. In 2014-15, 41% of the £3,131 million
DFID spent through its 28 country programmes went to the top 5 countries; 66% went
to the top 10 countries. These values were similar to the levels in 2011-12: the top 5
countries received 42%, and the top 10 countries 65%.
4.4 Four countries have been in DFID’s top 5 largest country programmes in each of
the last 4 years: Ethiopia, Pakistan, Nigeria and Bangladesh. Four other countries
have been in DFID’s 10 largest country programmes in each of the last 4 years:
Afghanistan, India, Democratic Republic of Congo and Tanzania.
18 Initially, 27 countries were identified as priority countries. When South Sudan was created, it was added to this group. 19 As well as its country programmes, DFID also supports activities in its 28 priority countries through centrally managed programmes. For example, DFID teams in the UK provide funding to a number of global funds which then run programmes in developing countries. DFID has not reported how much of its spending through its centrally managed programmes benefits its priority countries.
Trends in total UK Official Development Assistance and the Department for International
Development’s expenditure Part Four 17
Figure 7: Size of DFID’s country programmes in its 28 priority countries in 2014-15 – fragile states in red
NOTES
1. Sierra Leone (£284 million) was the second largest programme in 2014-15 as a result of DFID’s response to the
Ebola outbreak. DFID had previously had a programme of around £60 million per annum in Sierra Leone.
2. As well as programmes for its 28 priority countries, DFID runs other country-specific programmes. In 2014-15, the
largest of these was Syria, where DFID spent £111 million as part of its wider response to the Syria crisis.
Source: National Audit Office presentation of Department for International Development data, Annual Report and
Accounts 2014-15, page 12
18 Part Four Trends in total UK Official Development Assistance and the Department for
International Development’s expenditure
DFID's spending through its country programmes is increasingly
focused on fragile states
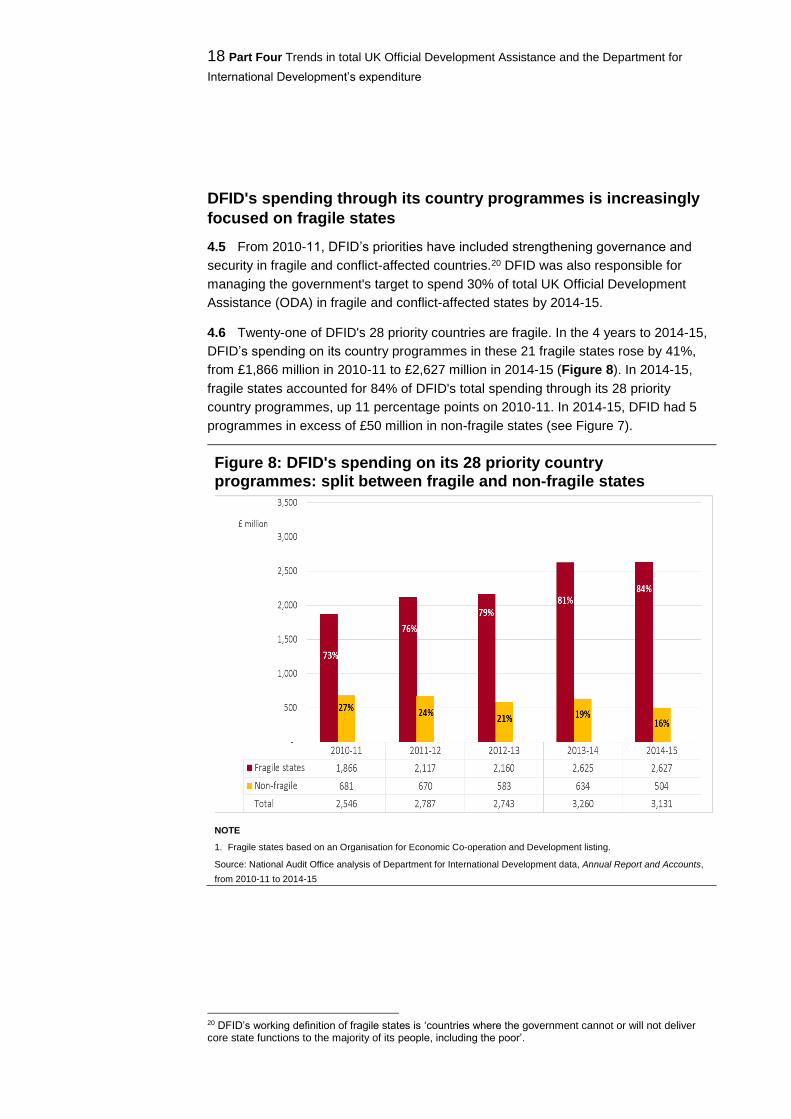
4.5 From 2010-11, DFID’s priorities have included strengthening governance and
security in fragile and conflict-affected countries.20 DFID was also responsible for
managing the government's target to spend 30% of total UK Official Development
Assistance (ODA) in fragile and conflict-affected states by 2014-15.
4.6 Twenty-one of DFID's 28 priority countries are fragile. In the 4 years to 2014-15,
DFID’s spending on its country programmes in these 21 fragile states rose by 41%,
from £1,866 million in 2010-11 to £2,627 million in 2014-15 (Figure 8). In 2014-15,
fragile states accounted for 84% of DFID's total spending through its 28 priority
country programmes, up 11 percentage points on 2010-11. In 2014-15, DFID had 5
programmes in excess of £50 million in non-fragile states (see Figure 7).
Figure 8: DFID's spending on its 28 priority country programmes: split between fragile and non-fragile states
NOTE
1. Fragile states based on an Organisation for Economic Co-operation and Development listing.
Source: National Audit Office analysis of Department for International Development data, Annual Report and Accounts,
from 2010-11 to 2014-15
20 DFID’s working definition of fragile states is ‘countries where the government cannot or will not deliver core state functions to the majority of its people, including the poor’.

Trends in total UK Official Development Assistance and the Department for International
Development’s expenditure Part Five 19
Part Five
What is the income level of countries that receive UK bilateral ODA?
5.1 Most of the UK’s bilateral Official Development Assistance (ODA) is assigned to
specific countries. The rest goes to projects where the Department for International
Development (DFID) does not know, or does not yet know, the amounts spent by
country. For example, some projects cover multiple countries or regions.
The proportion of country-specific bilateral ODA going to
low-income countries has been above 60% since 2010
5.2 In 2014, 64% of the UK's country-specific bilateral ODA went to low-income
countries.21 This was below the level in 2011 (66%), but above the levels in 2012 and
2013. The level in 2014 was also higher than in 2009 and 2010, when the levels for
2009 and 2010 are based on the current income classifications of countries
(Figure 9).
5.3 In 2011, the income classifications of several countries changed. The countries
included 3 of DFID's priority countries – Pakistan, Nigeria and Ghana – which
graduated from low-income to lower-middle-income status. The changes resulted in a
large reduction in the reported proportion of UK country-specific bilateral ODA going to
low-income countries. In 2010, 75% of country-specific bilateral ODA went to countries
classified as low-income at that time. Based on the current income classifications of
countries, 58% of country-specific bilateral ODA went to low-income countries in 2010
(Figure 9).
5.4 In 2014, the previous International Development Committee recommended that
the percentage of ODA that goes to low-income countries should rise over time,
provided those countries are capable of absorbing it.22
21 The World Bank defines low-income countries as those with a gross national income per capita of $1,045 or less in 2013. 22 House of Commons International Development Committee, Department for International Development's Performance in 2012-2013: the Departmental Annual Report 2012-2013, Tenth Report of Session 2013-14, April 2014.

20 Part Five Trends in total UK Official Development Assistance and the Department for International Development’s expenditure
Figure 9: UK country-specific bilateral ODA by income level of country
NOTES
1. Low-income includes those countries categorised as least developed countries.
2. In 2011, the income classifications of a number of countries changed to those that are used now. We have therefore shown 2009 and 2010 values based on both the current and previous income classifications.
Source: National Audit Office analysis of Department for International Development data, Statistics on International Development 2015, December 2015, Table 7, and Statistics on International Development 2014, Tables A4a to A4e.
Trends in total UK Official Development Assistance and the Department for International
Development’s expenditure 21
DFID's bilateral ODA is focused on low-income countries, while
most non-DFID bilateral ODA goes to lower-middle-income
countries
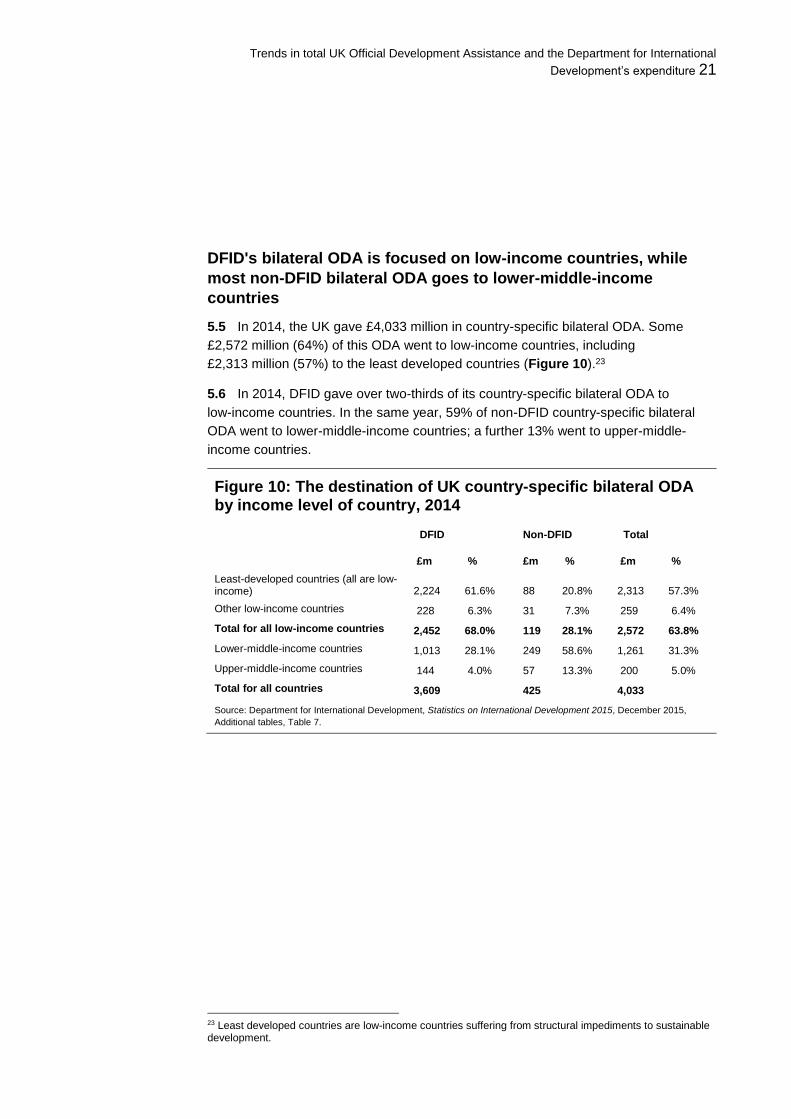
5.5 In 2014, the UK gave £4,033 million in country-specific bilateral ODA. Some
£2,572 million (64%) of this ODA went to low-income countries, including
£2,313 million (57%) to the least developed countries (Figure 10).23
5.6 In 2014, DFID gave over two-thirds of its country-specific bilateral ODA to
low-income countries. In the same year, 59% of non-DFID country-specific bilateral
ODA went to lower-middle-income countries; a further 13% went to upper-middle-
income countries.
Figure 10: The destination of UK country-specific bilateral ODA by income level of country, 2014
DFID Non-DFID Total
£m % £m % £m %
Least-developed countries (all are low-income) 2,224 61.6% 88 20.8% 2,313 57.3%
Other low-income countries 228 6.3% 31 7.3% 259 6.4%
Total for all low-income countries 2,452 68.0% 119 28.1% 2,572 63.8%
Lower-middle-income countries 1,013 28.1% 249 58.6% 1,261 31.3%
Upper-middle-income countries 144 4.0% 57 13.3% 200 5.0%
Total for all countries 3,609 425 4,033
Source: Department for International Development, Statistics on International Development 2015, December 2015,
Additional tables, Table 7.
23 Least developed countries are low-income countries suffering from structural impediments to sustainable development.

22 Trends in total UK Official Development Assistance and the Department for International
Development’s expenditure
Part Six
How much do DFID's teams spend?
6.1 The Department for International Development (DFID) is split into 5 functional
areas. Each is made up of several divisions, departments or teams (Figure 11).
6.2 Around 36% of DFID's spending in 2014-15 was managed by the largest of these
5 functional areas. Most of the Country and Regional Programmes area's spending
is by DFID teams responsible for 26 of DFID's 28 priority countries (paragraph 4.1).
These teams are based overseas.
6.3 DFID's Middle East, Humanitarian and Conflict Division spent £888 million in
2014-15, 9% of DFID's total spending. This division manages the programmes for 2
priority countries: the Occupied Palestinian Territories programme and the Yemen
programme. It also includes DFID's programmes in Syria and the neighbouring
countries affected by the Syria crisis, and DFID's Conflict, Humanitarian and Security
Department.
6.4 A third of DFID's 2014-15 spending was managed by the divisions that make up
Policy and Global Programmes.
International Relations Division (11% of DFID's 2014-15 spending) oversees
DFID's relationship with Europe and manages DFID’s central relationships with,
and core funding for, UN bodies.
Policy Division (11%) aims to deliver DFID's priority development policies,
support delivery of DFID's bilateral programme and promote better development
policy internationally.
Global Funds Division (9%) manages DFID's investment in global funds and
other finance mechanisms that channel funding for specific development
objectives, including health and education.
Research and Evidence Division (3%) is responsible for commissioning research
and evaluation and communicating the results.

Trends in total UK Official Development Assistance and the Department for International
Development’s expenditure 23
Figure 11: Spending in 2014-15 by DFID's 5 functional areas and teams
NOTES
1. This figure shows DFID's structure at November 2015.
2. Not shown is negative central costs of £26 million reported by DFID in its Annual Report. When this item is included,
the spending of the 5 functional areas equals total programme expenditure reported by DFID.
Source: National Audit Office presentation of Department for International Development data, Annual Report and
Accounts 2014-15, pages 149 to 151.
6.5 The Economic Development Directorate leads DFID's work on the growth of
developing countries, the private sector, trade for development and multilateral
effectiveness. It accounted for 21% of DFID's spending in 2014-15, with most of this
going through the International Finance Department. This department manages
DFID's central relationships with, and core funding of, the World Bank and other
development banks.

24 Trends in total UK Official Development Assistance and the Department for International
Development’s expenditure
6.6 DFID's Corporate Performance Group supports DFID's other teams; it does not
manage aid programmes. It includes teams responsible for finance, performance,
human resources, security, facilities, information technology and internal audit.

Trends in total UK Official Development Assistance and the Department for International
Development’s expenditure 25
Part Seven
How have DFID's operating costs changed?
DFID has lived within HM Treasury limits on its operating costs
7.1 The Department for International Development's (DFID) operating costs cover all
its internal costs, such as the costs of its staff, estate and information technology.
DFID's operating costs comprise 2 elements: its administration costs and its front-line
delivery costs. DFID uses the remainder of its budget to fund external bodies, such as
multilateral organisations and non-governmental organisations to deliver aid
programmes.
7.2 During the 2010 Spending Review, HM Treasury set limits for DFID's operating
costs for the 4-year period to 2014-15. DFID kept within the annual limits. In 2014-15,
DFID's operating costs were £228 million, £5 million below the limit set by HM
Treasury.
7.3 Over the 4 years to 2014-15, DFID's total operating costs increased by
£39 million (21%, or 13% in real terms) (Figure 12). This overall change reflected:
a reduction of £33 million in DFID's administration costs (27%, or 31% in real
terms) – administration costs cover back-office functions, such as finance and
human resources, and include the costs of DFID's UK estate; and
an increase of £72 million in DFID's front-line delivery costs (111%, or 97% in
real terms) – front-line delivery costs cover the cost of front-line staff,24 including
pay, travel costs and training, as well as the estates costs of DFID's overseas
offices.
7.4 When we last looked at the composition of DFID's administration costs in 2013,
we found that half of the reductions were due to be made by one of its 5 functional
areas – the Corporate Performance Group.25 Within the Corporate Performance
Group, large reductions were being made to the budgets of a number of teams,
including those responsible for human resources and IT and communications.
24 Front-line staff are mainly based overseas but include staff based in the UK (for example for security reasons) who manage country or regional bilateral programmes. 25 National Audit Office, Briefing to support the International Development Committee’s inquiry into the Department for International Development’s Annual Report and Accounts 2012‑13, December 2013, pages 43 to 45.

26 Trends in total UK Official Development Assistance and the Department for International
Development’s expenditure
Figure 12: Composition of DFID's operating costs
Source: National Audit Office presentation of Department for International Development data
7.5 The growth of DFID's operating costs has enabled it to increase its staffing by a
quarter in the last 4 years. During 2010-11, DFID employed an average of 2,372 staff.
By 2014-15, this had increased by 619 to 2,991.
The proportion of DFID's total spending going to meet its
operating costs fell slightly over the 4 years to 2014-15
7.6 Over the Spending Review period, there was a small decline in the proportion of
DFID's overall spending that went on its operating costs. In 2010-11, operating costs
were 2.4% of total spending; by 2014-15 they were 2.3% (Figure 13). The reduction
arose as DFID's total spending increased at a faster rate (26%) over the period 2010-
11 to 2014-15 than its operating costs (21%).
Figure 13: DFID's operating costs and total spending
2010-11 2011-12 2012-13 2013-14 2014-15
Operating costs (£ million) 189 190 213 228 228
Total DFID spending
(£ million)
7,738 7,873 7,921 10,103 9,777
Operating costs as a
percentage of total DFID
spending
2.44% 2.41% 2.69% 2.26% 2.33%
Source: National Audit Office presentation of Department for International Development data