Embed Size (px)
Citation preview

TRENDSIN THE
TRANSPORT SECTOR
1970-2002
EU
RO
PE
AN
C
ON
FE
RE
NC
E
OF
M
IN
IS
TE
RS
O
F
TR
AN
SP
OR
TTRENDSIN THE
TRANSPORT SECTOR
How have the passenger and freighttransport sectors evolved since 1970? How isroad safety faring? This publication presents themost up-to-date statistics on transport markets inEurope, together with charts highlighting the majortrends.
Published earlier than comparable study, thisreport provides the reader with first-hand figureson key transport trends. It analyses the transportsituation in the western and eastern Europeancountries, as well as the Baltic States and the CIS.
(75 2004 01 1 P) ISBN 92-821-0323-4
-:HSTCSC=VUXWXY:
OECD's books, periodicals and statistical databases arenow available via www.SourceOECD.org, our onlinelibrary.
This book is available to subscribers to the followingSourceOECD themes:TransportTransition Economies
Ask your librarian for more details on how to accessOECD books on line, or write to us at
������������������������� ����� �������
�������
�� ��
���������
�����
���������
100x205_e.fm Page 1 Thursday, March 25, 2004 3:46 PM

3 ECMT, 2004
EUROPEAN CONFERENCE OF MINISTERS OF TRANSPORT (ECMT)
The European Conference of Ministers of Transport (ECMT) is an inter-governmental organisation established by a Protocol signed in Brussels on 17 October 1953. It is a forum in which Ministers responsible for transport, and more specifically the inland transport sector, can co-operate on policy. Within this forum, Ministers can openly discuss current problems and agree upon joint approaches aimed at improving the utilisation and at ensuring the rational development of European transport systems of international importance.
At present, the ECMT’s role primarily consists of:
• helping to create an integrated transport system throughout the enlarged Europe that is economically and technically efficient, meets the highest possible safety and environmental standards and takes full account of the social dimension;
• helping also to build a bridge between the European Union and the rest of the continent at a political level.
The Council of the Conference comprises the Ministers of Transport of 43 full member countries: Albania, Armenia, Austria, Azerbaijan, Belarus, Belgium, Bosnia-Herzegovina, Bulgaria, Croatia, the Czech Republic, Denmark, Estonia, Finland, France, FYR Macedonia, Georgia, Germany, Greece, Hungary, Iceland, Ireland, Italy, Latvia, Liechtenstein, Lithuania, Luxembourg, Malta, Moldova, Netherlands, Norway, Poland, Portugal, Romania, the Russian Federation, Serbia and Montenegro, Slovakia, Slovenia, Spain, Sweden, Switzerland, Turkey, Ukraine and the United Kingdom. There are seven Associate member countries (Australia, Canada, Japan, Korea, Mexico, New Zealand and the United States) and one Observer country (Morocco).
A Committee of Deputies, composed of senior civil servants representing Ministers, prepares proposals for consideration by the Council of Ministers. The Committee is assisted by working groups, each of which has a specific mandate.

4 ECMT, 2004
The issues currently being studied -- on which policy decisions by Ministers will be required -- include the development and implementation of a pan-European transport policy; the integration of Central and Eastern European Countries into the European transport market; specific issues relating to transport by rail, road and waterway; combined transport; transport and the environment; sustainable urban travel; the social costs of transport; trends in international transport and infrastructure needs; transport for people with mobility handicaps; road safety; traffic management; road traffic information and new communications technologies.
Statistical analyses of trends in traffic and investment are published regularly by the ECMT and provide a clear indication of the situation, on a trimestrial or annual basis, in the transport sector in different European countries.
As part of its research activities, the ECMT holds regular Symposia, Seminars and Round Tables on transport economics issues. Their conclusions serve as a basis for formulating proposals for policy decisions to be submitted to Ministers.
The ECMT’s Documentation Service has extensive information available concerning the transport sector. This information is accessible on the ECMT Internet site.
For administrative purposes the ECMT’s Secretariat is attached to the Organisation for Economic Co-operation and Development (OECD).
Publié en français sous le titre: ÉVOLUTION DES TRANSPORTS 1970-2002
Further information about the ECMT is available on Internet at the following address:
http://www.oecd.org/cem/
ECMT, 2004 - ECMT Publications are distributed by: OECD Publications Service,
2 rue André Pascal, 75775 PARIS CEDEX 16, France.

5 ECMT, 2004
TABLE OF CONTENTS
INTRODUCTION .......................................................7
1. THE ECONOMIC ENVIRONMENT...............9
1.1 General outlook.....................................................9 1.2 The situation in Western Europe and the United States .........................................................9 1.3 Eastern European and CIS countries...................12
2. FREIGHT TRANSPORT.................................15
2.1 Freight transport in the Western European countries ..............................................................15 Road freight transport.........................................16 Rail freight transport ..........................................17 Inland waterways ................................................19 Oil pipeline transport..........................................20
2.2 Freight transport in the Central and Eastern European Countries and the Baltic States ...........20 Road freight transport.........................................22 Rail freight transport ..........................................23 Inland waterway transport ..................................23 Oil pipeline transport..........................................24
2.3 Freight transport in the countries of the CIS .......25
3. PASSENGER TRANSPORT ...........................28
3.1 Passenger transport in the countries of Western Europe.................................................................28 Passenger transport by rail.................................29 Passenger transport by bus and coach ...............29 Transport by car..................................................30

6 ECMT, 2004
3.2 Passenger transport in the CEECs and the Baltic States ...................................................................31 Passenger transport by rail.................................31 Passenger transport by bus and coach ...............32 Transport by car..................................................33
3.3 Passenger transport in the CIS countries.............34 Passenger transport by rail.................................34 Passenger transport by bus and coach ...............35
4. ROAD SAFETY ................................................35
4.1 Road safety figures for the countries of Western Europe.................................................................36
4.2 Road safety figures for CEECs ...........................38 4.3 Road safety figures for the countries of the CIS ................................................................40
TABLES .....................................................................45
A. FREIGHT TRANSPORT ...................................47
B. PASSENGER TRANSPORT..............................53
C. ROAD ACCIDENTS..........................................59

7 ECMT, 2004
INTRODUCTION
The main aim of this publication is to describe developments in the transport sector in Europe in 2002 and to show, primarily by means of charts, how the situation has changed since 1970.
The analysis of recent trends in the European transport sector is based on data supplied by 43 ECMT Member countries1 in the form of statistics expressed in passenger and tonne-kilometres. To ensure that the overall trends are representative of as many countries as possible, the indices used in several of the charts include estimates for countries which do not yet have figures available for 2002.
The report has been divided in four parts. The first one is a brief analysis of the economic environment in 2002. The second part deals with freight transport in ECMT Member countries. The third part concentrates on passenger transport and the fourth one reviews road safety. The 15 Member States of the EU together with Norway, Switzerland, Turkey as well as Iceland, Liechtenstein and Malta are referred to hereinafter as “Western European countries” (ECMT/WEST). The
1. Albania (ALB), Armenia (ARM), Austria (AUT), Azerbaijan (AZE),
Belarus (BLR), Belgium (BEL), Bosnia-Herzegovina (BIH), Bulgaria (BGR), Croatia (HRV), the Czech Republic (CZE), Denmark (DNK), Estonia (EST), Finland (FIN), France (FRA), FYR Macedonia (MKD), Georgia (GEO), Germany (DEU), Greece (GRC), Hungary (HUN), Iceland (ISL), Ireland (IRL), Italy (ITA), Latvia (LVA), Liechtenstein (LIE), Lithuania (LTU), Luxembourg (LUX), Malta (MLT), Moldova (MDA), Netherlands (NLD), Norway (NOR), Poland (POL), Portugal (PRT), Romania (ROM), the Russian Federation (RUS), Serbia and Montenegro (YUG in 2002), the Slovak Republic (SVK), Slovenia (SVN), Spain (ESP), Sweden (SWE), Switzerland (CHE), Turkey (TUR), Ukraine (UKR) and the United Kingdom (GBR).

8 ECMT, 2004
recent trends in the transition countries are also reviewed. Given that the transport systems of these countries are highly distinctive and are currently undergoing radical change, it was decided to compile specific aggregate indicators: one set for the 12 Central and Eastern European Countries and three Baltic States (ECMT/CEECs) and a second set for the seven members of the Commonwealth of Independent States (ECMT/CIS).
Data for the former Czechoslovakia (CSK) have been taken into account up to 1992 to ensure a degree of continuity in the series over a lengthy period of time; from 1993 onwards, the data provided by the Czech and Slovak Republics have been used. Furthermore, German reunification produced a break in the series due to the incorporation, from 1991 onwards, of data relating to new Länder, resulting in a similar increase in the results of the ECMT as a whole.
9 ECMT, 2004
1. THE ECONOMIC ENVIRONMENT
1.1 General outlook
The economic trend was favourable at the beginning of 2002, buoyed by inventory build-up in the industrialised countries. Rather than picking up, however, activity lost vitality over the course of the year, and especially in the last quarter, despite accommodating monetary policies in most countries and expansionary budget policy in the United States.
Global growth continued to be dependent on the situation in the United States, Japan and Europe, recording only weak economic performances, in part because of macroeconomic deficit stabilization policies. The world economy expanded by 2.75% in 2002, slightly better than the 2.5% of 2001. For its part, world trade recorded an increase of only 2%, after declining slightly in 2001 for the first time in over twenty years. As a result, 2002 was the second year in a row when world trade grew by less than the global economy. After the drop in 2001, 2002 saw a rebound in trade in goods and services related to the new technologies.
Despite a slowdown of activity in Eastern Europe and the CIS in 2002, growth rates in these economies remained greater than those of Western Europe. Although the international environment was unfavourable, the activity trend in that region of the world remained fairly positive, making it one of the world’s most dynamic areas.
1.2 The situation in Western Europe and the United States
Global economic activity was given a boost in early 2002 by rebounding trade in new technologies,

10 ECMT, 2004
which had fuelled growth in the late 1990s. Nevertheless, this positive trend was not confirmed in the second half of the year.
In the United States, the combination of substantial idle production capacities and the persistence of major financial imbalances made a quick end to recession unlikely. Moreover, it became obvious in 2002 that businesses were responding timidly to interest rate cuts, given the priority that firms attached to trimming debt and excess production capacity.
In the industrialised countries, economic growth was also reined in by waning confidence in the economic outlook. The negative impact on consumption and investment was not insignificant. A further cause of this was the outbreak of geostrategic tensions -- with the threat of a war against Iraq becoming increasingly clear at the end of the year -- but also a weak outlook for corporate sales and profits, and thus for employment as well. The ensuing drop in securities’ prices was accentuated by stock market scandals, revealing the fragility of certain large corporations and creating a climate of mistrust of marketable securities. In turn, the effect of a loss of wealth for individuals and rising financing costs for businesses was not conducive to private-sector spending.
Corporate governance having been shown in a bad light on both sides of the Atlantic by spectacular failures, it was placed under the spotlight in 2002 by the stock markets. Reforms were initiated in the United States to bolster corporate surveillance and market transparency, while in Europe, which to a certain extent was affected less, reforms remained under preparation in 2002.
Activity grew by 2.4% in the United States in 2002, a positive figure in the aggregate which masks a flat year-end trend. Consumption was the main engine of growth, sustained by an easing of interest rates and generous financing schemes, such as the ones offered by car manufacturers. Budgetary policy also lent support to activity, but the combination of expansionary fiscal policy and accommodating monetary policy triggered a

11 ECMT, 2004
wide deficit in current accounts and especially in the foreign trade balance. As a result, the dollar lost 8% of its value in 2002.
In Western Europe, economic growth remained nearly flat, with GDP averaging growth of a scant 1%. The performance was even weaker in the euro zone, for which the corresponding figure was 0.8%. These very weak outcomes reflected flat individual spending and business investment, whereas fiscal policy stayed neutral overall; the objectives of the stability and growth pact were widely overshot, however. Despite the deterioration of economic prospects, which was obvious throughout 2002, the European Central Bank’s monetary policy was kept unchanged until December 2002, when rates began to ease for the first time since November 2001.
Over the full year 2002, domestic demand in Western Europe rose by a scant 0.3%, with private household consumption rising by only 0.7%, as opposed to 1.8% in 2001. Gross fixed capital consumption dipped by 2.3% in 2002, accelerating a decline begun in 2001. Budgetary policy was expansionary in France, Ireland and the Netherlands, contributing more to growth than private consumption. Exports of goods and services recorded a rise of 0.8%, reflecting listless world trade. Because of the drop in imports, foreign trade added 0.4% to growth, making it the greatest contributing factor to aggregate demand.
On spot markets, the price of oil increased from $19 to $31 per barrel between January and December 2002. At the end of the year, world demand for oil expanded because of seasonal factors and inventory build-up, but the supply also became more abundant. Although the two factors offset each other, it was the prospect of probable war in Iraq that caused crude oil prices to rise. These rising energy prices helped keep euro-area inflation slightly above the ECB target of 2%.
In most of the industrialised countries, labour markets eased, with a rise in joblessness becoming perceptible in mid-May 2002.

12 ECMT, 2004
1.3 Eastern European and CIS countries
Despite a slowdown of activity in 2002 in Eastern Europe and the CIS, growth rates there remained higher than those of Western Europe. The weakening was especially marked in Russia and Ukraine, which pulled down the overall average. Nevertheless, growth in 2002 averaged 4.8% in the CIS countries, which can be explained by the continuation of the vitality which had marked 2001 and the strong performances of the Caucasian and Central Asian economies. In comparison, growth was far more moderate in Eastern Europe, where it hovered around 3%, unchanged overall from the previous year. Nevertheless, the latter region was not uniform, insofar as Central Europe had slowed down -- dominated by very weak activity in Poland -- whereas South-East Europe and more particularly the Baltic States posted performances well above average.
These trends are to a large extent the result of the configuration of global activity in 2002. Some Central European countries were affected by Western Europe’s low imports, whereas certain countries which export raw materials, and oil in particular, were affected by demand and price weakness at the beginning of 2002. Activity itself having slowed down in Russia, trade specific to the region was affected.
Although the overall picture for foreign demand was mixed, it is nonetheless a fact that the CIS and Eastern European countries experienced some of the highest growth on the planet. This reflects a factor already perceptible in 2001 but confirmed in 2002 -- the rise of domestic demand as a growth factor. This fact would seem to be borne out despite the difficulty in obtaining reliable data on the make-up of activity.
It can be noted, however, that there is another side to the coin: while it reveals renewed confidence in growth and income prospects on the part of economic players (the result of ten years of reform intended to lay the foundations for an entrenched market economy), for small, open economies it also means heightened sensitivity to problems of account deficits, in respect of external accounts in particular. With rare exceptions,
13 ECMT, 2004
most of the Eastern European and CIS countries were characterised by foreign trade imbalances, worsened by budget deficits. While foreign direct investment was a major source of capital inflows which could offset the foreign trade imbalance, with the end of the privatisations -- most of the programmes coming to fruition -- the problem of the foreign deficit was aggravated by the tendency of certain Central European countries to manipulate demand via tax incentives.
The aggregate trade balance of the Eastern European and CIS countries deteriorated in 2002, although there were differences from one country to another: while the balance deteriorated in Croatia, the Czech Republic, Estonia, Hungary and Yugoslavia, it improved in Bulgaria, Romania and Slovenia. Within the CIS, Russia’s surplus shrank, although it remained higher than expected, whereas certain other CIS countries experienced difficulties financing their international deficits.
Although exports made only a small contribution to growth in Eastern Europe, a factor which made a major impact was the strength of exports to Western Europe at a time when Western Europe was in the doldrums. For the second consecutive year, these exports expanded at a faster pace than Western Europe’s overall imports or aggregate global exports. This was the result of ten years of foreign direct investment on the part of multinationals which concentrated especially on leading-edge technologies and knew how to make use of Eastern European labour skills, its low cost and the proximity of western markets. It is possible that multinational firms, confronted with the weaknesses of their leading markets and a loss of profitability in those markets, decided to hasten the movement to relocate their assets.
Gross fixed capital formation varied considerably from one country to another: it gathered pace in the Baltic States and at the same time slowed down, while nonetheless remaining firm, in the large economies of South-Eastern Europe. In contrast, investment was rather sluggish in Central Europe, apart from Hungary. Weakness in Central Europe stemmed mainly from a

14 ECMT, 2004
flat Polish economy. In the CIS countries, investment made only a modest 0.6% contribution to growth over the first three quarters of 2002. This slowdown in investment was due to the negative profit impact of accelerating pay rises.
At the same time, disinflation made progress in Eastern Europe and the CIS, aided by a fairly uninspiring economic outlook. While inflation remained greater than in Western European countries, this fact cannot be attributed to lax monetary policies. As raw materials prices did not soar, due to good farm harvests which kept the prices of these foodstuffs at acceptable levels, the strides taken in disinflation were notable. In general, the overall macroeconomic environment was favourable for the monetary authorities insofar as 2002 brought no particular shocks. The region’s economies were not affected by the contagion of the financial crisis that raged in Latin America, and capital inflows into Eastern Europe and the CIS were less volatile than in other emerging markets. As a result, disinflation was able to continue, with results for 2002 proving better than had been expected at the beginning of the year (notably in Croatia, Lithuania, Latvia, Poland, Ukraine and Armenia). In the CIS countries, the strength of domestic demand stemming from income expansion in 2002 was a creeping inflation factor. Nevertheless, the consistent and stabilizing macroeconomic policy carried out during 2002 successfully contained inflation while sustaining growth. This shows the result of several years of reform aimed at endowing the CIS with the structures of a stable market economy, even if energy prices for final consumers remained partially administered.
In 2002, the unemployment situation remained difficult in Eastern Europe for the fourth year in a row. In the wake of the 1999 Russian financial crisis, the situation was aggravated by intensive industrial restructuring. Despite everything, 2002 saw a number of encouraging signs of improvement in certain countries, and more particularly in the Baltic States and the CIS. After peaking in 2000 and 2001, joblessness levelled off in 2002 and even began to recede in some countries as a consequence of continued robust activity. In most of the

15 ECMT, 2004
CIS countries, the economic rebound of 2000, 2001 and, to a lesser extent, 2002 finally led to the creation of new jobs and a reduction in unemployment, even if the situation may vary from one state to another.
2. FREIGHT TRANSPORT
2.1 Freight transport in the Western European countries
In the countries of Western Europe, road freight transport dominated the market in 2002; it accounted for more than 77.5% of the combined tonne-kilometres carried by rail, road and inland waterway.
Trends in market share (in %) of the various modes Freight transport in t-km
1980 1985 1990 1995 2000 2002
Rail 23.3 21.8 18.5 15.9 15.8 15.0Road 66.5 69.1 73.1 76.5 76.8 77.6Inland waterways 10.2 9.1 8.5 7.7 7.4 7.4
100 100 100 100 100 100
A closer look at the trends over time shows that road freight has been steadily taking market shares from rail and inland waterway transport. However, while inland waterway transport is bearing up under the trend, the modal share of rail transport in 2002 stood at less than 50% of its share in 1970 (31.1%).

16 ECMT, 2004
Trends in freight transport (tonne-kilometres) - Western Europe - 1970=100
0
50
100
150
200
250
300
350
1970
1972
1974
1976
1978
1980
1982
1984
1986
1988
1990
1992
1994
1996
1998
2000
2002
Railways Roads
Inland waterways Pipelines
Railways, 18 countries: AUT, BEL, CHE, DEU, DNK, ESP, FIN,
FRA, GBR, GRC, IRL, ITA, LUX, NLD, NOR, PRT, SWE, TUR
Roads, 16 countries: AUT, BEL, CHE, DEU, DNK, ESP, FIN, FRA, GBR, GRC, ITA, LUX, NLD, NOR, SWE, TUR Inland waterways, 10 countries: AUT, BEL, CHE, DEU, FIN, FRA, GBR, ITA, LUX, NLD Pipelines, 12 countries: AUT, BEL, CHE, DEU, DNK, ESP, FRA, GBR, ITA, NLD, NOR, TUR Source: ECMT.
Road freight transport
In 2002, road freight transport in Western Europe was not directly affected by contracting industrial activity in those countries. Tonne-kilometres carried by western road hauliers were up by over 1.8% on 2001. For this reason, road freight transport reached a record level in 2002.
Looking at the situation in 2002 country by country, the enviable performance of road freight transport in Spain, Finland and Luxembourg stands out,

17 ECMT, 2004
with respectively +11.4%, +5.2% and +3.2%. It may also be noted that Sweden recorded growth of more than 6%. The other countries for which data are available, in contrast, show contractions in road freight transport in 2002, the most significant declines being recorded in Portugal (-12.4%) and the Netherlands (-3%), followed by Germany (-1.3%). Italy recorded a rise in activity, attested by the 3.4% increase in tonne-kilometres carried by its road hauliers. In Turkey, road freight transport was down by less than 0.5%, while in France the decline was even slighter (-0.2%). However, the contractions in activity did not involve very large volumes, so the overall performance of road freight transport was not affected.
A longer-term look at the trends shows that total tonne-kilometres in the road freight sector increased by a factor of more than 3.3 over the period 1970-2002, despite the gloomy economic situation in 2002. This was the strongest performance of all inland transport modes in Western Europe and shows that road freight transport is relatively unaffected by economic downturns. The progress made on European construction and the resultant expansion of international trade benefited road haulage undertakings directly.
Rail freight transport
Compared with that of road freight in 2002, the performance of rail freight transport in the countries of Western Europe was disappointing. Tonne-kilometres carried by 16 rail networks were down by 2.6% on 2001. The weak performance of the Irish (-17.5%), Greek (-13.7%), Norwegian (-12.8%), Swiss (-8.7%) and Turkish (-4.5%) networks may be noted. Several other networks recorded a decrease in tonne-kilometres close to the average: those of Luxembourg (-3.3%), the United Kingdom (-3.6%) and Germany (down by 3.6%). The French network reported a decline in activity of almost 1%.
In contrast with this overall trend, which belied the declarations of intent by the heads of the rail networks and the wishes of policymakers, only a few countries reported a growth in activity -- on the
18 ECMT, 2004
Portuguese (+2.7%), Belgian (+2.8%) and Austrian (+1.4%) networks.
Clearly, the negative trend of rail freight transport in the countries of Western Europe in 2002 shows that this mode is affected by more than cyclical variations, since tonne-kilometres carried in 2002 were at the same level as in 1998, whereas over the same period the economy had grown. Furthermore, between 1970 and 2002, rail freight was virtually flat, registering the weakest performance of any mode of inland freight transport.
The reason for the weaker performance of rail freight transport in 2002 is to be found in the inadequate quality of the services provided. Whether it was on account of infrastructure capacity problems, stemming from delicate tradeoffs between freight trains and passenger trains, a shortage of drivers or locomotives, or strikes, it seemed very difficult for rail networks to cope with a level of freight activity barely above that of 1970.
This poor rail freight performance is reflected in trans-Alpine traffic statistics. On the Alpine segment between Mont-Cenis/Frejus and Brenner, rail’s share of aggregate freight traffic was 37% in 2002, or two percentage points less than in 2001. The modal breakdown of transit traffic in 2002 showed that 75% of the freight crossing the Swiss Alps was carried by rail. In France and Austria, these shares fell to 25%. In 2002, 1 250 000 heavy goods vehicles crossed the Swiss Alps, or 9% fewer than the previous year. In contrast, the freight carried by these HGVs rose by 2%.
It can thus be seen that, despite the obstacle posed by Switzerland’s heavy vehicle fees, road freight hauliers managed to increase their tonnages. In comparison, the performance of the railways seems quite weak. Admittedly, use of the possibility of “free access” on international corridors -- perceived as a solution to the lack of dynamism of purely national rail networks -- increased, but only very small volumes were involved. For example, a prerequisite for improving the international performance of the railways is to authorise the drivers of one network to drive trains on another

19 ECMT, 2004
network, which in turn requires that the training received by drivers in one country be recognised in another. While it is clear that the future growth of European transport lies in international transport, the numerous and varied impediments to interoperability, which rail networks have to deal with when operating international services, attest to the magnitude of the task to be accomplished.
Inland waterways
Tonne-kilometres carried by inland waterways fell by 1.3% in 2002 compared with 2001. This overall figure is valid for seven countries of Western Europe. More specifically, inland waterway traffic increased substantially in Austria (+11.3%). In contrast with this lone positive trend, in 2002 inland waterway transport fell in Italy by over 40% and in Finland by just over 4.6%. In Germany and Luxembourg, activity was also down in 2002, though to a lesser extent, declining respectively by 1% and 1.4% on 2001.
Looking at the traffic on a few significant waterways, it may be noted without surprise that Rhine river traffic between Basel and the Germano-Dutch border was affected in 2002 by the bleak economic outlook. Tonnage was down by 1.3% on 2001. The lower flows of crude and manufactured minerals and building materials made a major contribution to the decline in 2002. The same can be said for oil products, which were down by nearly 5.3%. Not all aspects of Rhine traffic were on the decline, however: the volume of chemicals was up, whereas machinery, vehicles and manufactured goods posted a strong performance by rising 7.3%.
A look at the longer-term trends shows that the volume in tonne-kilometres carried by inland waterway transport in Western Europe was up by nearly 21% in 2002 on 1970, which was an enviable achievement compared with the performance of rail transport, which was flat over the same period, but it still fell far short of the results for road freight transport. Admittedly, the latter mode covers Western Europe via a very dense network of roads, an advantage which it is impossible

20 ECMT, 2004
for the other modes, in particular inland waterways, to offset.
Oil pipeline transport
Data for eight countries show that oil pipeline transport seems to have fallen by more than 18% in 2002 compared with 2001. Pipeline transport of petroleum products and chemicals thus did not confirm its steady growth, due mainly to the sharp fall in oil pipeline transport through Turkey (-43.3%). In contrast, it grew significantly in the Netherlands (+3.3%), while remaining flat in Spain and Italy. The other data available show sharp drops in Germany (-3.5%) and to a lesser extent in France (-2.4%) and Norway (-2.2%), tending to confirm the bleak overall picture for 2002.
Leaving aside the impact of major investment and geostrategic conflicts, which make any long-term comparison subject to caution, it may be noted that the growth of oil pipeline transport over the period 1970-2002 was uneven but nonetheless positive, making it one of the primary means of transporting chemicals and petroleum products.
2.2 Freight transport in the Central and Eastern European Countries and the Baltic States
In the CEECs and the Baltic States, rail has lost the dominant position it held in 1990, and the even more dominant one of 1970, to road transport, which in 2002 carried over 57% of the combined tonne-kilometres conveyed by the three main inland transport modes.
Inland waterway transport also saw its market decline, but to a lesser extent than rail, which was the big loser in the process of economic transformation.

21 ECMT, 2004
Trends in market share (in %) of the various modes Freight transport in t-km
1980 1985 1990 1995 2000 2002
Rail 71.1 72.1 66.0 50.8 43.5 39.9Road 25.5 24.8 30.6 46.6 54.1 57.5Inland waterways 3.3 3.1 3.4 2.6 2.4 2.6
100 100 100 100 100 100
Trends in freight transport (tonne-kilometres) - Eastern Europe and the Baltic States
1970=100
0
50
100
150
200
250
300
350
400
1970
1972
1974
1976
1978
1980
1982
1984
1986
1988
1990
1992
1994
1996
1998
2000
2002
Railways Roads
Inland waterways PipelinesSource: ECMT
Railways, 15 countries: ALB, BGR, BIH, CZE, EST, HRV, HUN, LTU, LVA, MKD, POL, ROM, SVK, SVN, YUG Roads, 14 countries: ALB, BGR, CZE, EST, HRV, HUN, LTU, LVA, MKD, POL, ROM, SVK, SVN, YUG Inland waterways, 11countries: BGR, CZE, EST, HRV, HUN, LTU, LVA, POL, ROM, SVK, YUG Pipelines, 10 countries: ALB, BGR, CZE, HRV, HUN, LTU, LVA, POL, ROM, YUG

22 ECMT, 2004
Road freight transport
Road freight transport in the CEECs and the Baltic States saw a large increase in the tonne-kilometres carried by its hauliers in 2002, averaging more than 6.8%. This is greater than the figures recorded since 1998.
Tonne-kilometres reached record levels in 2002 in the CEECs and the Baltic States, where road haulage is the leading mode for freight transport -- a position it has held in these countries since 1998.
The only negative notes were recorded in Slovenia (-16.3%), Hungary (-10.5%) and Estonia (-6.2%). In contrast, very sharp increases were posted in Lithuania (+29.4%), the Czech Republic (+20.9%), Bulgaria (+18.7%), Latvia (+14.9%) and FYR Macedonia (+14.1%). Croatia and the Slovak Republic both experienced growth in excess of 10%, with respectively +11.2% and +10.4%. Only in Poland was the number of tonne-kilometres carried practically unchanged (+0.4%).
The strong showing of the CEECs and the Baltic States, despite the worsening economic climate, was directly discernible in the above figures for road freight transport. Buoyant exports to both the EU and CIS strengthened the lead these countries are taking in transport growth.
In all, it would seem that road transport has bettered its performance by a factor of nearly 3.5 over the period 1970-2002 in the CEECs and the Baltic States, with a particularly rapid spurt in growth from 1993 onwards -- except for 1996, when growth was negative -- coinciding with the first visible signs of economic recovery in the region. The drops in traffic recorded in the period 1990-93 were thus wiped out very swiftly. One point to be noted above all is that overall performance during the period 1970-2002 is comparable in all respects with that seen in road freight transport in Western Europe at the same time, the only difference being the very rapid acceleration in the increase in tonne-kilometres carried by road in the CEECs and the Baltic States from 1995 onwards.

23 ECMT, 2004
Rail freight transport
Rail freight transport was virtually flat in 2002 in the CEECs and the Baltic States, with growth in tonne-kilometres of only 0.74%. In all, the volume of rail freight transport in these countries was only half as great in 2002 as it had been in 1970 -- a level of activity which, furthermore, was not even 40% of the all-time high reached in 1998.
The result recorded in 2002 stemmed from strong showings by the networks of Lithuania (+26.2%), Serbia and Montenegro (+14%), Estonia (+13.3%), Slovenia (+8.5%) and Croatia (+6.4%).
These strong showings were almost completely offset by the declines in activity recorded by all of the other networks: -27.7% in FYR Macedonia, -6.6% in the Czech Republic, -5.6% in Bulgaria, -5% in the Slovak Republic, -2.6% in Romania and -2.3% in Poland.
Having endured a steady overall decline ever since the process of transition began, interrupted only in 1995 and 2000, 2002 emerges as flat only because networks providing transit links had a positive year. The continuation of still-expanding transit traffic flows from the Russian Federation explains the good showing of certain networks.
It can therefore be stated that the still-favourable economic outlook in the CEECs offered a respite to the railroads, which must now however come to grips with a process which looks like an inevitable decline. This reflects a structural economic change, working to the advantage of road transport, which has proved better able to adapt to a different economic situation, characterised by an opening up to new external markets.
Inland waterway transport
Inland waterway transport in the CEECs saw roughly 12% growth in tonnage carried in 2002 compared with 2001, when tonne-kilometres carried had been flat. This rebound broke the downward trend which had prevailed throughout 1998, 1999 and 2000.

24 ECMT, 2004
Nevertheless, the tonne-kilometres carried in 2002 represented less than half of the activity recorded prior to the process of transition. It should be pointed out, however, that this downward trend was compounded by traffic difficulties on the Yugoslavian part of the Danube, which severely penalised inland waterway transport.
Among the poor performances were those of the Slovak (-41.5%), Polish (-11%) and Czech (-10.4%) networks. In contrast, the Bulgarian, Romanian and Hungarian networks recorded exceptional growth, in excess of 30%, reaping the benefits of a return to navigation on the Danube. Croatia itself recorded a more than 15% rise in activity, even if volumes remained low in absolute value.
All told, an overview of the long-term trend shows that inland waterway transport seems to have lost nearly half of its freight transport business since the start of the transition process -- a remarkably poor performance, albeit less so than that of rail transport. It must be borne in mind, however, that the armed conflicts which shook the region have had major repercussions on the performance of inland waterway transport over the past ten years.
Oil pipeline transport
After a year of sharp growth in 2001, oil pipeline transport contracted in 2002, the downturn being especially steep in Latvia, where the volume dropped by 32.6%. Although the volumes involved were much smaller, the decrease was over 15% in Bulgaria as well. Poland itself -- the region’s leading market -- recorded a drop of more than 1%.
The strong showings in Albania and in Serbia and Montenegro (respectively +16.7% and +26.7%) were not enough to offset declines elsewhere.
Overall, oil pipeline transport does not seem to have declined since 1990; indeed, it even grew by more than 15%, an enviable performance compared with that of rail or inland waterway transport. It should also be

25 ECMT, 2004
noted that the number of tonne-kilometres carried by oil pipeline in the region was more than four and a half times the volume carried by inland waterway.
2.3 Freight transport in the countries of the CIS
In the member states of the CIS, rail confirmed its position as the dominant mode for freight transport, accounting for practically 87% of the market in tonne-kilometres in 2002, with road transport carrying only a little more than 9% of this amount and inland waterways a scant 4%.
Trends in market share (in %) of the various modes Freight transport in t-km
1980 1985 1990 1995 2000 2002
Rail 87.6 87.6 84.5 84.7 86.0 86.8Road 6.7 6.8 9.4 10.1 9.4 9.2Inland waterways 5.7 5.6 6.1 5.3 4.6 4.0
100 100 100 100 100 100

26 ECMT, 2004
Trends in freight transport (tonne-kilometres) - CIS countries -- 1990=100
0
20
40
60
80
100
120
1990
1991
1992
1993
1994
1995
1996
1997
1998
1999
2000
2001
2002
Railways Roads
Inland waterways PipelinesSource: ECMT
Railways and roads, 6 countries: AZE, BLR, GEO, MDA, RUS, UKR Inland waterways, 2 countries: BLR, RUS Pipelines, 2 countries: AZE, RUS
Given the foregoing, the performance of rail can be taken as an indicator of the economic situation and, in this respect, it may be noted that rail transport in the CIS increased by more than 5.9% in 2002 -- a very positive performance which exceeded the 4% growth seen in 2001 compared to 2000. Actually, rail activity in the CIS was strong in 2002 in all of the constituent countries, led by the 32.5% growth of the Moldovan railways, a 15% increase in Belarus and an 8.8% rise in Ukraine. The performance of the Russian Federation’s railways was average, at +5.3%.
Despite these signs of recovery, which were discernible throughout the period 1999-2002, rail transport in the CIS carried only a little more than 55% as many tonne-kilometres as in 1990, reflecting the economic situation, which, it was true, was improving as a result of the positive reforms implemented, but which

27 ECMT, 2004
was still marked by the decline of heavy industries and the gradual rationalisation of production processes.
Following an 8% increase in tonne-kilometres carried by road in the CIS in 1999, compared with 1998, the years 2000 and 2001 again brought good results, with new growth in road freight traffic of over 5% each year. This is a reversal of the trend which had become apparent since 1990, with road transport registering a steady decline in activity, falling to its lowest point in 1998, with a business activity index of 38.2 (100=1990). This reversal of trend was broadly confirmed in 2002, although to a lesser extent than in 2000 and 2001, since road freight transport in the CIS grew by more than 4.3%.
Actually, the performances in 2002 were the outcome of diverging trends: sharply down in Belarus (by over 8.5%), road freight transport rose steeply in Moldova (+84%) and recorded an average increase in the Russian Federation (+4.6%). It may also be considered that it rose by practically 5.5% in Ukraine. All told, it was the regionally average growth in the Russian Federation which explains the overall CIS figure.
In the inland waterway sector, the only data available are for the Russian Federation and Belarus, the latter reporting an increase in activity of over 40% for 2002. Failing to benefit from the good economic climate, inland waterway transport declined in 2002 by over 3% in the Russian Federation. Overall, despite the positive trend in 2000 and 2001 and because of the weak figure for 2002, inland waterway transport in Russia in 2002 was down by about 60% on its 1990 level.
The Secretariat received no figures for 2002 on transport by oil pipeline in the CIS countries.

28 ECMT, 2004
3. PASSENGER TRANSPORT
3.1 Passenger transport in the countries of Western Europe
Trends in passenger transport (passenger-kilometres) - Western Europe
1970=100
0
50
100
150
200
250
300
1970
1972
1974
1976
1978
1980
1982
1984
1986
1988
1990
1992
1994
1996
1998
2000
2002
Railways Private cars Buses and coachesSource: ECMT
Railways, 18 countries: AUT, BEL, CHE, DEU, DNK, ESP, FIN,
FRA, GBR, GRC, IRL, ITA, LUX, NLD, NOR, PRT, SWE, TUR
Private cars, buses and coaches, 15 countries: BEL, CHE, DEU, DNK, ESP, FIN, FRA, GBR, GRC, ISL, ITA, NLD, NOR, PRT, SWE

29 ECMT, 2004
Passenger transport by rail
Passenger transport by rail did not continue to increase in 2002 in the countries of Western Europe, which recorded a drop of 0.9% in passenger-kilometres compared with 2001 figures. This overall decrease came in the wake of a 1.4% rise in 2001 over 2000. That rise had nonetheless been slighter than those recorded in 1998 and 1999, when passenger-kilometres increased by 4.3% and 3.1%, respectively.
The overall poor performance for the year 2002 stemmed from notable declines for the railway networks in Germany (-6%), Turkey (-6.5%), Norway (-8.6%), Greece (-9%) and Luxembourg (-22.5%). In contrast, the Irish and Swiss networks recorded the strongest growth, rising by 7.5% and 6.6% respectively. The French and UK networks saw moderate increases in passenger traffic (of respectively +2.7% and +1.5%), while the Portuguese network reported a slight growth of activity. The figures for the Netherlands show that the number of passenger-kilometres carried on its network was flat in 2002.
In all, the number of passenger-kilometres travelled on the rail networks of Western Europe in 2002 shows an increase of over 50% since 1970. Since 1990, traffic had decreased only once, in 1993, with 2002 bringing another year of decline.
Passenger transport by bus and coach
After a slightly positive overall performance in 2001, when it had grown by 0.3%, passenger transport by bus and coach, measured in passenger-kilometres, recorded sharper growth in 2002. Measured for ten countries, it grew by 1.2%.
The figure was due in part to the zero growth of passenger transport by bus and coach in Finland. The only countries which reported a substantial increase in passenger-kilometres transported by bus and coach were Germany (+11.4%), Sweden (+5.8%) and Iceland (+4%).
In contrast, Portugal, the United Kingdom and Spain suffered respective declines of 11%, 4.2% and 3.2%.

30 ECMT, 2004
Italy recorded an increase in bus and coach services, while Norway registered a slight decrease.
In all, passenger transport by bus and coach increased by over 56% from 1970 to 2002 and was able, in 2000, 2001 and 2002, to make up the decline in activity seen in 1999. As a result, 2002 was a record year, compared with rail passenger transport.
Transport by car
Travel by private car in passenger-kilometres appears to have risen dramatically since 1970, increasing in overall volume by a factor of almost 2.6 despite the slight fall recorded for 2000. In contrast, growth was significant in both of the following years, with practically 2.3% in 2002, on the heels of a 3.4% rise in 2001.
This good performance can be explained by the increase in traffic in 2002 in Spain (+9.6%), Iceland (+4%) and Norway (+2.8%). Average increases were recorded in the Netherlands (+1.8%), Finland (+2.3%) and Sweden (+2.4%). To a lesser extent, travel by car in passenger-kilometres was also up in Italy (+0.9%). Car traffic in 2002 was marginally higher in France (+0.8%) and did not decline in any country.

31 ECMT, 2004
3.2 Passenger transport in the CEECs and the Baltic States
Trends in passenger transport (passenger-kilometres) - Eastern Europe and the
Baltic States - 1970=100
0
50
100
150
200
250
1970
1972
1974
1976
1978
1980
1982
1984
1986
1988
1990
1992
1994
1996
1998
2000
2002
Railways Buses and coachesSource: ECMT
Railways and buses and coaches, 15 countries: ALB, BGR, BIH,
CZE, EST, HRV, HUN, LTU, LVA, MKD, POL, ROM, SVK, SVN, YUG
Passenger transport by rail
Passenger transport by rail continued and even stepped up its decline in the CEECs throughout 2002. Passenger-kilometres travelled on the region’s rail networks overall appear to be down by 7.4% in 2002 compared with 2001, a much bigger decrease than that reported in 2001 compared with 2000.
The biggest decreases in activity were suffered in FRY Macedonia (-26.3%), Romania (-22.5%), Bulgaria (-13.1%), Albania (-10.9%), the Czech Republic (-9.6%) and Serbia and Montenegro (-9.2%). Other large

32 ECMT, 2004
markets, such as Poland and the Slovak Republic, also recorded declines of practically 5%.
Only three countries experienced a favourable trend: Latvia, with +5.4%; Hungary, with +5.3%; and Slovenia, with +4.8%. But these three countries had little impact, given the widespread decline in passenger rail traffic in the CEECs and in the Baltic States.
All told, after more than a decade of decline, the number of passenger-kilometres recorded by the rail networks of Central and Eastern Europe in 2002 came to just barely over 45% of the total travelled in 1970 and practically one-third of their performance in 1989, showing that the railways were the biggest losers during the transition to a market economy and the purchasing power gains that came with it.
Passenger transport by bus and coach
The reversal, in 2001, of the downward trend in passenger transport by bus and coach in the CEECs and the Baltic States could not be confirmed in 2002. In fact, volume seemed to have dipped by 1.9% in 2002 from 2001, rejoining the downward slope which had been interrupted only once since 1988, in 2001.
This overall picture is the net result of trends in Romania (-25.3%), Slovenia (-22.2%), Albania (-19.3%), the Czech Republic (-8.9%), Estonia (-5.3%) and Poland (-5.5%).
The rare instances of traffic growth, in countries like Bulgaria (+13.5%) and Serbia and Montenegro (+9%), were not enough to offset the declines in a majority of countries.
Overall, with the years of persistent decline experienced since 1990 and broken only in 2001, passenger transport by bus and coach in the CEECs in 2002 seems to have been slightly below its 1970 levels, after seeing higher levels in 1989, when it had been twice as high as in 1970.

33 ECMT, 2004
Transport by car
If modes of public passenger transport were the losers in the march towards market economies and rising living standards, individual motorised transport seems to have recorded further growth in 2002.
The number of passenger-kilometres travelled by private car has been increasing steadily since 1987 in the CEECs and showed a further increase, of 4.4%, in 2002.
Of the six countries which provided data (ALB, CZE, HUN, POL, SVK, SCG), only Hungary experienced virtually flat growth in traffic. In contrast, Albania, Poland and the Slovak Republic reported substantial increases, of respectively +14.2%, +6.1% and +3.8%. The Czech Republic and Serbia and Montenegro also recorded positive growth, but which was below the average (respectively, +2.8% and +1.6%).

34 ECMT, 2004
3.3 Passenger transport in the CIS countries
Trends in passenger transport (passenger-kilometres) -- CIS countries, 1990=100
0
20
40
60
80
100
120
1990
1991
1992
1993
1994
1995
1996
1997
1998
1999
2000
2001
2002
Railways Buses and coachesSource: ECMT
Railways, 6 countries: AZE, BLR, GEO, MDA, RUS, UKR Buses and coaches, 5 countries: AZE, BLR, MDA, RUS, UKR
Passenger transport by rail
After a steady decline in passenger-kilometres since 1994, broken only in 2000, 2002 saw a further fall of 2.3% in passenger transport by rail in the CIS countries. The railways’ level of activity in 2002 thus appears to be down by more than half compared to that of 1990.
The only positive notes in the overall picture were sounded by Moldova (+9.2%) and, to a lesser extent, Ukraine (+1.8%). Passenger transport by rail was down in the Russian Federation (-3.2%) and even more markedly in Belarus (-6%).
All told, taking the example of Russia, passenger transport by rail has fallen by practically 40% since 1970 and by over 60% since 1990.

35 ECMT, 2004
Passenger transport by bus and coach
After falling by 4.75% on average in the CIS countries in 2001, passenger transport by bus and coach again fell in 2002, by 2.5%.
The negative performance in 2002 was chiefly the result of the sharp fall in passenger transport by bus and coach in the Russian Federation. Total passenger-kms by bus and coach services in Russia fell by 3.2%. Passenger transport by bus and coach was also down in Belarus by practically 4.3%. In contrast, Moldova (+21.5%) and Ukraine (+6.8%) recorded increases in the number of passenger-kilometres transported by their carriers in 2002.
Looking at the long-term trend, and taking the example of Russia, passenger transport by bus and coach in 2002 was up by more than 40% on its 1970 level but well down on 1990, when it was 2.6 times the 1970 level.
4. ROAD SAFETY
In 2002, road accidents in the ECMT Member countries killed over 90 000 people and injured more than 2.1 million. These figures show a rise in the number of deaths compared with those of the previous year, and they represent a frightening human sacrifice. Every year, the number killed is equivalent to the population of a town such as Namur (B), Nancy (F) or Reykjavik (ISL) and the number hospitalised to that of a city such as Rome (I), Lisbon (P), Nagoya (JPN) or Denver (USA).
In any event, these figures reflect significantly different situations from one country or region to another.
36 ECMT, 2004
4.1 Road safety figures for the countries of Western Europe
In the countries of Western Europe, all indicators pertaining to road safety show an improvement in 2002, after the improvement already made in 2001:
− The number of accidents fell by more than 0.5% in 2002 -- a modest figure but one which confirms the end, recorded in 2000, of a period of six consecutive years during which the number had risen (by 22% between 1993 and 1999).
− The number of casualties (injured + killed) on Western European roads fell by 2.6% in 2002 -- a percentage figure comparable to that of 2001, confirming the end of a period of three consecutive years (1997-99) in which the situation had worsened.
− Lastly, the number of road fatalities fell slightly, by practically 0.1% in 2002, which confirms the uninterrupted downward trend for this indicator since 1992. In all, the annual number of deaths on Western European roads was more than 45% lower in 2002 than in 1970.

37 ECMT, 2004
Trends in road accidents (number) - Western Europe - 1970=100
0
20
40
60
80
100
120
1970
1972
1974
1976
1978
1980
1982
1984
1986
1988
1990
1992
1994
1996
1998
2000
2002
Accidents Killed and injured Fatalities
Source: ECMT
Accidents, killed and injured, 20 countries: AUT, BEL, CHE, DEU, DNK, ESP, FIN, FRA, GBR, GRC, IRL, ISL, ITA, LIE, LUX, NLD, NOR, PRT, SWE, TUR
Despite this general improvement, the situation in 2002 varied considerably from one country to another in terms both of the most recent trends and of the relative degree of risk on the roads:
− While the number of people killed in 2002 fell significantly in Greece (-12.7%), Ireland (-8.5%), France (-6.2%) and Switzerland (-5.7%), it rose sharply in Turkey (+38.5%), Iceland (+20.8%) and Norway (+12.7%), which were thus exceptions among the West European countries.
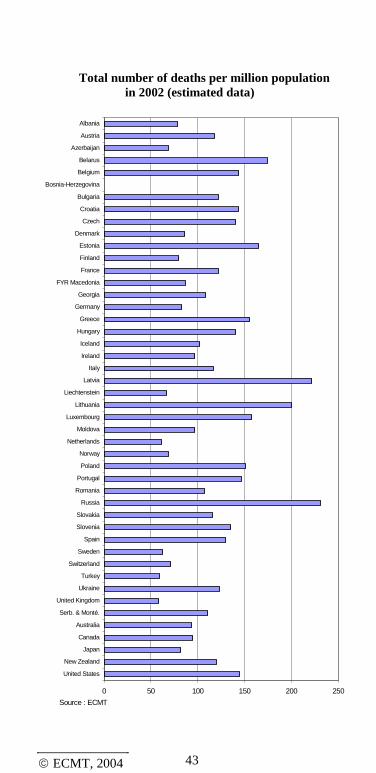
− The total number of fatalities per million inhabitants ranged from as many as 155 in Greece, 146 in Portugal, 144 in Belgium and 129 in Spain to 62 in Sweden, 61 in the Netherlands and 58 in the United Kingdom.

38 ECMT, 2004
For information, the figures for the same indicator were 144 in the United States, 119 in New Zealand, 93 in Australia and 81 in Japan.
− In relation to the number of cars on the roads, the total number of fatalities per million motor vehicles varied from as many as 417 in Turkey, 386 in Greece, 283 in Belgium, 221 in Ireland, 126 in Sweden and 119 in the United Kingdom. By way of comparison, the number of fatalities per million motor vehicles was 172 in New Zealand, 189 in the United States, 164 in Canada, 150 in Australia and 138 in Japan.
4.2 Road safety figures for the CEECs
In the CEECs, the main statistical indicators for road safety in 2002 exhibited a less favourable trend than in Western Europe, although the situation varied across countries:
− The number of road accidents was down by 2.3% -- an improvement after two consecutive years of deterioration. The figure was nevertheless up by over 4% on that of 2000.
− The number of casualties (killed + injured) dropped by 0.1%. Here again, we find confirmation of the downward trend observed in 1998, 1999 and 2000 but contradicted in 2001. Despite this positive result, the number of victims in 2002 was up by more than 2% on the figure for 2000.
− In 2002, there was a rise of 0.3% in the number of fatalities on the roads of Central and Eastern European countries. This increase, although relatively slight, fails to confirm the good results for 2000 (-4.8%) and 2001 (-4.7%). The fact remains that the overall number of fatalities over the past 15 years has increased by nearly 8% in the CEE countries but has fallen by nearly 17% in Western Europe over the same period.

39 ECMT, 2004
Trends in road accidents (number) -- Eastern Europe and the Baltic States --
1970=100
0
20
40
60
80
100
120
140
160
180
1970
1972
1974
1976
1978
1980
1982
1984
1986
1988
1990
1992
1994
1996
1998
2000
2002
Accidents Killed and injured Fatalities
Source: ECMT
Accidents, killed and injured, 13 countries: ALB, BGR, CZE, EST, HRV, HUN, LTU, LVA, MKD, POL, ROM, SVK, SVN
In terms both of the trend observed in 2002 and of the relative degree of risk on the roads in that year, however, we find very different situations from one country to another:
− In 2002, the number of fatalities fell very substantially in Serbia and Montenegro (-34%), Albania (-15.8%) and, to a lesser extent, Bulgaria (-5.1%), Slovenia (-3.2%), Croatia (-3.1%) and Romania (-2.6%). The situation of other CEECs worsened in this respect. The record in FYR Macedonia (+64.5%), Hungary (+15.3%) and Estonia (+12.6%) was particularly bad.
− As regards the number of fatalities per million inhabitants, the situation also varied

40 ECMT, 2004
considerably from one country to another, the ratio being as high as 220 in Latvia, 202 in Lithuania and 143 in Poland, but no higher than 77 in Albania and 52 in FYR Macedonia and in Bosnia and Herzegovina.
− The above figures provide certain information on the relative degree of risk on roads in the different countries, but they are significantly influenced by the levels of car ownership in each one. In order to get a better grasp of the situation, it is essential to take account of another indicator -- the number of fatalities per million motorised vehicles. This varies considerably from one country to another, ranging from as many as 2 009 in Bosnia and Herzegovina, 1 631 in Albania and 777 in Latvia, to 360 in Estonia, 309 in Bulgaria and 291 in Slovenia. Although this indicator should be used cautiously, given the current uncertainty surrounding the assessment of the total number of cars on the roads, it nevertheless reveals rather different levels of road safety between Eastern and Western Europe.
4.3 Road safety figures for the countries of the CIS
For 2002, the data on the CIS show increases of 10.1% in the number of accidents, 11.9% in the number of casualties and 6.5% in the number of fatalities on the roads. This particularly negative result does not confirm the steady fall in all indicators, which had been seen every year since 1991, with the sole exceptions of 1998 and 2001. Nevertheless, since 1991, the number of fatalities on the road networks in the CIS countries appears to have dropped by more than 15%, and the number of victims has fallen by almost 16%.

41 ECMT, 2004
Trends in road accidents (number) CIS countries - 1990=100
0
20
40
60
80
100
120
1990
1991
1992
1993
1994
1995
1996
1997
1998
1999
2000
2001
2002
Accidents Killed and injured Fatalities
Source: ECMT
Accidents, killed and injured, 6 countries: AZE, BLR, GEO, MDA, RUS, UKR
Within this region there are, however, significant differences from one country to another:
− As to the most recent trend, it will be noted that, while 2002 saw no increase in the number of fatalities in Moldova, this indicator was not down for any other country. There was a significant increase in Belarus (+8.4%) and in the Russian Federation, which recorded an increase of over 7.5% in the number of road fatalities. The latter exceeded 40 000, or nearly as many fatalities as across the territory of all the Western and CEE countries.
− The number of fatalities per million inhabitants, which rose to 230 in the Russian Federation and 174 in Belarus, fell to 69 in Azerbaijan, whereas the number of fatalities

42 ECMT, 2004
per million motorised vehicles was higher than 1 000 in practically all the countries of the CIS (1 363 in Azerbaijan and 1 260 in the Russian Federation, but 925 in Belarus). While the relative level of risk varies from one country to another, it is generally very high compared with the level in Western European countries.
43 ECMT, 2004
Total number of deaths per million population in 2002 (estimated data)
0 50 100 150 200 250
United States
New Zealand
Japan
Canada
Australia
Serb. & Monté.
United Kingdom
Ukraine
Turkey
Switzerland
Sweden
Spain
Slovenia
Slovakia
Russia
Romania
Portugal
Poland
Norway
Netherlands
Moldova
Luxembourg
Lithuania
Liechtenstein
Latvia
Italy
Ireland
Iceland
Hungary
Greece
Germany
Georgia
FYR Macedonia
France
Finland
Estonia
Denmark
Czech
Croatia
Bulgaria
Bosnia-Herzegovina
Belgium
Belarus
Azerbaijan
Austria
Albania
Source : ECMT

44 ECMT, 2004
Total number of deaths per million road motor vehicles in 2002 (estimated data)
0 250 500 750 1000 1250 1500 1750
United States
New Zealand
Japan
Canada
Australia
Serb. & Monté.
United Kingdom
Ukraine
Turkey
Switzerland
Sweden
Spain
Slovenia
Slovakia
Russia
Romania
Portugal
Poland
Norway
Netherlands
Moldova
Luxembourg
Lithuania
Liechtenstein
Latvia
Italy
Ireland
Iceland
Hungary
Greece
Germany
Georgia
FYR Macedonia
France
Finland
Estonia
Denmark
Czech
Croatia
Bulgaria
Bosnia-Herzegovina
Belgium
Belarus
Azerbaijan
Austria
Albania
Source : ECMT

45 ECMT, 2004
TABLES
A. FREIGHT TRANSPORT
B. PASSENGER TRANSPORT
C. ROAD ACCIDENTS


47 ECMT, 2004
A. FREIGHT TRANSPORT Thousand million tonne-kilometres
Table A1: Rail
02/01*ALB 0.2 0.5 0.6 0.0 0.0 10.5ARMAUT 9.9 11.0 12.7 16.9 17.1 1.4AZE 24.6 33.2 37.1 6.1BEL 7.8 8.0 8.4 7.1 7.3 2.8BGR 13.9 17.7 14.1 4.9 4.6 -5.6BIH 3.4 4.4 4.0 0.2BLR 50.1 66.3 75.4 29.7 34.2 14.9CHE 6.6 7.4 8.3 10.5 9.6 -8.7CSK 55.9 66.2 59.5CZE 16.9 15.8 -6.6DEU 70.5 63.8 61.4 74.3 72.0 -3.0DNK 1.9 1.6 1.8 1.9ESP 10.3 11.3 11.6 12.3 12.2 -0.6EST 5.0 5.9 7.0 8.6 9.7 13.3FIN 6.0 8.2 7.9 9.9 9.7 -2.0FRA 67.6 64.8 49.7 50.3 50.0 -0.7GBR 24.6 17.6 16.0 19.4 18.7 -3.6GEO 9.8 13.7 10.8GRC 0.7 0.8 0.6 0.4 0.3 -13.7HRV 5.7 7.6 6.5 2.1 2.2 6.4HUN 19.8 24.4 16.8 7.7 c 7.8IRL 0.5 0.6 0.6 0.5 0.4 -17.4ISLITA 18.1 18.4 21.2 24.4 23.1 -5.3LIELTU 13.6 18.2 19.3 7.7 9.8 26.2LUX 0.8 0.7 0.7 0.6 0.6 -3.3LVA 15.5 17.6 18.5 14.2 15.0 5.9M DA 10.4 15.2 14.8 2.0 2.7 32.5M KD 0.6 0.7 0.8 0.5 0.3 -27.7M LTNLD 3.7 3.4 3.1 4.3 4.0 -6.1NOR 1.4 1.7 1.6 1.9 1.7 -12.8POL 99.3 134.7 83.5 47.7 46.6 -2.3PRT 0.8 1.0 1.6 2.1 2.2 2.7ROM 48.0 75.5 57.3 18.0 17.5 -2.6RUS 2494.7 3439.9 2523.0 c 1433.6 1510.2 5.3SVK 10.9 10.4 -5.0SVN 3.3 3.9 4.2 2.8 3.1 8.5SW E 17.3 16.6 19.1 19.5TUR 6.1 5.2 8.0 7.6 7.2 -4.5UKR 488.2 177.5 193.1 8.8YUG 6.2 8.5 7.7 2.0 2.3 14.0ECM T/W EST 254.5 242.0 234.2 264.0 257.1 e -2.6ECM T/CEECs 290.4 385.8 299.8 144.1 145.2 e 0.7ECM T/CIS 2589.7 3568.3 3149.4 1653.0 1751.0 e 5.9
1970 1980 1990 2001 2002
ECMT/WEST = 18 countries: AUT, BEL, CHE, DEU, DNK, ESP, FIN, FRA,
GBR, GRC, IRL, ITA, LUX, NLD, NOR, PRT, SWE, TUR ECMT/CEECs = 15 countries: ALB, BGR, BIH, CZE, EST, HRV, HUN, LTU,
LVA, MKD, POL, ROM, SVK, SVN, YUG ECMT/CIS = 6 countries: AZE, BLR, GEO, MDA, RUS, UKR * -0.5% < 0 < 0.5%. e = estimate. c = change in the series.

48 ECMT, 2004
FREIGHT TRANSPORT Thousand million tonne-kilometres
Table A2 : Roads
02/01*ALB 0.8 1.3 1.2 2.2 2.4 5.4ARM
AUT 2.9 1 7.9 1 9.0 17.6 17.8 1.5AZE 3.7 7.5 3.3 4.8BEL 13.1 18.3 32.0 53.2BGR 7.0 13.1 13.8 3.3 3.9 18.7BIH 0.8 4.4 3.1BLR 8.1 16.8 22.4 8.7 7.9 -8.8CHE 4.8 7.3 11.5CSK 10.1 21.3 23.3CZE 37.3 45.1 20.9DEU 78.0 124.4 169.9 289.0 285.2 -1.3DNK 7.8 7.9 9.4 10.9ESP 51.7 89.5 90.5 161.0 179.5 11.5EST 2.3 4.2 4.5 4.7 4.4 -6.2FIN 12.4 18.4 25.4 26.7 28.1 5.2FRA 66.3 98.1 114.8 189.0 188.6 -0.2GBR 85.0 91.1 132.9 152.1 154.0 1.3GEO 2.4 2.6GRC 7.0 12.5
HRV 1.3 1 2.6 1 2.9 1 6.8 c 7.5HUN 5.8 11.4 15.2 11.8 10.6 -10.5IRL 5.0 5.1 12.4ISL 0.0 0.0ITA 58.7 119.6 177.9 154.8 160.0 3.4
LIE 0.0 0.0 0.0 0.7 1
LTU 3.4 6.9 7.3 8.3 10.7 29.4LUX 0.1 0.3 0.5 0.5 3.2LVA 2.9 5.1 5.9 5.4 6.2 14.9M DA 3.2 5.6 6.3 0.6 1.2 83.7M K D 0.8 2.5 2.2 2.3 2.6 14.1M LT 0.0 0.0 0.0 0.0NLD 12.4 17.7 22.9 31.0 30.1 -3.0NOR 3.2 5.3 8.2 13.3 13.6 2.5POL 15.8 44.5 40.3 74.4 74.7 0.4PRT 11.8 10.9 10.0 8.8 -12.4ROM 5.2 11.8 5.2 10.6 11.0 3.1RUS 0.0 241.4 299.4 159.9 167.2 4.6SVK 20.2 22.3 10.4SVN 2.1 3.9 4.9 5.5 4.6 -16.3SW E 17.8 21.4 26.5 30.0 31.8 6.2TUR 17.4 37.6 65.7 151.4 150.9 -0.3UKR 14.8 8.7 9.1 5.3YUG 2.8 5.4 9.3 2.9 3.1 7.2ECM T/W EST 438.6 690.6 925.7 1340.3 e 1365.0 e 1.8ECM T/CEECs 61.1 138.6 139.0 196.0 209.4 e 6.8ECM T/CIS 15.0 273.6 348.7 183.2 191.0 e 4.3
1970 1980 1990 2001 2002
ECMT/WEST = 19 countries: AUT, BEL, CHE, DEU, DNK, ESP, FIN, FRA,
GBR, GRC, IRL, ITA, LIE, LUX, NLD, NOR, PRT, SWE, TUR
ECMT/CEECs = 15 countries: ALB, BGR, BIH, CZE, EST, HRV, HUN, LTU, LVA, MKD, POL, ROM, SVK, SVN, YUG
ECMT/CIS = 6 countries: AZE, BLR, GEO, MDA, RUS, UKR 1. Excluding road transport for own account * -0.5% < 0 < 0.5%. e = estimate. c = change in the series.

49 ECMT, 2004
FREIGHT TRANSPORT Thousand million tonne-kilometres
Table A3: Inland waterways
02/01*ALBARMAUT 1.3 1.6 1.7 2.6 2.8 11.3AZEBEL 6.7 5.9 5.4BGR 1.8 2.6 1.6 0.4 0.6 56.4BIHBLR 1.2 1.9 1.8 0.0 0.1 43.9CHE 0.1 0.1 0.2CSK 2.4 3.6 4.4CZE 0.6 0.5 -10.4DEU 48.8 51.4 54.8 64.8 64.2 -1.0DNKESPEST 0.0 0.0 0.0FIN 2.0 1.8 1.1 0.4 0.4 -4.6FRA 12.7 10.9 7.6 8.3 8.3 -0.3GBR 0.4 0.2 0.2GEOGRCHRV 0.3 0.6 0.5 0.1 0.1 15.4HUN 1.8 2.1 2.0 1.3 1.7 32.5IRLISLITA 0.4 0.2 0.1 0.1 0.1 -42.3LIELTU 0.1 0.2 0.2 0.0 0.0 0.0LUX 0.3 0.3 0.3 0.4 0.4 -1.4LVA 0.1 0.1 0.3MDA 0.1 0.3 0.3 0.0MKDMLTNLD 30.7 33.5 35.7 41.9 40.9 -2.4NORPOL 2.3 2.3 1.0 1.3 1.1 -10.9PRTROM 1.3 2.4 2.1 2.7 3.6 32.6RUS 163.9 228.2 213.9 82.8 80.2 -3.1SVK 1.0 0.6 -41.5SVNSWETURUKR 11.9YUG 3.5 4.2 3.2 1.0 1.1 10.3ECMT/WEST 103.4 106.0 107.1 125.3 e 123.6 e -1.3ECMT/CEECs 13.6 18.1 15.4 8.3 9.3 12.0ECMT/CIS 165.1 230.1 215.8 82.9 80.3 -3.1
1970 1980 1990 2001 2002
ECMT/WEST = 10 countries: AUT, BEL, CHE, DEU, FIN, FRA, GBR, ITA,
LUX, NLD ECMT/CEECs = 11 countries: BGR, CZE, EST, HRV, HUN, LTU, LVA, POL,
ROM, SVK, YUG ECMT/CIS = 2 countries: BLR, RUS * -0.5% < 0 < 0.5%. e = estimate. c = change in the series.

50 ECMT, 2004
FREIGHT TRANSPORT Thousand million tonne-kilometres
Table A4: Pipeline
02/01*ALB 0.0 0.0 16.7ARMAUT 3.6 7.1 6.4 8.1AZE 1.0 1.6 3.4 1.6BEL 0.3 1.8 1.0BGR 0.8 0.6 0.3 0.3 -15.6BIHBLRCHE 1.2 1.1 1.2 0.2 0.2 -1.7CSK 6.4 9.8 7.5CZE 1.7 1.7 3.4DEU 15.1 13.1 11.7 15.8 15.2 -3.5DNK 2.9ESP 1.0 3.0 4.2 7.8 7.8 0.5ESTFINFRA 28.2 34.7 19.6 21.2 20.7 -2.4GBR 2.7 10.1 10.2 11.5GEOGRCHRV 3.6 1.2 1.6 34.5HUN 1.0 4.4 5.3 4.9 4.9 0.2IRLISLITA 9.1 11.9 11.5 10.7 10.8 0.8LIELTU 4.8 4.9 2.3LUXLVA 7.5 5.1 -32.6MDAMKDMLTNLD 4.1 5.0 4.9 5.8 6.0 3.3NOR 2.1 3.7 3.6 -2.2POL 7.0 17.1 13.9 21.1 20.9 -1.1PRTROM 1.8 5.2 5.1 1.8 1.8 0.6RUS 243.0 1087.0 2575.0 c 1961.5SVKSVNSWETUR 1.4 13.7 62.4 43.5 24.7 -43.3UKR 208.0YUG 0.1 0.1 0.3 0.4 26.6ECMT/WEST 66.7 101.5 138.0 136.5 e 111.8 e -18.1ECMT/CEECs 16.2 37.3 36.0 43.6 41.5 -4.7ECMT/CIS 244.0 1088.6 2578.4 1963.2 e 1963.2 e 0.0
1970 1980 1990 2001 2002
ECMT/WEST = 12 countries: AUT, BEL, CHE, DEU, DNK, ESP, FRA, GBR,
ITA, NLD, NOR, TUR ECMT/CEECs = 10 countries: ALB, BGR, CZE, HRV, HUN, LTU, LVA, POL,
ROM, YUG ECMT/CIS = 2 countries: AZE, RUS * -0.5% < 0 < 0.5%. e = estimate. c = change in the series.

51 ECMT, 2004
FREIGHT TRANSPORT Thousand million tonne-kilometres
Table A5: Total freight (A1+A2+A3+A4)
02/01*A LB 0.9 1.8 1.8 2.3 2.4 5.5A RM 0.0 0.0 0.0 0.0 0.0
A UT 17.6 27.5 29.7 45.1A ZE 29.3 42.3 43.7 12.6BEL 27.9 34.0 46.9BGR 22.7 34.1 30.1 8.9 9.4 5.6BIH 4.2 8.8 7.1BLR 59.4 85.0 99.6 38.5 42.2 9.6C H E 12.8 15.9 21.2C SK 74.8 100.9 94.7 0.0 0.0C ZE 0.0 0.0 0.0 56.4 63.1 11.8D EU 212.4 252.7 297.8 443.8 436.6 -1.6D NK 9.7 9.5 14.0ESP 63.1 103.8 106.4 181.1 199.6 10.2EST 7.4 10.1 11.5 13.2 14.1 6.4FIN 20.4 28.4 34.4 37.0 38.2 3.2FRA 174.8 208.4 191.7 268.8 267.5 -0.5G BR 119.2 159.3 183.3G EO 9.8 16.1 13.4G RC 7.6 13.1
H R V 7.3 10.8 13.5 10.1 c 11.4H U N 28.4 42.3 39.3 25.7 c 24.9IRL 0.5 5.6 5.7 12.9ISL 0.0 0.0 0.0 0.0 0.0ITA 86.2 150.1 210.7 189.9 193.9 2.1
LIE 0.0 0.0 0.0 0.7LTU 17.1 25.3 26.8 20.8 25.4 22.0LUX 1.2 1.3 1.5 1.5 -0.7LVA 18.5 22.8 24.7 27.1 26.3 -3.0M D A 13.7 21.1 21.4 2.7 3.9 44.3M K D 1.4 3.2 3.0 2.8 3.0 7.1M LT 0.0 0.0 0.0 0.0 0.0N LD 50.9 59.6 66.5 83.1 81.0 -2.4N O R 4.6 6.9 11.9 18.9 18.9 0.0PO L 124.3 198.7 138.7 144.4 143.2 -0.8PRT 0.8 12.8 12.5 12.1 11.0 -9.7R O M 56.4 94.8 69.6 33.1 33.9 2.3R US 2901.6 4996.5 5611.3 c 3637.8SV K 0.0 0.0 0.0 32.2 33.3 3.6SV N 5.4 7.8 9.1 8.3 7.7 -7.8SW E 35.1 38.0 45.6 49.5TUR 25.0 56.4 136.2 202.5 182.8 -9.7U K R 0.0 0.0 722.9 186.1 202.3 8.7Y UG 12.4 18.2 20.4 6.2 6.9 11.0ECM T/W EST 863.2 1140.2 1405.1 1866.0 e 1857.5 e -0.5ECM T/CEECs 381.3 579.9 490.2 392.1 405.4 e 3.4ECM T/CIS 3013.8 5160.9 6512.4 3887.3 3990.6 e 2.7
1970 1980 1990 2001 2002
ECMT/WEST = 19 countries: AUT, BEL, CHE, DEU, DNK, ESP, FIN, FRA,
GBR, GRC, IRL, ITA, LIE, LUX, NLD, NOR, PRT, SWE, TUR
ECMT/CEECs = 15 countries: ALB, BGR, BIH, CZE, EST, HRV, HUN, LTU, LVA, MKD, POL, ROM, SVK, SVN, YUG
ECMT/CIS = 6 countries: AZE, BLR, GEO, MDA, RUS, UKR 1. Excluding road transport for own account * -0.5% < 0 < 0.5%. e = estimate. c = change in the series.

53 ECMT, 2004
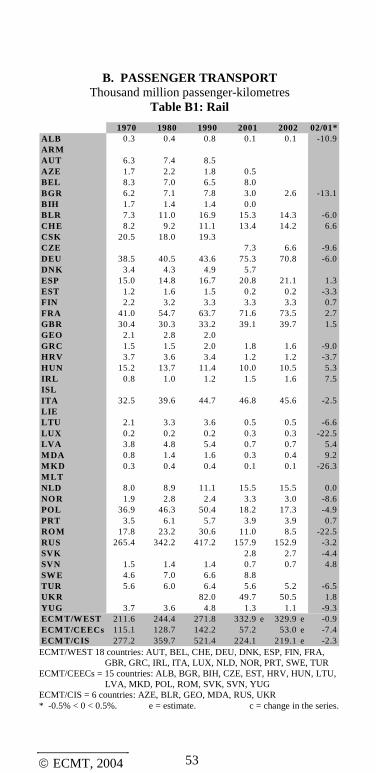
B. PASSENGER TRANSPORT Thousand million passenger-kilometres
Table B1: Rail
02/01*ALB 0.3 0.4 0.8 0.1 0.1 -10.9ARMAUT 6.3 7.4 8.5AZE 1.7 2.2 1.8 0.5BEL 8.3 7.0 6.5 8.0BGR 6.2 7.1 7.8 3.0 2.6 -13.1BIH 1.7 1.4 1.4 0.0BLR 7.3 11.0 16.9 15.3 14.3 -6.0CHE 8.2 9.2 11.1 13.4 14.2 6.6CSK 20.5 18.0 19.3CZE 7.3 6.6 -9.6DEU 38.5 40.5 43.6 75.3 70.8 -6.0DNK 3.4 4.3 4.9 5.7ESP 15.0 14.8 16.7 20.8 21.1 1.3EST 1.2 1.6 1.5 0.2 0.2 -3.3FIN 2.2 3.2 3.3 3.3 3.3 0.7FRA 41.0 54.7 63.7 71.6 73.5 2.7GBR 30.4 30.3 33.2 39.1 39.7 1.5GEO 2.1 2.8 2.0GRC 1.5 1.5 2.0 1.8 1.6 -9.0HRV 3.7 3.6 3.4 1.2 1.2 -3.7HUN 15.2 13.7 11.4 10.0 10.5 5.3IRL 0.8 1.0 1.2 1.5 1.6 7.5ISLITA 32.5 39.6 44.7 46.8 45.6 -2.5LIELTU 2.1 3.3 3.6 0.5 0.5 -6.6LUX 0.2 0.2 0.2 0.3 0.3 -22.5LVA 3.8 4.8 5.4 0.7 0.7 5.4M DA 0.8 1.4 1.6 0.3 0.4 9.2M KD 0.3 0.4 0.4 0.1 0.1 -26.3M LTNLD 8.0 8.9 11.1 15.5 15.5 0.0NOR 1.9 2.8 2.4 3.3 3.0 -8.6POL 36.9 46.3 50.4 18.2 17.3 -4.9PRT 3.5 6.1 5.7 3.9 3.9 0.7ROM 17.8 23.2 30.6 11.0 8.5 -22.5RUS 265.4 342.2 417.2 157.9 152.9 -3.2SVK 2.8 2.7 -4.4SVN 1.5 1.4 1.4 0.7 0.7 4.8SW E 4.6 7.0 6.6 8.8TUR 5.6 6.0 6.4 5.6 5.2 -6.5UKR 82.0 49.7 50.5 1.8YUG 3.7 3.6 4.8 1.3 1.1 -9.3ECM T/WEST 211.6 244.4 271.8 332.9 e 329.9 e -0.9ECM T/CEECs 115.1 128.7 142.2 57.2 53.0 e -7.4ECM T/CIS 277.2 359.7 521.4 224.1 219.1 e -2.3
1970 1980 1990 2001 2002
ECMT/WEST 18 countries: AUT, BEL, CHE, DEU, DNK, ESP, FIN, FRA,
GBR, GRC, IRL, ITA, LUX, NLD, NOR, PRT, SWE, TUR ECMT/CEECs = 15 countries: ALB, BGR, BIH, CZE, EST, HRV, HUN, LTU,
LVA, MKD, POL, ROM, SVK, SVN, YUG ECMT/CIS = 6 countries: AZE, BLR, GEO, MDA, RUS, UKR * -0.5% < 0 < 0.5%. e = estimate. c = change in the series.

54 ECMT, 2004
PASSENGER TRANSPORT Thousand million passenger-kilometres
Table B2: Private cars
02/01*ALB 5.2 5.9 14.2ARMAUT 43.5 54.1AZE 0.0BEL 49.3 65.4 80.7BGR 3.7 4.5 0.0 0.0BIHBLR 0.0 0.0 0.0 0.0 0.0CHE 41.8 61.8 73.3 84.3CSKCZE 63.4 65.2 2.8DEU 350.6 466.5 593.2DNK 33.3 38.1 50.3 59.3ESP 64.3 130.9 174.4 308.0 337.6 9.6EST 0.0 0.0 0.0 0.0 0.0FIN 23.7 34.8 51.2 57.0 58.3 2.3FRA 305.0 453.0 586.0 727.6 733.5 0.8GBR 283.0 367.0 588.0 624.0GEOGRC 19.1HRV 0.0 0.0HUN 7.3 36.0 47.0 46.2 46.3 0.3IRLISL 2.7 3.9 4.1 4.0ITA 211.9 324.0 522.6 773.7 780.6 0.9LIE 0.0 0.0 0.0LTU 0.0 0.0 0.0 0.0 0.0LUXLVA 0.0 0.0 0.0 0.0 0.0MDA 0.0 0.0 0.0 0.0 0.0MKD 0.0 0.0MLT 0.0 0.0 0.0 0.0NLD 66.3 108.1 137.3 141.6 144.2 1.8NOR 17.8 30.4 42.7 47.9 49.2 2.8POL 0.0 0.0 68.1 c 157.7 167.4 6.2PRT 13.8 29.0 40.5ROM 0.0 0.0RUS 0.0 0.0 0.0 0.0 0.0SVK 24.1 25.0 3.8SVN 0.0 0.0SWE 56.1 67.4 86.4 91.6 93.8 2.4TURUKR 0.0 43.9YUG 4.1 12.6 17.3 9.6 9.8 1.6ECMT/WEST 1521.0 2185.6 3048.4 3871.9 e 3961.8 e 2.3ECMT/CEECs 11.3 48.6 132.4 c 306.2 319.6 4.4ECMT/CIS
1970 1980 1990 2001 2002
ECMT/WEST = 15 countries: BEL, CHE, DEU, DNK, ESP, FIN, FRA, GBR,
GRC, ISL, ITA, NLD, NOR, PRT, SWE ECMT/CEECs = 6 countries: ALB, CZE, HUN, POL, SVK, YUG * -0.5% < 0 < 0.5%. e = estimate. c = change in the series.

55 ECMT, 2004
PASSENGER TRANSPORT Thousand million passenger-kilometres
Table B3: Buses and coaches
02/01*ALB 0.8 1.4 2.2 0.2 0.2 -19.3ARMAUT 12.5 13.6AZE 3.1 5.7 6.7 9.0BEL 9.3 9.1 5.0 cBGR 12.2 21.6 25.9 15.0 17.0 13.5BIH 1.2 4.1 2.7BLR 8.4 14.4 19.8 9.5 9.1 -4.2CHE 3.0 4.4 5.6CSK 21.4 33.8 43.4CZE 10.6 9.7 -8.9DEU 48.6 65.6 56.6 68.7 76.5 11.4DNK 4.6 6.1 7.6 9.0ESP 20.9 28.1 33.4 51.7 50.1 -3.2EST 2.6 3.7 4.5 2.5 2.3 -5.3FIN 7.5 8.5 8.5 7.7 7.7 0.0FRA 25.2 38.0 41.3 41.3 40.3 -2.4GBR 60.0 52.0 46.0 48.0 46.0 -4.2GEOGRC 4.8 5.8 5.1HRV 3.3 7.1 7.0 3.5 3.6 2.3HUN 13.5 26.4 24.1 18.3 18.4 0.4IRLISL 0.3 0.5 0.5 3.9ITA 32.0 57.8 84.0 95.8 97.5 1.7LIE 0.0 0.0 0.0LTU 4.9 6.7 6.7 1.6 1.5 -4.8LUXLVA 3.3 4.5 5.9 2.3 2.4 2.4M DA 1.9 3.9 4.9 1.1 1.3 21.5M KD 1.0 2.2 1.5 0.8 1.0 25.4M LT 0.0 0.0 0.0 0.0NLD 11.1 13.2 13.1NOR 4.2 4.9 4.6 6.2 6.1 -1.7POL 29.1 49.2 46.3 31.0 29.3 -5.5PRT 4.4 7.6 10.3 11.2 9.9 -11.0ROM 7.9 24.0 24.0 7.1 5.3 -25.3RUS 100.1 209.7 262.2 154.9 149.9 -3.2SVK 8.3 8.2 -0.2SVN 2.6 4.9 6.6 1.5 1.1 -22.2SW E 5.5 7.3 9.0 10.3 10.9 5.8TURUKR 90.3 10.2 10.9 6.8YUG 6.4 12.4 7.9 5.4 5.8 9.0ECM T/W EST 241.1 308.4 330.4 384.1 e 388.6 e 1.2ECM T/CEECs 110.4 202.0 208.5 109.1 107.0 e -1.9ECM T/CIS 113.5 233.6 383.9 184.7 180.0 e -2.5
1970 1980 1990 2001 2002
ECMT/WEST = 15 countries: BEL, CHE, DEU, DNK, ESP, FIN, FRA, GBR,
GRC, ISL, ITA, NLD, NOR, PRT, SWE ECMT/CEECs = 15 countries: ALB, BGR, BIH, CZE, EST, HRV, HUN, LTU,
LVA, MKD, POL, ROM, SVK, SVN, YUG ECMT/CIS = 5 countries: AZE, BLR, MDA, RUS, UKR * -0.5% < 0 < 0.5%. e = estimate. c = change in the series.
56 ECMT, 2004
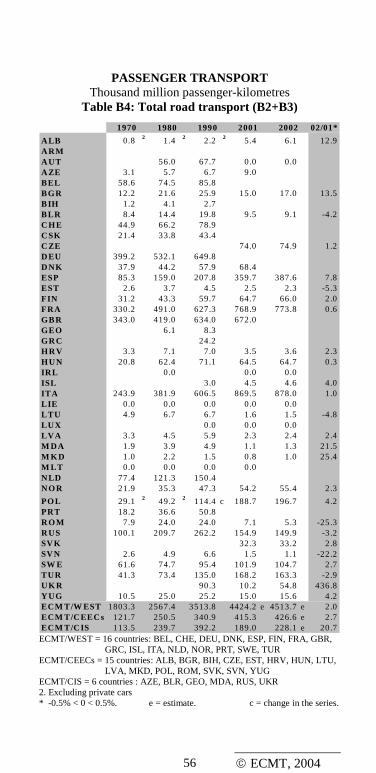
PASSENGER TRANSPORT Thousand million passenger-kilometres
Table B4: Total road transport (B2+B3)
02/01*
ALB 0.8 2 1.4 2 2.2 2 5.4 6.1 12.9ARMAUT 56.0 67.7 0.0 0.0AZE 3.1 5.7 6.7 9.0BEL 58.6 74.5 85.8BGR 12.2 21.6 25.9 15.0 17.0 13.5BIH 1.2 4.1 2.7BLR 8.4 14.4 19.8 9.5 9.1 -4.2CHE 44.9 66.2 78.9CSK 21.4 33.8 43.4CZE 74.0 74.9 1.2DEU 399.2 532.1 649.8DNK 37.9 44.2 57.9 68.4ESP 85.3 159.0 207.8 359.7 387.6 7.8EST 2.6 3.7 4.5 2.5 2.3 -5.3FIN 31.2 43.3 59.7 64.7 66.0 2.0FRA 330.2 491.0 627.3 768.9 773.8 0.6GBR 343.0 419.0 634.0 672.0GEO 6.1 8.3GRC 24.2HRV 3.3 7.1 7.0 3.5 3.6 2.3HUN 20.8 62.4 71.1 64.5 64.7 0.3IRL 0.0 0.0 0.0ISL 3.0 4.5 4.6 4.0ITA 243.9 381.9 606.5 869.5 878.0 1.0LIE 0.0 0.0 0.0 0.0 0.0LTU 4.9 6.7 6.7 1.6 1.5 -4.8LUX 0.0 0.0 0.0LVA 3.3 4.5 5.9 2.3 2.4 2.4M DA 1.9 3.9 4.9 1.1 1.3 21.5M KD 1.0 2.2 1.5 0.8 1.0 25.4M LT 0.0 0.0 0.0 0.0NLD 77.4 121.3 150.4NOR 21.9 35.3 47.3 54.2 55.4 2.3
POL 29.1 2 49.2 2 114.4 c 188.7 196.7 4.2PRT 18.2 36.6 50.8ROM 7.9 24.0 24.0 7.1 5.3 -25.3RUS 100.1 209.7 262.2 154.9 149.9 -3.2SVK 32.3 33.2 2.8SVN 2.6 4.9 6.6 1.5 1.1 -22.2SW E 61.6 74.7 95.4 101.9 104.7 2.7TUR 41.3 73.4 135.0 168.2 163.3 -2.9UKR 90.3 10.2 54.8 436.8YUG 10.5 25.0 25.2 15.0 15.6 4.2ECM T/W EST 1803.3 2567.4 3513.8 4424.2 e 4513.7 e 2.0ECM T/CEECs 121.7 250.5 340.9 415.3 426.6 e 2.7ECM T/CIS 113.5 239.7 392.2 189.0 228.1 e 20.7
1970 1980 1990 2001 2002
ECMT/WEST = 16 countries: BEL, CHE, DEU, DNK, ESP, FIN, FRA, GBR,
GRC, ISL, ITA, NLD, NOR, PRT, SWE, TUR ECMT/CEECs = 15 countries: ALB, BGR, BIH, CZE, EST, HRV, HUN, LTU,
LVA, MKD, POL, ROM, SVK, SVN, YUG ECMT/CIS = 6 countries : AZE, BLR, GEO, MDA, RUS, UKR 2. Excluding private cars * -0.5% < 0 < 0.5%. e = estimate. c = change in the series.
57 ECMT, 2004
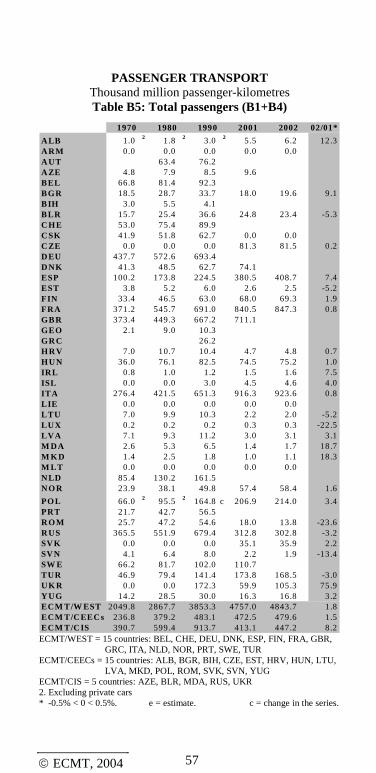
PASSENGER TRANSPORT Thousand million passenger-kilometres Table B5: Total passengers (B1+B4)
02/01*
ALB 1.0 2 1.8 2 3.0 2 5.5 6.2 12.3ARM 0.0 0.0 0.0 0.0 0.0AUT 63.4 76.2AZE 4.8 7.9 8.5 9.6BEL 66.8 81.4 92.3BGR 18.5 28.7 33.7 18.0 19.6 9.1BIH 3.0 5.5 4.1BLR 15.7 25.4 36.6 24.8 23.4 -5.3CHE 53.0 75.4 89.9CSK 41.9 51.8 62.7 0.0 0.0CZE 0.0 0.0 0.0 81.3 81.5 0.2DEU 437.7 572.6 693.4DNK 41.3 48.5 62.7 74.1ESP 100.2 173.8 224.5 380.5 408.7 7.4EST 3.8 5.2 6.0 2.6 2.5 -5.2FIN 33.4 46.5 63.0 68.0 69.3 1.9FRA 371.2 545.7 691.0 840.5 847.3 0.8GBR 373.4 449.3 667.2 711.1GEO 2.1 9.0 10.3GRC 26.2HRV 7.0 10.7 10.4 4.7 4.8 0.7HUN 36.0 76.1 82.5 74.5 75.2 1.0IRL 0.8 1.0 1.2 1.5 1.6 7.5ISL 0.0 0.0 3.0 4.5 4.6 4.0ITA 276.4 421.5 651.3 916.3 923.6 0.8LIE 0.0 0.0 0.0 0.0 0.0LTU 7.0 9.9 10.3 2.2 2.0 -5.2LUX 0.2 0.2 0.2 0.3 0.3 -22.5LVA 7.1 9.3 11.2 3.0 3.1 3.1M DA 2.6 5.3 6.5 1.4 1.7 18.7M KD 1.4 2.5 1.8 1.0 1.1 18.3M LT 0.0 0.0 0.0 0.0 0.0NLD 85.4 130.2 161.5NOR 23.9 38.1 49.8 57.4 58.4 1.6
POL 66.0 2 95.5 2 164.8 c 206.9 214.0 3.4PRT 21.7 42.7 56.5ROM 25.7 47.2 54.6 18.0 13.8 -23.6RUS 365.5 551.9 679.4 312.8 302.8 -3.2SVK 0.0 0.0 0.0 35.1 35.9 2.2SVN 4.1 6.4 8.0 2.2 1.9 -13.4SW E 66.2 81.7 102.0 110.7TUR 46.9 79.4 141.4 173.8 168.5 -3.0UKR 0.0 0.0 172.3 59.9 105.3 75.9YUG 14.2 28.5 30.0 16.3 16.8 3.2ECM T/W EST 2049.8 2867.7 3853.3 4757.0 4843.7 1.8ECM T/CEECs 236.8 379.2 483.1 472.5 479.6 1.5ECM T/CIS 390.7 599.4 913.7 413.1 447.2 8.2
1970 1980 1990 2001 2002
ECMT/WEST = 15 countries: BEL, CHE, DEU, DNK, ESP, FIN, FRA, GBR,
GRC, ITA, NLD, NOR, PRT, SWE, TUR ECMT/CEECs = 15 countries: ALB, BGR, BIH, CZE, EST, HRV, HUN, LTU,
LVA, MKD, POL, ROM, SVK, SVN, YUG ECMT/CIS = 5 countries: AZE, BLR, MDA, RUS, UKR 2. Excluding private cars * -0.5% < 0 < 0.5%. e = estimate. c = change in the series.


59 ECMT, 2004
C. ROAD ACCIDENTS Thousands
Table C1: Number of accidents 02/01*
ALB 0.4 0.3 -18.0ARMAUT 51.6 46.2 46.3 43.1 43.2 0.2AZE 2.0BEL 77.0 60.8 62.4 47.4BGR 5.7 6.5 6.7 6.8 0.9BIHBLR 6.3 7.2 13.9CHE 28.7 25.6 23.8 23.9 23.6 -1.0CSK 33.5 24.1 30.1CZE 26.0 26.6 2.1DEU 377.6 379.2 340.0 375.3 362.1 -3.5DNK 19.8 12.3 9.2 6.9 7.1 3.9ESP 58.0 67.8 101.5 100.4 98.4 -2.0EST 2.2 1.7 2.1 1.9 2.2 14.5FIN 11.4 6.8 10.2 6.5 6.2 -4.0FRA 235.1 248.5 162.6 116.7 105.5 -9.7GBR 272.8 257.3 265.6 236.5 221.8 -6.2GEO 3.0 3.1 3.0GRC 18.3 18.2 19.6 19.7 16.9 -14.5HRV 15.1 14.5 15.7 17.1 9.0HUN 23.2 19.0 27.8 18.5 19.7 6.4IRL 6.4 5.7 6.1 6.9ISL 0.7 0.5 0.6ITA 307.7 163.8 161.8 235.1 237.8 1.1LIE 0.3 0.3 0.3 0.6 0.6 1.6LTU 4.7 6.2 5.1 6.0 6.1 2.0LUX 3.1 4.0 1.2 0.8LVA 4.7 4.7 4.3 4.8 5.1 6.7M DA 3.1 4.4 6.0 2.7 2.9 8.7M KD 3.1 1.9 2.3 1.3 1.6 25.2M LT 1.0 1.1 4.0NLD 59.0 49.4 13.2 10.5 10.3 -1.1NOR 9.3 7.8 8.8 8.2 8.7 5.8POL 41.8 40.4 50.5 53.8 53.6 -0.4PRT 22.7 33.9 45.1 42.5 42.2 -0.7ROM 4.9 4.8 9.7 7.2 7.0 -2.7RUS 197.4 164.4 184.4 12.1SVK 8.2 7.9 -3.9SVN 8.3 6.9 5.2 9.2 10.3 11.9SW E 16.6 15.2 17.0 15.8 16.9 7.3TUR 19.2 36.9 115.3 409.4 439.8 7.4UKR 50.9 34.5 34.5 0.0YUG 0.0 0.0 33.6 61.7 52.1 -15.6ECM T/W EST 1595.4 1440.4 1410.7 1708.0 1697.8 -0.6ECM T/CEECs 143.3 130.5 191.8 221.4 216.2 -2.3ECM T/CIS 6.1 7.5 269.8 211.7 e 233.1 e 10.1
1970 1980 1990 2001 2002
ECMT/WEST = 21 countries: AUT, BEL, CHE, DEU, DNK, ESP, FIN, FRA,
GBR, GRC, IRL, ISL, ITA, LIE, LUX, MLT, NLD, NOR, PRT, SWE, TUR
ECMT/CEECs = 14 countries: ALB, BGR, CZE, EST, HRV, HUN, LTU, LVA, MKD, POL, ROM, SVK, SVN, YUG
ECMT/CIS = 6 countries: AZE, BLR, GEO, MDA, RUS, UKR * -0.5% < 0 < 0.5%. e = estimate. c = change in the series.

60 ECMT, 2004
ROAD ACCIDENTS Thousands
Table C2: Casualties [killed+injured]
02/01*ALB 0.5 0.5 -12.6ARMAUT 72.7 64.4 62.0 57.2 57.6 0.7AZE 2.8BEL 107.8 84.7 88.2 66.8BGR 7.3 8.4 9.0 8.1 -9.9BIHBLR 8.0 9.2 15.1CHE 37.7 33.6 30.2 30.7 30.3 -1.4CSK 44.2 31.9 40.4CZE 33.7 34.4 2.1DEU 551.0 513.5 456.1 501.8 483.3 -3.7DNK 26.7 15.8 11.3 8.9ESP 87.0 112.7 162.4 155.1 152.3 -1.8EST 2.3 2.1 2.8 2.6 3.1 16.8FIN 17.1 9.0 13.4 8.8 8.6 -3.1FRA 344.7 352.2 236.1 161.7 145.1 -10.3GBR 371.5 335.9 352.9 326.5 302.6 -7.3GEO 4.3 4.7 4.6GRC 25.7 26.7 29.1 27.8 24.0 -13.6HRV 22.2 21.2 22.7 24.6 8.0HUN 31.9 25.5 39.4 25.4 27.4 8.0IRL 9.8 9.1 9.9 10.6ISL 0.9 0.7 0.9ITA 238.4 231.4 227.6 348.0 344.6 -1.0LIE 0.1 0.1 0.1 0.2 0.1 -18.3LTU 4.9 5.5 6.4 7.8 8.1 4.0LUX 2.5 2.4 1.8 1.2LVA 5.0 4.5 5.6 6.4 6.8 7.0M DA 3.6 5.1 7.8 3.7 3.9 6.2M KD 2.7 2.9 3.3 1.9 2.6 34.2M LT 1.2 1.3 6.5NLD 71.4 58.6 15.0 11.0 11.0 -0.1NOR 12.3 10.6 12.2 11.8 12.7 7.7POL 37.8 52.2 66.9 68.2 67.5 -1.0PRT 30.3 43.4 65.7 58.5 58.1 -0.8ROM 6.3 5.6 11.9 8.4 8.2 -3.0RUS 165.6 250.2 187.8 215.7 14.9SVK 11.5 10.9 -5.0SVN 11.2 9.9 7.1 13.0 14.4 10.8SW E 23.5 20.1 23.3 22.9 25.3 10.4TUR 20.8 28.8 94.0 97.5 116.4 19.5UKR 63.1 44.2 43.9 -0.7YUG 1.8 25.1 27.4 21.2 15.6 -26.4ECM T/W EST 2052.0 1953.5 1892.3 1909.5 1859.8 e -2.6ECM T/CEECs 169.8 194.7 240.7 232.3 232.1 -0.1ECM T/CIS 7.9 175.4 342.1 e 249.2 278.8 e 11.9
1970 1980 1990 2001 2002
ECMT/WEST = 21 countries: AUT, BEL, CHE, DEU, DNK, ESP, FIN, FRA,
GBR, GRC, IRL, ISL, ITA, LIE, LUX, MLT, NLD, NOR, PRT, SWE, TUR
ECMT/CEECs = 14 countries: ALB, BGR, CZE, EST, HRV, HUN, LTU, LVA, MKD, POL, ROM, SVK, SVN, YUG
ECMT/CIS = 6 countries: AZE, BLR, GEO, MDA, RUS, UKR * -0.5% < 0 < 0.5%. e = estimate. c = change in the series.

61 ECMT, 2004
ROAD ACCIDENTS Thousands
Table C3: Killed
02/01*ALB 0.3 0.3 -15.8ARMAUT 2.2 1.7 1.4 1.0 1.0 -0.2AZE 0.6BEL 3.0 2.4 2.0 1.5BGR 1.2 1.6 1.0 1.0 -5.1BIHBLR 1.6 1.7 8.4CHE 1.7 1.2 1.0 0.5 0.5 -5.7CSK 2.2 1.9 2.0CZE 1.3 1.4 7.3DEU 19.2 13.0 7.9 7.0 6.8 -1.9DNK 1.2 0.7 0.6 0.4 0.5 7.4ESP 4.2 5.0 6.9 5.5 5.3 -3.1EST 0.3 0.3 0.4 0.2 0.2 12.6FIN 1.1 0.6 0.6 0.4 0.4 -4.2FRA 15.1 12.5 10.3 7.7 7.2 -6.2GBR 7.8 6.2 5.4 3.6 3.4 -4.6GEO 0.8 0.9 1.1GRC 0.9 1.2 1.7 1.9 1.7 -12.7HRV 1.6 1.4 0.6 0.6 -3.1HUN 1.7 1.6 2.4 1.2 1.4 15.3IRL 0.5 0.6 0.5 0.4 0.4 -8.5ISL 0.0 0.0 0.0 0.0 0.0 20.8ITA 10.2 8.5 6.6 6.7 6.7 0.8LIE 0.0 0.0 0.0 0.0LTU 0.7 0.8 0.9 0.7 0.7 -1.3LUX 0.1 0.1 0.1 0.1LVA 0.6 0.7 0.9 0.5 0.5 0.2M DA 0.6 0.9 1.1 0.4 0.4 -0.2M KD 0.1 0.2 0.2 0.1 0.2 64.5M LT 0.0 0.0 0.0NLD 3.2 2.0 1.4 1.0 1.0 -0.6NOR 0.6 0.4 0.3 0.3 0.3 12.7POL 3.4 6.0 7.3 5.5 5.8 5.3PRT 1.4 2.3 2.3 1.5 1.5 0.2ROM 1.9 1.9 3.8 2.5 2.4 -2.6RUS 27.5 35.4 30.9 33.2 7.5SVK 0.6 0.6 0.2SVN 0.6 0.6 0.5 0.3 0.3 -3.2SW E 1.3 0.8 0.8 0.6 0.6 -3.9TUR 4.0 4.2 6.3 3.0 4.1 38.6UKR 9.6 5.9 6.0 1.4YUG 1.4 2.0 2.1 1.3 0.8 -33.6ECM T/W EST 77.7 63.6 56.2 43.0 43.0 e -0.1ECM T/CEECs 15.1 e 18.7 23.6 16.2 16.3 0.3ECM T/CIS 1.4 29.3 50.6 e 39.9 42.5 e 6.5
1970 1980 1990 2001 2002
ECMT/WEST = 21 countries: AUT, BEL, CHE, DEU, DNK, ESP, FIN, FRA,
GBR, GRC, IRL, ISL, ITA, LIE, LUX, MLT, NLD, NOR, PRT, SWE, TUR
ECMT/CEECs = 14 countries: ALB, BGR, CZE, EST, HRV, HUN, LTU, LVA, MKD, POL, ROM, SVK, SVN, YUG
ECMT/CIS = 6 countries: AZE, BLR, GEO, MDA, RUS, UKR * -0.5% < 0 < 0.5%. e = estimate. c = change in the series.

������������� ������������������������������ ��������
���������!����
"����##$�#������%� ���&��'���#(�(�$�)��*+��($ ���##$
100x205_e.fm Page 2 Thursday, March 25, 2004 3:49 PM