Embed Size (px)
Citation preview

For peer review only
TRENDS IN THE PREVALENCES OF CONGENITAL ANOMALIES
AND AGE AT MOTHERHOOD IN A SOUTHERN EUROPEAN
REGION
Journal: BMJ Open
Manuscript ID: bmjopen-2013-004244
Article Type: Research
Date Submitted by the Author: 18-Oct-2013
Complete List of Authors: Cambra, Koldo; Navarrabiomed-Fundación Miguel Servet- Red de Investigación en Servicios de Salud en Enfermedades Crónicas (REDISSEC)., Ibañez, Berta; Navarrabiomed-Fundación Miguel Servet- Red de Investigación en Servicios de Salud en Enfermedades Crónicas (REDISSEC)., Urzelai, Deiene; Gobierno Vasco, Departamento de Salud Portillo, Isabel; Osakidetza- Servicio Vasco de Salud, Montoya, Imanol; Osakidetza-Servicio Vasco de Salud, Esnaola, Santiago; Gobierno Vasco, Departamento de Salud Cirarda, Francisco; Gobierno Vasco, Departamento de Salud
<b>Primary Subject Heading</b>:
Epidemiology
Secondary Subject Heading: Public health, Reproductive medicine
Keywords: Congenital anomalies, Birth defects, Chromosomal anomalies, Trends, Maternal age
For peer review only - http://bmjopen.bmj.com/site/about/guidelines.xhtml
BMJ Open on July 23, 2020 by guest. P
rotected by copyright.http://bm
jopen.bmj.com
/B
MJ O
pen: first published as 10.1136/bmjopen-2013-004244 on 3 M
arch 2014. Dow
nloaded from

For peer review only
1
TRENDS IN THE PREVALENCES OF CONGENITAL ANOMALIES AND AGE AT MOTHERHOOD IN A SOUTHERN EUROPEAN REGION
List of authors:
Cambra K(1), Ibañez B(1), Urzelai D(2), Portillo I(3), Montoya I(2), Esnaola S(2), Cirarda FB(2)
(1) Navarrabiomed-Fundación Miguel Servet- Red de Investigación en Servicios de Salud en Enfermedades Crónicas (REDISSEC). Pamplona, Spain
(2) Departamento de Salud. Gobierno Vasco. Vitoria, Spain
(3) Osakidetza- Servicio Vasco de Salud. Vitoria, Spain
Corresponding author:
Koldo Cambra Navarrabiomed-Fundación Miguel Servet Complejo Hospitalario de Navarra C/ Irunlarrea s/n 31008 Pamplona. Spain Tfno: 34 848428292 Fax: 34 848422200 e-mail: [email protected]
KEYWORDS:
Congenital anomalies, trends, maternal age, chromosomal anomalies, birth defects
Word count: 2735
Page 1 of 19
For peer review only - http://bmjopen.bmj.com/site/about/guidelines.xhtml
BMJ Open
123456789101112131415161718192021222324252627282930313233343536373839404142434445464748495051525354555657585960
on July 23, 2020 by guest. Protected by copyright.
http://bmjopen.bm
j.com/
BM
J Open: first published as 10.1136/bm
jopen-2013-004244 on 3 March 2014. D
ownloaded from
For peer review only
2
Abstract
Objectives. To estimate the prevalences of the main groups of congenital anomalies
and to assess their evolution from 1999 to 2008.
Design. Population-based study of prevalences.
Setting. The Basque Country, Spain.
Partipants. All births and all congenital anomalies diagnosed in the entire population from 1999 to 2008.
Main outcomes measures. Total diagnosed prevalences and prevalences at birth of all chromosomal and non chromosomal anomalies, Down’s syndrome, anomalies of the nervous system, urinary, limbs, digestive system and congenital heart defects.
Results. Mean age (SD) of women at childbirth and the proportion of them over 35 years and over 40 years shifted from 32,1(4.5) years, 18.3% and 1.4% in 1999-2001, to
32.3(4.7) years, 23.9% and 2.9% in 2006-2008.
Between 1999 and 2008, 991 cases of chromosomal anomalies and 3090 of non chromosomal anomalies were diagnosed, which yields, respectively, prevalences of 5.2‰ and 16.2‰. Among chromosomal anomalies Down’s syndrome is the most frequent (2.9‰). With marginal statistical significance, the results point at an increasing trend in diagnosed chromosomal anomalies, but a decreasing one in prevalences at birth. Among nonchromosomal congenital anomalies, congenital heart defects are the most frequent (5.2‰). Rates of all non chromosomal, urinary and limb anomalies grew during the study period with different evolutions in time, whereas those of congenital heart defects and anomalies of the digestive system did not change significantly.
Conclusion. In the Basque Country, rates of chromosomal anomalies are higher than the overall estimated prevalence in European Countries, and still keep slightly increasing, which can be related to the rise in maternal age. Rates of non chromosomal anomalies are within the European frequent range of values, and the increases observed need to be checked in the following years.
Article summary
Strengths and limitations of the study
� This study analyses the evolution of the prevalences of congenital anomalies
using highly reliable data from population-based registries.
� The study provides insight into the occurring changes in mother age, the extent of the use of antenatal diagnosis and its impact on the prevalences of congenital anomalies at birth.
� Improvements in quality and accessibility of diagnostic tests can lead to an
apparent increase in prevalences.
Page 2 of 19
For peer review only - http://bmjopen.bmj.com/site/about/guidelines.xhtml
BMJ Open
123456789101112131415161718192021222324252627282930313233343536373839404142434445464748495051525354555657585960
on July 23, 2020 by guest. Protected by copyright.
http://bmjopen.bm
j.com/
BM
J Open: first published as 10.1136/bm
jopen-2013-004244 on 3 March 2014. D
ownloaded from
For peer review only
3
INTRODUCCION
Congenital anomalies (CA) affect around 2% of births in Europe.[1] They account for a great part of neonatal mortality and morbidity, and may be an important source of distress for parents and families. In the majority of cases the aetiology of CA remains unknown. Some increasing trends have been detected by EUROCAT in the Pan-Europe analysis for several CA, such as hypospadias, abdominal wall anomalies, gastroschisis, trisomy 18 and renal dysplasia.[2] Local trends have been more frequently detected but, in general, they need further verification. Women’s age at childbirth has been on the rise in all European countries included in Eurostat during the last decades. From 2001 to 2008 the average maternal age in 17-UE
inched up from 29.5 to 30.3 years, but geographical differences remained important, with greater values in West Europe and differences between countries up to 5 years. Spain, in the fifth position of the European ranking of 2008, with a mean age of women at childbirth of 30.8 years, climbed to the top in 2011 with a mean of 31.5 years.[3] Changes in demographics and in the perception of risks, along with a generalized extension and improvement of antenatal diagnosis, have increased, in Spain and other countries, the public awareness on reproductive health issues. Improvements in antenatal diagnosis as well as in case registrations enable presently to conduct more reliable population-based studies on congenital anomalies.
The Basque Country is an industrialized, urban type community, situated in north Spain, with around 2.2 million inhabitants. Demographic changes in the last decades have been dramatic, greater than in other Spanish regions. The synthetic index of fecundity fell from 2.67 in 1975 to 1.24 in 1985, 0.97 in 1990 and 1.03 in 2000, while the average of maternity age rose from 28.6, to 29.1, 30.0, 31.3 and 32.4 years in the same calendar years.[4] Medical care and antenatal diagnosis are widely available to all pregnant women, and they are provided by the Basque Health Service to the entire population. The detection of trends is an essential component of epidemiological surveillance of congenital anomalies, valuable for care and genetic advice planning and also for
warning of environmental risk factors. Its interest actually grows in places where changes in reproductive health determinants may be occurring. This report analyses the evolution of maternal age and prevalences of congenital anomalies in a ten year period in the Basque Country, focusing on total and on specific subgroups of chromosomal and non chromosomal anomalies.
METHODS
The study period has been 1999-2008. We used data from the population based Registry of Neonatal Screening and Congenital Anomalies of the Basque Country, integrated in EUROCAT project and operating since the early 1990s. All anomalies diagnosed prenatally, at birth or during the first year of age, in all hospitals of the country are included. The registry covers affected live births, foetal births with gestational age 22 weeks or greater, and terminations of pregnancy for foetal anomaly following prenatal diagnosis.
Page 3 of 19
For peer review only - http://bmjopen.bmj.com/site/about/guidelines.xhtml
BMJ Open
123456789101112131415161718192021222324252627282930313233343536373839404142434445464748495051525354555657585960
on July 23, 2020 by guest. Protected by copyright.
http://bmjopen.bm
j.com/
BM
J Open: first published as 10.1136/bm
jopen-2013-004244 on 3 March 2014. D
ownloaded from

For peer review only
4
We estimated the prevalences and 95% confidence intervals (CI) related to mothers with residence in the Basque Country, of total chromosomal anomalies (CIE 10, Q90-93, Q96-99), total non chromosomal anomalies (Q chapter excepting chromosomal
anomalies, D215, D821, D1810, P350, P351, P371) and by subgroups, anomalies of the nervous system (Q00-07), urinary (Q60-64, Q794), limbs (Q65-74), digestive system (Q38-Q45, Q790), congenital heart defects (CHD)(Q20-26), and Down (Q90), Patau (Q914-917), Edward (Q910-913), Turner (Q96) and Klinefelter’s (Q980-984) syndromes. Other major organ subgroups of non chromosomal anomalies were not included in the analysis because their average prevalences, lower than one case per 1000 births, are too low to be assessed on a yearly basis. One case with several non- chromosomal anomalies can be assigned to more than one group but it is counted only once within each one. Minor anomalies were excluded.[1] We estimated total prevalence rates (CA in liveborns, foetal deaths and induced abortions divided by the
total number of births) and prevalence rates at birth (CA in liveborns and foetal deaths divided by the total number of births). Data related to denominators (number of births per year, place of residence and age of the mother) were obtained from the Registry of Newborns of the Basque Country. To explore the functional relationship between prevalences and time, we fitted Generalized Additive Models (GAM), for they are flexible models with no restrictions that can properly reflect the true relationship between the variables. We included the annual number of cases as a Poisson response variable, the number of births (live and still) as the offset, and the calendar year as independent variable using thin plate
regression splines. To further assess time trends, we fitted binomial regression models using a logarithmic link function, including the same former variables and adding as explanatory variable mother age group (under 30, 30-34, 35-39 and over 40 years). We also conducted Chi square tests for trends in proportions, whose p-value results are virtually identical to those from the binomial regression models. In the case of Down’s Syndrome, we also tested trends in the estimated prevalence at birth that would have occurred in the absence of antenatal diagnosis (and subsequent terminations), using for that diagnosed prevalences adjusted for the natural foetal loss risks reported by Savva.[5] Adjusting for natural foetal losses is aimed at controlling the
potential bias in the estimation of time trends in periods in which there is an increase in the number of prenatal diagnoses and, consequently, in the number of cases diagnosed prenatally that would not have survived to term and remained undiagnosed in absence of prenatal diagnosis. This study was approved by the Clinical Research Ethics Committee of the Basque Country.
Page 4 of 19
For peer review only - http://bmjopen.bmj.com/site/about/guidelines.xhtml
BMJ Open
123456789101112131415161718192021222324252627282930313233343536373839404142434445464748495051525354555657585960
on July 23, 2020 by guest. Protected by copyright.
http://bmjopen.bm
j.com/
BM
J Open: first published as 10.1136/bm
jopen-2013-004244 on 3 March 2014. D
ownloaded from
For peer review only
5
RESULTS
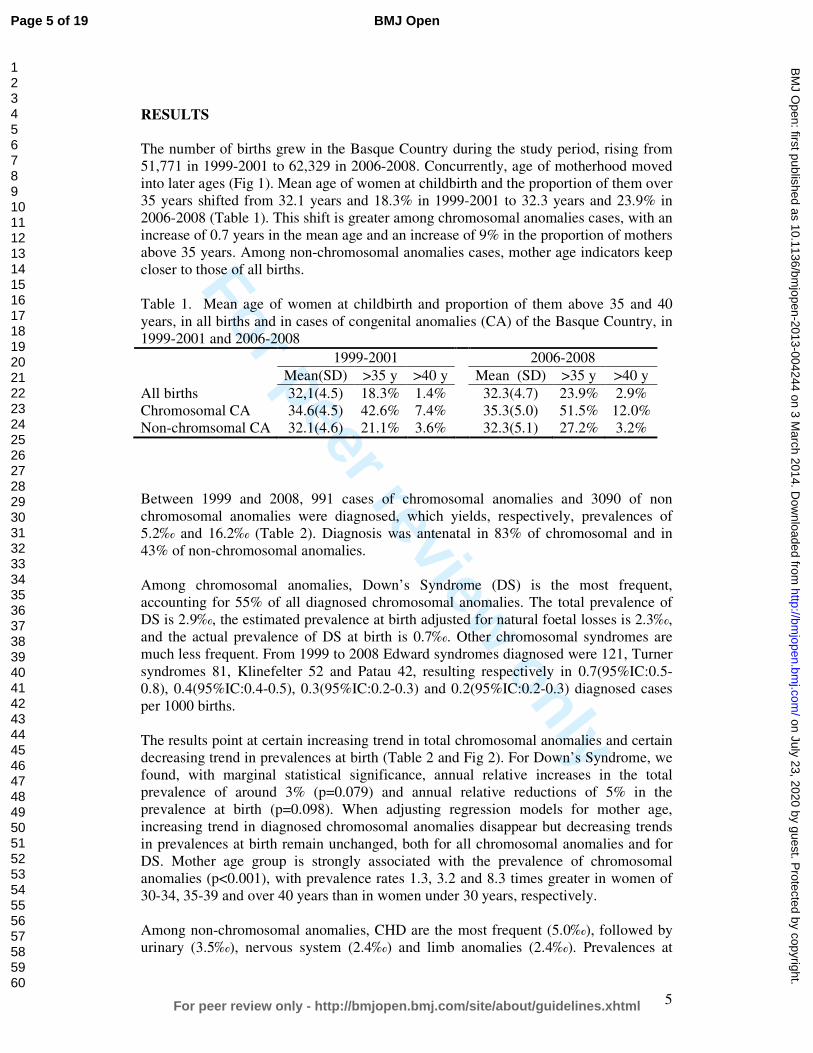
The number of births grew in the Basque Country during the study period, rising from 51,771 in 1999-2001 to 62,329 in 2006-2008. Concurrently, age of motherhood moved into later ages (Fig 1). Mean age of women at childbirth and the proportion of them over 35 years shifted from 32.1 years and 18.3% in 1999-2001 to 32.3 years and 23.9% in 2006-2008 (Table 1). This shift is greater among chromosomal anomalies cases, with an increase of 0.7 years in the mean age and an increase of 9% in the proportion of mothers above 35 years. Among non-chromosomal anomalies cases, mother age indicators keep closer to those of all births. Table 1. Mean age of women at childbirth and proportion of them above 35 and 40
years, in all births and in cases of congenital anomalies (CA) of the Basque Country, in 1999-2001 and 2006-2008
1999-2001 2006-2008
Mean(SD) >35 y >40 y Mean (SD) >35 y >40 y
All births 32,1(4.5) 18.3% 1.4% 32.3(4.7) 23.9% 2.9% Chromosomal CA 34.6(4.5) 42.6% 7.4% 35.3(5.0) 51.5% 12.0% Non-chromsomal CA 32.1(4.6) 21.1% 3.6% 32.3(5.1) 27.2% 3.2%
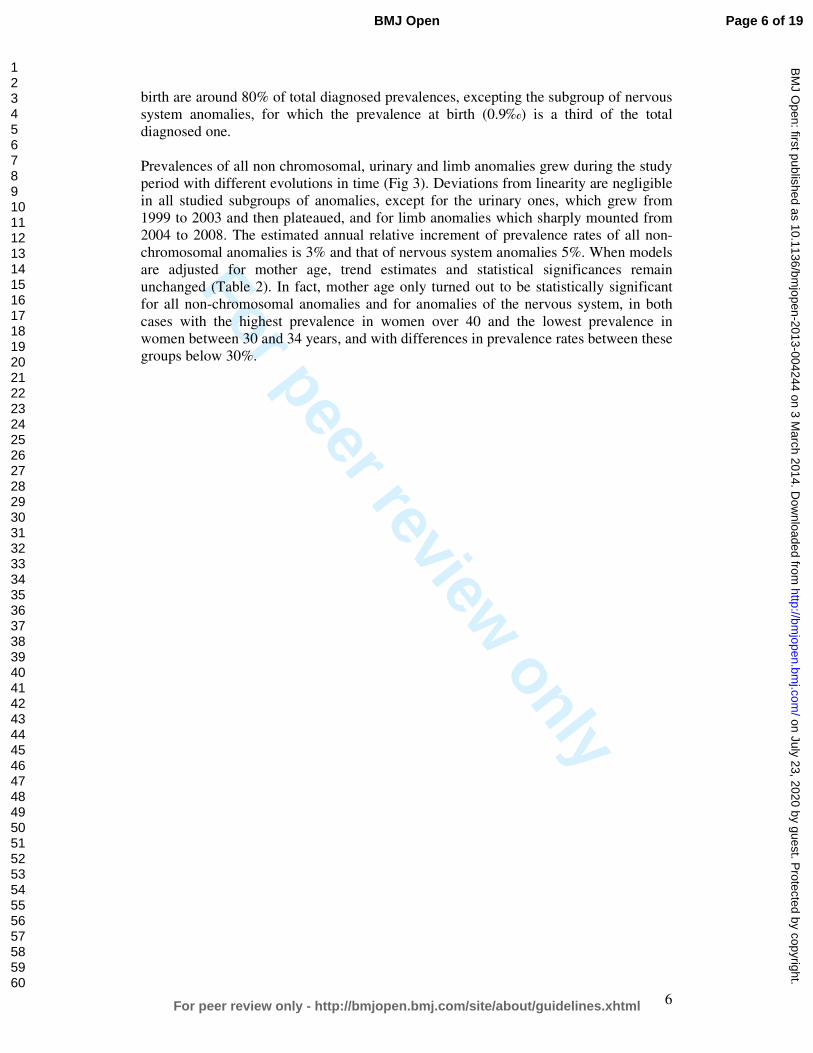
Between 1999 and 2008, 991 cases of chromosomal anomalies and 3090 of non chromosomal anomalies were diagnosed, which yields, respectively, prevalences of 5.2‰ and 16.2‰ (Table 2). Diagnosis was antenatal in 83% of chromosomal and in 43% of non-chromosomal anomalies. Among chromosomal anomalies, Down’s Syndrome (DS) is the most frequent, accounting for 55% of all diagnosed chromosomal anomalies. The total prevalence of DS is 2.9‰, the estimated prevalence at birth adjusted for natural foetal losses is 2.3‰, and the actual prevalence of DS at birth is 0.7‰. Other chromosomal syndromes are much less frequent. From 1999 to 2008 Edward syndromes diagnosed were 121, Turner
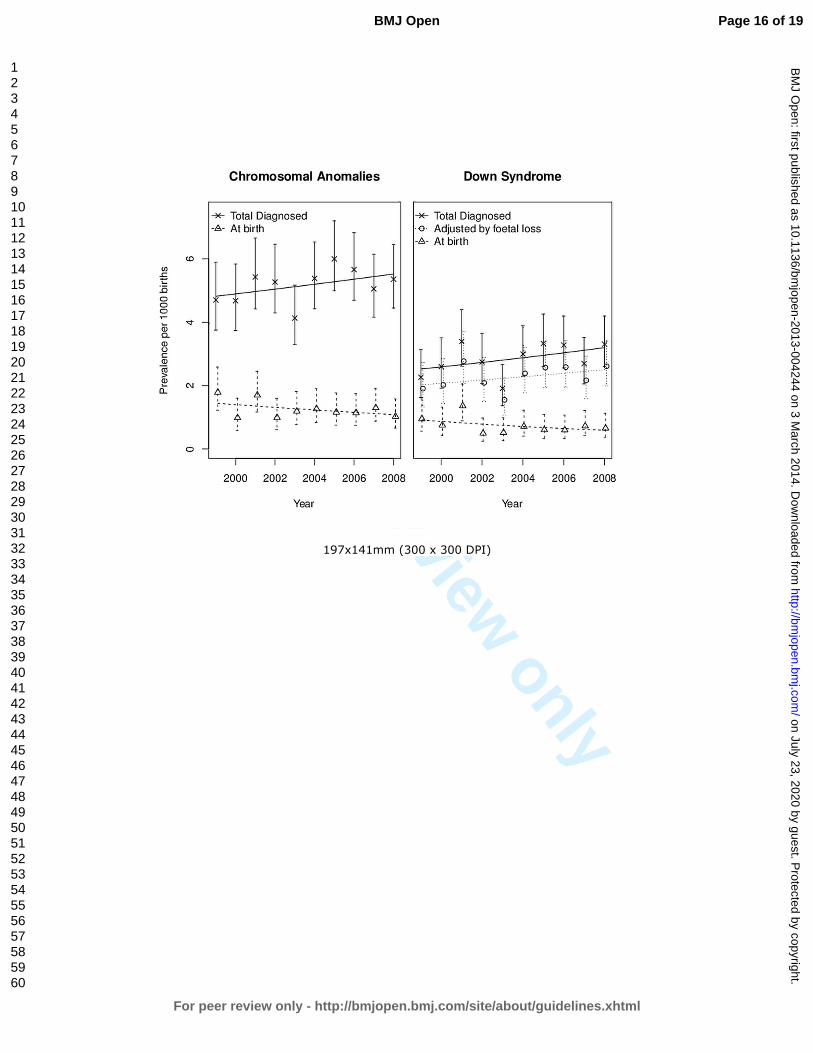
syndromes 81, Klinefelter 52 and Patau 42, resulting respectively in 0.7(95%IC:0.5-0.8), 0.4(95%IC:0.4-0.5), 0.3(95%IC:0.2-0.3) and 0.2(95%IC:0.2-0.3) diagnosed cases per 1000 births. The results point at certain increasing trend in total chromosomal anomalies and certain decreasing trend in prevalences at birth (Table 2 and Fig 2). For Down’s Syndrome, we found, with marginal statistical significance, annual relative increases in the total prevalence of around 3% (p=0.079) and annual relative reductions of 5% in the prevalence at birth (p=0.098). When adjusting regression models for mother age, increasing trend in diagnosed chromosomal anomalies disappear but decreasing trends
in prevalences at birth remain unchanged, both for all chromosomal anomalies and for DS. Mother age group is strongly associated with the prevalence of chromosomal anomalies (p<0.001), with prevalence rates 1.3, 3.2 and 8.3 times greater in women of 30-34, 35-39 and over 40 years than in women under 30 years, respectively. Among non-chromosomal anomalies, CHD are the most frequent (5.0‰), followed by urinary (3.5‰), nervous system (2.4‰) and limb anomalies (2.4‰). Prevalences at
Page 5 of 19
For peer review only - http://bmjopen.bmj.com/site/about/guidelines.xhtml
BMJ Open
123456789101112131415161718192021222324252627282930313233343536373839404142434445464748495051525354555657585960
on July 23, 2020 by guest. Protected by copyright.
http://bmjopen.bm
j.com/
BM
J Open: first published as 10.1136/bm
jopen-2013-004244 on 3 March 2014. D
ownloaded from
For peer review only
6
birth are around 80% of total diagnosed prevalences, excepting the subgroup of nervous system anomalies, for which the prevalence at birth (0.9‰) is a third of the total diagnosed one.
Prevalences of all non chromosomal, urinary and limb anomalies grew during the study period with different evolutions in time (Fig 3). Deviations from linearity are negligible in all studied subgroups of anomalies, except for the urinary ones, which grew from 1999 to 2003 and then plateaued, and for limb anomalies which sharply mounted from 2004 to 2008. The estimated annual relative increment of prevalence rates of all non-chromosomal anomalies is 3% and that of nervous system anomalies 5%. When models are adjusted for mother age, trend estimates and statistical significances remain unchanged (Table 2). In fact, mother age only turned out to be statistically significant for all non-chromosomal anomalies and for anomalies of the nervous system, in both
cases with the highest prevalence in women over 40 and the lowest prevalence in women between 30 and 34 years, and with differences in prevalence rates between these groups below 30%.
Page 6 of 19
For peer review only - http://bmjopen.bmj.com/site/about/guidelines.xhtml
BMJ Open
123456789101112131415161718192021222324252627282930313233343536373839404142434445464748495051525354555657585960
on July 23, 2020 by guest. Protected by copyright.
http://bmjopen.bm
j.com/
BM
J Open: first published as 10.1136/bm
jopen-2013-004244 on 3 March 2014. D
ownloaded from

For peer review only
7
Table 2. Trends in congenital anomalies in the Basque Country (Spain), from 1999 to 2008
Prevalences(cases/1.000) Crude change/yr Age adjusted change/yr
n 1999-2008 1999-2001 2006-2008 %(95%CI) p %(95%CI) p
Total diagnosed anomalies
Chromosomal All 991 5.2(4.9,5.5) 4.9(4.4,5.6) 5.4(4.8,6.0) 1.01(0.99,1.04) 0.174 1.00(0.98,1.02) 0.878 DS* 548 2.9(2.6, 3.1) 2.8( 2.3, 3.3) 3.1( 2.7, 3.6) 1.03(1.00,1.06) 0.079 1.01(0.98,1.04) 0.669 DS adjusted foetal loss 435 2.3(2.1, 2.5) 2.2( 1.9, 2.7) 2.5( 2.1, 2.9) 1.02(0.99,1.06) 0.161 1.00(0.97,1.04) 0.843
Non-chromosomal
All 3090 16.2(15.6,16.7) 13.8(12.8,14.8) 17.8(16.7,18.8) 1.04(1.02,1.05) <0.001 1.04(1.03,1.05) <0.001 Nervous system 456 2.4(2.2, 2.6) 2.0( 1.6, 2.4) 2.8( 2.4, 3.3) 1.05(1.01,1.08) 0.007 1.05(1.01,1.08) 0.007 Urinary 670 3.5(3.2, 3.8) 2.4( 2.0,2.9) 3.6( 3.2, 4.2) 1.04(1.02,1.07) 0.002 1.04(1.01,1.07) 0.003 Digestive 304 1.6(1.4, 1.8) 1.3( 1.0, 1.7) 1.8( 1.5, 2.2) 1.03(0.99,1.08) 0.101 1.03(0.99,1.08) 0.105 Limbs 460 2.4(2.2, 2.6) 1.6( 1.3, 2.0) 4.1( 3.6, 4.6) 1.17(1.13,1.21) <0.001 1.17(1.13,1.21) <0.001 Heart 962 5.0(4.7, 5.4) 4.9( 4.3, 5.5) 4.8( 4.3, 5.4) 1.00(0.98,1.02) 0.876 1.01(0.98,1.03) 0.619
Congenital anomalies at birth
Chromosomal All 238 1.2(1.1,1.4) 1.5(1.2,1.9) 1.2(0.9,1.5) 0.97(0.93,1.01) 0.160 0.96(0.92,1.00) 0.080 DS 139 0.7( 0.6, 0.9) 1.0( 0.8, 1.4) 0.7( 0.5, 0.9) 0.95(0.9 ,1.01) 0.098 0.95(0.89,1.01) 0.076
Non-chromosomal All 2442 12.8(12.3,13.3) 10.7( 9.9,11.7) 14.1(13.2,15.0) 1.04(1.03,1.06) <0.001 1.04(1.03,1.06) <0.001 Nervous system 166 0.9( 0.7, 1.0) 0.6( 0.4, 0.9) 1.2( 0.9, 1.5) 1.10(1.04,1.16) 0.001 1.10(1.04,1.16) 0.001 Urinary 564 3.0( 2.7, 3.2) 1.9( 1.5, 2.3) 3.1( 2.7, 3.6) 1.05(1.02,1.09) <0.001 1.05(1.02,1.09) <0.001 Digestive 276 1.4( 1.3, 1.6) 1.2( 0.9, 1.5) 1.7( 1.4, 2.0) 1.03(0.99,1.08) 0.115 1.03(0.99,1.08) 0.127 Limbs 360 1.9( 1.7, 2.1) 1.3( 1.0, 1.7) 3.2( 2.8, 3.7) 1.17(1.13,1.22) <0.001 1.17(1.13,1.22) <0.001 Heart 873 4.6( 4.3, 4.9) 4.7( 4.2, 5.4) 4.1( 3.6, 4.6) 0.98(0.96,1.01) 0.176 0.99(0.97,1.01) 0.340
* DS: Down’s Syndrome
Page 7 of 19
For peer review only - http://bmjopen.bmj.com/site/about/guidelines.xhtml
BMJ Open
123456789101112131415161718192021222324252627282930313233343536373839404142434445464748495051525354555657585960
on July 23, 2020 by guest. Protected by copyright. http://bmjopen.bmj.com/ BMJ Open: first published as 10.1136/bmjopen-2013-004244 on 3 March 2014. Downloaded from
For peer review only
8
DISCUSION
During 1999-2008 the age of women at childbirth shifted towards later ages, and there was an increase in diagnosed prevalences of chromosomal and non chromosomal anomalies in the Basque Country. Among non-chromosomal anomalies, the evolution of prevalences is particular of each subgroup, with no common pattern and in some cases with notable relative rises in magnitude. Data used in this study come from the Registry of Neonatal Screening and Congenital Anomalies of the Basque Country. The registry follows the EUROCAT project guides and it was launched several years before the initial date of this project. This makes data highly reliable and improves comparability with results from other registries.[6]
Surveillance of the evolution in time of congenital anomalies conceivably allows detecting changes in risk that may occur locally or on a greater scale. However, antenatal diagnosis leads to detect more non-viable cases that otherwise would have been miscarriages and remained undiagnosed, and therefore, improvements in quality and accessibility of diagnostic test can make the estimation of trends in congenital anomalies rates more prone to bias than in other health outcomes. This is an important issue to take into account when interpreting changes in rates of diagnosed congenital anomalies. Prevalence of chromosomal anomalies in the Basque Country are higher than the overall
estimated prevalence for Europe, 5.2‰ vs. 3.8‰ in all chromosomal anomalies, and 2.9‰ vs. 2.1‰ in the case of Down’s Syndrome.[2, 7] It is well known that older mothers are at higher risk of chromosomal anomalies, and that risk increases exponentially from the age of 30, not only for Down Syndrome, but also for other less prevalent chromosomal syndromes, such as trisomies 13 and 18.[8] The high maternal age of Basque mothers, in fact, at the top of the European ranking, can explain why prevalences of chromosomal anomalies are higher in the Basque Country. Likewise, the increase in maternal age from 1999 to 2008 would be the primary reason to explain the observed positive trend in all chromosomal anomalies and Down’s syndrome prevalences. Our findings support this view, as trends are not longer statistically
significant when adjusting for maternal age. A secondary explanation, both for trends and for the differences with other European regions, may be differences in case ascertainment derived from the increasingly frequent use of prenatal diagnoses in the Basque Country, which, in turn, is partially provoked by the rise in maternal age. Increases in prevalences of chromosomal anomalies have been also reported in other European regions.[2] Prevalences at birth of chromosomal anomalies show certain decreasing trend, which is related to the extension and use of antenatal diagnosis and the decision that most of women make after receiving a positive diagnose. On average 80% of all chromosomal
anomalies were diagnosed antenatally, 74% in 1999-2001 and 85% in 2006-2008. In the Basque Country, 90% of the women who received an antenatal diagnose of chromosomal anomaly decided to terminate the pregnancy. This proportion is similar to that found in England and Wales where, as Morris et al reported, dramatic changes in demography have been offset by improved antenatal diagnosis and have resulted in no substantial changes in birth prevalences of Down’s syndrome.[9]
Page 8 of 19
For peer review only - http://bmjopen.bmj.com/site/about/guidelines.xhtml
BMJ Open
123456789101112131415161718192021222324252627282930313233343536373839404142434445464748495051525354555657585960
on July 23, 2020 by guest. Protected by copyright.
http://bmjopen.bm
j.com/
BM
J Open: first published as 10.1136/bm
jopen-2013-004244 on 3 March 2014. D
ownloaded from

For peer review only
9
The prevalence of non chromosomal congenital anomalies in the Basque Country, contrary to chromosomal anomalies, is lower than overall rates reported in Europe, 12.8‰ vs. 20.2‰.[2] By subgroups, those of nervous system, digestive and urinary
anomalies, with deviations smaller than 10%, can be considered similar to the overall European rate; CHD rates are 20% smaller in the Basque Country. The relationship between maternal age and the prevalence of some subgroups of non chromosomal anomalies has been reported to be U-curves or J-curves, younger and older mothers showing increased risk.[10-12] Our findings are in agreement with this type of relationship. Loane et al performed a population based prevalence study, covering a total of 1.75 million births form 2000 to 2004, and they found teenage mothers to have the highest prevalence of all non-chromosomal congenital anomalies.[13] The prevalence decreased as maternal age increased, until a slight
increase was observed in mothers 40-44 years of age and a further increase in mothers above 45 years. They also reported that the maternal age pattern of risk differs between countries, and concluded that, unlike chromosomal anomalies, it is not biological age that is associated with risk of non chromosomal congenital anomalies, but reproductive, social, ethnic, exposure of lifestyle factors that have a different relationship with maternal age in different countries. They concluded that the increase of risk due to mother age can be considered negligible, especially when compared to chromosomal anomalies. Association of paternal age and risk of certain birth defects has been reported for younger paternal ages, also with relatively low increases in risk as age grows.[14]
All non chromosomal anomalies are a very broad and heterogeneous group of anomalies with different aetiology that can hardly be related to a common true change in risk. Taking into account that during the first years of the study period global prevalences were low, below 20‰, it cannot be rule out improvements in case ascertainment to be an explanation of the observed increase. For limbs and urinary anomalies, this explanation is also feasible because prevalences before the observed sudden rise are clearly below the average prevalences reported from other registries. We did not find any change in CHD prevalences, which is in line with what has been
observed in Europe, where after an increase in the early 90s due to improvements in echocardiographic investigations, rates have remained stable.[2, 15] Prevalences of congenital anomalies of nervous and digestive systems show a slight steady increase from 1999 to 2008. Decreasing trends in neural tube defects (NTD) have been reported in some parts of Europe [2], but in others places no significant decrease has been found. [16, 17] NTD risk has been associated with socioeconomic status. This has raised the issue if periconceptual folic acid recommendations are being followed. Spanish data about folic supplementation in pregnancies, coming from INMA project, point at extensive compliance of recommendations in the 3rd month of pregnancy (94% of women), lower compliance in the 2nd one (66% of women) and scarce preconceptual
compliance (19%), suggesting that folic supplementation in Spain is still an area of improvement for NTD reductions.[18] Difference between diagnosed anomalies and prevalences at birth are slight for digestive, limbs and urinary anomalies, while is notable for the nervous system, reflecting differences in severity and in the proportion of antenatal diagnosis, much
Page 9 of 19
For peer review only - http://bmjopen.bmj.com/site/about/guidelines.xhtml
BMJ Open
123456789101112131415161718192021222324252627282930313233343536373839404142434445464748495051525354555657585960
on July 23, 2020 by guest. Protected by copyright.
http://bmjopen.bm
j.com/
BM
J Open: first published as 10.1136/bm
jopen-2013-004244 on 3 March 2014. D
ownloaded from

For peer review only
10
more frequent for anomalies of the nervous system (in 82% of the diagnosed cases) than in limbs (57%), digestive (28%) and urinary anomalies (22%).
Maintaining the surveillance of non chromosomal anomalies is essential. It is necessary to check if the observed trends continue or disappear in the following years, and complementary data analysis are needed in order to assess if, associated or not with the increasing trends, there are spatial clustering of cases that can share the same aetiology.
CONCLUSION
In the Basque Country chromosomal anomalies rates are high and still keep slightly increasing, which can be related to the rise in maternal age. Rates of non chromosomal anomalies are within the European frequent range of values, and the increases observed
in some of them need to be checked in the following years.
Page 10 of 19
For peer review only - http://bmjopen.bmj.com/site/about/guidelines.xhtml
BMJ Open
123456789101112131415161718192021222324252627282930313233343536373839404142434445464748495051525354555657585960
on July 23, 2020 by guest. Protected by copyright.
http://bmjopen.bm
j.com/
BM
J Open: first published as 10.1136/bm
jopen-2013-004244 on 3 March 2014. D
ownloaded from

For peer review only
11
FUNDING
This study was partially funded by Instituto de Salud Carlos III (FIS PI 08/1392)) of The Spanish Ministry of Economy and Competitiveness
CONFLICT OF INTERESTS
The authors declare that they have no conflict of interest.
Page 11 of 19
For peer review only - http://bmjopen.bmj.com/site/about/guidelines.xhtml
BMJ Open
123456789101112131415161718192021222324252627282930313233343536373839404142434445464748495051525354555657585960
on July 23, 2020 by guest. Protected by copyright.
http://bmjopen.bm
j.com/
BM
J Open: first published as 10.1136/bm
jopen-2013-004244 on 3 March 2014. D
ownloaded from
For peer review only
12
REFERENCES
1. Boyd PA, Haeusler M, Barisic I, et al. Paper 1: The EUROCAT network--organization and processes. Birth Defects Res A Clin Mol Teratol 2011;91 Suppl 1:S2-
15.
2. Loane M, Dolk H, Kelly A, et al. Paper 4: EUROCAT statistical monitoring: identification and investigation of ten year trends of congenital anomalies in Europe. Birth Defects Res A Clin Mol Teratol 2011;91 Suppl 1:S31-43.
3. EUROSTAT. Mean age of women at childbirth (code: tps00017). In: http://goo.gl/8Lzfk. Accessed 4 Jun 2013
4. EUSTAT. Synthetic index of fecundity and average materity age according to year.In: http://goo.gl/jlBXf. Accessed 4 Jun 2013
5. Savva GM, Morris JK, Mutton DE, et al. Maternal age-specific fetal loss rates in Down syndrome pregnancies. Prenat Diagn 2006;26:499-504.
6. Loane M, Dolk H, Garne E, et al. Paper 3: EUROCAT data quality indicators for population-based registries of congenital anomalies. Birth Defects Res A Clin Mol Teratol 2011;91 Suppl 1:S23-30.
7. Khoshnood B, Greenlees R, Loane M, et al. Paper 2: EUROCAT public health indicators for congenital anomalies in Europe. Birth Defects Res A Clin Mol Teratol 2011;91 Suppl 1:S16-22.
8. Savva GM, Walker K, Morris JK. The maternal age-specific live birth prevalence of trisomies 13 and 18 compared to trisomy 21 (Down syndrome). Prenat Diagn 2010;30:57-64.
9. Morris JK, Alberman E. Trends in Down's syndrome live births and antenatal
diagnoses in England and Wales from 1989 to 2008: analysis of data from the National Down Syndrome Cytogenetic Register. Bmj 2009;339:b3794.
10. Reefhuis J, Honein MA. Maternal age and non-chromosomal birth defects, Atlanta--1968-2000: teenager or thirty-something, who is at risk? Birth Defects Res A Clin Mol Teratol 2004;70:572-9.
11. Ooki S. Maternal age and birth defects after the use of assisted reproductive technology in Japan, 2004-2010. Int J Womens Health 2013;5:65-77.
12. Gill SK, Broussard C, Devine O, et al. Association between maternal age and birth defects of unknown etiology: United States, 1997-2007. Birth Defects Res A Clin Mol Teratol 2012;94:1010-8.
13. Loane M, Dolk H, Morris JK. Maternal age-specific risk of non-chromosomal anomalies. Bjog 2009;116:1111-9.
14. Green RF, Devine O, Crider KS, et al. Association of paternal age and risk for major congenital anomalies from the National Birth Defects Prevention Study, 1997 to 2004. Ann Epidemiol 2010;20:241-9.
15. Oyen N, Poulsen G, Boyd HA, et al. National time trends in congenital heart defects, Denmark, 1977-2005. Am Heart J 2009;157:467-73 e1.
16. Poretti A, Anheier T, Zimmermann R, et al. Neural tube defects in Switzerland from 2001 to 2007: are periconceptual folic acid recommendations being followed? Swiss Med Wkly 2008;138:608-13.
Page 12 of 19
For peer review only - http://bmjopen.bmj.com/site/about/guidelines.xhtml
BMJ Open
123456789101112131415161718192021222324252627282930313233343536373839404142434445464748495051525354555657585960
on July 23, 2020 by guest. Protected by copyright.
http://bmjopen.bm
j.com/
BM
J Open: first published as 10.1136/bm
jopen-2013-004244 on 3 March 2014. D
ownloaded from
For peer review only
13
17. Abeywardana S, Bower C, Halliday J, et al. Prevalence of neural tube defects in Australia prior to mandatory fortification of bread-making flour with folic acid. Aust N Z J Public Health 2010;34:351-5.
18. Sanfélix-Gimeno G FI, Librero J, Peiró S. Caracterization of folate supplementation in pregnancy, based on a combination of health information systems. Gac Sanit 2012;26:7.
Page 13 of 19
For peer review only - http://bmjopen.bmj.com/site/about/guidelines.xhtml
BMJ Open
123456789101112131415161718192021222324252627282930313233343536373839404142434445464748495051525354555657585960
on July 23, 2020 by guest. Protected by copyright.
http://bmjopen.bm
j.com/
BM
J Open: first published as 10.1136/bm
jopen-2013-004244 on 3 March 2014. D
ownloaded from

For peer review only
14
Fig 1. Age of women at childbirth and at diagnosis of a chromosomal anomaly in the
Basque Country (Spain), in 1999-2001 and 2006-2008 Fig 2. Estimated prevalences in each calendar year (error bars) and GAM fits (lines) of chromosomal congenital anomalies in the Basque Country (Spain), from 1999 to 2008 Fig 3. Estimated prevalences in each calendar year (error bars) and GAM fits (lines) of non chromosomal congenital anomalies in the Basque Country (Spain), from 1999 to 2008.
Page 14 of 19
For peer review only - http://bmjopen.bmj.com/site/about/guidelines.xhtml
BMJ Open
123456789101112131415161718192021222324252627282930313233343536373839404142434445464748495051525354555657585960
on July 23, 2020 by guest. Protected by copyright.
http://bmjopen.bm
j.com/
BM
J Open: first published as 10.1136/bm
jopen-2013-004244 on 3 March 2014. D
ownloaded from

For peer review only
131x202mm (300 x 300 DPI)
Page 15 of 19
For peer review only - http://bmjopen.bmj.com/site/about/guidelines.xhtml
BMJ Open
123456789101112131415161718192021222324252627282930313233343536373839404142434445464748495051525354555657585960
on July 23, 2020 by guest. Protected by copyright.
http://bmjopen.bm
j.com/
BM
J Open: first published as 10.1136/bm
jopen-2013-004244 on 3 March 2014. D
ownloaded from
For peer review only
197x141mm (300 x 300 DPI)
Page 16 of 19
For peer review only - http://bmjopen.bmj.com/site/about/guidelines.xhtml
BMJ Open
123456789101112131415161718192021222324252627282930313233343536373839404142434445464748495051525354555657585960
on July 23, 2020 by guest. Protected by copyright.
http://bmjopen.bm
j.com/
BM
J Open: first published as 10.1136/bm
jopen-2013-004244 on 3 March 2014. D
ownloaded from

For peer review only
133x198mm (300 x 300 DPI)
Page 17 of 19
For peer review only - http://bmjopen.bmj.com/site/about/guidelines.xhtml
BMJ Open
123456789101112131415161718192021222324252627282930313233343536373839404142434445464748495051525354555657585960
on July 23, 2020 by guest. Protected by copyright.
http://bmjopen.bm
j.com/
BM
J Open: first published as 10.1136/bm
jopen-2013-004244 on 3 March 2014. D
ownloaded from

For peer review only
1
STROBE Statement—checklist of items that should be included in reports of observational studies Item
No Recommendation
Title and abstract 1√
(a) Indicate the study’s design with a commonly used term in the title or the
abstract
(b) Provide in the abstract an informative and balanced summary of what
was done and what was found
Introduction
Background/rationale 2√ Explain the scientific background and rationale for the investigation being
reported
Objectives 3√ State specific objectives, including any prespecified hypotheses
Methods
Study design 4 √ Present key elements of study design early in the paper
Setting 5 √ Describe the setting, locations, and relevant dates, including periods of
recruitment, exposure, follow-up, and data collection
Participants 6
√
(a) Cohort study—Give the eligibility criteria, and the sources and methods
of selection of participants. Describe methods of follow-up
Case-control study—Give the eligibility criteria, and the sources and
methods of case ascertainment and control selection. Give the rationale for
the choice of cases and controls
Cross-sectional study—Give the eligibility criteria, and the sources and
methods of selection of participants. (Data come from a population-based
registry)
(b) Cohort study—For matched studies, give matching criteria and number
of exposed and unexposed
Case-control study—For matched studies, give matching criteria and the
number of controls per case
Variables 7√ Clearly define all outcomes, exposures, predictors, potential confounders,
and effect modifiers. Give diagnostic criteria, if applicable
Data sources/
measurement
8* For each variable of interest, give sources of data and details of methods of
assessment (measurement). Describe comparability of assessment methods
if there is more than one group
Bias 9√ Describe any efforts to address potential sources of bias
Study size 10√ Explain how the study size was arrived at (It is a population based study;
we use data of the entire population)
Quantitative variables 11 Explain how quantitative variables were handled in the analyses. If
applicable, describe which groupings were chosen and why (Not applicable)
Statistical methods 12√ (a) Describe all statistical methods, including those used to control for
confounding
(b) Describe any methods used to examine subgroups and interactions
(c) Explain how missing data were addressed
(d) Cohort study—If applicable, explain how loss to follow-up was
addressed
Case-control study—If applicable, explain how matching of cases and
controls was addressed
Cross-sectional study—If applicable, describe analytical methods taking
Page 18 of 19
For peer review only - http://bmjopen.bmj.com/site/about/guidelines.xhtml
BMJ Open
123456789101112131415161718192021222324252627282930313233343536373839404142434445464748495051525354555657585960
on July 23, 2020 by guest. Protected by copyright.
http://bmjopen.bm
j.com/
BM
J Open: first published as 10.1136/bm
jopen-2013-004244 on 3 March 2014. D
ownloaded from

For peer review only
2
account of sampling strategy
(e) Describe any sensitivity analyses
Results
Participants 13* (a) Report numbers of individuals at each stage of study—eg numbers potentially
eligible, examined for eligibility, confirmed eligible, included in the study,
completing follow-up, and analysed (Not applicable)
(b) Give reasons for non-participation at each stage
(c) Consider use of a flow diagram
Descriptive data 14*√
(a) Give characteristics of study participants (eg demographic, clinical, social) and
information on exposures and potential confounders
(b) Indicate number of participants with missing data for each variable of interest
(c) Cohort study—Summarise follow-up time (eg, average and total amount)
Outcome data 15*
√
Cohort study—Report numbers of outcome events or summary measures over time
Case-control study—Report numbers in each exposure category, or summary
measures of exposure
Cross-sectional study—Report numbers of outcome events or summary measures
Main results 16√ (a) Give unadjusted estimates and, if applicable, confounder-adjusted estimates and
their precision (eg, 95% confidence interval). Make clear which confounders were
adjusted for and why they were included
(b) Report category boundaries when continuous variables were categorized
(c) If relevant, consider translating estimates of relative risk into absolute risk for a
meaningful time period
Other analyses 17√ Report other analyses done—eg analyses of subgroups and interactions, and
sensitivity analyses
Discussion
Key results 18√ Summarise key results with reference to study objectives
Limitations 19√ Discuss limitations of the study, taking into account sources of potential bias or
imprecision. Discuss both direction and magnitude of any potential bias
Interpretation 20√ Give a cautious overall interpretation of results considering objectives, limitations,
multiplicity of analyses, results from similar studies, and other relevant evidence
Generalisability 21√ Discuss the generalisability (external validity) of the study results
Other information
Funding 22√ Give the source of funding and the role of the funders for the present study and, if
applicable, for the original study on which the present article is based
*Give information separately for cases and controls in case-control studies and, if applicable, for exposed and
unexposed groups in cohort and cross-sectional studies.
Note: An Explanation and Elaboration article discusses each checklist item and gives methodological background and
published examples of transparent reporting. The STROBE checklist is best used in conjunction with this article (freely
available on the Web sites of PLoS Medicine at http://www.plosmedicine.org/, Annals of Internal Medicine at
http://www.annals.org/, and Epidemiology at http://www.epidem.com/). Information on the STROBE Initiative is
available at www.strobe-statement.org.
Page 19 of 19
For peer review only - http://bmjopen.bmj.com/site/about/guidelines.xhtml
BMJ Open
123456789101112131415161718192021222324252627282930313233343536373839404142434445464748495051525354555657585960
on July 23, 2020 by guest. Protected by copyright.
http://bmjopen.bm
j.com/
BM
J Open: first published as 10.1136/bm
jopen-2013-004244 on 3 March 2014. D
ownloaded from

For peer review only
TRENDS IN THE PREVALENCES OF CONGENITAL ANOMALIES
AND AGE AT MOTHERHOOD IN A SOUTHERN EUROPEAN
REGION
Journal: BMJ Open
Manuscript ID: bmjopen-2013-004244.R1
Article Type: Research
Date Submitted by the Author: 19-Dec-2013
Complete List of Authors: Cambra, Koldo; Navarrabiomed-Fundación Miguel Servet- Red de Investigación en Servicios de Salud en Enfermedades Crónicas (REDISSEC)., Ibañez, Berta; Navarrabiomed-Fundación Miguel Servet- Red de Investigación en Servicios de Salud en Enfermedades Crónicas (REDISSEC)., Urzelai, Deiene; Gobierno Vasco, Departamento de Salud Portillo, Isabel; Osakidetza- Servicio Vasco de Salud, Montoya, Imanol; Osakidetza-Servicio Vasco de Salud, Esnaola, Santiago; Gobierno Vasco, Departamento de Salud Cirarda, Francisco; Gobierno Vasco, Departamento de Salud
<b>Primary Subject Heading</b>:
Epidemiology
Secondary Subject Heading: Public health, Reproductive medicine
Keywords: Congenital anomalies, Birth defects, Chromosomal anomalies, Trends, Maternal age
For peer review only - http://bmjopen.bmj.com/site/about/guidelines.xhtml
BMJ Open on July 23, 2020 by guest. P
rotected by copyright.http://bm
jopen.bmj.com
/B
MJ O
pen: first published as 10.1136/bmjopen-2013-004244 on 3 M
arch 2014. Dow
nloaded from

For peer review only
1
TRENDS IN THE PREVALENCES OF CONGENITAL ANOMALIES AND AGE AT
MOTHERHOOD IN A SOUTHERN EUROPEAN REGION
List of authors:
Cambra K(1), Ibañez B(1), Urzelai D(2), Portillo I(3), Montoya I(2), Esnaola S(2),
Cirarda FB(2)
(1) Navarrabiomed-Fundación Miguel Servet- Red de Investigación en Servicios de
Salud en Enfermedades Crónicas (REDISSEC). Pamplona, Spain
(2) Departamento de Salud. Gobierno Vasco. Vitoria, Spain
(3) Osakidetza- Servicio Vasco de Salud. Vitoria, Spain
Corresponding author:
Koldo Cambra
Navarrabiomed-Fundación Miguel Servet
Complejo Hospitalario de Navarra
C/ Irunlarrea s/n
31008 Pamplona. Spain
Tfno: 34 848428292
Fax: 34 848422200
e-mail: [email protected]
KEYWORDS:
Congenital anomalies, trends, maternal age, chromosomal anomalies, birth defects
Word count: 2891
Page 1 of 33
For peer review only - http://bmjopen.bmj.com/site/about/guidelines.xhtml
BMJ Open
123456789101112131415161718192021222324252627282930313233343536373839404142434445464748495051525354555657585960
on July 23, 2020 by guest. Protected by copyright.
http://bmjopen.bm
j.com/
BM
J Open: first published as 10.1136/bm
jopen-2013-004244 on 3 March 2014. D
ownloaded from
For peer review only
2
Abstract
Objectives. To estimate the prevalences of the main groups of congenital anomalies
and to assess their trend over time.
Design. Population-based study of prevalences.
Setting. The Basque Country, Spain.
Partipants. All births and all congenital anomalies diagnosed prenatally, at birth or
during the first year of age, in all hospitals of the country, from 1999 to 2008.
Main outcomes measures. Total diagnosed prevalences and prevalences at birth of all
chromosomal and non-chromosomal anomalies, Down’s syndrome, anomalies of the
nervous system, urinary, limbs, digestive system and congenital heart defects.
Results. Mean age (SD) of women at childbirth and the proportion of them over 35
years and over 40 years shifted from 32.1(4.5) years, 18.3% and 1.4% in 1999-2001, to
32.3(4.7) years, 23.9% and 2.9% in 2006-2008.
Between 1999 and 2008, 991 cases of chromosomal anomalies and 3090 of non-
chromosomal anomalies were diagnosed, which yields, respectively, total prevalences
of 5.2‰ and of 16.2‰. Among chromosomal anomalies Down’s syndrome is the most
frequent (2.9‰). With marginal statistical significance, the results point at an increasing
trend in total diagnosed chromosomal anomalies, but a decreasing one in prevalences at
birth. Among non-chromosomal congenital anomalies, congenital heart defects are the
most frequent (5.2‰). Rates of all non-chromosomal, urinary and limb anomalies grew
during the study period with different evolutions in time, whereas those of congenital
heart defects and anomalies of the digestive system did not change significantly.
Conclusion. In the Basque Country, rates of chromosomal anomalies are higher than
the overall estimated prevalence in European Countries, and continue to increase
slightly, which may be related to the rise in maternal age. Rates of non-chromosomal
anomalies are within the European frequent range of values, and the increases observed
need to be checked in the following years.
Article summary
Strengths and limitations of the study
� This study analyses the evolution of the prevalences of congenital anomalies
using highly reliable data from population-based registries.
� The study provides insight into the occurring changes in maternal age, the extent
of the use of antenatal diagnosis and its impact on the prevalences of congenital
anomalies at birth.
� Improvements in quality and accessibility of diagnostic tests can lead to an
apparent increase in prevalences.
Page 2 of 33
For peer review only - http://bmjopen.bmj.com/site/about/guidelines.xhtml
BMJ Open
123456789101112131415161718192021222324252627282930313233343536373839404142434445464748495051525354555657585960
on July 23, 2020 by guest. Protected by copyright.
http://bmjopen.bm
j.com/
BM
J Open: first published as 10.1136/bm
jopen-2013-004244 on 3 March 2014. D
ownloaded from

For peer review only
3
INTRODUCTION
Congenital anomalies affect around 2% of births in Europe.[1] They account for a great
part of neonatal mortality and morbidity, and may be an important source of distress for
parents and families. In the majority of cases the aetiology of congenital anomalies
remains unknown. Some increasing trends have been detected by EUROCAT in the
Pan-Europe analysis for several CA, such as hypospadias, abdominal wall anomalies,
gastroschisis, trisomy 18 and renal dysplasia.[2] Local trends have been more frequently
detected but, in general, they need further verification.
Women’s age at childbirth has been on the rise in all European countries included in
Eurostat during the last decades. From 2001 to 2008 the average maternal age in EU-17
inched up from 29.5 to 30.3 years, but geographical differences remained important,
with greater values in West Europe and differences between countries of up to 5 years.
Spain, in the fifth position of the European ranking of 2008, with a mean age of women
at childbirth of 30.8 years, climbed to the top in 2011 with a mean of 31.5 years.[3],
along with a generalized extension and improvement of antenatal diagnosis, have
increased (in Spain and other countries) the public awareness on reproductive health
issues. Improvements in antenatal diagnosis as well as in case registrations allow for
more reliable population-based studies on congenital anomalies.
The Basque Country is an industrialized, urban type community, situated in north Spain,
with around 2.2 million inhabitants. Demographic changes in the last decades have been
dramatic, greater than in other Spanish regions. The synthetic index of fecundity (an
estimation of the number of children a hypothetical woman would have at the end of her
fertile life if her fecundity corresponded to the age-specific fecundity rates of the
population) fell from 2.67 in 1975 to 1.24 in 1985, 0.97 in 1990 and 1.03 in 2000, while
the average of maternity age rose from 28.6, to 29.1, 30.0, 31.3 and 32.4 years in the
same calendar years.[4] Medical care and antenatal diagnosis are widely available to all
pregnant women, and they are provided by the Basque Health Service to the entire
population.
The detection of trends is an essential component of epidemiological surveillance of
congenital anomalies, valuable for care and genetic advice planning and also for
warning of environmental risk factors. Its interest actually grows in places where
changes in reproductive health determinants may be occurring.
This report analyses the evolution of maternal age and prevalences of congenital
anomalies in a ten year period in the Basque Country, focusing on total and on specific
subgroups of chromosomal and non-chromosomal anomalies.
METHODS
The study period was 1999-2008. We used data from the population based Registry of
Neonatal Screening and Congenital Anomalies of the Basque Country, integrated in
EUROCAT project and operating since the early 1990s. All anomalies diagnosed
prenatally, at birth or during the first year of age, in all hospitals of the country are
included. The registry covers affected live births, foetal births with gestational age 22
Page 3 of 33
For peer review only - http://bmjopen.bmj.com/site/about/guidelines.xhtml
BMJ Open
123456789101112131415161718192021222324252627282930313233343536373839404142434445464748495051525354555657585960
on July 23, 2020 by guest. Protected by copyright.
http://bmjopen.bm
j.com/
BM
J Open: first published as 10.1136/bm
jopen-2013-004244 on 3 March 2014. D
ownloaded from
For peer review only
4
weeks or greater, and terminations of pregnancy for foetal anomaly following prenatal
diagnosis. The staff of the Registry routinely check Hospital Discharge Databases and
the Registry of Terminations of Pregnancies searching for new cases, review medical
reports of prenatal diagnosis (sonography, genetic test and pathology) and code all
congenital anomalies.
We estimated the prevalences and 95% confidence intervals (CI) related to mothers with
residence in the Basque Country, of total chromosomal anomalies (ICD-10, Q90-93,
Q96-99), total non-chromosomal anomalies (Q chapter excluding chromosomal
anomalies, D215, D821, D1810, P350, P351, P371) and of the following subgroups:
anomalies of the nervous system (Q00-07), urinary (Q60-64, Q794), limbs (Q65-74),
digestive system (Q38-Q45, Q790), congenital heart defects (CHD)(Q20-26), and
Down (Q90), Patau (Q914-917), Edward (Q910-913), Turner (Q96) and Klinefelter’s
(Q980-984) syndromes. Other major organ subgroups of non-chromosomal anomalies
were not included in the analysis because their average prevalences, lower than one case
per 1000 births, are too low to be assessed on a yearly basis. The cases with several
non-chromosomal anomalies count as one case for calculating total or subgroup
prevalences, but they can be assigned to more than one subgroup. More details about
the anomalies included in each subgroup can be found somewhere else.[1] We
estimated total prevalence rates (congenital anomalies in liveborns, foetal deaths and
induced abortions divided by the total number of births) and prevalence rates at birth
(congenital anomalies in liveborns and foetal deaths divided by the total number of
births). Data related to denominators (number of births per year, place of residence and
age of the mother) were obtained from the Registry of Newborns of the Basque
Country.
To explore the functional relationship between prevalences and time, we fitted
Generalized Additive Models (GAM), as they are flexible unrestricted models that can
properly reflect the true relationship between the variables. We included the annual
number of cases as a Poisson response variable, the number of births (live and still) as
the offset, and the calendar year as independent variable using thin plate regression
splines. To further assess time trends, we fitted binomial regression models using a
logarithmic link function, including the same former variables and adding as
explanatory variable maternal age group (under 30, 30-34, 35-39 and over 40 years).
We also conducted Chi square tests for trends in proportions, whose p-value results are
virtually identical to those from the binomial regression models.
In the case of Down’s Syndrome, we also tested trends in the estimated prevalence at
birth that would have occurred in the absence of antenatal diagnosis (and subsequent
terminations), using for that diagnosed prevalences adjusted for the natural foetal loss
risks reported by Savva.[5] Adjusting for natural foetal losses is aimed at controlling the
potential bias in the estimation of time trends in periods in which there is an increase in
the number of prenatal diagnoses and, consequently, in the number of cases diagnosed
prenatally that would not have survived to term and remained undiagnosed in absence
of prenatal diagnosis.
This study was approved by the Clinical Research Ethics Committee of the Basque
Country.
Page 4 of 33
For peer review only - http://bmjopen.bmj.com/site/about/guidelines.xhtml
BMJ Open
123456789101112131415161718192021222324252627282930313233343536373839404142434445464748495051525354555657585960
on July 23, 2020 by guest. Protected by copyright.
http://bmjopen.bm
j.com/
BM
J Open: first published as 10.1136/bm
jopen-2013-004244 on 3 March 2014. D
ownloaded from

For peer review only
5
RESULTS
The total number of births in the 1999-2008 period was 191,171, rising from 51,771 in
the 1999-2001 period to 62,329 in 2006-2008. Concurrently, age of motherhood
increased (Fig 1). Mean age of women at childbirth and the proportion of them over 35
years shifted from 32.1 years and 18.3% in 1999-2001 to 32.3 years and 23.9% in 2006-
2008 (Table 1). This shift is greater among chromosomal anomalies cases, with an
increase of 0.7 years in the mean age and an increase of 9% in the proportion of mothers
above 35 years. Among non-chromosomal anomalies cases, maternal age indicators are
similar to those of all births.
Table1. Mean age of women at childbirth and proportion of them above 35 and 40
years, in all births and in cases of congenital anomalies (CA) of the Basque Country, in
1999-2001 and 2006-2008
1999-2001 2006-2008
Mean(SD) >35 y >40 y Mean (SD) >35 y >40 y
All births 32.1(4.5) 18.3% 1.4% 32.3(4.7) 23.9% 2.9%
Chromosomal CA 34.6(4.5) 42.6% 7.4% 35.3(5.0) 51.5% 12.0%
Non-chromosomal CA 32.1(4.6) 21.1% 3.6% 32.3(5.1) 27.2% 3.2%
Between 1999 and 2008, 991 cases of chromosomal anomalies and 3090 of non-
chromosomal anomalies were diagnosed, which yields, respectively, prevalences of
5.18 and 16.16 per 1000 births (Table 2). Diagnosis was antenatal in 83% of
chromosomal and in 43% of non-chromosomal anomalies.
Among chromosomal anomalies, Down’s Syndrome (DS) is the most frequent,
accounting for 55% of all diagnosed chromosomal anomalies. The total prevalence of
DS is 2.87‰, the estimated prevalence at birth adjusted for natural foetal losses is
2.27‰, and the actual prevalence of DS at birth is 0.73‰. Other chromosomal
syndromes are much less frequent. From 1999 to 2008 Edward syndromes diagnosed
were 121, Turner syndromes 81, Klinefelter 52 and Patau 42, resulting respectively in
0.63 (IC95%:0.52, 0.75), 0.42 (IC95%:0.33, 0.52), 0.27 (IC95%:0.20, 0.35) and 0.22
(IC95%:0.15, 0.29) diagnosed cases per 1000 births.
The results point at certain increasing trend in total chromosomal anomalies and certain
decreasing trend in prevalences at birth (Table 2 and Fig 2). For Down’s Syndrome, we
found, with marginal statistical significance, annual relative increases in the total
prevalence of around 3% (p=0.079) and annual relative reductions of 5% in the
prevalence at birth (p=0.098). When adjusting regression models for maternal age,
increasing trend in diagnosed chromosomal anomalies disappear but decreasing trends
in prevalences at birth remain unchanged, both for all chromosomal anomalies and for
DS. Maternal age group is strongly associated with the prevalence of chromosomal
anomalies (p<0.001), with prevalence rates 1.3, 3.2 and 8.3 times greater in women of
30-34, 35-39 and over 40 years than in women under 30 years, respectively.
Among non-chromosomal anomalies, CHD are the most frequent (5.0‰), followed by
urinary (3.5‰), nervous system (2.4‰) and limb anomalies (2.4‰). Prevalences at
birth are around 80% of total diagnosed prevalences, with the exception of the subgroup
Page 5 of 33
For peer review only - http://bmjopen.bmj.com/site/about/guidelines.xhtml
BMJ Open
123456789101112131415161718192021222324252627282930313233343536373839404142434445464748495051525354555657585960
on July 23, 2020 by guest. Protected by copyright.
http://bmjopen.bm
j.com/
BM
J Open: first published as 10.1136/bm
jopen-2013-004244 on 3 March 2014. D
ownloaded from

For peer review only
6
of nervous system anomalies, for which the prevalence at birth (0.9‰) is a third of the
total diagnosed one.
Prevalences of all non-chromosomal, urinary and limb anomalies grew during the study
period with different evolutions in time (Fig 3). Deviations from linearity are negligible
in all studied subgroups of anomalies, except for the urinary subgroup, which increased
between 1999 to 2003 and then plateaued, and for limb anomalies which sharply
mounted from 2004 to 2008. The estimated annual relative increment of prevalence
rates of all non-chromosomal anomalies is 3% and that of nervous system anomalies
5%. When models are adjusted for maternal age, trend estimates and statistical
significances remain unchanged (Table 2). With respect to mothers under 30 years,
prevalence rates of all non-chromosomal anomalies were 0.93 (IC95%:0.85, 1.02) for
mothers between 30 and 34, 1.0 (IC95%:0.90, 1.10) for mothers between 35 and 39, and
1.30 (IC95%:1.06, 1.51) for those over 40.
Page 6 of 33
For peer review only - http://bmjopen.bmj.com/site/about/guidelines.xhtml
BMJ Open
123456789101112131415161718192021222324252627282930313233343536373839404142434445464748495051525354555657585960
on July 23, 2020 by guest. Protected by copyright.
http://bmjopen.bm
j.com/
BM
J Open: first published as 10.1136/bm
jopen-2013-004244 on 3 March 2014. D
ownloaded from
For peer review only
7
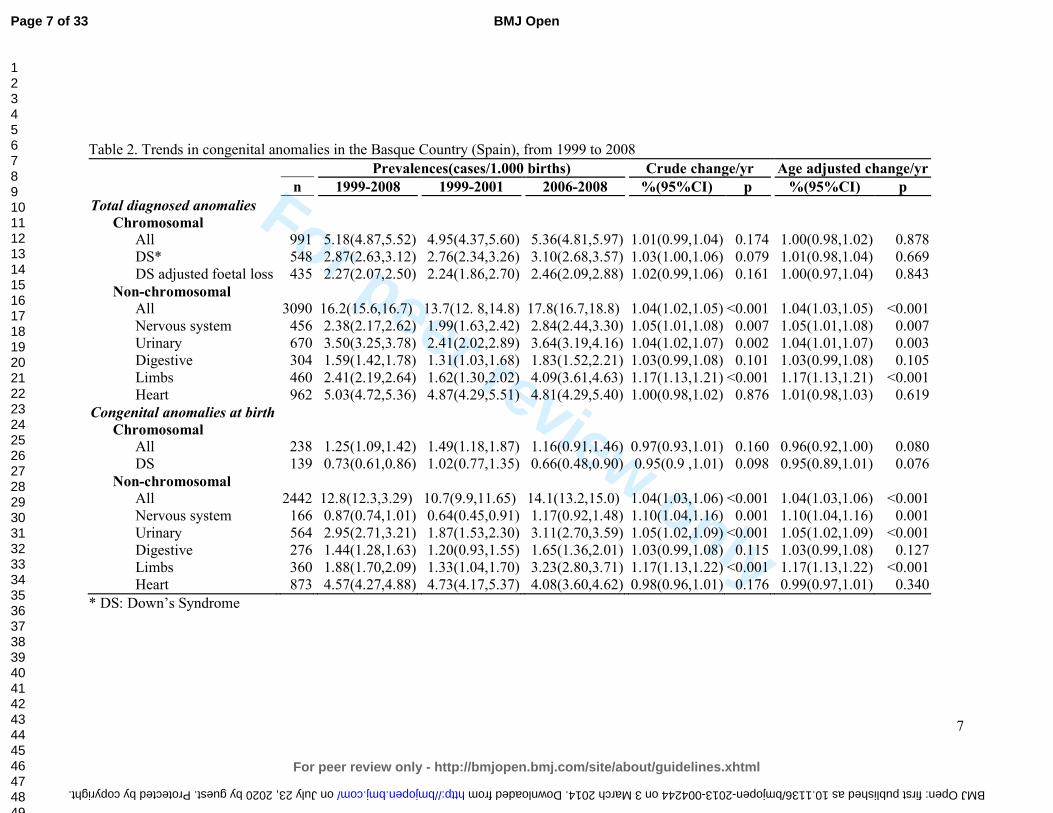
Table 2. Trends in congenital anomalies in the Basque Country (Spain), from 1999 to 2008
Prevalences(cases/1.000 births) Crude change/yr Age adjusted change/yr
n 1999-2008 1999-2001 2006-2008 %(95%CI) p %(95%CI) p
Total diagnosed anomalies
Chromosomal
All 991 5.18(4.87,5.52) 4.95(4.37,5.60) 5.36(4.81,5.97) 1.01(0.99,1.04) 0.174 1.00(0.98,1.02) 0.878
DS* 548 2.87(2.63,3.12) 2.76(2.34,3.26) 3.10(2.68,3.57) 1.03(1.00,1.06) 0.079 1.01(0.98,1.04) 0.669
DS adjusted foetal loss 435 2.27(2.07,2.50) 2.24(1.86,2.70) 2.46(2.09,2.88) 1.02(0.99,1.06) 0.161 1.00(0.97,1.04) 0.843
Non-chromosomal
All 3090 16.2(15.6,16.7) 13.7(12. 8,14.8) 17.8(16.7,18.8) 1.04(1.02,1.05) <0.001 1.04(1.03,1.05) <0.001
Nervous system 456 2.38(2.17,2.62) 1.99(1.63,2.42) 2.84(2.44,3.30) 1.05(1.01,1.08) 0.007 1.05(1.01,1.08) 0.007
Urinary 670 3.50(3.25,3.78) 2.41(2.02,2.89) 3.64(3.19,4.16) 1.04(1.02,1.07) 0.002 1.04(1.01,1.07) 0.003
Digestive 304 1.59(1.42,1.78) 1.31(1.03,1.68) 1.83(1.52,2.21) 1.03(0.99,1.08) 0.101 1.03(0.99,1.08) 0.105
Limbs 460 2.41(2.19,2.64) 1.62(1.30,2.02) 4.09(3.61,4.63) 1.17(1.13,1.21) <0.001 1.17(1.13,1.21) <0.001
Heart 962 5.03(4.72,5.36) 4.87(4.29,5.51) 4.81(4.29,5.40) 1.00(0.98,1.02) 0.876 1.01(0.98,1.03) 0.619
Congenital anomalies at birth
Chromosomal
All 238 1.25(1.09,1.42) 1.49(1.18,1.87) 1.16(0.91,1.46) 0.97(0.93,1.01) 0.160 0.96(0.92,1.00) 0.080
DS 139 0.73(0.61,0.86) 1.02(0.77,1.35) 0.66(0.48,0.90) 0.95(0.9 ,1.01) 0.098 0.95(0.89,1.01) 0.076
Non-chromosomal
All 2442 12.8(12.3,3.29) 10.7(9.9,11.65) 14.1(13.2,15.0) 1.04(1.03,1.06) <0.001 1.04(1.03,1.06) <0.001
Nervous system 166 0.87(0.74,1.01) 0.64(0.45,0.91) 1.17(0.92,1.48) 1.10(1.04,1.16) 0.001 1.10(1.04,1.16) 0.001
Urinary 564 2.95(2.71,3.21) 1.87(1.53,2.30) 3.11(2.70,3.59) 1.05(1.02,1.09) <0.001 1.05(1.02,1.09) <0.001
Digestive 276 1.44(1.28,1.63) 1.20(0.93,1.55) 1.65(1.36,2.01) 1.03(0.99,1.08) 0.115 1.03(0.99,1.08) 0.127
Limbs 360 1.88(1.70,2.09) 1.33(1.04,1.70) 3.23(2.80,3.71) 1.17(1.13,1.22) <0.001 1.17(1.13,1.22) <0.001
Heart 873 4.57(4.27,4.88) 4.73(4.17,5.37) 4.08(3.60,4.62) 0.98(0.96,1.01) 0.176 0.99(0.97,1.01) 0.340
* DS: Down’s Syndrome
Page 7 of 33
For peer review only - http://bmjopen.bmj.com/site/about/guidelines.xhtml
BMJ Open
123456789101112131415161718192021222324252627282930313233343536373839404142434445464748495051525354555657585960
on July 23, 2020 by guest. Protected by copyright. http://bmjopen.bmj.com/ BMJ Open: first published as 10.1136/bmjopen-2013-004244 on 3 March 2014. Downloaded from
For peer review only
8
DISCUSSION
During 1999-2008 the age of women at childbirth shifted towards later ages, and there
was an increase in diagnosed prevalences of chromosomal and non-chromosomal
anomalies in the Basque Country. Among non-chromosomal anomalies, the evolution
of prevalences is particular of each subgroup, with no common pattern and in some
cases with notable relative rises in magnitude.
Data used in this study come from the Registry of Neonatal Screening and Congenital
Anomalies of the Basque Country. The registry follows the EUROCAT project guides
and it was launched several years before the initial date of this project. As a
consequence, the data are highly reliable and have improved comparability with results
from other registries.[6] Surveillance of the evolution in time of congenital anomalies
conceivably allows detecting changes in risk that may occur locally or on a greater
scale. However, antenatal diagnosis leads to detect more non-viable cases that otherwise
would have been miscarriages and remained undiagnosed, and therefore, improvements
in quality and accessibility of diagnostic test can make the estimation of trends in
congenital anomalies rates more prone to bias than in other health outcomes. This is an
important issue to take into account when interpreting changes in rates of diagnosed
congenital anomalies.
Prevalence of chromosomal anomalies in the Basque Country are higher than the overall
estimated prevalence for Europe, 5.2‰ vs. 3.8‰ in all chromosomal anomalies, and
2.9‰ vs. 2.1‰ in the case of Down’s Syndrome.[2, 7] It is well known that older
mothers are at higher risk of chromosomal anomalies, and that risk increases
exponentially from the age of 30, not only for Down Syndrome, but also for other less
prevalent chromosomal syndromes, such as trisomies 13 and 18.[8] The high maternal
age of Basque mothers, in fact, at the top of the European ranking, can explain why
prevalences of chromosomal anomalies are higher in the Basque Country. Likewise, the
increase in maternal age from 1999 to 2008 would be the primary reason to explain the
observed positive trend in all chromosomal anomalies and Down’s syndrome
prevalences. Our findings support this view, as trends are no longer statistically
significant when adjusting for maternal age. A secondary explanation, both for trends
and for the differences with other European regions, may be differences in case
ascertainment derived from the increasingly frequent use of prenatal diagnoses in the
Basque Country, which, in turn, is partially provoked by the rise in maternal age.
Increases in prevalences of chromosomal anomalies have been also reported in other
European regions.[2]
Prevalences at birth of chromosomal anomalies show certain decreasing trend, which is
related to the extension and use of antenatal diagnosis and the decision that most of
women make after receiving a positive diagnosis. On average 80% of all chromosomal
anomalies were diagnosed antenatally, 74% in 1999-2001 and 85% in 2006-2008. In the
Basque Country, 90% of the women who received an antenatal diagnosis of
chromosomal anomaly decided to terminate the pregnancy. This proportion is similar to
that found in England and Wales where, as Morris et al reported, dramatic changes in
demography have been offset by improved antenatal diagnosis and have resulted in no
substantial changes in birth prevalences of Down’s syndrome.[9]
Page 8 of 33
For peer review only - http://bmjopen.bmj.com/site/about/guidelines.xhtml
BMJ Open
123456789101112131415161718192021222324252627282930313233343536373839404142434445464748495051525354555657585960
on July 23, 2020 by guest. Protected by copyright.
http://bmjopen.bm
j.com/
BM
J Open: first published as 10.1136/bm
jopen-2013-004244 on 3 March 2014. D
ownloaded from

For peer review only
9
The prevalence of non-chromosomal congenital anomalies in the Basque Country,
contrary to chromosomal anomalies, is lower than overall rates reported in Europe,
12.8‰ vs. 20.2‰.[2] By subgroups, those of nervous system, digestive and urinary
anomalies, with deviations smaller than 10%, can be considered similar to the overall
European rate; CHD rates are 20% lower in the Basque Country.
The relationship between maternal age and the prevalence of some subgroups of non-
chromosomal anomalies has been reported to be U-curves or J-curves, younger and
older mothers showing increased risk.[10-12] Our findings for total non-chromosomal
anomalies, with the lowest prevalence in mothers between 30 and 34 years, are in
agreement with this type of relationship. Loane et al performed a population based
prevalence study, covering a total of 1.75 million births form 2000 to 2004, and they
found teenage mothers to have the highest prevalence of all non-chromosomal
congenital anomalies.[13] The prevalence decreased as maternal age increased, until a
slight increase was observed in mothers 40-44 years of age and a further increase in
mothers above 45 years. They also reported that the maternal age pattern of risk differs
between countries, and concluded that, unlike chromosomal anomalies, it is not
biological age that is associated with risk of non-chromosomal congenital anomalies,
but reproductive, social, ethnic, exposure of lifestyle factors that have a different
relationship with maternal age in different countries. They concluded that the increase
of risk due to maternal age can be considered negligible, especially when compared to
chromosomal anomalies. Association of paternal age and risk of certain birth defects
has been reported for younger paternal ages, also with relatively low increases in risk as
age grows.[14]
All non-chromosomal anomalies increased during the study period, but this result needs
to be treated with caution. All non-chromosomal anomalies are a very broad and
heterogeneous group of anomalies with different aetiology that can hardly be related to
a common true change in risk. Besides, in two of the subgroups, limbs and urinary
anomalies, improvements in case ascertainment cannot be completely ruled out, as
prevalences before the observed sudden rise were clearly below the average prevalences
reported from other registries.
We did not find any change in CHD prevalences, which is in line with what has been
observed in Europe, where after an increase in the early 90s due to improvements in
echocardiographic investigations, rates have remained stable.[2, 15] Prevalences of
congenital anomalies of nervous and digestive systems show a slight steady increase
from 1999 to 2008. Decreasing trends in neural tube defects (NTD) have been reported
in some parts of Europe [2], but in others places no significant decrease has been found.
[16, 17] NTD risk has been associated with socioeconomic status. This has raised the
issue if periconceptual folic acid recommendations are being followed. Spanish data
about folic supplementation in pregnancies, coming from INMA project, point at
extensive compliance of recommendations in the 3rd month of pregnancy (94% of
women), lower compliance in the 2nd one (66% of women) and scarce preconceptual
compliance (19%), suggesting that folic supplementation in Spain is still an area of
improvement for NTD reductions.[18]
Difference between diagnosed anomalies and prevalences at birth are slight for
digestive, limbs and urinary anomalies, while is notable for the nervous system,
reflecting differences in severity and in the proportion of antenatal diagnosis, much
Page 9 of 33
For peer review only - http://bmjopen.bmj.com/site/about/guidelines.xhtml
BMJ Open
123456789101112131415161718192021222324252627282930313233343536373839404142434445464748495051525354555657585960
on July 23, 2020 by guest. Protected by copyright.
http://bmjopen.bm
j.com/
BM
J Open: first published as 10.1136/bm
jopen-2013-004244 on 3 March 2014. D
ownloaded from

For peer review only
10
more frequent for anomalies of the nervous system (in 82% of the diagnosed cases) than
in limbs (57%), digestive (28%) and urinary anomalies (22%).
Maintaining the surveillance of non-chromosomal anomalies is essential. It is necessary
to check if the observed trends continue or disappear in the following years, and
complementary data analysis are needed in order to assess if, associated or not with the
increasing trends, there is spatial clustering of cases that can share the same aetiology.
CONCLUSION
In the Basque Country chromosomal anomalies rates are high and continue to increase
slightly, which may be related to the rise in maternal age. Rates of non-chromosomal
anomalies are within the European frequent range of values, and the increases observed
in some of them need to be checked in the following years.
Page 10 of 33
For peer review only - http://bmjopen.bmj.com/site/about/guidelines.xhtml
BMJ Open
123456789101112131415161718192021222324252627282930313233343536373839404142434445464748495051525354555657585960
on July 23, 2020 by guest. Protected by copyright.
http://bmjopen.bm
j.com/
BM
J Open: first published as 10.1136/bm
jopen-2013-004244 on 3 March 2014. D
ownloaded from
For peer review only
11
FUNDING
This study was partially funded by Instituto de Salud Carlos III (FIS PI 08/1392)) of
The Spanish Ministry of Economy and Competitiveness
CONTRIBUTORSHIP STATEMENT
KC designed the project, checked the data, interpreted the results, and drafted and
revised the manuscript. BI participated in the study design, conducted the statistical
analysis, interpreted the results and reviewed the manuscript. FC, DU and IP
participated in the study design, collected the data, created the databases and reviewed
the manuscript. SE and IM took part in the study design and reviewed the manuscript.
CONFLICT OF INTERESTS
The authors declare that they have no conflict of interest.
DATA SHARING STATEMENT
No additional data
Page 11 of 33
For peer review only - http://bmjopen.bmj.com/site/about/guidelines.xhtml
BMJ Open
123456789101112131415161718192021222324252627282930313233343536373839404142434445464748495051525354555657585960
on July 23, 2020 by guest. Protected by copyright.
http://bmjopen.bm
j.com/
BM
J Open: first published as 10.1136/bm
jopen-2013-004244 on 3 March 2014. D
ownloaded from

For peer review only
12
REFERENCES
1. Boyd PA, Haeusler M, Barisic I, et al. Paper 1: The EUROCAT network--
organization and processes. Birth Defects Res A Clin Mol Teratol 2011;91 Suppl 1:S2-
15.
2. Loane M, Dolk H, Kelly A, et al. Paper 4: EUROCAT statistical monitoring:
identification and investigation of ten year trends of congenital anomalies in Europe.
Birth Defects Res A Clin Mol Teratol 2011;91 Suppl 1:S31-43.
3. EUROSTAT. Mean age of women at childbirth (code: tps00017). In:
http://goo.gl/8Lzfk. Accessed 4 Jun 2013
4. EUSTAT. Synthetic index of fecundity and average materity age according to
year.In: http://goo.gl/jlBXf. Accessed 4 Jun 2013
5. Savva GM, Morris JK, Mutton DE, et al. Maternal age-specific fetal loss rates in
Down syndrome pregnancies. Prenat Diagn 2006;26:499-504.
6. Loane M, Dolk H, Garne E, et al. Paper 3: EUROCAT data quality indicators for
population-based registries of congenital anomalies. Birth Defects Res A Clin Mol
Teratol 2011;91 Suppl 1:S23-30.
7. Khoshnood B, Greenlees R, Loane M, et al. Paper 2: EUROCAT public health
indicators for congenital anomalies in Europe. Birth Defects Res A Clin Mol Teratol
2011;91 Suppl 1:S16-22.
8. Savva GM, Walker K, Morris JK. The maternal age-specific live birth prevalence of
trisomies 13 and 18 compared to trisomy 21 (Down syndrome). Prenat Diagn
2010;30:57-64.
9. Morris JK, Alberman E. Trends in Down's syndrome live births and antenatal
diagnoses in England and Wales from 1989 to 2008: analysis of data from the National
Down Syndrome Cytogenetic Register. Bmj 2009;339:b3794.
10. Reefhuis J, Honein MA. Maternal age and non-chromosomal birth defects, Atlanta--
1968-2000: teenager or thirty-something, who is at risk? Birth Defects Res A Clin Mol
Teratol 2004;70:572-9.
11. Ooki S. Maternal age and birth defects after the use of assisted reproductive
technology in Japan, 2004-2010. Int J Womens Health 2013;5:65-77.
12. Gill SK, Broussard C, Devine O, et al. Association between maternal age and birth
defects of unknown etiology: United States, 1997-2007. Birth Defects Res A Clin Mol
Teratol 2012;94:1010-8.
13. Loane M, Dolk H, Morris JK. Maternal age-specific risk of non-chromosomal
anomalies. Bjog 2009;116:1111-9.
14. Green RF, Devine O, Crider KS, et al. Association of paternal age and risk for major
congenital anomalies from the National Birth Defects Prevention Study, 1997 to 2004.
Ann Epidemiol 2010;20:241-9.
15. Oyen N, Poulsen G, Boyd HA, et al. National time trends in congenital heart
defects, Denmark, 1977-2005. Am Heart J 2009;157:467-73 e1.
16. Poretti A, Anheier T, Zimmermann R, et al. Neural tube defects in Switzerland from
2001 to 2007: are periconceptual folic acid recommendations being followed? Swiss
Med Wkly 2008;138:608-13.
Page 12 of 33
For peer review only - http://bmjopen.bmj.com/site/about/guidelines.xhtml
BMJ Open
123456789101112131415161718192021222324252627282930313233343536373839404142434445464748495051525354555657585960
on July 23, 2020 by guest. Protected by copyright.
http://bmjopen.bm
j.com/
BM
J Open: first published as 10.1136/bm
jopen-2013-004244 on 3 March 2014. D
ownloaded from

For peer review only
13
17. Abeywardana S, Bower C, Halliday J, et al. Prevalence of neural tube defects in
Australia prior to mandatory fortification of bread-making flour with folic acid. Aust N
Z J Public Health 2010;34:351-5.
18. Sanfélix-Gimeno G FI, Librero J, Peiró S. Caracterization of folate supplementation
in pregnancy, based on a combination of health information systems. Gac Sanit
2012;26:7.
Page 13 of 33
For peer review only - http://bmjopen.bmj.com/site/about/guidelines.xhtml
BMJ Open
123456789101112131415161718192021222324252627282930313233343536373839404142434445464748495051525354555657585960
on July 23, 2020 by guest. Protected by copyright.
http://bmjopen.bm
j.com/
BM
J Open: first published as 10.1136/bm
jopen-2013-004244 on 3 March 2014. D
ownloaded from

For peer review only
14
Fig 1. Age of women at childbirth and at diagnosis of a chromosomal anomaly in the
Basque Country (Spain), in 1999-2001 and 2006-2008
Fig 2. Estimated prevalences in each calendar year (error bars) and GAM fits (lines) of
chromosomal congenital anomalies in the Basque Country (Spain), from 1999 to 2008
Fig 3. Estimated prevalences in each calendar year (error bars) and GAM fits (lines) of
non-chromosomal congenital anomalies in the Basque Country (Spain), from 1999 to
2008.
Page 14 of 33
For peer review only - http://bmjopen.bmj.com/site/about/guidelines.xhtml
BMJ Open
123456789101112131415161718192021222324252627282930313233343536373839404142434445464748495051525354555657585960
on July 23, 2020 by guest. Protected by copyright.
http://bmjopen.bm
j.com/
BM
J Open: first published as 10.1136/bm
jopen-2013-004244 on 3 March 2014. D
ownloaded from

For peer review only
1
TRENDS IN THE PREVALENCES OF CONGENITAL ANOMALIES AND AGE AT
MOTHERHOOD IN A SOUTHERN EUROPEAN REGION
List of authors:
Cambra K(1), Ibañez B(1), Urzelai D(2), Portillo I(3), Montoya I(2), Esnaola S(2),
Cirarda FB(2)
(1) Navarrabiomed-Fundación Miguel Servet- Red de Investigación en Servicios de
Salud en Enfermedades Crónicas (REDISSEC). Pamplona, Spain
(2) Departamento de Salud. Gobierno Vasco. Vitoria, Spain
(3) Osakidetza- Servicio Vasco de Salud. Vitoria, Spain
Corresponding author:
Koldo Cambra
Navarrabiomed-Fundación Miguel Servet
Complejo Hospitalario de Navarra
C/ Irunlarrea s/n
31008 Pamplona. Spain
Tfno: 34 848428292
Fax: 34 848422200
e-mail: [email protected]
KEYWORDS:
Congenital anomalies, trends, maternal age, chromosomal anomalies, birth defects
Word count: 2891
Page 15 of 33
For peer review only - http://bmjopen.bmj.com/site/about/guidelines.xhtml
BMJ Open
123456789101112131415161718192021222324252627282930313233343536373839404142434445464748495051525354555657585960
on July 23, 2020 by guest. Protected by copyright.
http://bmjopen.bm
j.com/
BM
J Open: first published as 10.1136/bm
jopen-2013-004244 on 3 March 2014. D
ownloaded from
For peer review only
2
Abstract
Objectives. To estimate the prevalences of the main groups of congenital anomalies
and to assess their trend over time.
Design. Population-based study of prevalences.
Setting. The Basque Country, Spain.
Partipants. All births and all congenital anomalies diagnosed prenatally, at birth or
during the first year of age, in all hospitals of the country, from 1999 to 2008.
Main outcomes measures. Total diagnosed prevalences and prevalences at birth of all
chromosomal and non-chromosomal anomalies, Down’s syndrome, anomalies of the
nervous system, urinary, limbs, digestive system and congenital heart defects.
Results. Mean age (SD) of women at childbirth and the proportion of them over 35
years and over 40 years shifted from 32.1(4.5) years, 18.3% and 1.4% in 1999-2001, to
32.3(4.7) years, 23.9% and 2.9% in 2006-2008.
Between 1999 and 2008, 991 cases of chromosomal anomalies and 3090 of non-
chromosomal anomalies were diagnosed, which yields, respectively, total prevalences
of 5.2‰ and of 16.2‰. Among chromosomal anomalies Down’s syndrome is the most
frequent (2.9‰). With marginal statistical significance, the results point at an increasing
trend in total diagnosed chromosomal anomalies, but a decreasing one in prevalences at
birth. Among non-chromosomal congenital anomalies, congenital heart defects are the
most frequent (5.2‰). Rates of all non-chromosomal, urinary and limb anomalies grew
during the study period with different evolutions in time, whereas those of congenital
heart defects and anomalies of the digestive system did not change significantly.
Conclusion. In the Basque Country, rates of chromosomal anomalies are higher than
the overall estimated prevalence in European Countries, and continue to increase
slightly, which may be related to the rise in maternal age. Rates of non-chromosomal
anomalies are within the European frequent range of values, and the increases observed
need to be checked in the following years.
Article summary
Strengths and limitations of the study
� This study analyses the evolution of the prevalences of congenital anomalies
using highly reliable data from population-based registries.
� The study provides insight into the occurring changes in maternal age, the extent
of the use of antenatal diagnosis and its impact on the prevalences of congenital
anomalies at birth.
� Improvements in quality and accessibility of diagnostic tests can lead to an
apparent increase in prevalences.
Page 16 of 33
For peer review only - http://bmjopen.bmj.com/site/about/guidelines.xhtml
BMJ Open
123456789101112131415161718192021222324252627282930313233343536373839404142434445464748495051525354555657585960
on July 23, 2020 by guest. Protected by copyright.
http://bmjopen.bm
j.com/
BM
J Open: first published as 10.1136/bm
jopen-2013-004244 on 3 March 2014. D
ownloaded from

For peer review only
3
INTRODUCTION
Congenital anomalies affect around 2% of births in Europe.[1] They account for a great
part of neonatal mortality and morbidity, and may be an important source of distress for
parents and families. In the majority of cases the aetiology of congenital anomalies
remains unknown. Some increasing trends have been detected by EUROCAT in the
Pan-Europe analysis for several CA, such as hypospadias, abdominal wall anomalies,
gastroschisis, trisomy 18 and renal dysplasia.[2] Local trends have been more frequently
detected but, in general, they need further verification.
Women’s age at childbirth has been on the rise in all European countries included in
Eurostat during the last decades. From 2001 to 2008 the average maternal age in EU-17
inched up from 29.5 to 30.3 years, but geographical differences remained important,
with greater values in West Europe and differences between countries of up to 5 years.
Spain, in the fifth position of the European ranking of 2008, with a mean age of women
at childbirth of 30.8 years, climbed to the top in 2011 with a mean of 31.5 years.[3]
Changes in demographics and in the perception of risks, along with a generalized
extension and improvement of antenatal diagnosis, have increased (in Spain and other
countries) the public awareness on reproductive health issues. Improvements in
antenatal diagnosis as well as in case registrations allow for more reliable population-
based studies on congenital anomalies.
The Basque Country is an industrialized, urban type community, situated in north Spain,
with around 2.2 million inhabitants. Demographic changes in the last decades have been
dramatic, greater than in other Spanish regions. The synthetic index of fecundity (an
estimation of the number of children a hypothetical woman would have at the end of her
fertile life if her fecundity corresponded to the age-specific fecundity rates of the
population) fell from 2.67 in 1975 to 1.24 in 1985, 0.97 in 1990 and 1.03 in 2000, while
the average of maternity age rose from 28.6, to 29.1, 30.0, 31.3 and 32.4 years in the
same calendar years.[4] Medical care and antenatal diagnosis are widely available to all
pregnant women, and they are provided by the Basque Health Service to the entire
population.
The detection of trends is an essential component of epidemiological surveillance of
congenital anomalies, valuable for care and genetic advice planning and also for
warning of environmental risk factors. Its interest actually grows in places where
changes in reproductive health determinants may be occurring.
This report analyses the evolution of maternal age and prevalences of congenital
anomalies in a ten year period in the Basque Country, focusing on total and on specific
subgroups of chromosomal and non-chromosomal anomalies.
METHODS
The study period was 1999-2008. We used data from the population based Registry of
Neonatal Screening and Congenital Anomalies of the Basque Country, integrated in
EUROCAT project and operating since the early 1990s. All anomalies diagnosed
prenatally, at birth or during the first year of age, in all hospitals of the country are
Page 17 of 33
For peer review only - http://bmjopen.bmj.com/site/about/guidelines.xhtml
BMJ Open
123456789101112131415161718192021222324252627282930313233343536373839404142434445464748495051525354555657585960
on July 23, 2020 by guest. Protected by copyright.
http://bmjopen.bm
j.com/
BM
J Open: first published as 10.1136/bm
jopen-2013-004244 on 3 March 2014. D
ownloaded from

For peer review only
4
included. The registry covers affected live births, foetal births with gestational age 22
weeks or greater, and terminations of pregnancy for foetal anomaly following prenatal
diagnosis. The staff of the Registry routinely check Hospital Discharge Databases and
the Registry of Terminations of Pregnancies searching for new cases, review medical
reports of prenatal diagnosis (sonography, genetic test and pathology) and code all
congenital anomalies.
We estimated the prevalences and 95% confidence intervals (CI) related to mothers with
residence in the Basque Country, of total chromosomal anomalies (ICD-10, Q90-93,
Q96-99), total non-chromosomal anomalies (Q chapter excluding chromosomal
anomalies, D215, D821, D1810, P350, P351, P371) and of the following subgroups:
anomalies of the nervous system (Q00-07), urinary (Q60-64, Q794), limbs (Q65-74),
digestive system (Q38-Q45, Q790), congenital heart defects (CHD)(Q20-26), and
Down (Q90), Patau (Q914-917), Edward (Q910-913), Turner (Q96) and Klinefelter’s
(Q980-984) syndromes. Other major organ subgroups of non-chromosomal anomalies
were not included in the analysis because their average prevalences, lower than one case
per 1000 births, are too low to be assessed on a yearly basis. The cases with several
non-chromosomal anomalies count as one case for calculating total or subgroup
prevalences, but they can be assigned to more than one subgroup. More details about
the anomalies included in each subgroup can be found somewhere else.[1] We
estimated total prevalence rates (congenital anomalies in liveborns, foetal deaths and
induced abortions divided by the total number of births) and prevalence rates at birth
(congenital anomalies in liveborns and foetal deaths divided by the total number of
births). Data related to denominators (number of births per year, place of residence and
age of the mother) were obtained from the Registry of Newborns of the Basque
Country.
To explore the functional relationship between prevalences and time, we fitted
Generalized Additive Models (GAM), as they are flexible unrestricted models that can
properly reflect the true relationship between the variables. We included the annual
number of cases as a Poisson response variable, the number of births (live and still) as
the offset, and the calendar year as independent variable using thin plate regression
splines. To further assess time trends, we fitted binomial regression models using a
logarithmic link function, including the same former variables and adding as
explanatory variable maternal age group (under 30, 30-34, 35-39 and over 40 years).
We also conducted Chi square tests for trends in proportions, whose p-value results are
virtually identical to those from the binomial regression models.
In the case of Down’s Syndrome, we also tested trends in the estimated prevalence at
birth that would have occurred in the absence of antenatal diagnosis (and subsequent
terminations), using for that diagnosed prevalences adjusted for the natural foetal loss
risks reported by Savva.[5] Adjusting for natural foetal losses is aimed at controlling the
potential bias in the estimation of time trends in periods in which there is an increase in
the number of prenatal diagnoses and, consequently, in the number of cases diagnosed
prenatally that would not have survived to term and remained undiagnosed in absence
of prenatal diagnosis.
This study was approved by the Clinical Research Ethics Committee of the Basque
Country.
Page 18 of 33
For peer review only - http://bmjopen.bmj.com/site/about/guidelines.xhtml
BMJ Open
123456789101112131415161718192021222324252627282930313233343536373839404142434445464748495051525354555657585960
on July 23, 2020 by guest. Protected by copyright.
http://bmjopen.bm
j.com/
BM
J Open: first published as 10.1136/bm
jopen-2013-004244 on 3 March 2014. D
ownloaded from
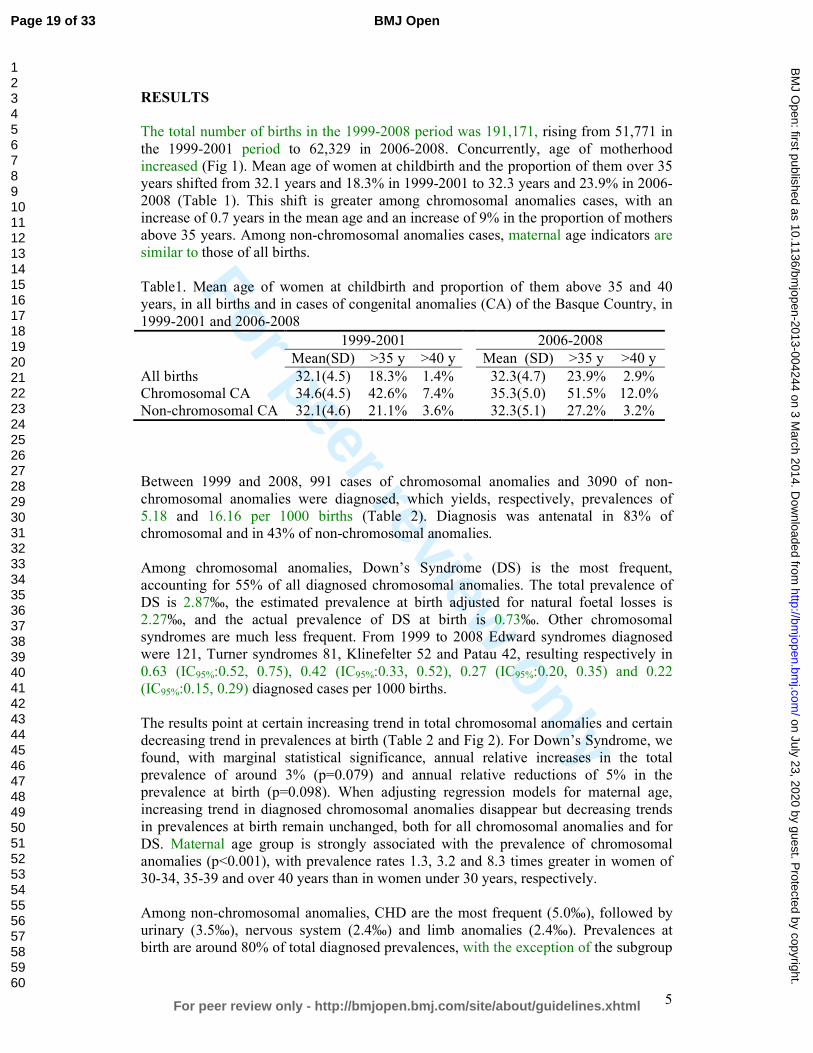
For peer review only
5
RESULTS
The total number of births in the 1999-2008 period was 191,171, rising from 51,771 in
the 1999-2001 period to 62,329 in 2006-2008. Concurrently, age of motherhood
increased (Fig 1). Mean age of women at childbirth and the proportion of them over 35
years shifted from 32.1 years and 18.3% in 1999-2001 to 32.3 years and 23.9% in 2006-
2008 (Table 1). This shift is greater among chromosomal anomalies cases, with an
increase of 0.7 years in the mean age and an increase of 9% in the proportion of mothers
above 35 years. Among non-chromosomal anomalies cases, maternal age indicators are
similar to those of all births.
Table1. Mean age of women at childbirth and proportion of them above 35 and 40
years, in all births and in cases of congenital anomalies (CA) of the Basque Country, in
1999-2001 and 2006-2008
1999-2001 2006-2008
Mean(SD) >35 y >40 y Mean (SD) >35 y >40 y
All births 32.1(4.5) 18.3% 1.4% 32.3(4.7) 23.9% 2.9%
Chromosomal CA 34.6(4.5) 42.6% 7.4% 35.3(5.0) 51.5% 12.0%
Non-chromosomal CA 32.1(4.6) 21.1% 3.6% 32.3(5.1) 27.2% 3.2%
Between 1999 and 2008, 991 cases of chromosomal anomalies and 3090 of non-
chromosomal anomalies were diagnosed, which yields, respectively, prevalences of
5.18 and 16.16 per 1000 births (Table 2). Diagnosis was antenatal in 83% of
chromosomal and in 43% of non-chromosomal anomalies.
Among chromosomal anomalies, Down’s Syndrome (DS) is the most frequent,
accounting for 55% of all diagnosed chromosomal anomalies. The total prevalence of
DS is 2.87‰, the estimated prevalence at birth adjusted for natural foetal losses is
2.27‰, and the actual prevalence of DS at birth is 0.73‰. Other chromosomal
syndromes are much less frequent. From 1999 to 2008 Edward syndromes diagnosed
were 121, Turner syndromes 81, Klinefelter 52 and Patau 42, resulting respectively in
0.63 (IC95%:0.52, 0.75), 0.42 (IC95%:0.33, 0.52), 0.27 (IC95%:0.20, 0.35) and 0.22
(IC95%:0.15, 0.29) diagnosed cases per 1000 births.
The results point at certain increasing trend in total chromosomal anomalies and certain
decreasing trend in prevalences at birth (Table 2 and Fig 2). For Down’s Syndrome, we
found, with marginal statistical significance, annual relative increases in the total
prevalence of around 3% (p=0.079) and annual relative reductions of 5% in the
prevalence at birth (p=0.098). When adjusting regression models for maternal age,
increasing trend in diagnosed chromosomal anomalies disappear but decreasing trends
in prevalences at birth remain unchanged, both for all chromosomal anomalies and for
DS. Maternal age group is strongly associated with the prevalence of chromosomal
anomalies (p<0.001), with prevalence rates 1.3, 3.2 and 8.3 times greater in women of
30-34, 35-39 and over 40 years than in women under 30 years, respectively.
Among non-chromosomal anomalies, CHD are the most frequent (5.0‰), followed by
urinary (3.5‰), nervous system (2.4‰) and limb anomalies (2.4‰). Prevalences at
birth are around 80% of total diagnosed prevalences, with the exception of the subgroup
Page 19 of 33
For peer review only - http://bmjopen.bmj.com/site/about/guidelines.xhtml
BMJ Open
123456789101112131415161718192021222324252627282930313233343536373839404142434445464748495051525354555657585960
on July 23, 2020 by guest. Protected by copyright.
http://bmjopen.bm
j.com/
BM
J Open: first published as 10.1136/bm
jopen-2013-004244 on 3 March 2014. D
ownloaded from

For peer review only
6
of nervous system anomalies, for which the prevalence at birth (0.9‰) is a third of the
total diagnosed one.
Prevalences of all non-chromosomal, urinary and limb anomalies grew during the study
period with different evolutions in time (Fig 3). Deviations from linearity are negligible
in all studied subgroups of anomalies, except for the urinary subgroup, which increased
between 1999 to 2003 and then plateaued, and for limb anomalies which sharply
mounted from 2004 to 2008. The estimated annual relative increment of prevalence
rates of all non-chromosomal anomalies is 3% and that of nervous system anomalies
5%. When models are adjusted for maternal age, trend estimates and statistical
significances remain unchanged (Table 2). With respect to mothers under 30 years,
prevalence rates of all non-chromosomal anomalies were 0.93 (IC95%:0.85, 1.02) for
mothers between 30 and 34, 1.0 (IC95%:0.90, 1.10) for mothers between 35 and 39, and
1.30 (IC95%:1.06, 1.51) for those over 40.
Page 20 of 33
For peer review only - http://bmjopen.bmj.com/site/about/guidelines.xhtml
BMJ Open
123456789101112131415161718192021222324252627282930313233343536373839404142434445464748495051525354555657585960
on July 23, 2020 by guest. Protected by copyright.
http://bmjopen.bm
j.com/
BM
J Open: first published as 10.1136/bm
jopen-2013-004244 on 3 March 2014. D
ownloaded from

For peer review only
7
Table 2. Trends in congenital anomalies in the Basque Country (Spain), from 1999 to 2008
Prevalences(cases/1.000 births) Crude change/yr Age adjusted change/yr
n 1999-2008 1999-2001 2006-2008 %(95%CI) p %(95%CI) p
Total diagnosed anomalies
Chromosomal
All 991 5.18(4.87,5.52) 4.95(4.37,5.60) 5.36(4.81,5.97) 1.01(0.99,1.04) 0.174 1.00(0.98,1.02) 0.878
DS* 548 2.87(2.63,3.12) 2.76(2.34,3.26) 3.10(2.68,3.57) 1.03(1.00,1.06) 0.079 1.01(0.98,1.04) 0.669
DS adjusted foetal loss 435 2.27(2.07,2.50) 2.24(1.86,2.70) 2.46(2.09,2.88) 1.02(0.99,1.06) 0.161 1.00(0.97,1.04) 0.843
Non-chromosomal
All 3090 16.2(15.6,16.7) 13.7(12. 8,14.8) 17.8(16.7,18.8) 1.04(1.02,1.05) <0.001 1.04(1.03,1.05) <0.001
Nervous system 456 2.38(2.17,2.62) 1.99(1.63,2.42) 2.84(2.44,3.30) 1.05(1.01,1.08) 0.007 1.05(1.01,1.08) 0.007
Urinary 670 3.50(3.25,3.78) 2.41(2.02,2.89) 3.64(3.19,4.16) 1.04(1.02,1.07) 0.002 1.04(1.01,1.07) 0.003
Digestive 304 1.59(1.42,1.78) 1.31(1.03,1.68) 1.83(1.52,2.21) 1.03(0.99,1.08) 0.101 1.03(0.99,1.08) 0.105
Limbs 460 2.41(2.19,2.64) 1.62(1.30,2.02) 4.09(3.61,4.63) 1.17(1.13,1.21) <0.001 1.17(1.13,1.21) <0.001
Heart 962 5.03(4.72,5.36) 4.87(4.29,5.51) 4.81(4.29,5.40) 1.00(0.98,1.02) 0.876 1.01(0.98,1.03) 0.619
Congenital anomalies at birth
Chromosomal
All 238 1.25(1.09,1.42) 1.49(1.18,1.87) 1.16(0.91,1.46) 0.97(0.93,1.01) 0.160 0.96(0.92,1.00) 0.080
DS 139 0.73(0.61,0.86) 1.02(0.77,1.35) 0.66(0.48,0.90) 0.95(0.9 ,1.01) 0.098 0.95(0.89,1.01) 0.076
Non-chromosomal
All 2442 12.8(12.3,3.29) 10.7(9.9,11.65) 14.1(13.2,15.0) 1.04(1.03,1.06) <0.001 1.04(1.03,1.06) <0.001
Nervous system 166 0.87(0.74,1.01) 0.64(0.45,0.91) 1.17(0.92,1.48) 1.10(1.04,1.16) 0.001 1.10(1.04,1.16) 0.001
Urinary 564 2.95(2.71,3.21) 1.87(1.53,2.30) 3.11(2.70,3.59) 1.05(1.02,1.09) <0.001 1.05(1.02,1.09) <0.001
Digestive 276 1.44(1.28,1.63) 1.20(0.93,1.55) 1.65(1.36,2.01) 1.03(0.99,1.08) 0.115 1.03(0.99,1.08) 0.127
Limbs 360 1.88(1.70,2.09) 1.33(1.04,1.70) 3.23(2.80,3.71) 1.17(1.13,1.22) <0.001 1.17(1.13,1.22) <0.001
Heart 873 4.57(4.27,4.88) 4.73(4.17,5.37) 4.08(3.60,4.62) 0.98(0.96,1.01) 0.176 0.99(0.97,1.01) 0.340
* DS: Down’s Syndrome
Page 21 of 33
For peer review only - http://bmjopen.bmj.com/site/about/guidelines.xhtml
BMJ Open
123456789101112131415161718192021222324252627282930313233343536373839404142434445464748495051525354555657585960
on July 23, 2020 by guest. Protected by copyright. http://bmjopen.bmj.com/ BMJ Open: first published as 10.1136/bmjopen-2013-004244 on 3 March 2014. Downloaded from
For peer review only
8
DISCUSSION
During 1999-2008 the age of women at childbirth shifted towards later ages, and there
was an increase in diagnosed prevalences of chromosomal and non-chromosomal
anomalies in the Basque Country. Among non-chromosomal anomalies, the evolution
of prevalences is particular of each subgroup, with no common pattern and in some
cases with notable relative rises in magnitude.
Data used in this study come from the Registry of Neonatal Screening and Congenital
Anomalies of the Basque Country. The registry follows the EUROCAT project guides
and it was launched several years before the initial date of this project. As a
consequence, the data are highly reliable and have improved comparability with results
from other registries.[6] Surveillance of the evolution in time of congenital anomalies
conceivably allows detecting changes in risk that may occur locally or on a greater
scale. However, antenatal diagnosis leads to detect more non-viable cases that otherwise
would have been miscarriages and remained undiagnosed, and therefore, improvements
in quality and accessibility of diagnostic test can make the estimation of trends in
congenital anomalies rates more prone to bias than in other health outcomes. This is an
important issue to take into account when interpreting changes in rates of diagnosed
congenital anomalies.
Prevalence of chromosomal anomalies in the Basque Country are higher than the overall
estimated prevalence for Europe, 5.2‰ vs. 3.8‰ in all chromosomal anomalies, and
2.9‰ vs. 2.1‰ in the case of Down’s Syndrome.[2, 7] It is well known that older
mothers are at higher risk of chromosomal anomalies, and that risk increases
exponentially from the age of 30, not only for Down Syndrome, but also for other less
prevalent chromosomal syndromes, such as trisomies 13 and 18.[8] The high maternal
age of Basque mothers, in fact, at the top of the European ranking, can explain why
prevalences of chromosomal anomalies are higher in the Basque Country. Likewise, the
increase in maternal age from 1999 to 2008 would be the primary reason to explain the
observed positive trend in all chromosomal anomalies and Down’s syndrome
prevalences. Our findings support this view, as trends are no longer statistically
significant when adjusting for maternal age. A secondary explanation, both for trends
and for the differences with other European regions, may be differences in case
ascertainment derived from the increasingly frequent use of prenatal diagnoses in the
Basque Country, which, in turn, is partially provoked by the rise in maternal age.
Increases in prevalences of chromosomal anomalies have been also reported in other
European regions.[2]
Prevalences at birth of chromosomal anomalies show certain decreasing trend, which is
related to the extension and use of antenatal diagnosis and the decision that most of
women make after receiving a positive diagnosis. On average 80% of all chromosomal
anomalies were diagnosed antenatally, 74% in 1999-2001 and 85% in 2006-2008. In the
Basque Country, 90% of the women who received an antenatal diagnosis of
chromosomal anomaly decided to terminate the pregnancy. This proportion is similar to
that found in England and Wales where, as Morris et al reported, dramatic changes in
demography have been offset by improved antenatal diagnosis and have resulted in no
substantial changes in birth prevalences of Down’s syndrome.[9]
Page 22 of 33
For peer review only - http://bmjopen.bmj.com/site/about/guidelines.xhtml
BMJ Open
123456789101112131415161718192021222324252627282930313233343536373839404142434445464748495051525354555657585960
on July 23, 2020 by guest. Protected by copyright.
http://bmjopen.bm
j.com/
BM
J Open: first published as 10.1136/bm
jopen-2013-004244 on 3 March 2014. D
ownloaded from
For peer review only
9
The prevalence of non-chromosomal congenital anomalies in the Basque Country,
contrary to chromosomal anomalies, is lower than overall rates reported in Europe,
12.8‰ vs. 20.2‰.[2] By subgroups, those of nervous system, digestive and urinary
anomalies, with deviations smaller than 10%, can be considered similar to the overall
European rate; CHD rates are 20% lower in the Basque Country.
The relationship between maternal age and the prevalence of some subgroups of non-
chromosomal anomalies has been reported to be U-curves or J-curves, younger and
older mothers showing increased risk.[10-12] Our findings for total non-chromosomal
anomalies, with the lowest prevalence in mothers between 30 and 34 years, are in
agreement with this type of relationship. Loane et al performed a population based
prevalence study, covering a total of 1.75 million births form 2000 to 2004, and they
found teenage mothers to have the highest prevalence of all non-chromosomal
congenital anomalies.[13] The prevalence decreased as maternal age increased, until a
slight increase was observed in mothers 40-44 years of age and a further increase in
mothers above 45 years. They also reported that the maternal age pattern of risk differs
between countries, and concluded that, unlike chromosomal anomalies, it is not
biological age that is associated with risk of non-chromosomal congenital anomalies,
but reproductive, social, ethnic, exposure of lifestyle factors that have a different
relationship with maternal age in different countries. They concluded that the increase
of risk due to maternal age can be considered negligible, especially when compared to
chromosomal anomalies. Association of paternal age and risk of certain birth defects
has been reported for younger paternal ages, also with relatively low increases in risk as
age grows.[14]
All non-chromosomal anomalies increased during the study period, but this result needs
to be treated with caution. All non-chromosomal anomalies are a very broad and
heterogeneous group of anomalies with different aetiology that can hardly be related to
a common true change in risk. Besides, in two of the subgroups, limbs and urinary
anomalies, improvements in case ascertainment cannot be completely ruled out, as
prevalences before the observed sudden rise were clearly below the average prevalences
reported from other registries.
We did not find any change in CHD prevalences, which is in line with what has been
observed in Europe, where after an increase in the early 90s due to improvements in
echocardiographic investigations, rates have remained stable.[2, 15] Prevalences of
congenital anomalies of nervous and digestive systems show a slight steady increase
from 1999 to 2008. Decreasing trends in neural tube defects (NTD) have been reported
in some parts of Europe [2], but in others places no significant decrease has been found.
[16, 17] NTD risk has been associated with socioeconomic status. This has raised the
issue if periconceptual folic acid recommendations are being followed. Spanish data
about folic supplementation in pregnancies, coming from INMA project, point at
extensive compliance of recommendations in the 3rd month of pregnancy (94% of
women), lower compliance in the 2nd one (66% of women) and scarce preconceptual
compliance (19%), suggesting that folic supplementation in Spain is still an area of
improvement for NTD reductions.[18]
Difference between diagnosed anomalies and prevalences at birth are slight for
digestive, limbs and urinary anomalies, while is notable for the nervous system,
reflecting differences in severity and in the proportion of antenatal diagnosis, much
Page 23 of 33
For peer review only - http://bmjopen.bmj.com/site/about/guidelines.xhtml
BMJ Open
123456789101112131415161718192021222324252627282930313233343536373839404142434445464748495051525354555657585960
on July 23, 2020 by guest. Protected by copyright.
http://bmjopen.bm
j.com/
BM
J Open: first published as 10.1136/bm
jopen-2013-004244 on 3 March 2014. D
ownloaded from

For peer review only
10
more frequent for anomalies of the nervous system (in 82% of the diagnosed cases) than
in limbs (57%), digestive (28%) and urinary anomalies (22%).
Maintaining the surveillance of non-chromosomal anomalies is essential. It is necessary
to check if the observed trends continue or disappear in the following years, and
complementary data analysis are needed in order to assess if, associated or not with the
increasing trends, there is spatial clustering of cases that can share the same aetiology.
CONCLUSION
In the Basque Country chromosomal anomalies rates are high and continue to increase
slightly, which may be related to the rise in maternal age. Rates of non-chromosomal
anomalies are within the European frequent range of values, and the increases observed
in some of them need to be checked in the following years.
Page 24 of 33
For peer review only - http://bmjopen.bmj.com/site/about/guidelines.xhtml
BMJ Open
123456789101112131415161718192021222324252627282930313233343536373839404142434445464748495051525354555657585960
on July 23, 2020 by guest. Protected by copyright.
http://bmjopen.bm
j.com/
BM
J Open: first published as 10.1136/bm
jopen-2013-004244 on 3 March 2014. D
ownloaded from

For peer review only
11
FUNDING
This study was partially funded by Instituto de Salud Carlos III (FIS PI 08/1392)) of
The Spanish Ministry of Economy and Competitiveness
CONFLICT OF INTERESTS
The authors declare that they have no conflict of interest.
Page 25 of 33
For peer review only - http://bmjopen.bmj.com/site/about/guidelines.xhtml
BMJ Open
123456789101112131415161718192021222324252627282930313233343536373839404142434445464748495051525354555657585960
on July 23, 2020 by guest. Protected by copyright.
http://bmjopen.bm
j.com/
BM
J Open: first published as 10.1136/bm
jopen-2013-004244 on 3 March 2014. D
ownloaded from

For peer review only
12
REFERENCES
1. Boyd PA, Haeusler M, Barisic I, et al. Paper 1: The EUROCAT network--
organization and processes. Birth Defects Res A Clin Mol Teratol 2011;91 Suppl 1:S2-
15.
2. Loane M, Dolk H, Kelly A, et al. Paper 4: EUROCAT statistical monitoring:
identification and investigation of ten year trends of congenital anomalies in Europe.
Birth Defects Res A Clin Mol Teratol 2011;91 Suppl 1:S31-43.
3. EUROSTAT. Mean age of women at childbirth (code: tps00017). In:
http://goo.gl/8Lzfk. Accessed 4 Jun 2013
4. EUSTAT. Synthetic index of fecundity and average materity age according to
year.In: http://goo.gl/jlBXf. Accessed 4 Jun 2013
5. Savva GM, Morris JK, Mutton DE, et al. Maternal age-specific fetal loss rates in
Down syndrome pregnancies. Prenat Diagn 2006;26:499-504.
6. Loane M, Dolk H, Garne E, et al. Paper 3: EUROCAT data quality indicators for
population-based registries of congenital anomalies. Birth Defects Res A Clin Mol
Teratol 2011;91 Suppl 1:S23-30.
7. Khoshnood B, Greenlees R, Loane M, et al. Paper 2: EUROCAT public health
indicators for congenital anomalies in Europe. Birth Defects Res A Clin Mol Teratol
2011;91 Suppl 1:S16-22.
8. Savva GM, Walker K, Morris JK. The maternal age-specific live birth prevalence of
trisomies 13 and 18 compared to trisomy 21 (Down syndrome). Prenat Diagn
2010;30:57-64.
9. Morris JK, Alberman E. Trends in Down's syndrome live births and antenatal
diagnoses in England and Wales from 1989 to 2008: analysis of data from the National
Down Syndrome Cytogenetic Register. Bmj 2009;339:b3794.
10. Reefhuis J, Honein MA. Maternal age and non-chromosomal birth defects, Atlanta--
1968-2000: teenager or thirty-something, who is at risk? Birth Defects Res A Clin Mol
Teratol 2004;70:572-9.
11. Ooki S. Maternal age and birth defects after the use of assisted reproductive
technology in Japan, 2004-2010. Int J Womens Health 2013;5:65-77.
12. Gill SK, Broussard C, Devine O, et al. Association between maternal age and birth
defects of unknown etiology: United States, 1997-2007. Birth Defects Res A Clin Mol
Teratol 2012;94:1010-8.
13. Loane M, Dolk H, Morris JK. Maternal age-specific risk of non-chromosomal
anomalies. Bjog 2009;116:1111-9.
14. Green RF, Devine O, Crider KS, et al. Association of paternal age and risk for major
congenital anomalies from the National Birth Defects Prevention Study, 1997 to 2004.
Ann Epidemiol 2010;20:241-9.
15. Oyen N, Poulsen G, Boyd HA, et al. National time trends in congenital heart
defects, Denmark, 1977-2005. Am Heart J 2009;157:467-73 e1.
16. Poretti A, Anheier T, Zimmermann R, et al. Neural tube defects in Switzerland from
2001 to 2007: are periconceptual folic acid recommendations being followed? Swiss
Med Wkly 2008;138:608-13.
Page 26 of 33
For peer review only - http://bmjopen.bmj.com/site/about/guidelines.xhtml
BMJ Open
123456789101112131415161718192021222324252627282930313233343536373839404142434445464748495051525354555657585960
on July 23, 2020 by guest. Protected by copyright.
http://bmjopen.bm
j.com/
BM
J Open: first published as 10.1136/bm
jopen-2013-004244 on 3 March 2014. D
ownloaded from

For peer review only
13
17. Abeywardana S, Bower C, Halliday J, et al. Prevalence of neural tube defects in
Australia prior to mandatory fortification of bread-making flour with folic acid. Aust N
Z J Public Health 2010;34:351-5.
18. Sanfélix-Gimeno G FI, Librero J, Peiró S. Caracterization of folate supplementation
in pregnancy, based on a combination of health information systems. Gac Sanit
2012;26:7.
Page 27 of 33
For peer review only - http://bmjopen.bmj.com/site/about/guidelines.xhtml
BMJ Open
123456789101112131415161718192021222324252627282930313233343536373839404142434445464748495051525354555657585960
on July 23, 2020 by guest. Protected by copyright.
http://bmjopen.bm
j.com/
BM
J Open: first published as 10.1136/bm
jopen-2013-004244 on 3 March 2014. D
ownloaded from

For peer review only
14
Fig 1. Age of women at childbirth and at diagnosis of a chromosomal anomaly in the
Basque Country (Spain), in 1999-2001 and 2006-2008
Fig 2. Estimated prevalences in each calendar year (error bars) and GAM fits (lines) of
chromosomal congenital anomalies in the Basque Country (Spain), from 1999 to 2008
Fig 3. Estimated prevalences in each calendar year (error bars) and GAM fits (lines) of
non-chromosomal congenital anomalies in the Basque Country (Spain), from 1999 to
2008.
Page 28 of 33
For peer review only - http://bmjopen.bmj.com/site/about/guidelines.xhtml
BMJ Open
123456789101112131415161718192021222324252627282930313233343536373839404142434445464748495051525354555657585960
on July 23, 2020 by guest. Protected by copyright.
http://bmjopen.bm
j.com/
BM
J Open: first published as 10.1136/bm
jopen-2013-004244 on 3 March 2014. D
ownloaded from

For peer review only
131x202mm (300 x 300 DPI)
Page 29 of 33
For peer review only - http://bmjopen.bmj.com/site/about/guidelines.xhtml
BMJ Open
123456789101112131415161718192021222324252627282930313233343536373839404142434445464748495051525354555657585960
on July 23, 2020 by guest. Protected by copyright.
http://bmjopen.bm
j.com/
BM
J Open: first published as 10.1136/bm
jopen-2013-004244 on 3 March 2014. D
ownloaded from

For peer review only
Error bars: Annual prevalences and 95% confidence intervals. Lines: GAM fits
197x141mm (300 x 300 DPI)
Page 30 of 33
For peer review only - http://bmjopen.bmj.com/site/about/guidelines.xhtml
BMJ Open
123456789101112131415161718192021222324252627282930313233343536373839404142434445464748495051525354555657585960
on July 23, 2020 by guest. Protected by copyright.
http://bmjopen.bm
j.com/
BM
J Open: first published as 10.1136/bm
jopen-2013-004244 on 3 March 2014. D
ownloaded from
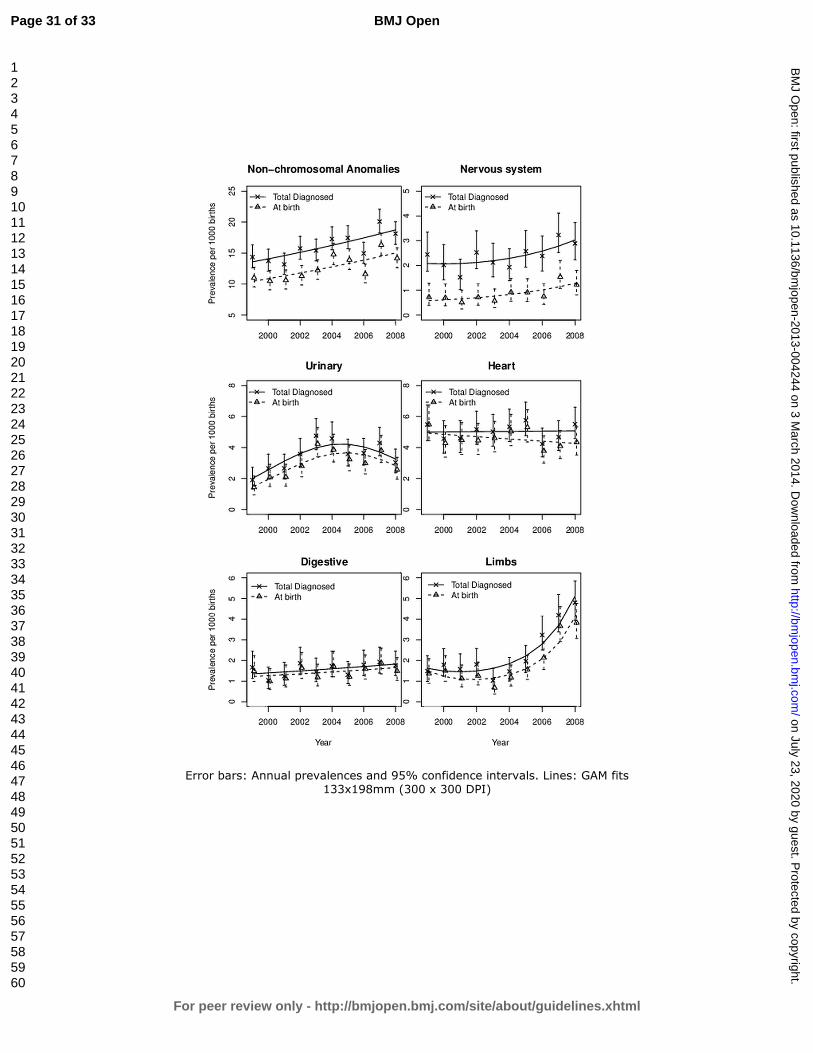
For peer review only
Error bars: Annual prevalences and 95% confidence intervals. Lines: GAM fits
133x198mm (300 x 300 DPI)
Page 31 of 33
For peer review only - http://bmjopen.bmj.com/site/about/guidelines.xhtml
BMJ Open
123456789101112131415161718192021222324252627282930313233343536373839404142434445464748495051525354555657585960
on July 23, 2020 by guest. Protected by copyright.
http://bmjopen.bm
j.com/
BM
J Open: first published as 10.1136/bm
jopen-2013-004244 on 3 March 2014. D
ownloaded from

For peer review only
1
STROBE Statement—checklist of items that should be included in reports of observational studies Item
No Recommendation
Title and abstract 1√
(a) Indicate the study’s design with a commonly used term in the title or the
abstract
(b) Provide in the abstract an informative and balanced summary of what
was done and what was found
Introduction
Background/rationale 2√ Explain the scientific background and rationale for the investigation being
reported
Objectives 3√ State specific objectives, including any prespecified hypotheses
Methods
Study design 4 √ Present key elements of study design early in the paper
Setting 5 √ Describe the setting, locations, and relevant dates, including periods of
recruitment, exposure, follow-up, and data collection
Participants 6
√
(a) Cohort study—Give the eligibility criteria, and the sources and methods
of selection of participants. Describe methods of follow-up
Case-control study—Give the eligibility criteria, and the sources and
methods of case ascertainment and control selection. Give the rationale for
the choice of cases and controls
Cross-sectional study—Give the eligibility criteria, and the sources and
methods of selection of participants. (Data come from a population-based
registry)
(b) Cohort study—For matched studies, give matching criteria and number
of exposed and unexposed
Case-control study—For matched studies, give matching criteria and the
number of controls per case
Variables 7√ Clearly define all outcomes, exposures, predictors, potential confounders,
and effect modifiers. Give diagnostic criteria, if applicable
Data sources/
measurement
8* For each variable of interest, give sources of data and details of methods of
assessment (measurement). Describe comparability of assessment methods
if there is more than one group
Bias 9√ Describe any efforts to address potential sources of bias
Study size 10√ Explain how the study size was arrived at (It is a population based study;
we use data of the entire population)
Quantitative variables 11 Explain how quantitative variables were handled in the analyses. If
applicable, describe which groupings were chosen and why (Not applicable)
Statistical methods 12√ (a) Describe all statistical methods, including those used to control for
confounding
(b) Describe any methods used to examine subgroups and interactions
(c) Explain how missing data were addressed
(d) Cohort study—If applicable, explain how loss to follow-up was
addressed
Case-control study—If applicable, explain how matching of cases and
controls was addressed
Cross-sectional study—If applicable, describe analytical methods taking
Page 32 of 33
For peer review only - http://bmjopen.bmj.com/site/about/guidelines.xhtml
BMJ Open
123456789101112131415161718192021222324252627282930313233343536373839404142434445464748495051525354555657585960
on July 23, 2020 by guest. Protected by copyright.
http://bmjopen.bm
j.com/
BM
J Open: first published as 10.1136/bm
jopen-2013-004244 on 3 March 2014. D
ownloaded from

For peer review only
2
account of sampling strategy
(e) Describe any sensitivity analyses
Results
Participants 13* (a) Report numbers of individuals at each stage of study—eg numbers potentially
eligible, examined for eligibility, confirmed eligible, included in the study,
completing follow-up, and analysed (Not applicable)
(b) Give reasons for non-participation at each stage
(c) Consider use of a flow diagram
Descriptive data 14*√
(a) Give characteristics of study participants (eg demographic, clinical, social) and
information on exposures and potential confounders
(b) Indicate number of participants with missing data for each variable of interest
(c) Cohort study—Summarise follow-up time (eg, average and total amount)
Outcome data 15*
√
Cohort study—Report numbers of outcome events or summary measures over time
Case-control study—Report numbers in each exposure category, or summary
measures of exposure
Cross-sectional study—Report numbers of outcome events or summary measures
Main results 16√ (a) Give unadjusted estimates and, if applicable, confounder-adjusted estimates and
their precision (eg, 95% confidence interval). Make clear which confounders were
adjusted for and why they were included
(b) Report category boundaries when continuous variables were categorized
(c) If relevant, consider translating estimates of relative risk into absolute risk for a
meaningful time period
Other analyses 17√ Report other analyses done—eg analyses of subgroups and interactions, and
sensitivity analyses
Discussion
Key results 18√ Summarise key results with reference to study objectives
Limitations 19√ Discuss limitations of the study, taking into account sources of potential bias or
imprecision. Discuss both direction and magnitude of any potential bias
Interpretation 20√ Give a cautious overall interpretation of results considering objectives, limitations,
multiplicity of analyses, results from similar studies, and other relevant evidence
Generalisability 21√ Discuss the generalisability (external validity) of the study results
Other information
Funding 22√ Give the source of funding and the role of the funders for the present study and, if
applicable, for the original study on which the present article is based
*Give information separately for cases and controls in case-control studies and, if applicable, for exposed and
unexposed groups in cohort and cross-sectional studies.
Note: An Explanation and Elaboration article discusses each checklist item and gives methodological background and
published examples of transparent reporting. The STROBE checklist is best used in conjunction with this article (freely
available on the Web sites of PLoS Medicine at http://www.plosmedicine.org/, Annals of Internal Medicine at
http://www.annals.org/, and Epidemiology at http://www.epidem.com/). Information on the STROBE Initiative is
available at www.strobe-statement.org.
Page 33 of 33
For peer review only - http://bmjopen.bmj.com/site/about/guidelines.xhtml
BMJ Open
123456789101112131415161718192021222324252627282930313233343536373839404142434445464748495051525354555657585960
on July 23, 2020 by guest. Protected by copyright.
http://bmjopen.bm
j.com/
BM
J Open: first published as 10.1136/bm
jopen-2013-004244 on 3 March 2014. D
ownloaded from
For peer review only
TRENDS IN THE PREVALENCES OF CONGENITAL ANOMALIES
AND AGE AT MOTHERHOOD IN A SOUTHERN EUROPEAN
REGION
Journal: BMJ Open
Manuscript ID: bmjopen-2013-004244.R2
Article Type: Research
Date Submitted by the Author: 05-Feb-2014
Complete List of Authors: Cambra, Koldo; Navarrabiomed-Fundación Miguel Servet- Red de Investigación en Servicios de Salud en Enfermedades Crónicas (REDISSEC)., Ibañez, Berta; Navarrabiomed-Fundación Miguel Servet- Red de Investigación en Servicios de Salud en Enfermedades Crónicas (REDISSEC)., Urzelai, Deiene; Gobierno Vasco, Departamento de Salud Portillo, Isabel; Osakidetza- Servicio Vasco de Salud, Montoya, Imanol; Osakidetza-Servicio Vasco de Salud, Esnaola, Santiago; Gobierno Vasco, Departamento de Salud Cirarda, Francisco; Gobierno Vasco, Departamento de Salud
<b>Primary Subject Heading</b>:
Epidemiology
Secondary Subject Heading: Public health, Reproductive medicine
Keywords: Congenital anomalies, Birth defects, Chromosomal anomalies, Trends, Maternal age
For peer review only - http://bmjopen.bmj.com/site/about/guidelines.xhtml
BMJ Open on July 23, 2020 by guest. P
rotected by copyright.http://bm
jopen.bmj.com
/B
MJ O
pen: first published as 10.1136/bmjopen-2013-004244 on 3 M
arch 2014. Dow
nloaded from

For peer review only
1
TRENDS IN THE PREVALENCES OF CONGENITAL ANOMALIES AND AGE AT
MOTHERHOOD IN A SOUTHERN EUROPEAN REGION
List of authors:
Cambra K(1), Ibañez B(1), Urzelai D(2), Portillo I(3), Montoya I(2), Esnaola S(2),
Cirarda FB(2)
(1) Navarrabiomed-Fundación Miguel Servet- Red de Investigación en Servicios de
Salud en Enfermedades Crónicas (REDISSEC). Pamplona, Spain
(2) Departamento de Salud. Gobierno Vasco. Vitoria, Spain
(3) Osakidetza- Servicio Vasco de Salud. Vitoria, Spain
Corresponding author:
Koldo Cambra
Navarrabiomed-Fundación Miguel Servet
Complejo Hospitalario de Navarra
C/ Irunlarrea s/n
31008 Pamplona. Spain
Tfno: 34 848428292
Fax: 34 848422200
e-mail: [email protected]
KEYWORDS:
Congenital anomalies, trends, maternal age, chromosomal anomalies, birth defects
Word count: 2836
Page 1 of 33
For peer review only - http://bmjopen.bmj.com/site/about/guidelines.xhtml
BMJ Open
123456789101112131415161718192021222324252627282930313233343536373839404142434445464748495051525354555657585960
on July 23, 2020 by guest. Protected by copyright.
http://bmjopen.bm
j.com/
BM
J Open: first published as 10.1136/bm
jopen-2013-004244 on 3 March 2014. D
ownloaded from

For peer review only
2
Abstract
Objectives. To estimate the prevalences of the main groups of congenital anomalies
and to assess their trend over time.
Design. Population-based study of prevalences.
Setting. The Basque Country, Spain.
Partipants. All births and all congenital anomalies diagnosed prenatally, at birth or
during the first year of age, in all hospitals of the country, from 1999 to 2008.
Main outcomes measures. Total diagnosed prevalences and prevalences at birth of all
chromosomal and non-chromosomal anomalies, Down’s syndrome, anomalies of the
nervous system, urinary, limbs, digestive system and congenital heart defects.
Results. Mean age (SD) of women at childbirth and the proportion of them over 35
years and over 40 years shifted from 32.1(4.5) years, 18.3% and 1.4% in 1999-2001, to
32.3(4.7) years, 23.9% and 2.9% in 2006-2008.
Between 1999 and 2008, 991 cases of chromosomal anomalies and 3090 of non-
chromosomal anomalies were diagnosed, which yields, respectively, total prevalences
of 5.2‰ and of 16.2‰. Among chromosomal anomalies Down’s syndrome is the most
frequent (2.9‰). With marginal statistical significance, the results point at an increasing
trend in total diagnosed chromosomal anomalies, but a decreasing one in prevalences at
birth. Among non-chromosomal congenital anomalies, congenital heart defects are the
most frequent (5.2‰). Rates of all non-chromosomal, urinary and limb anomalies grew
during the study period, whereas those of congenital heart defects and anomalies of the
digestive system did not change significantly.
Conclusion. In the Basque Country, rates of chromosomal anomalies are higher than
the overall estimated prevalence in European Countries, and continue to increase
slightly, which may be related to the rise in maternal age. Rates of non-chromosomal
anomalies are within the European frequent range of values, and the increases observed
need to be checked in the following years.
Article summary
Strengths and limitations of the study
� This study analyses the trend over time of the prevalences of congenital
anomalies using highly reliable data from population-based registries.
� The study provides insight into the occurring changes in maternal age, the extent
of the use of antenatal diagnosis and its impact on the prevalences of congenital
anomalies at birth.
� Improvements in quality and accessibility of diagnostic tests can lead to an
apparent increase in prevalences.
Page 2 of 33
For peer review only - http://bmjopen.bmj.com/site/about/guidelines.xhtml
BMJ Open
123456789101112131415161718192021222324252627282930313233343536373839404142434445464748495051525354555657585960
on July 23, 2020 by guest. Protected by copyright.
http://bmjopen.bm
j.com/
BM
J Open: first published as 10.1136/bm
jopen-2013-004244 on 3 March 2014. D
ownloaded from
For peer review only
3
INTRODUCTION
Congenital anomalies affect around 2% of births in Europe.[1] They account for a great
part of neonatal mortality and morbidity, and may be an important source of distress for
parents and families. In the majority of cases the aetiology of congenital anomalies
remains unknown. Some increasing trends have been detected by EUROCAT in the
Pan-Europe analysis for several congenital anomalies such as hypospadias, abdominal
wall anomalies, gastroschisis, trisomy 18 and renal dysplasia.[2] Local trends have been
more frequently detected but, in general, they need further verification.
Women’s age at childbirth has been on the rise in all European countries included in
Eurostat during the last decades. From 2001 to 2008 the average maternal age in EU-17
inched up from 29.5 to 30.3 years, but geographical differences remained important,
with greater values in West Europe and differences between countries of up to 5 years.
Spain, in the fifth position of the European ranking of 2008, with a mean age of women
at childbirth of 30.8 years, climbed to the top in 2011 with a mean of 31.5 years.[3]
Changes in demographics and in the perception of risks, along with a generalized
extension and improvement of antenatal diagnosis, have increased (in Spain and other
countries) the public awareness on reproductive health issues. Improvements in
antenatal diagnosis as well as in case registrations allow for more reliable population-
based studies on congenital anomalies.
The Basque Country is an industrialized, urban type community, situated in north Spain,
with around 2.2 million inhabitants. Demographic changes in the last decades have been
dramatic, greater than in other Spanish regions. The synthetic index of fecundity (an
estimation of the number of children a hypothetical woman would have at the end of her
fertile life if her fecundity corresponded to the age-specific fecundity rates of the
population) fell from 2.67 in 1975 to 1.24 in 1985, 0.97 in 1990 and 1.03 in 2000, while
the average of maternity age rose from 28.6, to 29.1, 30.0, 31.3 and 32.4 years in the
same calendar years.[4] Medical care and antenatal diagnosis are widely available to all
pregnant women, and they are provided by the Basque Health Service to the entire
population.
The detection of trends is an essential component of epidemiological surveillance of
congenital anomalies, valuable for care and genetic advice planning and also for
warning of environmental risk factors. Its interest actually grows in places where
changes in reproductive health determinants may be occurring.
This report analyses the evolution of maternal age and prevalences of congenital
anomalies in a ten year period in the Basque Country, focusing on total and on specific
subgroups of chromosomal and non-chromosomal anomalies.
METHODS
The study period was 1999-2008. We used data from the population based Registry of
Neonatal Screening and Congenital Anomalies of the Basque Country, integrated in
EUROCAT project and operating since the early 1990s. All anomalies diagnosed
prenatally, at birth or during the first year of age, in all hospitals of the country are
Page 3 of 33
For peer review only - http://bmjopen.bmj.com/site/about/guidelines.xhtml
BMJ Open
123456789101112131415161718192021222324252627282930313233343536373839404142434445464748495051525354555657585960
on July 23, 2020 by guest. Protected by copyright.
http://bmjopen.bm
j.com/
BM
J Open: first published as 10.1136/bm
jopen-2013-004244 on 3 March 2014. D
ownloaded from

For peer review only
4
included. The registry covers affected live births, foetal births with gestational age 22
weeks or greater, and terminations of pregnancy for foetal anomaly following prenatal
diagnosis. The staff of the Registry routinely check Hospital Discharge Databases and
the Registry of Terminations of Pregnancies searching for new cases, review medical
reports of prenatal diagnosis (sonography, genetic test and pathology) and code all
congenital anomalies.
We estimated the prevalences and 95% confidence intervals (CI) related to mothers with
residence in the Basque Country, of total chromosomal anomalies (ICD-10, Q90-93,
Q96-99), total non-chromosomal anomalies (Q chapter excluding chromosomal
anomalies, D215, D821, D1810, P350, P351, P371) and of the following subgroups:
anomalies of the nervous system (Q00-07), urinary (Q60-64, Q794), limbs (Q65-74),
digestive system (Q38-Q45, Q790), congenital heart defects (CHD)(Q20-26), and
Down (Q90), Patau (Q914-917), Edward (Q910-913), Turner (Q96) and Klinefelter’s
(Q980-984) syndromes. Other major organ subgroups of non-chromosomal anomalies
were not included in the analysis because their average prevalences, lower than one case
per 1000 births, are too low to be assessed on a yearly basis. The cases with several
non-chromosomal anomalies count as one case for calculating total or subgroup
prevalences, but they can be assigned to more than one subgroup. More details about
the anomalies included in each subgroup can be found elsewhere.[1] We estimated total
prevalence rates (congenital anomalies in liveborns, foetal deaths and induced abortions
divided by the total number of births) and prevalence rates at birth (congenital
anomalies in liveborns and foetal deaths divided by the total number of births). Data
related to denominators (number of births per year, place of residence and age of the
mother) were obtained from the Registry of Newborns of the Basque Country.
To explore the functional relationship between prevalences and time, we fitted
Generalized Additive Models (GAM), as they are flexible unrestricted models that can
properly reflect the true relationship between the variables. We included the annual
number of cases as a Poisson response variable, the number of births (live and still) as
the offset, and the calendar year as independent variable using thin plate regression
splines. To further assess time trends, we fitted binomial regression models using a
logarithmic link function, including the same former variables and adding as
explanatory variable maternal age group (under 30, 30-34, 35-39 and over 40 years).
Also, we used these age groups to conduct complementary age-stratified analyses for
chromosomal anomalies.
In the case of Down’s Syndrome, we also tested trends in the estimated prevalence at
birth that would have occurred in the absence of antenatal diagnosis (and subsequent
terminations), using for that diagnosed prevalences adjusted for the natural foetal loss
risks reported by Savva.[5] Adjusting for natural foetal losses is aimed at controlling the
potential bias in the estimation of time trends in periods in which there is an increase in
the number of prenatal diagnoses and, consequently, in the number of cases diagnosed
prenatally that would not have survived to term and remained undiagnosed in absence
of prenatal diagnosis.
This study was approved by the Clinical Research Ethics Committee of the Basque
Country.
Page 4 of 33
For peer review only - http://bmjopen.bmj.com/site/about/guidelines.xhtml
BMJ Open
123456789101112131415161718192021222324252627282930313233343536373839404142434445464748495051525354555657585960
on July 23, 2020 by guest. Protected by copyright.
http://bmjopen.bm
j.com/
BM
J Open: first published as 10.1136/bm
jopen-2013-004244 on 3 March 2014. D
ownloaded from

For peer review only
5
RESULTS
The total number of births in the 1999-2008 period was 191,171, rising from 51,771 in
the 1999-2001 period to 62,329 in 2006-2008. Concurrently, age of motherhood
increased (Fig 1). Mean age of women at childbirth and the proportion of them over 35
years shifted from 32.1 years and 18.3% in 1999-2001 to 32.3 years and 23.9% in 2006-
2008 (Table 1). This shift is greater among chromosomal anomalies cases, with an
increase of 0.7 years in the mean age and an increase of 9% in the proportion of mothers
above 35 years. Among non-chromosomal anomalies cases, maternal age indicators are
similar to those of all births.
Table1. Mean age of women at childbirth and proportion of them above 35 and 40
years, in all births and in cases of congenital anomalies of the Basque Country, in 1999-
2001 and 2006-2008
1999-2001 2006-2008
Mean(SD) >35 y >40 y Mean (SD) >35 y >40 y
All births 32.1(4.5) 18.3% 1.4% 32.3(4.7) 23.9% 2.9%
Chromosomal CA* 34.6(4.5) 42.6% 7.4% 35.3(5.0) 51.5% 12.0%
Non-chromosomal CA* 32.1(4.6) 21.1% 3.6% 32.3(5.1) 27.2% 3.2%
*CA: Congenital Anomalies
Between 1999 and 2008, 991 cases of chromosomal anomalies and 3090 of non-
chromosomal anomalies were diagnosed, which yields, respectively, prevalences of
5.18 and 16.16 per 1000 births (Table 2). Diagnosis was antenatal in 83% of
chromosomal and in 43% of non-chromosomal anomalies.
Among chromosomal anomalies, Down’s Syndrome (DS) is the most frequent,
accounting for 55% of all diagnosed chromosomal anomalies. The total prevalence of
DS is 2.87‰, the estimated prevalence at birth adjusted for natural foetal losses is
2.27‰, and the actual prevalence of DS at birth is 0.73‰. Other chromosomal
syndromes are much less frequent. From 1999 to 2008 Edward syndromes diagnosed
were 121, Turner syndromes 81, Klinefelter 52 and Patau 42, resulting respectively in
0.63 (IC95%:0.52, 0.75), 0.42 (IC95%:0.33, 0.52), 0.27 (IC95%:0.20, 0.35) and 0.22
(IC95%:0.15, 0.29) diagnosed cases per 1000 births.
The results point at certain increasing trend in total chromosomal anomalies and certain
decreasing trend in prevalences at birth (Table 2 and Fig 2). For Down’s Syndrome, we
found, with marginal statistical significance, annual relative increases in the total
prevalence of around 3% (p=0.079) and annual relative reductions of 5% in the
prevalence at birth (p=0.098). When adjusting regression models for maternal age,
increasing trend in diagnosed chromosomal anomalies disappear but decreasing trends
in prevalences at birth remain unchanged, both for all chromosomal anomalies and for
DS. In the age-stratified analysis, the decreasing trend in the prevalence of
chromosomal anomalies at birth is more clearly observed in women between 30 and 34
years (p=0.031). Maternal age is strongly associated with the prevalence of
chromosomal anomalies (p<0.001), with prevalence rates 1.3, 3.2 and 8.3 times greater
in women of 30-34, 35-39 and over 40 years than in women under 30 years,
respectively.
Page 5 of 33
For peer review only - http://bmjopen.bmj.com/site/about/guidelines.xhtml
BMJ Open
123456789101112131415161718192021222324252627282930313233343536373839404142434445464748495051525354555657585960
on July 23, 2020 by guest. Protected by copyright.
http://bmjopen.bm
j.com/
BM
J Open: first published as 10.1136/bm
jopen-2013-004244 on 3 March 2014. D
ownloaded from
For peer review only
6
Among non-chromosomal anomalies, CHD are the most frequent (5.0‰), followed by
urinary (3.5‰), nervous system (2.4‰) and limb anomalies (2.4‰). Prevalences at
birth are around 80% of total diagnosed prevalences, with the exception of the subgroup
of nervous system anomalies, for which the prevalence at birth (0.9‰) is a third of the
total diagnosed one.
Prevalences of all non-chromosomal, urinary and limb anomalies grew during the study
period with different time patterns (Fig 3). Deviations from linearity are negligible in all
studied subgroups of anomalies, except for the urinary subgroup, which increased
between 1999 to 2003 and then plateaued, and for limb anomalies which sharply
mounted from 2004 to 2008. The estimated annual relative increment of prevalence
rates of all non-chromosomal anomalies is 3% and that of nervous system anomalies
5%. When models are adjusted for maternal age, trend estimates and statistical
significances remain unchanged (Table 2). With respect to mothers under 30 years,
prevalence rates of all non-chromosomal anomalies were 0.93 (IC95%:0.85, 1.02) for
mothers between 30 and 34, 1.0 (IC95%:0.90, 1.10) for mothers between 35 and 39, and
1.30 (IC95%:1.06, 1.51) for those over 40.
Page 6 of 33
For peer review only - http://bmjopen.bmj.com/site/about/guidelines.xhtml
BMJ Open
123456789101112131415161718192021222324252627282930313233343536373839404142434445464748495051525354555657585960
on July 23, 2020 by guest. Protected by copyright.
http://bmjopen.bm
j.com/
BM
J Open: first published as 10.1136/bm
jopen-2013-004244 on 3 March 2014. D
ownloaded from
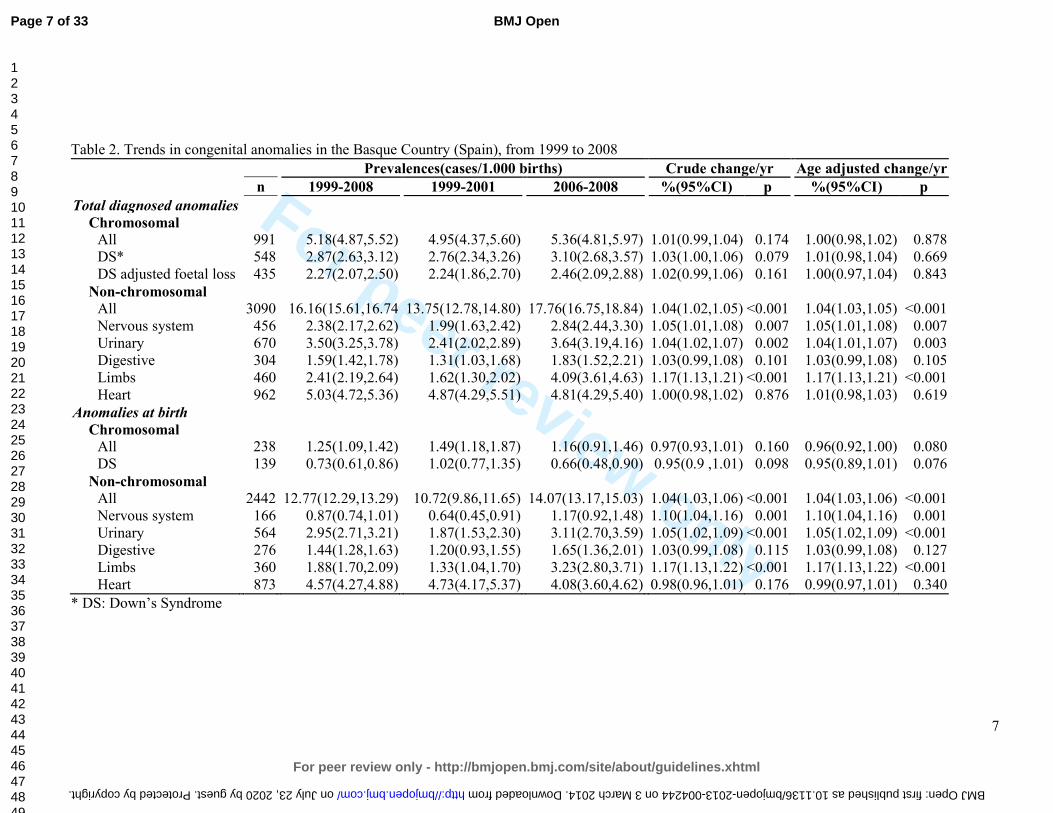
For peer review only
7
Table 2. Trends in congenital anomalies in the Basque Country (Spain), from 1999 to 2008
Prevalences(cases/1.000 births) Crude change/yr Age adjusted change/yr
n 1999-2008 1999-2001 2006-2008 %(95%CI) p %(95%CI) p
Total diagnosed anomalies
Chromosomal
All 991 5.18(4.87,5.52) 4.95(4.37,5.60) 5.36(4.81,5.97) 1.01(0.99,1.04) 0.174 1.00(0.98,1.02) 0.878
DS* 548 2.87(2.63,3.12) 2.76(2.34,3.26) 3.10(2.68,3.57) 1.03(1.00,1.06) 0.079 1.01(0.98,1.04) 0.669
DS adjusted foetal loss 435 2.27(2.07,2.50) 2.24(1.86,2.70) 2.46(2.09,2.88) 1.02(0.99,1.06) 0.161 1.00(0.97,1.04) 0.843
Non-chromosomal
All 3090 16.16(15.61,16.74 13.75(12.78,14.80) 17.76(16.75,18.84) 1.04(1.02,1.05) <0.001 1.04(1.03,1.05) <0.001
Nervous system 456 2.38(2.17,2.62) 1.99(1.63,2.42) 2.84(2.44,3.30) 1.05(1.01,1.08) 0.007 1.05(1.01,1.08) 0.007
Urinary 670 3.50(3.25,3.78) 2.41(2.02,2.89) 3.64(3.19,4.16) 1.04(1.02,1.07) 0.002 1.04(1.01,1.07) 0.003
Digestive 304 1.59(1.42,1.78) 1.31(1.03,1.68) 1.83(1.52,2.21) 1.03(0.99,1.08) 0.101 1.03(0.99,1.08) 0.105
Limbs 460 2.41(2.19,2.64) 1.62(1.30,2.02) 4.09(3.61,4.63) 1.17(1.13,1.21) <0.001 1.17(1.13,1.21) <0.001
Heart 962 5.03(4.72,5.36) 4.87(4.29,5.51) 4.81(4.29,5.40) 1.00(0.98,1.02) 0.876 1.01(0.98,1.03) 0.619
Anomalies at birth
Chromosomal
All 238 1.25(1.09,1.42) 1.49(1.18,1.87) 1.16(0.91,1.46) 0.97(0.93,1.01) 0.160 0.96(0.92,1.00) 0.080
DS 139 0.73(0.61,0.86) 1.02(0.77,1.35) 0.66(0.48,0.90) 0.95(0.9 ,1.01) 0.098 0.95(0.89,1.01) 0.076
Non-chromosomal
All 2442 12.77(12.29,13.29) 10.72(9.86,11.65) 14.07(13.17,15.03) 1.04(1.03,1.06) <0.001 1.04(1.03,1.06) <0.001
Nervous system 166 0.87(0.74,1.01) 0.64(0.45,0.91) 1.17(0.92,1.48) 1.10(1.04,1.16) 0.001 1.10(1.04,1.16) 0.001
Urinary 564 2.95(2.71,3.21) 1.87(1.53,2.30) 3.11(2.70,3.59) 1.05(1.02,1.09) <0.001 1.05(1.02,1.09) <0.001
Digestive 276 1.44(1.28,1.63) 1.20(0.93,1.55) 1.65(1.36,2.01) 1.03(0.99,1.08) 0.115 1.03(0.99,1.08) 0.127
Limbs 360 1.88(1.70,2.09) 1.33(1.04,1.70) 3.23(2.80,3.71) 1.17(1.13,1.22) <0.001 1.17(1.13,1.22) <0.001
Heart 873 4.57(4.27,4.88) 4.73(4.17,5.37) 4.08(3.60,4.62) 0.98(0.96,1.01) 0.176 0.99(0.97,1.01) 0.340
* DS: Down’s Syndrome
Page 7 of 33
For peer review only - http://bmjopen.bmj.com/site/about/guidelines.xhtml
BMJ Open
123456789101112131415161718192021222324252627282930313233343536373839404142434445464748495051525354555657585960
on July 23, 2020 by guest. Protected by copyright. http://bmjopen.bmj.com/ BMJ Open: first published as 10.1136/bmjopen-2013-004244 on 3 March 2014. Downloaded from

For peer review only
8
DISCUSSION
During 1999-2008 the age of women at childbirth shifted towards later ages, and there
was an increase in diagnosed prevalences of chromosomal and non-chromosomal
anomalies in the Basque Country. Among non-chromosomal anomalies, the evolution
of prevalences is particular of each subgroup, with no common pattern.
Data used in this study come from the Registry of Neonatal Screening and Congenital
Anomalies of the Basque Country. The registry follows the EUROCAT project guides
and it was launched several years before the initial date of this project. As a
consequence, the data are highly reliable and have improved comparability with results
from other registries.[6] Surveillance of the evolution in time of congenital anomalies
conceivably allows detecting changes in risk that may occur locally or on a greater
scale. However, antenatal diagnosis leads to detect more non-viable cases that otherwise
would have been miscarriages and remained undiagnosed, and therefore, improvements
in quality and accessibility of diagnostic test can make the estimation of trends in
congenital anomalies rates more prone to bias than in other health outcomes. This is an
important issue to take into account when interpreting changes in rates of diagnosed
congenital anomalies.
Prevalence of chromosomal anomalies in the Basque Country are higher than the overall
estimated prevalence for Europe, 5.2‰ vs. 3.8‰ in all chromosomal anomalies, and
2.9‰ vs. 2.1‰ in the case of Down’s Syndrome.[2, 7] It is well known that older
mothers are at higher risk of chromosomal anomalies, and that risk increases
exponentially from the age of 30, not only for Down Syndrome, but also for other less
prevalent chromosomal syndromes, such as trisomies 13 and 18.[8] The high maternal
age of Basque mothers, in fact, at the top of the European ranking, can explain why
prevalences of chromosomal anomalies are higher in the Basque Country. Likewise, the
increase in maternal age from 1999 to 2008 would be the primary reason to explain the
observed positive trend in all chromosomal anomalies and Down’s syndrome
prevalences. Our findings support this view, as trends are no longer statistically
significant when adjusting for maternal age. A secondary explanation, both for trends
and for the differences with other European regions, may be differences in case
ascertainment derived from the increasingly frequent use of prenatal diagnoses in the
Basque Country, which, in turn, is partially provoked by the rise in maternal age.
Increases in prevalences of chromosomal anomalies have been also reported in other
European regions.[2]
Prevalences at birth of chromosomal anomalies show certain decreasing trend, which is
related to the extension and use of antenatal diagnosis and the decision that most of
women make after receiving a positive diagnosis. On average 80% of all chromosomal
anomalies were diagnosed antenatally, 74% in 1999-2001 and 85% in 2006-2008. In the
Basque Country, 90% of the women who received an antenatal diagnosis of
chromosomal anomaly decided to terminate the pregnancy. This proportion is similar to
that found in England and Wales where, as Morris et al reported, dramatic changes in
demography have been offset by improved antenatal diagnosis and have resulted in no
substantial changes in birth prevalences of Down’s syndrome.[9]
Page 8 of 33
For peer review only - http://bmjopen.bmj.com/site/about/guidelines.xhtml
BMJ Open
123456789101112131415161718192021222324252627282930313233343536373839404142434445464748495051525354555657585960
on July 23, 2020 by guest. Protected by copyright.
http://bmjopen.bm
j.com/
BM
J Open: first published as 10.1136/bm
jopen-2013-004244 on 3 March 2014. D
ownloaded from
For peer review only
9
The prevalence of non-chromosomal congenital anomalies in the Basque Country,
contrary to chromosomal anomalies, is lower than overall rates reported in Europe,
12.8‰ vs. 20.2‰.[2] By subgroups, those of nervous system, digestive and urinary
anomalies, with deviations smaller than 10%, can be considered similar to the overall
European rate; CHD rates are 20% lower in the Basque Country.
The relationship between maternal age and the prevalence of some subgroups of non-
chromosomal anomalies has been reported to be U-curves or J-curves, younger and
older mothers showing increased risk.[10-12] Our findings for total non-chromosomal
anomalies, with the lowest prevalence in mothers between 30 and 34 years, are in
agreement with this type of relationship. Loane et al performed a population based
prevalence study, covering a total of 1.75 million births form 2000 to 2004, and they
found teenage mothers to have the highest prevalence of all non-chromosomal
congenital anomalies.[13] The prevalence decreased as maternal age increased, until a
slight increase was observed in mothers 40-44 years of age and a further increase in
mothers above 45 years. They also reported that the maternal age pattern of risk differs
between countries, and concluded that, unlike chromosomal anomalies, it is not
biological age that is associated with risk of non-chromosomal congenital anomalies,
but reproductive, social, ethnic, exposure of lifestyle factors that have a different
relationship with maternal age in different countries. They concluded that the increase
of risk due to maternal age can be considered negligible, especially when compared to
chromosomal anomalies. Association of paternal age and risk of certain birth defects
has been reported for younger paternal ages, also with relatively low increases in risk as
age grows.[14]
All non-chromosomal anomalies increased during the study period, but this result needs
to be treated with caution. All non-chromosomal anomalies are a very broad and
heterogeneous group of anomalies with different aetiology that can hardly be related to
a common true change in risk. Besides, in two of the subgroups, limbs and urinary
anomalies, improvements in case ascertainment cannot be completely ruled out, as
prevalences before the observed sudden rise were clearly below the average prevalences
reported from other registries.
We did not find any change in CHD prevalences, which is in line with what has been
observed in Europe, where after an increase in the early 90s due to improvements in
echocardiographic investigations, rates have remained stable.[2, 15] Prevalences of
congenital anomalies of nervous and digestive systems show a slight steady increase
from 1999 to 2008. Decreasing trends in neural tube defects (NTD) have been reported
in some parts of Europe [2], but in others places no significant decrease has been found.
[16, 17] NTD risk has been associated with socioeconomic status. This has raised the
issue if periconceptual folic acid recommendations are being followed. Spanish data
about folic supplementation in pregnancies, coming from INMA project, point at
extensive compliance of recommendations in the 3rd month of pregnancy (94% of
women), lower compliance in the 2nd one (66% of women) and scarce preconceptual
compliance (19%), suggesting that folic supplementation in Spain is still an area of
improvement for NTD reductions.[18]
Difference between diagnosed anomalies and prevalences at birth are slight for
digestive, limbs and urinary anomalies, while is notable for the nervous system,
reflecting differences in severity and in the proportion of antenatal diagnosis, much
Page 9 of 33
For peer review only - http://bmjopen.bmj.com/site/about/guidelines.xhtml
BMJ Open
123456789101112131415161718192021222324252627282930313233343536373839404142434445464748495051525354555657585960
on July 23, 2020 by guest. Protected by copyright.
http://bmjopen.bm
j.com/
BM
J Open: first published as 10.1136/bm
jopen-2013-004244 on 3 March 2014. D
ownloaded from

For peer review only
10
more frequent for anomalies of the nervous system (in 82% of the diagnosed cases) than
in limbs (57%), digestive (28%) and urinary anomalies (22%).
Maintaining the surveillance of non-chromosomal anomalies is essential. It is necessary
to check if the observed trends continue or disappear in the following years, and
complementary data analysis are needed in order to assess if, associated or not with the
increasing trends, there is spatial clustering of cases that can share the same aetiology.
CONCLUSION
In the Basque Country chromosomal anomalies rates are high and continue to increase
slightly, which may be related to the rise in maternal age. Rates of non-chromosomal
anomalies are within the European frequent range of values, and the increases observed
in some of them need to be checked in the following years.
Page 10 of 33
For peer review only - http://bmjopen.bmj.com/site/about/guidelines.xhtml
BMJ Open
123456789101112131415161718192021222324252627282930313233343536373839404142434445464748495051525354555657585960
on July 23, 2020 by guest. Protected by copyright.
http://bmjopen.bm
j.com/
BM
J Open: first published as 10.1136/bm
jopen-2013-004244 on 3 March 2014. D
ownloaded from

For peer review only
11
FUNDING
This study was partially funded by Instituto de Salud Carlos III (FIS PI 08/1392)) of
The Spanish Ministry of Economy and Competitiveness
CONTRIBUTORSHIP STATEMENT
KC designed the project, checked the data, interpreted the results, and drafted and
revised the manuscript. BI participated in the study design, conducted the statistical
analysis, interpreted the results and reviewed the manuscript. FC, DU and IP
participated in the study design, collected the data, created the databases and reviewed
the manuscript. SE and IM took part in the study design and reviewed the manuscript.
CONFLICT OF INTERESTS
The authors declare that they have no conflict of interest.
DATA SHARING STATEMENT
No additional data
Page 11 of 33
For peer review only - http://bmjopen.bmj.com/site/about/guidelines.xhtml
BMJ Open
123456789101112131415161718192021222324252627282930313233343536373839404142434445464748495051525354555657585960
on July 23, 2020 by guest. Protected by copyright.
http://bmjopen.bm
j.com/
BM
J Open: first published as 10.1136/bm
jopen-2013-004244 on 3 March 2014. D
ownloaded from

For peer review only
12
REFERENCES
1. Boyd PA, Haeusler M, Barisic I, et al. Paper 1: The EUROCAT network--
organization and processes. Birth Defects Res A Clin Mol Teratol 2011;91 Suppl 1:S2-
15.
2. Loane M, Dolk H, Kelly A, et al. Paper 4: EUROCAT statistical monitoring:
identification and investigation of ten year trends of congenital anomalies in Europe.
Birth Defects Res A Clin Mol Teratol 2011;91 Suppl 1:S31-43.
3. EUROSTAT. Mean age of women at childbirth (code: tps00017). In:
http://goo.gl/8Lzfk. Accessed 4 Jun 2013
4. EUSTAT. Synthetic index of fecundity and average materity age according to
year.In: http://goo.gl/jlBXf. Accessed 4 Jun 2013
5. Savva GM, Morris JK, Mutton DE, et al. Maternal age-specific fetal loss rates in
Down syndrome pregnancies. Prenat Diagn 2006;26:499-504.
6. Loane M, Dolk H, Garne E, et al. Paper 3: EUROCAT data quality indicators for
population-based registries of congenital anomalies. Birth Defects Res A Clin Mol
Teratol 2011;91 Suppl 1:S23-30.
7. Khoshnood B, Greenlees R, Loane M, et al. Paper 2: EUROCAT public health
indicators for congenital anomalies in Europe. Birth Defects Res A Clin Mol Teratol
2011;91 Suppl 1:S16-22.
8. Savva GM, Walker K, Morris JK. The maternal age-specific live birth prevalence of
trisomies 13 and 18 compared to trisomy 21 (Down syndrome). Prenat Diagn
2010;30:57-64.
9. Morris JK, Alberman E. Trends in Down's syndrome live births and antenatal
diagnoses in England and Wales from 1989 to 2008: analysis of data from the National
Down Syndrome Cytogenetic Register. Bmj 2009;339:b3794.
10. Reefhuis J, Honein MA. Maternal age and non-chromosomal birth defects, Atlanta--
1968-2000: teenager or thirty-something, who is at risk? Birth Defects Res A Clin Mol
Teratol 2004;70:572-9.
11. Ooki S. Maternal age and birth defects after the use of assisted reproductive
technology in Japan, 2004-2010. Int J Womens Health 2013;5:65-77.
12. Gill SK, Broussard C, Devine O, et al. Association between maternal age and birth
defects of unknown etiology: United States, 1997-2007. Birth Defects Res A Clin Mol
Teratol 2012;94:1010-8.
13. Loane M, Dolk H, Morris JK. Maternal age-specific risk of non-chromosomal
anomalies. Bjog 2009;116:1111-9.
14. Green RF, Devine O, Crider KS, et al. Association of paternal age and risk for major
congenital anomalies from the National Birth Defects Prevention Study, 1997 to 2004.
Ann Epidemiol 2010;20:241-9.
15. Oyen N, Poulsen G, Boyd HA, et al. National time trends in congenital heart
defects, Denmark, 1977-2005. Am Heart J 2009;157:467-73 e1.
16. Poretti A, Anheier T, Zimmermann R, et al. Neural tube defects in Switzerland from
2001 to 2007: are periconceptual folic acid recommendations being followed? Swiss
Med Wkly 2008;138:608-13.
Page 12 of 33
For peer review only - http://bmjopen.bmj.com/site/about/guidelines.xhtml
BMJ Open
123456789101112131415161718192021222324252627282930313233343536373839404142434445464748495051525354555657585960
on July 23, 2020 by guest. Protected by copyright.
http://bmjopen.bm
j.com/
BM
J Open: first published as 10.1136/bm
jopen-2013-004244 on 3 March 2014. D
ownloaded from
For peer review only
13
17. Abeywardana S, Bower C, Halliday J, et al. Prevalence of neural tube defects in
Australia prior to mandatory fortification of bread-making flour with folic acid. Aust N
Z J Public Health 2010;34:351-5.
18. Sanfélix-Gimeno G FI, Librero J, Peiró S. Caracterization of folate supplementation
in pregnancy, based on a combination of health information systems. Gac Sanit
2012;26:7.
Page 13 of 33
For peer review only - http://bmjopen.bmj.com/site/about/guidelines.xhtml
BMJ Open
123456789101112131415161718192021222324252627282930313233343536373839404142434445464748495051525354555657585960
on July 23, 2020 by guest. Protected by copyright.
http://bmjopen.bm
j.com/
BM
J Open: first published as 10.1136/bm
jopen-2013-004244 on 3 March 2014. D
ownloaded from

For peer review only
14
Fig 1. Age of women at childbirth and at diagnosis of a chromosomal anomaly in the
Basque Country (Spain), in 1999-2001 and 2006-2008
Fig 2. Estimated prevalences in each calendar year (error bars) and GAM fits (lines) of
chromosomal congenital anomalies in the Basque Country (Spain), from 1999 to 2008
Fig 3. Estimated prevalences in each calendar year (error bars) and GAM fits (lines) of
non-chromosomal congenital anomalies in the Basque Country (Spain), from 1999 to
2008.
Page 14 of 33
For peer review only - http://bmjopen.bmj.com/site/about/guidelines.xhtml
BMJ Open
123456789101112131415161718192021222324252627282930313233343536373839404142434445464748495051525354555657585960
on July 23, 2020 by guest. Protected by copyright.
http://bmjopen.bm
j.com/
BM
J Open: first published as 10.1136/bm
jopen-2013-004244 on 3 March 2014. D
ownloaded from

For peer review only
1
TRENDS IN THE PREVALENCES OF CONGENITAL ANOMALIES AND AGE AT
MOTHERHOOD IN A SOUTHERN EUROPEAN REGION
List of authors:
Cambra K(1), Ibañez B(1), Urzelai D(2), Portillo I(3), Montoya I(2), Esnaola S(2),
Cirarda FB(2)
(1) Navarrabiomed-Fundación Miguel Servet- Red de Investigación en Servicios de
Salud en Enfermedades Crónicas (REDISSEC). Pamplona, Spain
(2) Departamento de Salud. Gobierno Vasco. Vitoria, Spain
(3) Osakidetza- Servicio Vasco de Salud. Vitoria, Spain
Corresponding author:
Koldo Cambra
Navarrabiomed-Fundación Miguel Servet
Complejo Hospitalario de Navarra
C/ Irunlarrea s/n
31008 Pamplona. Spain
Tfno: 34 848428292
Fax: 34 848422200
e-mail: [email protected]
KEYWORDS:
Congenital anomalies, trends, maternal age, chromosomal anomalies, birth defects
Word count: 2836
Page 15 of 33
For peer review only - http://bmjopen.bmj.com/site/about/guidelines.xhtml
BMJ Open
123456789101112131415161718192021222324252627282930313233343536373839404142434445464748495051525354555657585960
on July 23, 2020 by guest. Protected by copyright.
http://bmjopen.bm
j.com/
BM
J Open: first published as 10.1136/bm
jopen-2013-004244 on 3 March 2014. D
ownloaded from
For peer review only
2
Abstract
Objectives. To estimate the prevalences of the main groups of congenital anomalies
and to assess their trend over time.
Design. Population-based study of prevalences.
Setting. The Basque Country, Spain.
Partipants. All births and all congenital anomalies diagnosed prenatally, at birth or
during the first year of age, in all hospitals of the country, from 1999 to 2008.
Main outcomes measures. Total diagnosed prevalences and prevalences at birth of all
chromosomal and non-chromosomal anomalies, Down’s syndrome, anomalies of the
nervous system, urinary, limbs, digestive system and congenital heart defects.
Results. Mean age (SD) of women at childbirth and the proportion of them over 35
years and over 40 years shifted from 32.1(4.5) years, 18.3% and 1.4% in 1999-2001, to
32.3(4.7) years, 23.9% and 2.9% in 2006-2008.
Between 1999 and 2008, 991 cases of chromosomal anomalies and 3090 of non-
chromosomal anomalies were diagnosed, which yields, respectively, total prevalences
of 5.2‰ and of 16.2‰. Among chromosomal anomalies Down’s syndrome is the most
frequent (2.9‰). With marginal statistical significance, the results point at an increasing
trend in total diagnosed chromosomal anomalies, but a decreasing one in prevalences at
birth. Among non-chromosomal congenital anomalies, congenital heart defects are the
most frequent (5.2‰). Rates of all non-chromosomal, urinary and limb anomalies grew
during the study period, whereas those of congenital heart defects and anomalies of the
digestive system did not change significantly.
Conclusion. In the Basque Country, rates of chromosomal anomalies are higher than
the overall estimated prevalence in European Countries, and continue to increase
slightly, which may be related to the rise in maternal age. Rates of non-chromosomal
anomalies are within the European frequent range of values, and the increases observed
need to be checked in the following years.
Article summary
Strengths and limitations of the study
� This study analyses the trend over time of the prevalences of congenital
anomalies using highly reliable data from population-based registries.
� The study provides insight into the occurring changes in maternal age, the extent
of the use of antenatal diagnosis and its impact on the prevalences of congenital
anomalies at birth.
� Improvements in quality and accessibility of diagnostic tests can lead to an
apparent increase in prevalences.
Page 16 of 33
For peer review only - http://bmjopen.bmj.com/site/about/guidelines.xhtml
BMJ Open
123456789101112131415161718192021222324252627282930313233343536373839404142434445464748495051525354555657585960
on July 23, 2020 by guest. Protected by copyright.
http://bmjopen.bm
j.com/
BM
J Open: first published as 10.1136/bm
jopen-2013-004244 on 3 March 2014. D
ownloaded from

For peer review only
3
INTRODUCTION
Congenital anomalies affect around 2% of births in Europe.[1] They account for a great
part of neonatal mortality and morbidity, and may be an important source of distress for
parents and families. In the majority of cases the aetiology of congenital anomalies
remains unknown. Some increasing trends have been detected by EUROCAT in the
Pan-Europe analysis for several congenital anomalies such as hypospadias, abdominal
wall anomalies, gastroschisis, trisomy 18 and renal dysplasia.[2] Local trends have been
more frequently detected but, in general, they need further verification.
Women’s age at childbirth has been on the rise in all European countries included in
Eurostat during the last decades. From 2001 to 2008 the average maternal age in EU-17
inched up from 29.5 to 30.3 years, but geographical differences remained important,
with greater values in West Europe and differences between countries of up to 5 years.
Spain, in the fifth position of the European ranking of 2008, with a mean age of women
at childbirth of 30.8 years, climbed to the top in 2011 with a mean of 31.5 years.[3]
Changes in demographics and in the perception of risks, along with a generalized
extension and improvement of antenatal diagnosis, have increased (in Spain and other
countries) the public awareness on reproductive health issues. Improvements in
antenatal diagnosis as well as in case registrations allow for more reliable population-
based studies on congenital anomalies.
The Basque Country is an industrialized, urban type community, situated in north Spain,
with around 2.2 million inhabitants. Demographic changes in the last decades have been
dramatic, greater than in other Spanish regions. The synthetic index of fecundity (an
estimation of the number of children a hypothetical woman would have at the end of her
fertile life if her fecundity corresponded to the age-specific fecundity rates of the
population) fell from 2.67 in 1975 to 1.24 in 1985, 0.97 in 1990 and 1.03 in 2000, while
the average of maternity age rose from 28.6, to 29.1, 30.0, 31.3 and 32.4 years in the
same calendar years.[4] Medical care and antenatal diagnosis are widely available to all
pregnant women, and they are provided by the Basque Health Service to the entire
population.
The detection of trends is an essential component of epidemiological surveillance of
congenital anomalies, valuable for care and genetic advice planning and also for
warning of environmental risk factors. Its interest actually grows in places where
changes in reproductive health determinants may be occurring.
This report analyses the evolution of maternal age and prevalences of congenital
anomalies in a ten year period in the Basque Country, focusing on total and on specific
subgroups of chromosomal and non-chromosomal anomalies.
METHODS
The study period was 1999-2008. We used data from the population based Registry of
Neonatal Screening and Congenital Anomalies of the Basque Country, integrated in
EUROCAT project and operating since the early 1990s. All anomalies diagnosed
prenatally, at birth or during the first year of age, in all hospitals of the country are
Page 17 of 33
For peer review only - http://bmjopen.bmj.com/site/about/guidelines.xhtml
BMJ Open
123456789101112131415161718192021222324252627282930313233343536373839404142434445464748495051525354555657585960
on July 23, 2020 by guest. Protected by copyright.
http://bmjopen.bm
j.com/
BM
J Open: first published as 10.1136/bm
jopen-2013-004244 on 3 March 2014. D
ownloaded from

For peer review only
4
included. The registry covers affected live births, foetal births with gestational age 22
weeks or greater, and terminations of pregnancy for foetal anomaly following prenatal
diagnosis. The staff of the Registry routinely check Hospital Discharge Databases and
the Registry of Terminations of Pregnancies searching for new cases, review medical
reports of prenatal diagnosis (sonography, genetic test and pathology) and code all
congenital anomalies.
We estimated the prevalences and 95% confidence intervals (CI) related to mothers with
residence in the Basque Country, of total chromosomal anomalies (ICD-10, Q90-93,
Q96-99), total non-chromosomal anomalies (Q chapter excluding chromosomal
anomalies, D215, D821, D1810, P350, P351, P371) and of the following subgroups:
anomalies of the nervous system (Q00-07), urinary (Q60-64, Q794), limbs (Q65-74),
digestive system (Q38-Q45, Q790), congenital heart defects (CHD)(Q20-26), and
Down (Q90), Patau (Q914-917), Edward (Q910-913), Turner (Q96) and Klinefelter’s
(Q980-984) syndromes. Other major organ subgroups of non-chromosomal anomalies
were not included in the analysis because their average prevalences, lower than one case
per 1000 births, are too low to be assessed on a yearly basis. The cases with several
non-chromosomal anomalies count as one case for calculating total or subgroup
prevalences, but they can be assigned to more than one subgroup. More details about
the anomalies included in each subgroup can be found elsewhere.[1] We estimated total
prevalence rates (congenital anomalies in liveborns, foetal deaths and induced abortions
divided by the total number of births) and prevalence rates at birth (congenital
anomalies in liveborns and foetal deaths divided by the total number of births). Data
related to denominators (number of births per year, place of residence and age of the
mother) were obtained from the Registry of Newborns of the Basque Country.
To explore the functional relationship between prevalences and time, we fitted
Generalized Additive Models (GAM), as they are flexible unrestricted models that can
properly reflect the true relationship between the variables. We included the annual
number of cases as a Poisson response variable, the number of births (live and still) as
the offset, and the calendar year as independent variable using thin plate regression
splines. To further assess time trends, we fitted binomial regression models using a
logarithmic link function, including the same former variables and adding as
explanatory variable maternal age group (under 30, 30-34, 35-39 and over 40 years).
Also, we used these age groups to conduct complementary age-stratified analyses for
chromosomal anomalies.
In the case of Down’s Syndrome, we also tested trends in the estimated prevalence at
birth that would have occurred in the absence of antenatal diagnosis (and subsequent
terminations), using for that diagnosed prevalences adjusted for the natural foetal loss
risks reported by Savva.[5] Adjusting for natural foetal losses is aimed at controlling the
potential bias in the estimation of time trends in periods in which there is an increase in
the number of prenatal diagnoses and, consequently, in the number of cases diagnosed
prenatally that would not have survived to term and remained undiagnosed in absence
of prenatal diagnosis.
This study was approved by the Clinical Research Ethics Committee of the Basque
Country.
Page 18 of 33
For peer review only - http://bmjopen.bmj.com/site/about/guidelines.xhtml
BMJ Open
123456789101112131415161718192021222324252627282930313233343536373839404142434445464748495051525354555657585960
on July 23, 2020 by guest. Protected by copyright.
http://bmjopen.bm
j.com/
BM
J Open: first published as 10.1136/bm
jopen-2013-004244 on 3 March 2014. D
ownloaded from

For peer review only
5
RESULTS
The total number of births in the 1999-2008 period was 191,171, rising from 51,771 in
the 1999-2001 period to 62,329 in 2006-2008. Concurrently, age of motherhood
increased (Fig 1). Mean age of women at childbirth and the proportion of them over 35
years shifted from 32.1 years and 18.3% in 1999-2001 to 32.3 years and 23.9% in 2006-
2008 (Table 1). This shift is greater among chromosomal anomalies cases, with an
increase of 0.7 years in the mean age and an increase of 9% in the proportion of mothers
above 35 years. Among non-chromosomal anomalies cases, maternal age indicators are
similar to those of all births.
Table1. Mean age of women at childbirth and proportion of them above 35 and 40
years, in all births and in cases of congenital anomalies of the Basque Country, in 1999-
2001 and 2006-2008
1999-2001 2006-2008
Mean(SD) >35 y >40 y Mean (SD) >35 y >40 y
All births 32.1(4.5) 18.3% 1.4% 32.3(4.7) 23.9% 2.9%
Chromosomal CA* 34.6(4.5) 42.6% 7.4% 35.3(5.0) 51.5% 12.0%
Non-chromosomal CA* 32.1(4.6) 21.1% 3.6% 32.3(5.1) 27.2% 3.2%
*CA: Congenital Anomalies
Between 1999 and 2008, 991 cases of chromosomal anomalies and 3090 of non-
chromosomal anomalies were diagnosed, which yields, respectively, prevalences of
5.18 and 16.16 per 1000 births (Table 2). Diagnosis was antenatal in 83% of
chromosomal and in 43% of non-chromosomal anomalies.
Among chromosomal anomalies, Down’s Syndrome (DS) is the most frequent,
accounting for 55% of all diagnosed chromosomal anomalies. The total prevalence of
DS is 2.87‰, the estimated prevalence at birth adjusted for natural foetal losses is
2.27‰, and the actual prevalence of DS at birth is 0.73‰. Other chromosomal
syndromes are much less frequent. From 1999 to 2008 Edward syndromes diagnosed
were 121, Turner syndromes 81, Klinefelter 52 and Patau 42, resulting respectively in
0.63 (IC95%:0.52, 0.75), 0.42 (IC95%:0.33, 0.52), 0.27 (IC95%:0.20, 0.35) and 0.22
(IC95%:0.15, 0.29) diagnosed cases per 1000 births.
The results point at certain increasing trend in total chromosomal anomalies and certain
decreasing trend in prevalences at birth (Table 2 and Fig 2). For Down’s Syndrome, we
found, with marginal statistical significance, annual relative increases in the total
prevalence of around 3% (p=0.079) and annual relative reductions of 5% in the
prevalence at birth (p=0.098). When adjusting regression models for maternal age,
increasing trend in diagnosed chromosomal anomalies disappear but decreasing trends
in prevalences at birth remain unchanged, both for all chromosomal anomalies and for
DS. In the age-stratified analysis, the decreasing trend in the prevalence of
chromosomal anomalies at birth is more clearly observed in women between 30 and 34
years (p=0.031). Maternal age is strongly associated with the prevalence of
chromosomal anomalies (p<0.001), with prevalence rates 1.3, 3.2 and 8.3 times greater
in women of 30-34, 35-39 and over 40 years than in women under 30 years,
respectively.
Page 19 of 33
For peer review only - http://bmjopen.bmj.com/site/about/guidelines.xhtml
BMJ Open
123456789101112131415161718192021222324252627282930313233343536373839404142434445464748495051525354555657585960
on July 23, 2020 by guest. Protected by copyright.
http://bmjopen.bm
j.com/
BM
J Open: first published as 10.1136/bm
jopen-2013-004244 on 3 March 2014. D
ownloaded from
For peer review only
6
Among non-chromosomal anomalies, CHD are the most frequent (5.0‰), followed by
urinary (3.5‰), nervous system (2.4‰) and limb anomalies (2.4‰). Prevalences at
birth are around 80% of total diagnosed prevalences, with the exception of the subgroup
of nervous system anomalies, for which the prevalence at birth (0.9‰) is a third of the
total diagnosed one.
Prevalences of all non-chromosomal, urinary and limb anomalies grew during the study
period with different time patterns (Fig 3). Deviations from linearity are negligible in all
studied subgroups of anomalies, except for the urinary subgroup, which increased
between 1999 to 2003 and then plateaued, and for limb anomalies which sharply
mounted from 2004 to 2008. The estimated annual relative increment of prevalence
rates of all non-chromosomal anomalies is 3% and that of nervous system anomalies
5%. When models are adjusted for maternal age, trend estimates and statistical
significances remain unchanged (Table 2). With respect to mothers under 30 years,
prevalence rates of all non-chromosomal anomalies were 0.93 (IC95%:0.85, 1.02) for
mothers between 30 and 34, 1.0 (IC95%:0.90, 1.10) for mothers between 35 and 39, and
1.30 (IC95%:1.06, 1.51) for those over 40.
Page 20 of 33
For peer review only - http://bmjopen.bmj.com/site/about/guidelines.xhtml
BMJ Open
123456789101112131415161718192021222324252627282930313233343536373839404142434445464748495051525354555657585960
on July 23, 2020 by guest. Protected by copyright.
http://bmjopen.bm
j.com/
BM
J Open: first published as 10.1136/bm
jopen-2013-004244 on 3 March 2014. D
ownloaded from
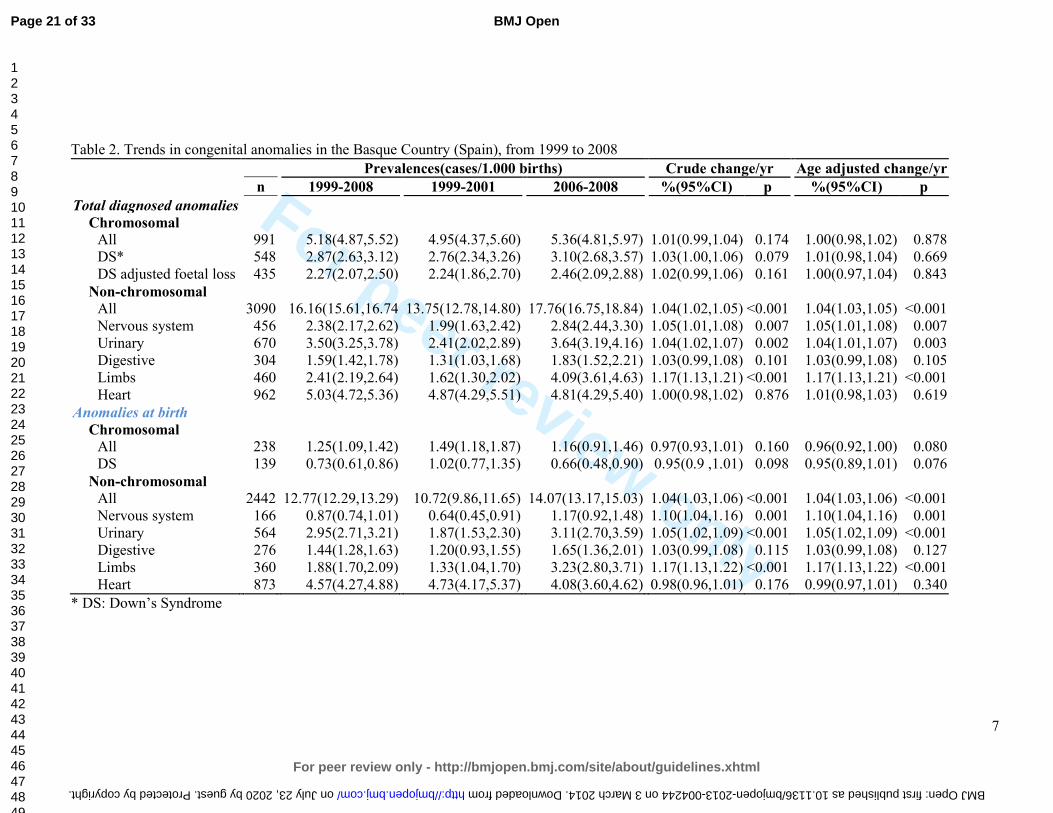
For peer review only
7
Table 2. Trends in congenital anomalies in the Basque Country (Spain), from 1999 to 2008
Prevalences(cases/1.000 births) Crude change/yr Age adjusted change/yr
n 1999-2008 1999-2001 2006-2008 %(95%CI) p %(95%CI) p
Total diagnosed anomalies
Chromosomal
All 991 5.18(4.87,5.52) 4.95(4.37,5.60) 5.36(4.81,5.97) 1.01(0.99,1.04) 0.174 1.00(0.98,1.02) 0.878
DS* 548 2.87(2.63,3.12) 2.76(2.34,3.26) 3.10(2.68,3.57) 1.03(1.00,1.06) 0.079 1.01(0.98,1.04) 0.669
DS adjusted foetal loss 435 2.27(2.07,2.50) 2.24(1.86,2.70) 2.46(2.09,2.88) 1.02(0.99,1.06) 0.161 1.00(0.97,1.04) 0.843
Non-chromosomal
All 3090 16.16(15.61,16.74 13.75(12.78,14.80) 17.76(16.75,18.84) 1.04(1.02,1.05) <0.001 1.04(1.03,1.05) <0.001
Nervous system 456 2.38(2.17,2.62) 1.99(1.63,2.42) 2.84(2.44,3.30) 1.05(1.01,1.08) 0.007 1.05(1.01,1.08) 0.007
Urinary 670 3.50(3.25,3.78) 2.41(2.02,2.89) 3.64(3.19,4.16) 1.04(1.02,1.07) 0.002 1.04(1.01,1.07) 0.003
Digestive 304 1.59(1.42,1.78) 1.31(1.03,1.68) 1.83(1.52,2.21) 1.03(0.99,1.08) 0.101 1.03(0.99,1.08) 0.105
Limbs 460 2.41(2.19,2.64) 1.62(1.30,2.02) 4.09(3.61,4.63) 1.17(1.13,1.21) <0.001 1.17(1.13,1.21) <0.001
Heart 962 5.03(4.72,5.36) 4.87(4.29,5.51) 4.81(4.29,5.40) 1.00(0.98,1.02) 0.876 1.01(0.98,1.03) 0.619
Anomalies at birth
Chromosomal
All 238 1.25(1.09,1.42) 1.49(1.18,1.87) 1.16(0.91,1.46) 0.97(0.93,1.01) 0.160 0.96(0.92,1.00) 0.080
DS 139 0.73(0.61,0.86) 1.02(0.77,1.35) 0.66(0.48,0.90) 0.95(0.9 ,1.01) 0.098 0.95(0.89,1.01) 0.076
Non-chromosomal
All 2442 12.77(12.29,13.29) 10.72(9.86,11.65) 14.07(13.17,15.03) 1.04(1.03,1.06) <0.001 1.04(1.03,1.06) <0.001
Nervous system 166 0.87(0.74,1.01) 0.64(0.45,0.91) 1.17(0.92,1.48) 1.10(1.04,1.16) 0.001 1.10(1.04,1.16) 0.001
Urinary 564 2.95(2.71,3.21) 1.87(1.53,2.30) 3.11(2.70,3.59) 1.05(1.02,1.09) <0.001 1.05(1.02,1.09) <0.001
Digestive 276 1.44(1.28,1.63) 1.20(0.93,1.55) 1.65(1.36,2.01) 1.03(0.99,1.08) 0.115 1.03(0.99,1.08) 0.127
Limbs 360 1.88(1.70,2.09) 1.33(1.04,1.70) 3.23(2.80,3.71) 1.17(1.13,1.22) <0.001 1.17(1.13,1.22) <0.001
Heart 873 4.57(4.27,4.88) 4.73(4.17,5.37) 4.08(3.60,4.62) 0.98(0.96,1.01) 0.176 0.99(0.97,1.01) 0.340
* DS: Down’s Syndrome
Page 21 of 33
For peer review only - http://bmjopen.bmj.com/site/about/guidelines.xhtml
BMJ Open
123456789101112131415161718192021222324252627282930313233343536373839404142434445464748495051525354555657585960
on July 23, 2020 by guest. Protected by copyright. http://bmjopen.bmj.com/ BMJ Open: first published as 10.1136/bmjopen-2013-004244 on 3 March 2014. Downloaded from
For peer review only
8
DISCUSSION
During 1999-2008 the age of women at childbirth shifted towards later ages, and there
was an increase in diagnosed prevalences of chromosomal and non-chromosomal
anomalies in the Basque Country. Among non-chromosomal anomalies, the evolution
of prevalences is particular of each subgroup, with no common pattern.
Data used in this study come from the Registry of Neonatal Screening and Congenital
Anomalies of the Basque Country. The registry follows the EUROCAT project guides
and it was launched several years before the initial date of this project. As a
consequence, the data are highly reliable and have improved comparability with results
from other registries.[6] Surveillance of the evolution in time of congenital anomalies
conceivably allows detecting changes in risk that may occur locally or on a greater
scale. However, antenatal diagnosis leads to detect more non-viable cases that otherwise
would have been miscarriages and remained undiagnosed, and therefore, improvements
in quality and accessibility of diagnostic test can make the estimation of trends in
congenital anomalies rates more prone to bias than in other health outcomes. This is an
important issue to take into account when interpreting changes in rates of diagnosed
congenital anomalies.
Prevalence of chromosomal anomalies in the Basque Country are higher than the overall
estimated prevalence for Europe, 5.2‰ vs. 3.8‰ in all chromosomal anomalies, and
2.9‰ vs. 2.1‰ in the case of Down’s Syndrome.[2, 7] It is well known that older
mothers are at higher risk of chromosomal anomalies, and that risk increases
exponentially from the age of 30, not only for Down Syndrome, but also for other less
prevalent chromosomal syndromes, such as trisomies 13 and 18.[8] The high maternal
age of Basque mothers, in fact, at the top of the European ranking, can explain why
prevalences of chromosomal anomalies are higher in the Basque Country. Likewise, the
increase in maternal age from 1999 to 2008 would be the primary reason to explain the
observed positive trend in all chromosomal anomalies and Down’s syndrome
prevalences. Our findings support this view, as trends are no longer statistically
significant when adjusting for maternal age. A secondary explanation, both for trends
and for the differences with other European regions, may be differences in case
ascertainment derived from the increasingly frequent use of prenatal diagnoses in the
Basque Country, which, in turn, is partially provoked by the rise in maternal age.
Increases in prevalences of chromosomal anomalies have been also reported in other
European regions.[2]
Prevalences at birth of chromosomal anomalies show certain decreasing trend, which is
related to the extension and use of antenatal diagnosis and the decision that most of
women make after receiving a positive diagnosis. On average 80% of all chromosomal
anomalies were diagnosed antenatally, 74% in 1999-2001 and 85% in 2006-2008. In the
Basque Country, 90% of the women who received an antenatal diagnosis of
chromosomal anomaly decided to terminate the pregnancy. This proportion is similar to
that found in England and Wales where, as Morris et al reported, dramatic changes in
demography have been offset by improved antenatal diagnosis and have resulted in no
substantial changes in birth prevalences of Down’s syndrome.[9]
Page 22 of 33
For peer review only - http://bmjopen.bmj.com/site/about/guidelines.xhtml
BMJ Open
123456789101112131415161718192021222324252627282930313233343536373839404142434445464748495051525354555657585960
on July 23, 2020 by guest. Protected by copyright.
http://bmjopen.bm
j.com/
BM
J Open: first published as 10.1136/bm
jopen-2013-004244 on 3 March 2014. D
ownloaded from

For peer review only
9
The prevalence of non-chromosomal congenital anomalies in the Basque Country,
contrary to chromosomal anomalies, is lower than overall rates reported in Europe,
12.8‰ vs. 20.2‰.[2] By subgroups, those of nervous system, digestive and urinary
anomalies, with deviations smaller than 10%, can be considered similar to the overall
European rate; CHD rates are 20% lower in the Basque Country.
The relationship between maternal age and the prevalence of some subgroups of non-
chromosomal anomalies has been reported to be U-curves or J-curves, younger and
older mothers showing increased risk.[10-12] Our findings for total non-chromosomal
anomalies, with the lowest prevalence in mothers between 30 and 34 years, are in
agreement with this type of relationship. Loane et al performed a population based
prevalence study, covering a total of 1.75 million births form 2000 to 2004, and they
found teenage mothers to have the highest prevalence of all non-chromosomal
congenital anomalies.[13] The prevalence decreased as maternal age increased, until a
slight increase was observed in mothers 40-44 years of age and a further increase in
mothers above 45 years. They also reported that the maternal age pattern of risk differs
between countries, and concluded that, unlike chromosomal anomalies, it is not
biological age that is associated with risk of non-chromosomal congenital anomalies,
but reproductive, social, ethnic, exposure of lifestyle factors that have a different
relationship with maternal age in different countries. They concluded that the increase
of risk due to maternal age can be considered negligible, especially when compared to
chromosomal anomalies. Association of paternal age and risk of certain birth defects
has been reported for younger paternal ages, also with relatively low increases in risk as
age grows.[14]
All non-chromosomal anomalies increased during the study period, but this result needs
to be treated with caution. All non-chromosomal anomalies are a very broad and
heterogeneous group of anomalies with different aetiology that can hardly be related to
a common true change in risk. Besides, in two of the subgroups, limbs and urinary
anomalies, improvements in case ascertainment cannot be completely ruled out, as
prevalences before the observed sudden rise were clearly below the average prevalences
reported from other registries.
We did not find any change in CHD prevalences, which is in line with what has been
observed in Europe, where after an increase in the early 90s due to improvements in
echocardiographic investigations, rates have remained stable.[2, 15] Prevalences of
congenital anomalies of nervous and digestive systems show a slight steady increase
from 1999 to 2008. Decreasing trends in neural tube defects (NTD) have been reported
in some parts of Europe [2], but in others places no significant decrease has been found.
[16, 17] NTD risk has been associated with socioeconomic status. This has raised the
issue if periconceptual folic acid recommendations are being followed. Spanish data
about folic supplementation in pregnancies, coming from INMA project, point at
extensive compliance of recommendations in the 3rd month of pregnancy (94% of
women), lower compliance in the 2nd one (66% of women) and scarce preconceptual
compliance (19%), suggesting that folic supplementation in Spain is still an area of
improvement for NTD reductions.[18]
Difference between diagnosed anomalies and prevalences at birth are slight for
digestive, limbs and urinary anomalies, while is notable for the nervous system,
reflecting differences in severity and in the proportion of antenatal diagnosis, much
Page 23 of 33
For peer review only - http://bmjopen.bmj.com/site/about/guidelines.xhtml
BMJ Open
123456789101112131415161718192021222324252627282930313233343536373839404142434445464748495051525354555657585960
on July 23, 2020 by guest. Protected by copyright.
http://bmjopen.bm
j.com/
BM
J Open: first published as 10.1136/bm
jopen-2013-004244 on 3 March 2014. D
ownloaded from

For peer review only
10
more frequent for anomalies of the nervous system (in 82% of the diagnosed cases) than
in limbs (57%), digestive (28%) and urinary anomalies (22%).
Maintaining the surveillance of non-chromosomal anomalies is essential. It is necessary
to check if the observed trends continue or disappear in the following years, and
complementary data analysis are needed in order to assess if, associated or not with the
increasing trends, there is spatial clustering of cases that can share the same aetiology.
CONCLUSION
In the Basque Country chromosomal anomalies rates are high and continue to increase
slightly, which may be related to the rise in maternal age. Rates of non-chromosomal
anomalies are within the European frequent range of values, and the increases observed
in some of them need to be checked in the following years.
Page 24 of 33
For peer review only - http://bmjopen.bmj.com/site/about/guidelines.xhtml
BMJ Open
123456789101112131415161718192021222324252627282930313233343536373839404142434445464748495051525354555657585960
on July 23, 2020 by guest. Protected by copyright.
http://bmjopen.bm
j.com/
BM
J Open: first published as 10.1136/bm
jopen-2013-004244 on 3 March 2014. D
ownloaded from

For peer review only
11
FUNDING
This study was partially funded by Instituto de Salud Carlos III (FIS PI 08/1392)) of
The Spanish Ministry of Economy and Competitiveness
CONFLICT OF INTERESTS
The authors declare that they have no conflict of interest.
Page 25 of 33
For peer review only - http://bmjopen.bmj.com/site/about/guidelines.xhtml
BMJ Open
123456789101112131415161718192021222324252627282930313233343536373839404142434445464748495051525354555657585960
on July 23, 2020 by guest. Protected by copyright.
http://bmjopen.bm
j.com/
BM
J Open: first published as 10.1136/bm
jopen-2013-004244 on 3 March 2014. D
ownloaded from

For peer review only
12
REFERENCES
1. Boyd PA, Haeusler M, Barisic I, et al. Paper 1: The EUROCAT network--
organization and processes. Birth Defects Res A Clin Mol Teratol 2011;91 Suppl 1:S2-
15.
2. Loane M, Dolk H, Kelly A, et al. Paper 4: EUROCAT statistical monitoring:
identification and investigation of ten year trends of congenital anomalies in Europe.
Birth Defects Res A Clin Mol Teratol 2011;91 Suppl 1:S31-43.
3. EUROSTAT. Mean age of women at childbirth (code: tps00017). In:
http://goo.gl/8Lzfk. Accessed 4 Jun 2013
4. EUSTAT. Synthetic index of fecundity and average materity age according to
year.In: http://goo.gl/jlBXf. Accessed 4 Jun 2013
5. Savva GM, Morris JK, Mutton DE, et al. Maternal age-specific fetal loss rates in
Down syndrome pregnancies. Prenat Diagn 2006;26:499-504.
6. Loane M, Dolk H, Garne E, et al. Paper 3: EUROCAT data quality indicators for
population-based registries of congenital anomalies. Birth Defects Res A Clin Mol
Teratol 2011;91 Suppl 1:S23-30.
7. Khoshnood B, Greenlees R, Loane M, et al. Paper 2: EUROCAT public health
indicators for congenital anomalies in Europe. Birth Defects Res A Clin Mol Teratol
2011;91 Suppl 1:S16-22.
8. Savva GM, Walker K, Morris JK. The maternal age-specific live birth prevalence of
trisomies 13 and 18 compared to trisomy 21 (Down syndrome). Prenat Diagn
2010;30:57-64.
9. Morris JK, Alberman E. Trends in Down's syndrome live births and antenatal
diagnoses in England and Wales from 1989 to 2008: analysis of data from the National
Down Syndrome Cytogenetic Register. Bmj 2009;339:b3794.
10. Reefhuis J, Honein MA. Maternal age and non-chromosomal birth defects, Atlanta--
1968-2000: teenager or thirty-something, who is at risk? Birth Defects Res A Clin Mol
Teratol 2004;70:572-9.
11. Ooki S. Maternal age and birth defects after the use of assisted reproductive
technology in Japan, 2004-2010. Int J Womens Health 2013;5:65-77.
12. Gill SK, Broussard C, Devine O, et al. Association between maternal age and birth
defects of unknown etiology: United States, 1997-2007. Birth Defects Res A Clin Mol
Teratol 2012;94:1010-8.
13. Loane M, Dolk H, Morris JK. Maternal age-specific risk of non-chromosomal
anomalies. Bjog 2009;116:1111-9.
14. Green RF, Devine O, Crider KS, et al. Association of paternal age and risk for major
congenital anomalies from the National Birth Defects Prevention Study, 1997 to 2004.
Ann Epidemiol 2010;20:241-9.
15. Oyen N, Poulsen G, Boyd HA, et al. National time trends in congenital heart
defects, Denmark, 1977-2005. Am Heart J 2009;157:467-73 e1.
16. Poretti A, Anheier T, Zimmermann R, et al. Neural tube defects in Switzerland from
2001 to 2007: are periconceptual folic acid recommendations being followed? Swiss
Med Wkly 2008;138:608-13.
Page 26 of 33
For peer review only - http://bmjopen.bmj.com/site/about/guidelines.xhtml
BMJ Open
123456789101112131415161718192021222324252627282930313233343536373839404142434445464748495051525354555657585960
on July 23, 2020 by guest. Protected by copyright.
http://bmjopen.bm
j.com/
BM
J Open: first published as 10.1136/bm
jopen-2013-004244 on 3 March 2014. D
ownloaded from

For peer review only
13
17. Abeywardana S, Bower C, Halliday J, et al. Prevalence of neural tube defects in
Australia prior to mandatory fortification of bread-making flour with folic acid. Aust N
Z J Public Health 2010;34:351-5.
18. Sanfélix-Gimeno G FI, Librero J, Peiró S. Caracterization of folate supplementation
in pregnancy, based on a combination of health information systems. Gac Sanit
2012;26:7.
Page 27 of 33
For peer review only - http://bmjopen.bmj.com/site/about/guidelines.xhtml
BMJ Open
123456789101112131415161718192021222324252627282930313233343536373839404142434445464748495051525354555657585960
on July 23, 2020 by guest. Protected by copyright.
http://bmjopen.bm
j.com/
BM
J Open: first published as 10.1136/bm
jopen-2013-004244 on 3 March 2014. D
ownloaded from
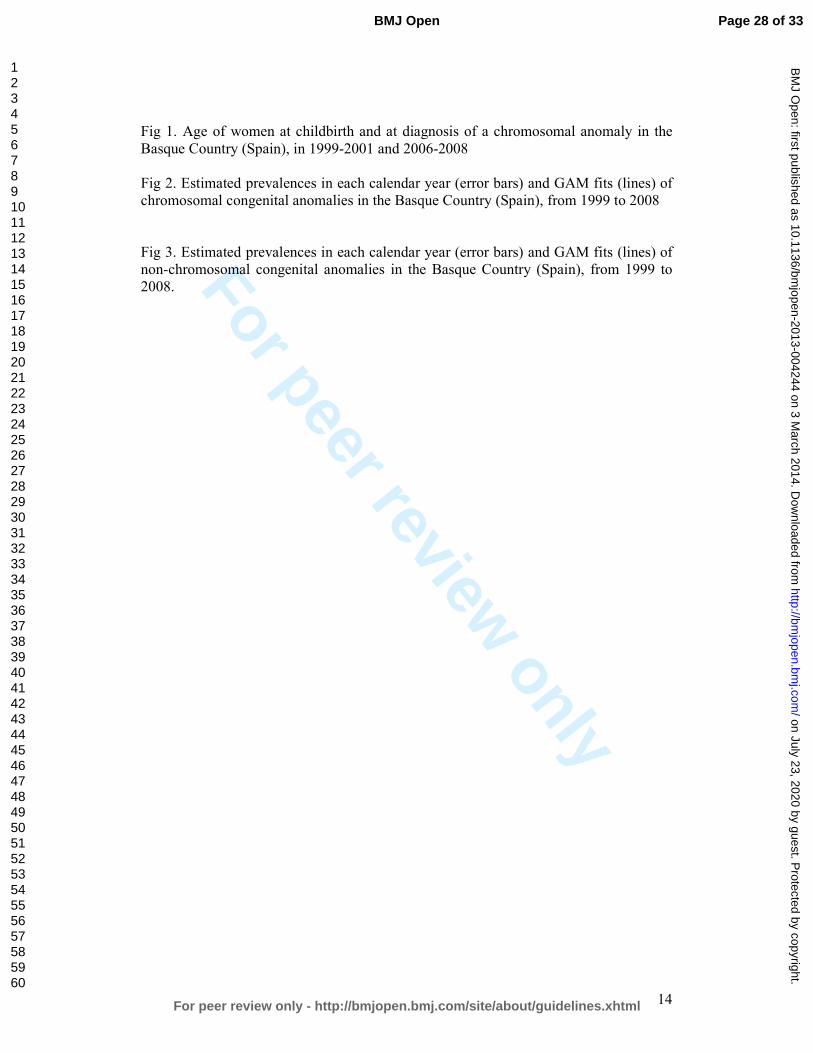
For peer review only
14
Fig 1. Age of women at childbirth and at diagnosis of a chromosomal anomaly in the
Basque Country (Spain), in 1999-2001 and 2006-2008
Fig 2. Estimated prevalences in each calendar year (error bars) and GAM fits (lines) of
chromosomal congenital anomalies in the Basque Country (Spain), from 1999 to 2008
Fig 3. Estimated prevalences in each calendar year (error bars) and GAM fits (lines) of
non-chromosomal congenital anomalies in the Basque Country (Spain), from 1999 to
2008.
Page 28 of 33
For peer review only - http://bmjopen.bmj.com/site/about/guidelines.xhtml
BMJ Open
123456789101112131415161718192021222324252627282930313233343536373839404142434445464748495051525354555657585960
on July 23, 2020 by guest. Protected by copyright.
http://bmjopen.bm
j.com/
BM
J Open: first published as 10.1136/bm
jopen-2013-004244 on 3 March 2014. D
ownloaded from
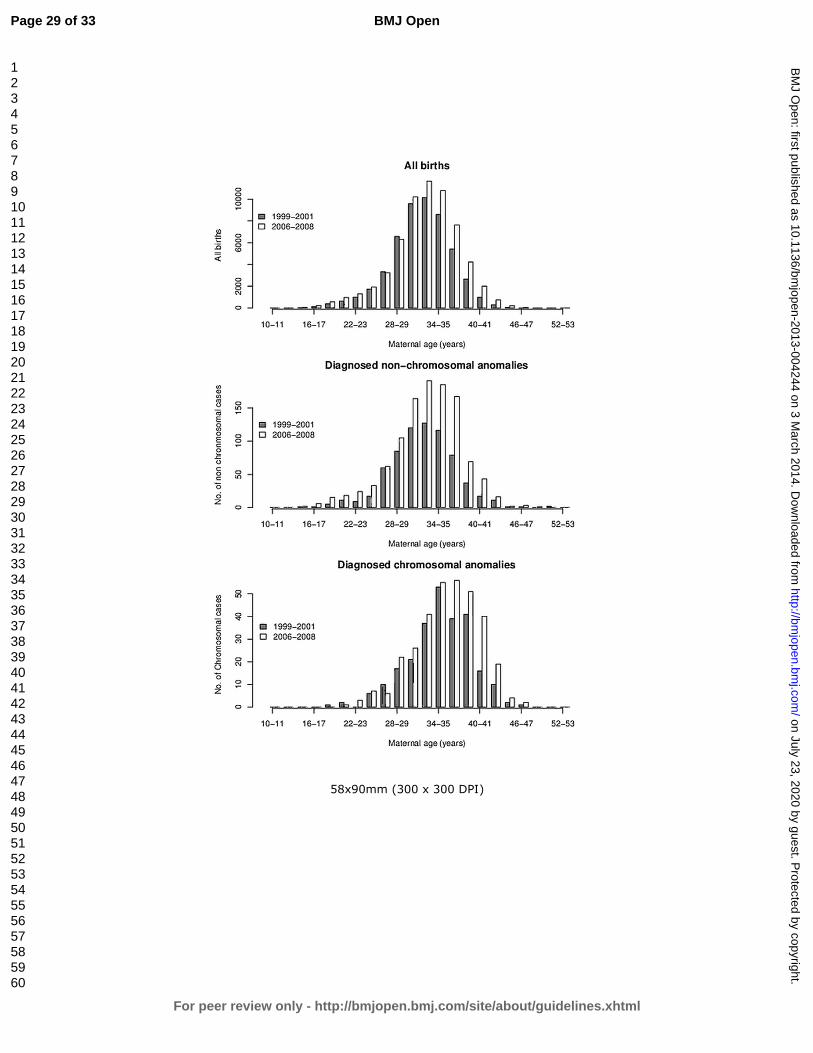
For peer review only
58x90mm (300 x 300 DPI)
Page 29 of 33
For peer review only - http://bmjopen.bmj.com/site/about/guidelines.xhtml
BMJ Open
123456789101112131415161718192021222324252627282930313233343536373839404142434445464748495051525354555657585960
on July 23, 2020 by guest. Protected by copyright.
http://bmjopen.bm
j.com/
BM
J Open: first published as 10.1136/bm
jopen-2013-004244 on 3 March 2014. D
ownloaded from
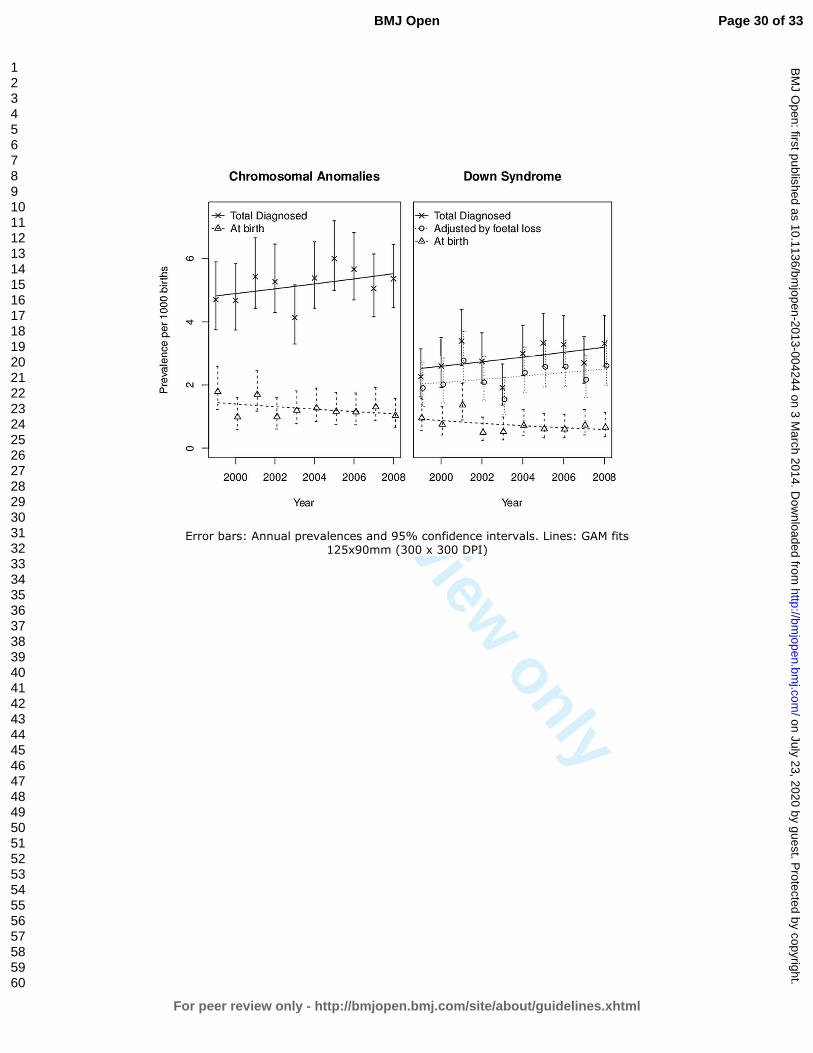
For peer review only
Error bars: Annual prevalences and 95% confidence intervals. Lines: GAM fits
125x90mm (300 x 300 DPI)
Page 30 of 33
For peer review only - http://bmjopen.bmj.com/site/about/guidelines.xhtml
BMJ Open
123456789101112131415161718192021222324252627282930313233343536373839404142434445464748495051525354555657585960
on July 23, 2020 by guest. Protected by copyright.
http://bmjopen.bm
j.com/
BM
J Open: first published as 10.1136/bm
jopen-2013-004244 on 3 March 2014. D
ownloaded from

For peer review only
Error bars: Annual prevalences and 95% confidence intervals. Lines: GAM fits
60x90mm (300 x 300 DPI)
Page 31 of 33
For peer review only - http://bmjopen.bmj.com/site/about/guidelines.xhtml
BMJ Open
123456789101112131415161718192021222324252627282930313233343536373839404142434445464748495051525354555657585960
on July 23, 2020 by guest. Protected by copyright.
http://bmjopen.bm
j.com/
BM
J Open: first published as 10.1136/bm
jopen-2013-004244 on 3 March 2014. D
ownloaded from

For peer review only
1
STROBE Statement—checklist of items that should be included in reports of observational studies Item
No Recommendation
Title and abstract 1√
(a) Indicate the study’s design with a commonly used term in the title or the
abstract
(b) Provide in the abstract an informative and balanced summary of what
was done and what was found
Introduction
Background/rationale 2√ Explain the scientific background and rationale for the investigation being
reported
Objectives 3√ State specific objectives, including any prespecified hypotheses
Methods
Study design 4 √ Present key elements of study design early in the paper
Setting 5 √ Describe the setting, locations, and relevant dates, including periods of
recruitment, exposure, follow-up, and data collection
Participants 6
√
(a) Cohort study—Give the eligibility criteria, and the sources and methods
of selection of participants. Describe methods of follow-up
Case-control study—Give the eligibility criteria, and the sources and
methods of case ascertainment and control selection. Give the rationale for
the choice of cases and controls
Cross-sectional study—Give the eligibility criteria, and the sources and
methods of selection of participants. (Data come from a population-based
registry)
(b) Cohort study—For matched studies, give matching criteria and number
of exposed and unexposed
Case-control study—For matched studies, give matching criteria and the
number of controls per case
Variables 7√ Clearly define all outcomes, exposures, predictors, potential confounders,
and effect modifiers. Give diagnostic criteria, if applicable
Data sources/
measurement
8* For each variable of interest, give sources of data and details of methods of
assessment (measurement). Describe comparability of assessment methods
if there is more than one group
Bias 9√ Describe any efforts to address potential sources of bias
Study size 10√ Explain how the study size was arrived at (It is a population based study;
we use data of the entire population)
Quantitative variables 11 Explain how quantitative variables were handled in the analyses. If
applicable, describe which groupings were chosen and why (Not applicable)
Statistical methods 12√ (a) Describe all statistical methods, including those used to control for
confounding
(b) Describe any methods used to examine subgroups and interactions
(c) Explain how missing data were addressed
(d) Cohort study—If applicable, explain how loss to follow-up was
addressed
Case-control study—If applicable, explain how matching of cases and
controls was addressed
Cross-sectional study—If applicable, describe analytical methods taking
Page 32 of 33
For peer review only - http://bmjopen.bmj.com/site/about/guidelines.xhtml
BMJ Open
123456789101112131415161718192021222324252627282930313233343536373839404142434445464748495051525354555657585960
on July 23, 2020 by guest. Protected by copyright.
http://bmjopen.bm
j.com/
BM
J Open: first published as 10.1136/bm
jopen-2013-004244 on 3 March 2014. D
ownloaded from

For peer review only
2
account of sampling strategy
(e) Describe any sensitivity analyses
Results
Participants 13* (a) Report numbers of individuals at each stage of study—eg numbers potentially
eligible, examined for eligibility, confirmed eligible, included in the study,
completing follow-up, and analysed (Not applicable)
(b) Give reasons for non-participation at each stage
(c) Consider use of a flow diagram
Descriptive data 14*√
(a) Give characteristics of study participants (eg demographic, clinical, social) and
information on exposures and potential confounders
(b) Indicate number of participants with missing data for each variable of interest
(c) Cohort study—Summarise follow-up time (eg, average and total amount)
Outcome data 15*
√
Cohort study—Report numbers of outcome events or summary measures over time
Case-control study—Report numbers in each exposure category, or summary
measures of exposure
Cross-sectional study—Report numbers of outcome events or summary measures
Main results 16√ (a) Give unadjusted estimates and, if applicable, confounder-adjusted estimates and
their precision (eg, 95% confidence interval). Make clear which confounders were
adjusted for and why they were included
(b) Report category boundaries when continuous variables were categorized
(c) If relevant, consider translating estimates of relative risk into absolute risk for a
meaningful time period
Other analyses 17√ Report other analyses done—eg analyses of subgroups and interactions, and
sensitivity analyses
Discussion
Key results 18√ Summarise key results with reference to study objectives
Limitations 19√ Discuss limitations of the study, taking into account sources of potential bias or
imprecision. Discuss both direction and magnitude of any potential bias
Interpretation 20√ Give a cautious overall interpretation of results considering objectives, limitations,
multiplicity of analyses, results from similar studies, and other relevant evidence
Generalisability 21√ Discuss the generalisability (external validity) of the study results
Other information
Funding 22√ Give the source of funding and the role of the funders for the present study and, if
applicable, for the original study on which the present article is based
*Give information separately for cases and controls in case-control studies and, if applicable, for exposed and
unexposed groups in cohort and cross-sectional studies.
Note: An Explanation and Elaboration article discusses each checklist item and gives methodological background and
published examples of transparent reporting. The STROBE checklist is best used in conjunction with this article (freely
available on the Web sites of PLoS Medicine at http://www.plosmedicine.org/, Annals of Internal Medicine at
http://www.annals.org/, and Epidemiology at http://www.epidem.com/). Information on the STROBE Initiative is
available at www.strobe-statement.org.
Page 33 of 33
For peer review only - http://bmjopen.bmj.com/site/about/guidelines.xhtml
BMJ Open
123456789101112131415161718192021222324252627282930313233343536373839404142434445464748495051525354555657585960
on July 23, 2020 by guest. Protected by copyright.
http://bmjopen.bm
j.com/
BM
J Open: first published as 10.1136/bm
jopen-2013-004244 on 3 March 2014. D
ownloaded from