Embed Size (px)
Citation preview
Trends in the Distribution of Selected Opioids by State US 1999-2011Opioids by State, US, 1999 2011
Christopher M. Jones, PharmD, MPHLCDR, US Public Health Service
Division of Unintentional Injury PreventionNational Center for Injury Prevention and Control
1
Centers for Disease Control and PreventionNational Center for Injury Prevention and Control
Division of Unintentional Injury Prevention
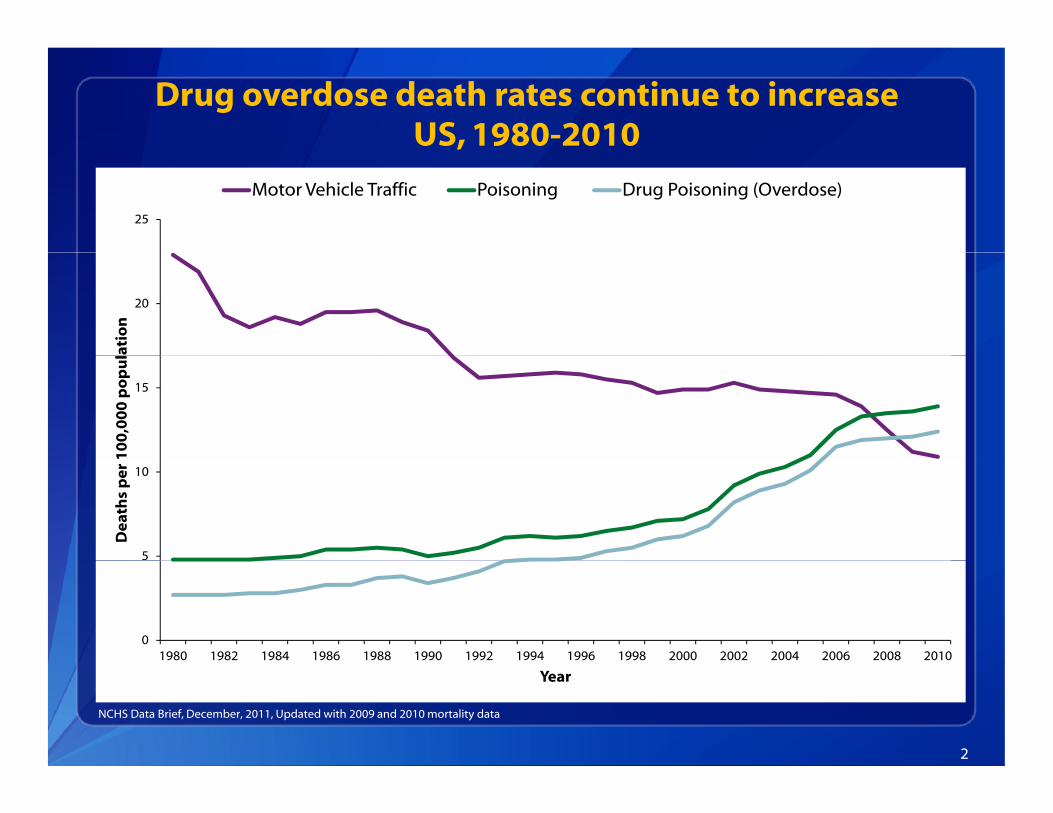
Drug overdose death rates continue to increaseUS, 1980-2010
25
Motor Vehicle Traffic Poisoning Drug Poisoning (Overdose)
20
atio
n
15
10
0,0
00
po
pu
l
5
10
Dea
ths
per
1
01980 1982 1984 1986 1988 1990 1992 1994 1996 1998 2000 2002 2004 2006 2008 2010
2
NCHS Data Brief, December, 2011, Updated with 2009 and 2010 mortality data
Year
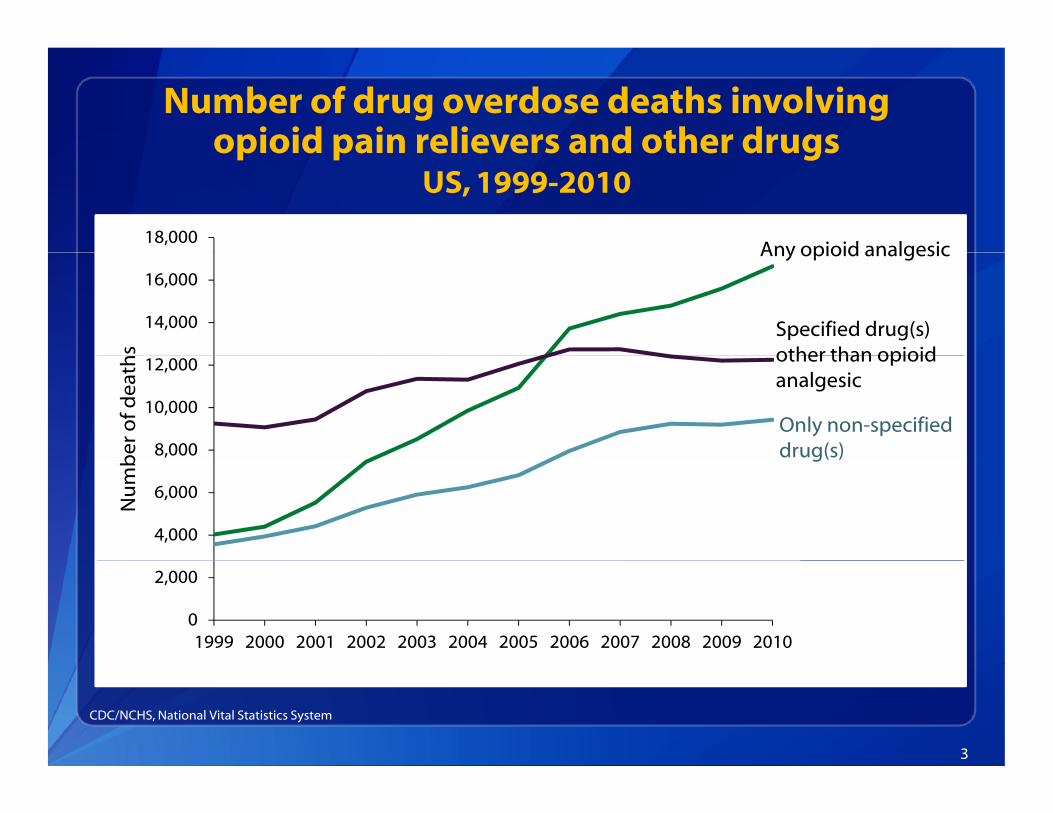
Number of drug overdose deaths involving opioid pain relievers and other drugsopioid pain relievers and other drugs
US, 1999-2010
18,000Any opioid analgesic
14,000
16,000
s
Any opioid analgesic
Specified drug(s) other than opioid
8,000
10,000
12,000
ber
of d
eath
other than opioid analgesic
Only non-specified drug(s)
4,000
6,000
Nu
mb g( )
0
2,000
1999 2000 2001 2002 2003 2004 2005 2006 2007 2008 2009 2010
3
CDC/NCHS, National Vital Statistics System
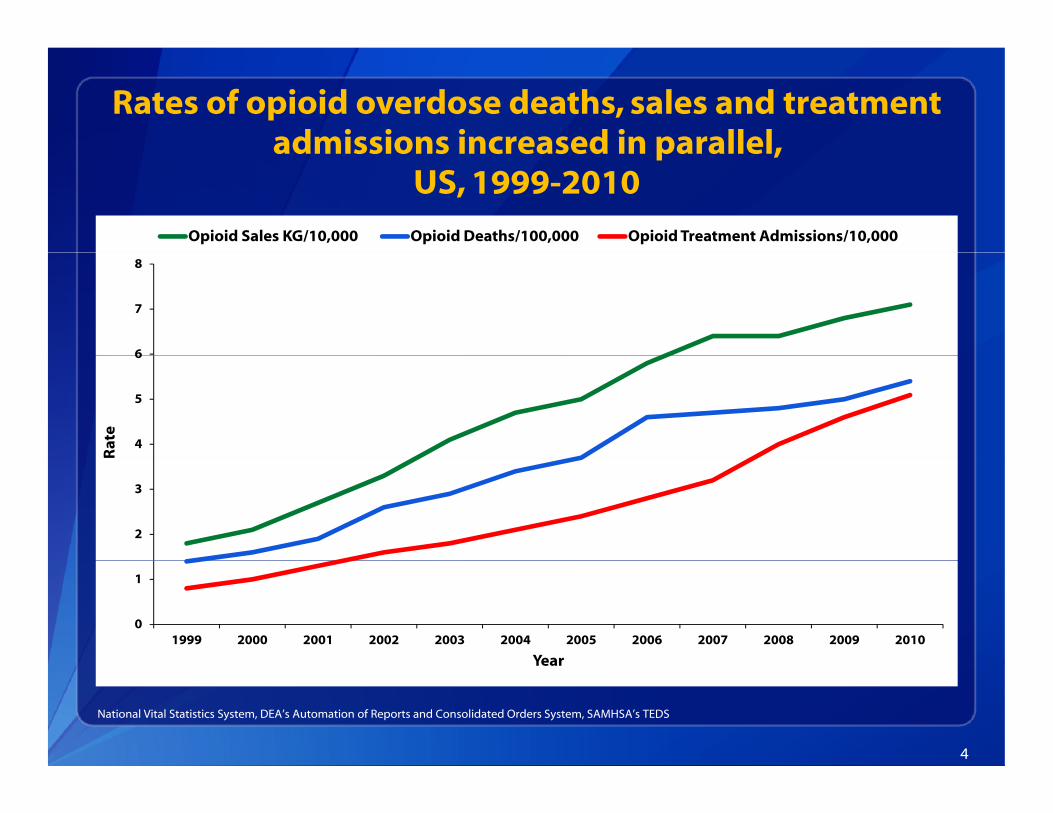
Rates of opioid overdose deaths, sales and treatment admissions increased in parallel, admissions increased in parallel,
US, 1999-2010Opioid Sales KG/10,000 Opioid Deaths/100,000 Opioid Treatment Admissions/10,000
6
7
8
4
5
6
Rat
e
2
3
0
1
1999 2000 2001 2002 2003 2004 2005 2006 2007 2008 2009 2010
Year
4
National Vital Statistics System, DEA’s Automation of Reports and Consolidated Orders System, SAMHSA’s TEDS
Year
Current Analysis
National and state sales of oxycodone, hydrocodone, y , y ,methadone from 1999 through 2011
B d DEA’ A t ti f R t d Based on DEA’s Automation of Reports and Consolidated Orders System (ARCOS) data
5
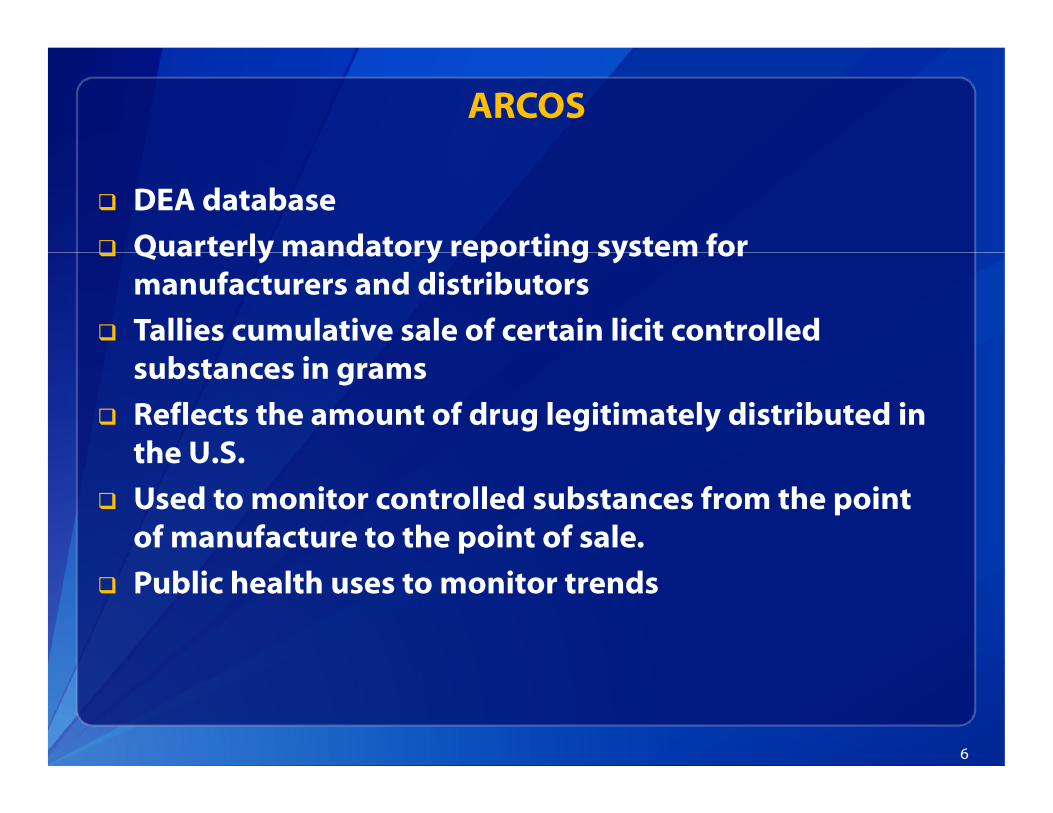
ARCOS
DEA database
Quarterly mandatory reporting system for Quarterly mandatory reporting system for manufacturers and distributors
Tallies cumulative sale of certain licit controlled substances in grams
Reflects the amount of drug legitimately distributed in the U.S. the U.S.
Used to monitor controlled substances from the point of manufacture to the point of sale.
Public health uses to monitor trends
6
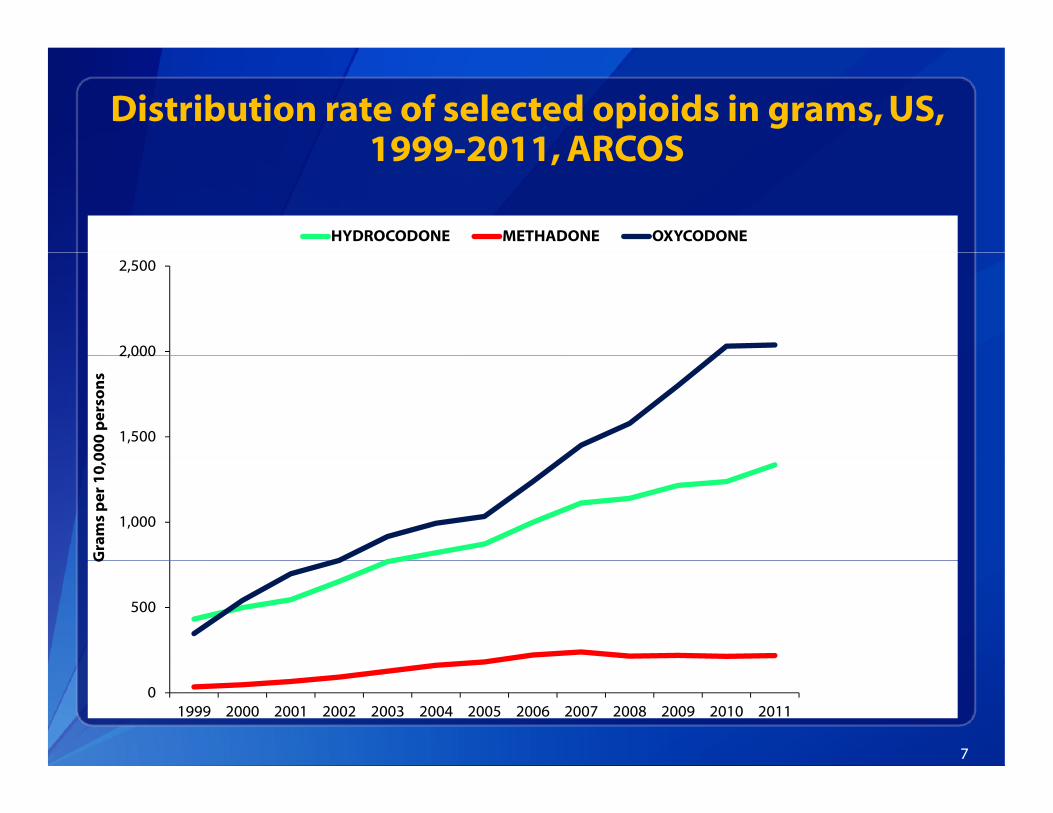
Distribution rate of selected opioids in grams, US, 1999-2011 ARCOS1999-2011, ARCOS
HYDROCODONE METHADONE OXYCODONE
2,000
2,500
1,500
2,000
00
0 p
erso
ns
1,000
Gra
ms
per
10
,0
500
G
7
01999 2000 2001 2002 2003 2004 2005 2006 2007 2008 2009 2010 2011
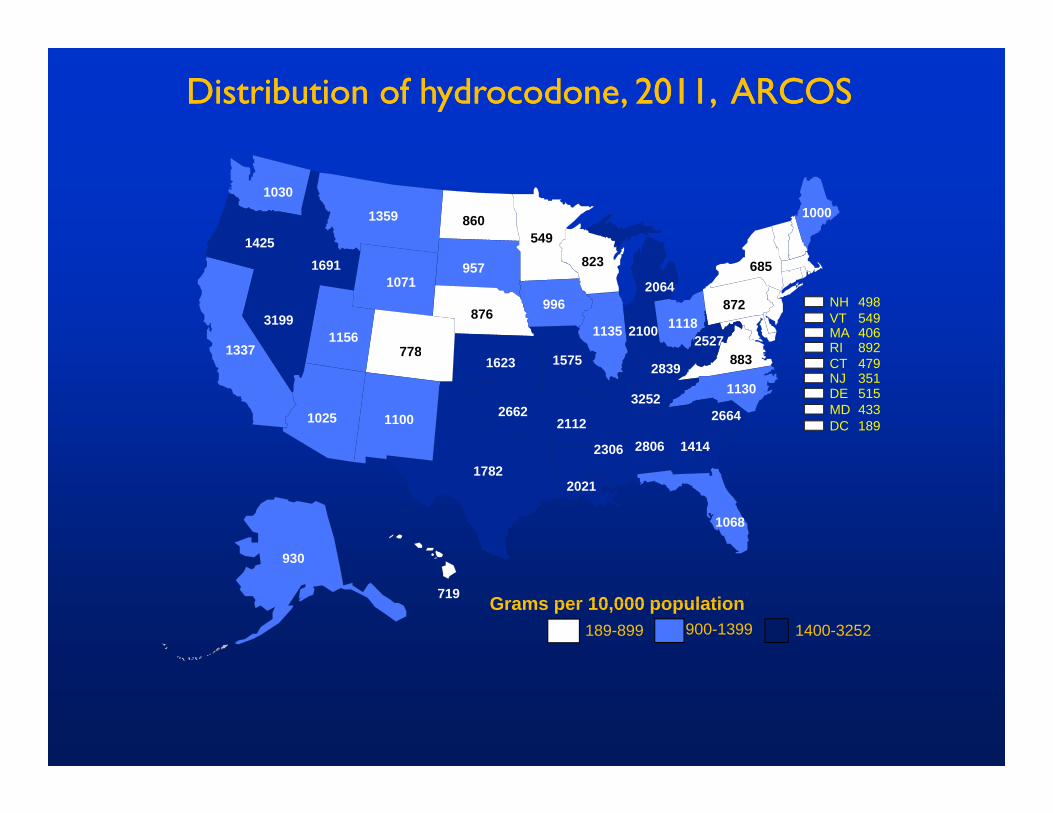
Distribution of hydrocodone, 2011, ARCOSDistribution of hydrocodone, 2011, ARCOS
860549
1359
1425
10301000
1135
685
996
1337
957
876
20641691
2100
1071823
88377812.11156
1118872
25271575
3199NH 498VT 549MA 406RI 892
2306
1623
1100
2806
11302662
1414
88377812.12839
32521025
1575 CT 479NJ 351DE 515MD 433DC 1892112 2664
17822021
1068
930
189-899 900-1399Grams per 10,000 population719
930
1400-3252
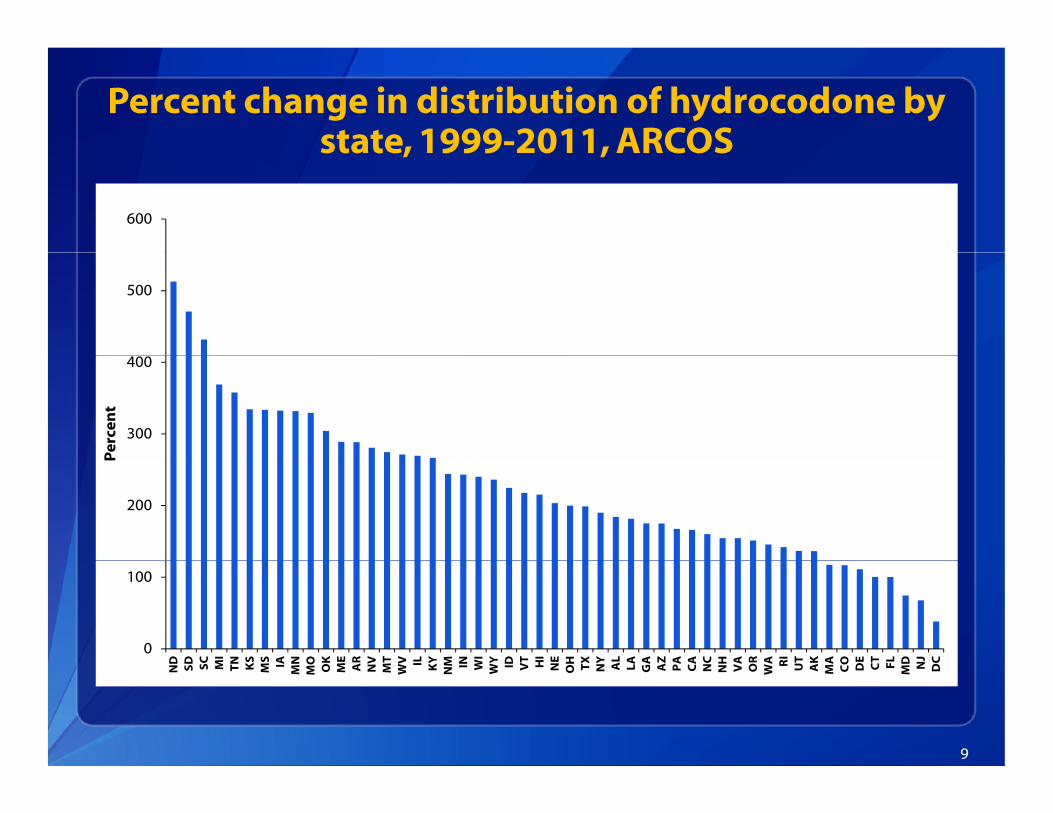
Percent change in distribution of hydrocodone by state, 1999-2011, ARCOSstate, 1999 2011, ARCOS
600
500
300
400
Per
cen
t
200
P
0
100
D D C MI N K
S S A N O K E R V T V IL Y M N WI Y D V
T HI E H X Y
AL A A Z A A C H A R A RI T K A O D
EC
T FL D NJ C
9
ND SD S M TN K M I A
MN
MO
O M A NV
M WV I KY
NM IN W WY ID V H N OH TX
NY
A LA GA
A PA
CA
N NH
VA
O WA R U A MA
CO D C F MD N D
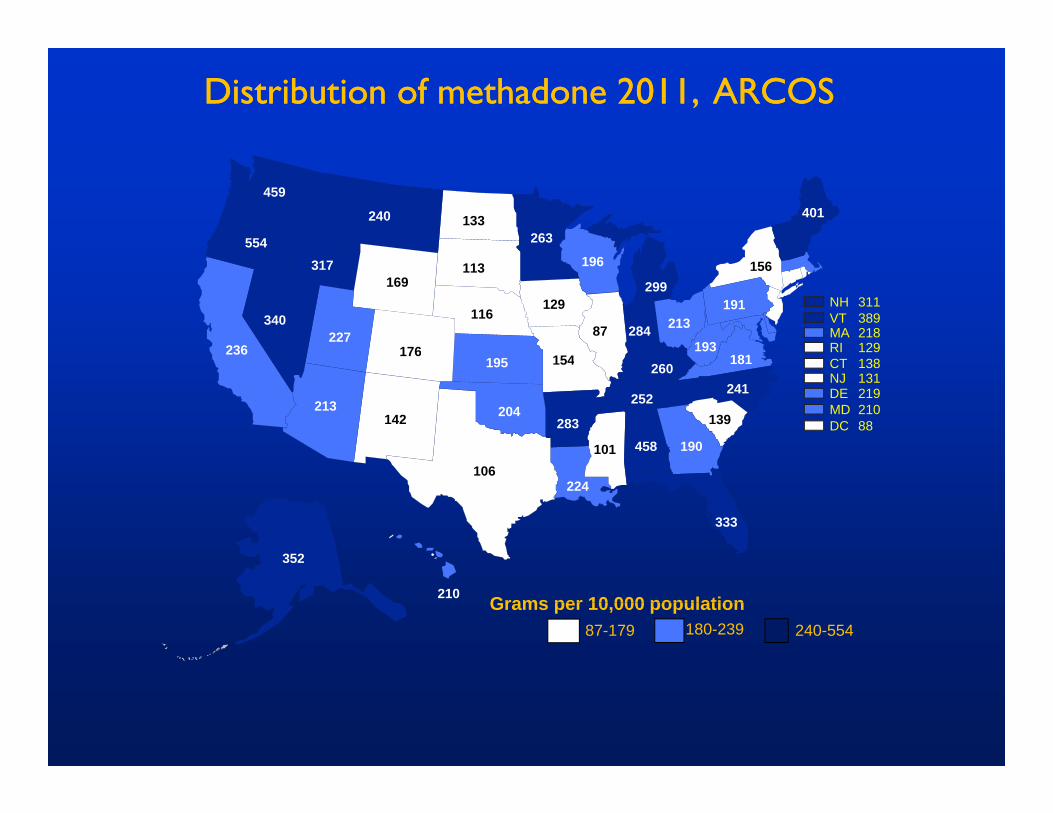
Distribution of methadone 2011, ARCOSDistribution of methadone 2011, ARCOS
133263
240
554
459401
87
156
129
236
113
116
299317
284
169196
181176227
213191
193154
340NH 311VT 389MA 218RI 129
101
195
142
458
241204
190
181176260
139252213
154 CT 138NJ 131DE 219MD 210DC 88283
106224
333
352
87-179 180-239Grams per 10,000 population210
352
240-554
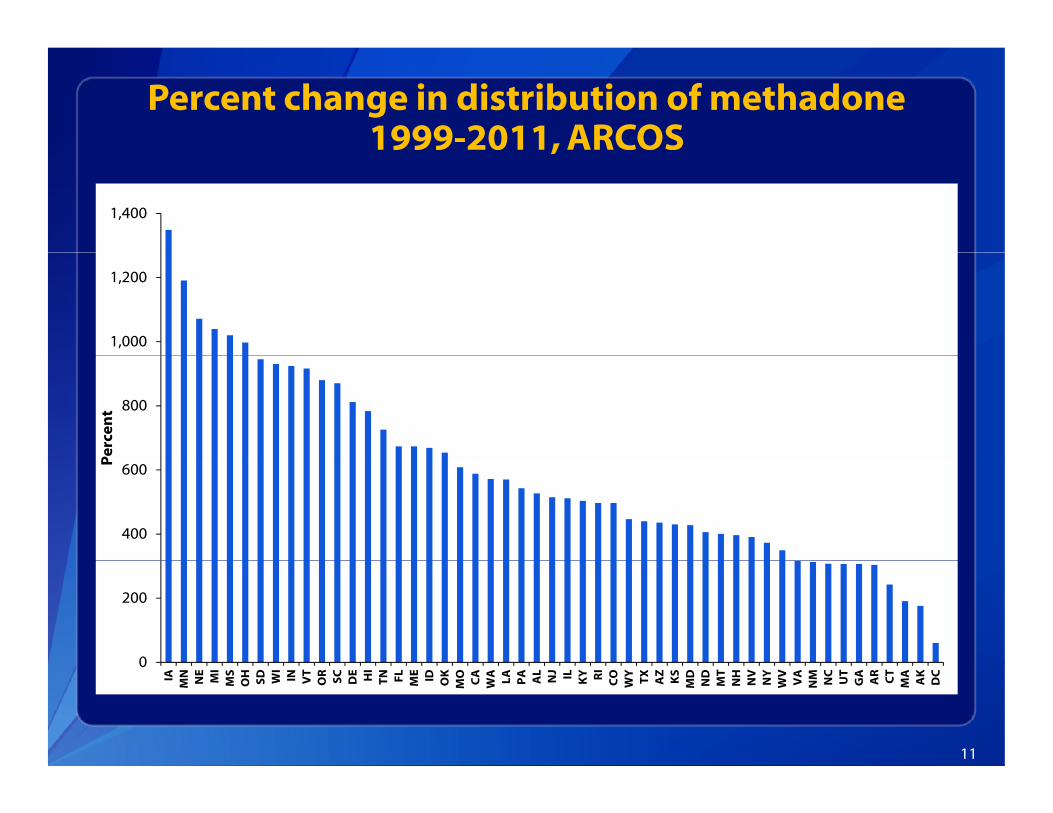
Percent change in distribution of methadone 1999-2011, ARCOS,
1,400
1,000
1,200
800
Per
cen
t
400
600
P
0
200
11
0
IAM
N NE
MI
MS
OH
SD WI
IN VT
OR
SC DE HI
TN FL ME ID OK
MO CA
WA LA PA AL
NJ IL KY RI
CO
WY
TX
AZ
KS
MD
ND
MT
NH
NV
NY
WV
VA
NM NC
UT
GA
AR
CT
MA
AK
DC
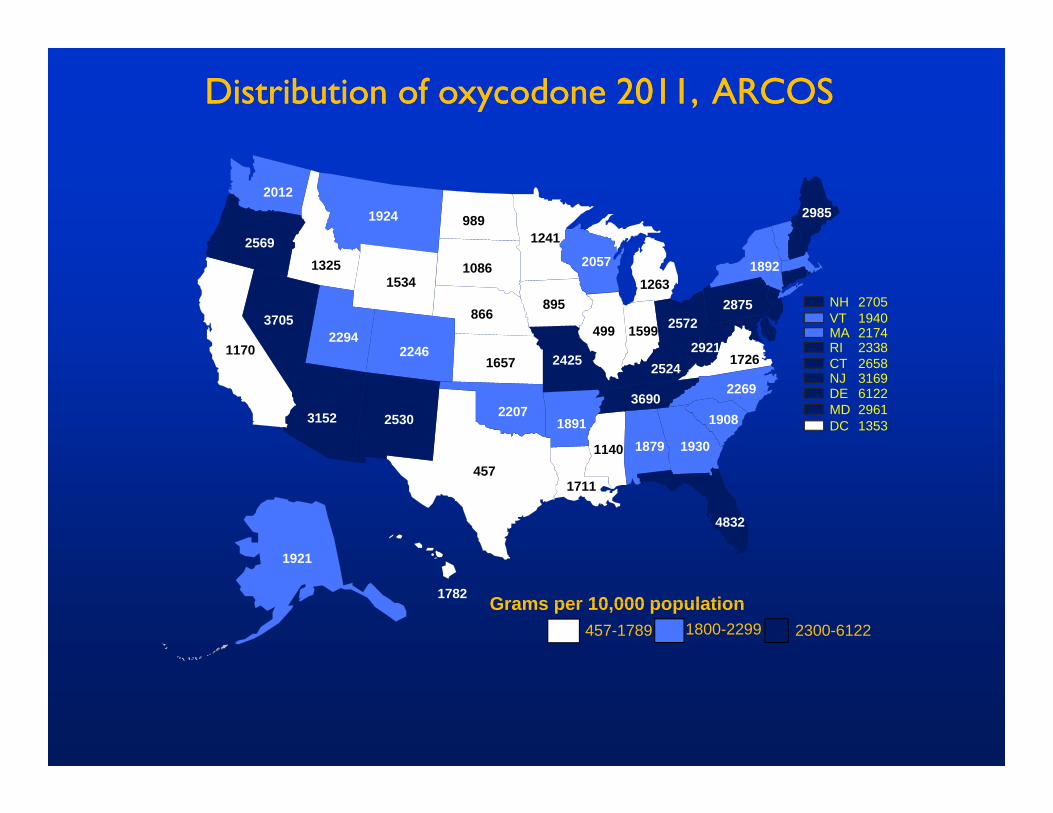
Distribution of oxycodone 2011, ARCOSDistribution of oxycodone 2011, ARCOS
9891241
1924
2569
20122985
499
1892
895
1170
1086
866
12631325
1599
15342057
172622462294
25722875
29212425
3705NH 2705VT 1940MA 2174RI 2338
1140
1657
2530
1879
22692207
1930
172622462524
19083690
3152
2425 CT 2658NJ 3169DE 6122MD 2961DC 13531891
4571711
4832
1921
457-1789 1800-2299Grams per 10,000 population1782
1921
2300-6122
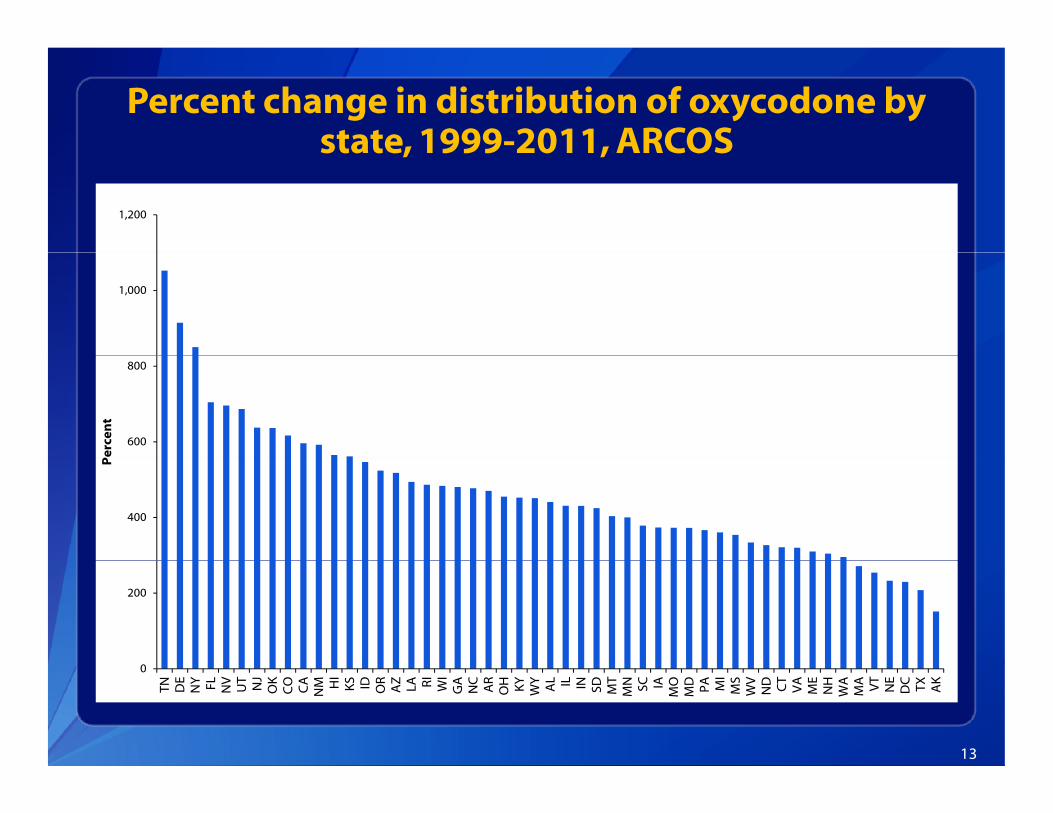
Percent change in distribution of oxycodone by state, 1999-2011, ARCOSstate, 1999 2011, ARCOS
1,200
1,000
600
800
Per
cen
t
400
P
200
13
0
TN DE
NY FL NV
UT NJ
OK
CO CA
NM H
IK
S ID OR
AZ LA RI WI
GA
NC
AR
OH KY
WY
AL IL IN SD MT
MN SC IA
MO
MD PA M
IM
SW
VN
D CT
VA
ME
NH
WA
MA VT
NE
DC TX AK
Conclusions
Rising trends in opioid use portend increasing rates of drug overdosesdrug overdoses
Data available to states to track prescription drug sales and overdoses vary widely
ARCOS data are consistent across states and can be used to track distribution and compare states
PDMPs and insurance claims data can also be used to PDMPs and insurance claims data can also be used to identify and address opioid abuse by patients, as well as inappropriate prescribing by providers
These data can also be used to track the impact of various state-level interventions
14
Thank YoThank You
Christopher M. Jones, PharmD, [email protected]
The findings and conclusions in this report are those of the author and do not necessarily represent the views of the Centers for Disease Control and Prevention.