Embed Size (px)
Citation preview
RAPID COMMUNICATION / COMMUNICATION RAPIDE
Trends in the abundance of marine fishes
Jeffrey A. Hutchings, Coilın Minto, Daniel Ricard, Julia K. Baum, andOlaf P. Jensen
Abstract: The Convention on Biological Diversity (CBD) established a target in 2002 to reduce the rate of biodiversityloss by 2010. Using a newly constructed global database for 207 populations (108 species), we examine whether the 2010target has been met for marine fishes, while accounting for population biomass relative to maximum sustainable yield,BMSY. Although rate of decline has eased for 59% of populations declining before 1992 (a pattern consistent with a literalinterpretation of the target), the percentage of populations below BMSY has remained unchanged and the rate of decline hasincreased among several top predators, many of which are below 0.5BMSY. Combining population trends, a global multi-species index indicates that marine fishes declined 38% between 1970 and 2007. The index has been below BMSY sincethe mid-1980s and stable since the early 1990s. With the exception of High Seas pelagic fishes and demersal species inthe Northeast Pacific and Australia – New Zealand, the multispecies indices are currently below BMSY in many regions. Weconclude that the 2010 CBD target represents a weak standard for recovering marine fish biodiversity and that meaningfulprogress will require population-specific recovery targets and associated time lines for achieving those targets.
Resume : La Convention sur la diversite biologique (« CBD ») s’est donnee en 2002 comme objectif de reduire le tauxde perte de la biodiversite avant 2010. Utilisant une nouvelle base de donnees globale de 207 populations (108 especes),nous examinons si l’objectif 2010 de la CBD a ete atteint pour les poissons marins, tout en tenant compte de la biomassedes populations relative au rendement maximal durable, BMSY. Malgre une diminution du taux de declin chez 59 % des po-pulations en chute avant 1992 (une tendance qui correspond a une interpretation litterale de l’objectif 2010 de la CBD), lepourcentage des populations sous BMSY s’est maintenu constant et le taux de declin s’est accelere chez plusieurs des preda-teurs sommitaux, une majorite desquels sont a un niveau inferieur a 0,5BMSY. Combinant les tendances des populations, unindice global multi-especes montre que les poissons marins ont diminue de 38 % entre 1970 et 2007. L’indice est inferieura BMSY depuis le milieu des annees 1980 et stable depuis le debut des annees 1990. Avec l’exception des populations pela-giques de haute mer et des populations demersales du nord-est du Pacifique et de Nouvelle-Zelande – Australie, les indicesmulti-especes sont presentement sous BMSY dans plusieurs regions. Nous concluons que l’objectif CBD 2010 represente unfaible standard pour recuperer la biodiversite des poissons marins et qu’un progres reel requerra des cibles claires de recu-peration specifiques a chacune des populations et soumises a des echeanciers stricts pour atteindre les objectifs vises.
Introduction
The United Nations declared 2010 to be the InternationalYear of Biodiversity. This was a direct response to initia-tives by the Convention on Biological Diversity (CBD) to(i) conserve biological diversity, (ii) use biological diversityin a sustainable fashion, and (iii) share the benefits of bio-logical diversity fairly and equitably (CBD; http://www.cbd.
int). In 2002, the Conference of the Parties adopted a strate-gic plan for the CBD, the mission statement of which articu-lated what has become known as the 2010 BiodiversityTarget: ‘‘to achieve by 2010 a significant reduction of thecurrent rate of biodiversity loss at the global, regional andnational level as a contribution to poverty alleviation and tothe benefit of all life on Earth’’ (http://cbd.int/2010-target/about.shtml).
Received 27 February 2010. Accepted 26 June 2010. Published on the NRC Research Press Web site at cjfas.nrc.ca on 15 July 2010.J21684
Paper handled by Associate Editor Eric Taylor.
J.A. Hutchings1 and D. Ricard. Department of Biology, Dalhousie University, Halifax, NS B3H 4J1, Canada.C. Minto. Department of Biology, Dalhousie University, Halifax, NS B3H 4J1, Canada; Marine and Freshwater Research Centre,Galway-Mayo Institute of Technology, Dublin Road, Galway, Ireland.J.K. Baum. National Center for Ecological Analysis and Synthesis, University of California, Santa Barbara, 735 State Street, Suite 300,Santa Barbara, CA 93101, USA.O.P. Jensen.2 School of Aquatic and Fishery Sciences, University of Washington, Seattle, WA 98195-5020, USA.
1Corresponding author (e-mail: [email protected]).2Present address: Rutgers University, Institute of Marine and Coastal Sciences, 71 Dudley Road, New Brunswick, NJ 08901, USA.
1205
Can. J. Fish. Aquat. Sci. 67: 1205–1210 (2010) doi:10.1139/F10-081 Published by NRC Research Press
Among the biodiversity indicators identified by the CBDto evaluate progress in meeting the target are those that ex-amine ‘‘trends in the abundance and distribution of selectedspecies’’ and ‘‘trends in genetic diversity ... of fish speciesof major socio-economic importance’’. An intermediate andarguably more important metric of biodiversity is that ofquantifying trends in the abundance of populations of se-lected species. This population-level approach, for example,underpins the only marine index formally under considera-tion by the CBD — the Marine Living Planet Index orMLPI (World Wildlife Fund for Nature (WWF) 2008). AsSchindler et al. (2010) have shown recently, maintenance ofpopulation diversity can be of fundamental importance tothe stability and persistence of species.
Our overall objective is to determine whether the CBD’s2010 target has been met for marine fishes. Our analysisrepresents a significant extension of the only global and re-gional examination of marine fish population trends (Hutch-ings and Baum 2005): trends are now considered for 207populations (up from 177); the multispecies index includes174 populations (up from 87); the most recent year includedis now 2009 (compared with 2004); and the spatial scale hasincreased from one centred in the North Atlantic to one con-siderably more global in coverage.
Materials and methodsOur analyses utilize population biomass estimates compiled
from assessments undertaken by national and internationalfisheries management agencies (soon to be available at www.marinebiodiversity.ca/RAMlegacy/srdb; detailed summariesof the data used in the present study are available upon re-quest to J.A. Hutchings). Regionally, data were availablefrom Northeast Atlantic (Iceland east to Baltic Sea), North-west Atlantic (Canada, northeastern US), North Mid-Atlantic(southeastern US, Gulf of Mexico), Northeast Pacific (BeringSea to southern California), Australia – New Zealand, HighSeas (Atlantic, Pacific), and a limited number of populationsfrom South Africa and South America.
Given that the 2010 target is based on the rate of change,we compared the slopes of linear regressions of log-transformed spawning stock biomass (SSB) against timefor two different periods. For each population, we com-pared regression slopes for all available data up to 1991(the year before the CBD was open for signature) withthose for all available data from 1992 onwards (usually to2007). The slopes for each population were estimated usingthe continuous piece-wise model:
ð1Þ lnðSSBtÞ ¼ aþ b t þ dbðt � 1992Þht þ 3t
where SSBt is the spawning stock biomass (in tonnes) inyear t, a is the overall intercept, ht is a class variable deter-mining whether year t is before (ht = 0) or after (ht = 1)1992, b is the slope prior to 1992, db is the change in slopepost-1992, and 3t ~ N(0, s3
2) comprises the residuals. Underthis model, a reduction in the rate of decline for those popu-lations with negative slopes before 1992 would be reflectedin a positive slope difference (i.e., db > 0), consistent withthe 2010 target. Our analyses included populations (n =
207) for which there were at least 10 years of data beforeand after 1992 (Supplementary Table S13). To examine therobustness of our results, we also fit a discontinuous piece-wise model with no continuity constraint and a random-walkstate–space model (Durbin and Koopman 2001) with pre-and post-1992 drift terms, using a Kalman filter (both aredescribed in the Supplementary data3; all model fits andparameter estimates are shown in Supplementary Fig. S1and Table S13).
Potential consequences to biodiversity of positive andnegative slope differences were evaluated by comparingeach population’s biomass (SSB or total biomass, TB) withthe relevant estimated biomass at which maximum sustain-able yield is achieved, i.e., SSBMSY or TBMSY; for simplic-ity, we shall refer to these collectively as BMSY. FollowingWorm et al. (2009), estimates of BMSY available directlyfrom stock assessments are based on SSB for all but twopopulations; these populations (North Atlantic albacoretuna, Thunnus alalunga; eastern Atlantic bluefin tuna, Thun-nus thynnus) and those estimated from a Schaefer surplusproduction model, external to the stock assessments, arebased on total biomass.
Multispecies abundance indices were constructed for 1970(the initial year of WWF’s MLPI) to 2007, using 174 popu-lations in total (n = 159 having reference point estimates)for which data were available from at least 1978 until 2002(ensuring a minimum of 25 years of data and at least 10years of post-1992 data). To combine the series across pop-ulations, we standardized the SSB or TB data (depending onwhich reference point was available) by log-transformingand subtracting the biomass reference point on the log scale.For each year, the multispecies index was calculated using amixed-effects model with a fixed-effect mean index peryear, an overall random effect deviation for each population,and a first-order autocorrelation structure on the residuals.The trend was returned to the original scale by taking theexponent of the fixed-effect mean. The average of the firstand last five years of this index were then used to calculatea percentage change across the 1970–2007 time period forall populations combined and for pelagic and demersal pop-ulations separately (habitat categories are indicated in Sup-plementary Table S13).
Results
Temporal changes in rate of declineAmong 152 populations (73% of 207) declining prior to
1992, the slope difference was positive for 59% (n = 90;Fig. 1; four South African populations are not plotted), indi-cative of an easing of rates of decline after 1992. While 55 ofthese 90 populations showed an increasing trend after 1992,35 of them were still declining, despite the positive slope dif-ference. For the remaining 62 of 152 populations (41%), therate of decline after 1992 was greater than that prior to 1992.
Information on BMSY was available for 136 of the 152populations in decline prior to 1992 (85 of which were ob-tained from assessments); the slope difference was positivefor 62% of these, indicative of an easing of rates of declineafter 1992. Among these 84 populations, 32 were still de-
3 Supplementary data for this article are available on the journal Web site (http://cjfas.nrc.ca).
1206 Can. J. Fish. Aquat. Sci. Vol. 67, 2010
Published by NRC Research Press
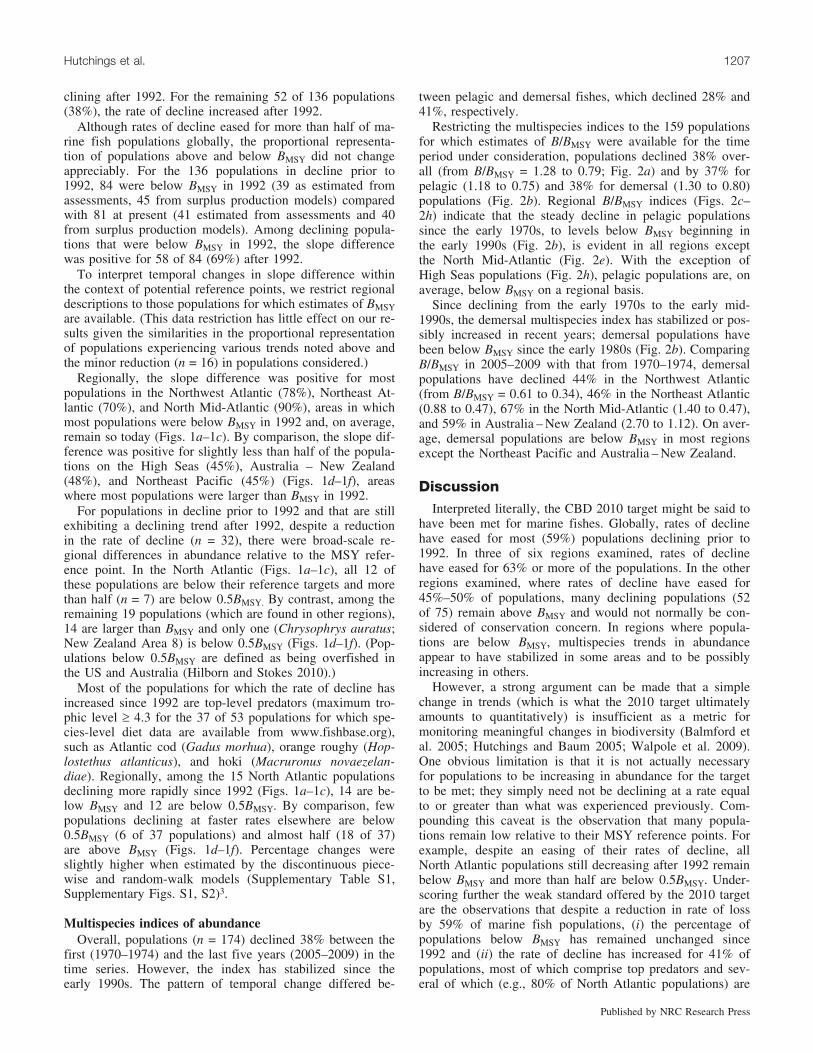
clining after 1992. For the remaining 52 of 136 populations(38%), the rate of decline increased after 1992.
Although rates of decline eased for more than half of ma-rine fish populations globally, the proportional representa-tion of populations above and below BMSY did not changeappreciably. For the 136 populations in decline prior to1992, 84 were below BMSY in 1992 (39 as estimated fromassessments, 45 from surplus production models) comparedwith 81 at present (41 estimated from assessments and 40from surplus production models). Among declining popula-tions that were below BMSY in 1992, the slope differencewas positive for 58 of 84 (69%) after 1992.
To interpret temporal changes in slope difference withinthe context of potential reference points, we restrict regionaldescriptions to those populations for which estimates of BMSYare available. (This data restriction has little effect on our re-sults given the similarities in the proportional representationof populations experiencing various trends noted above andthe minor reduction (n = 16) in populations considered.)
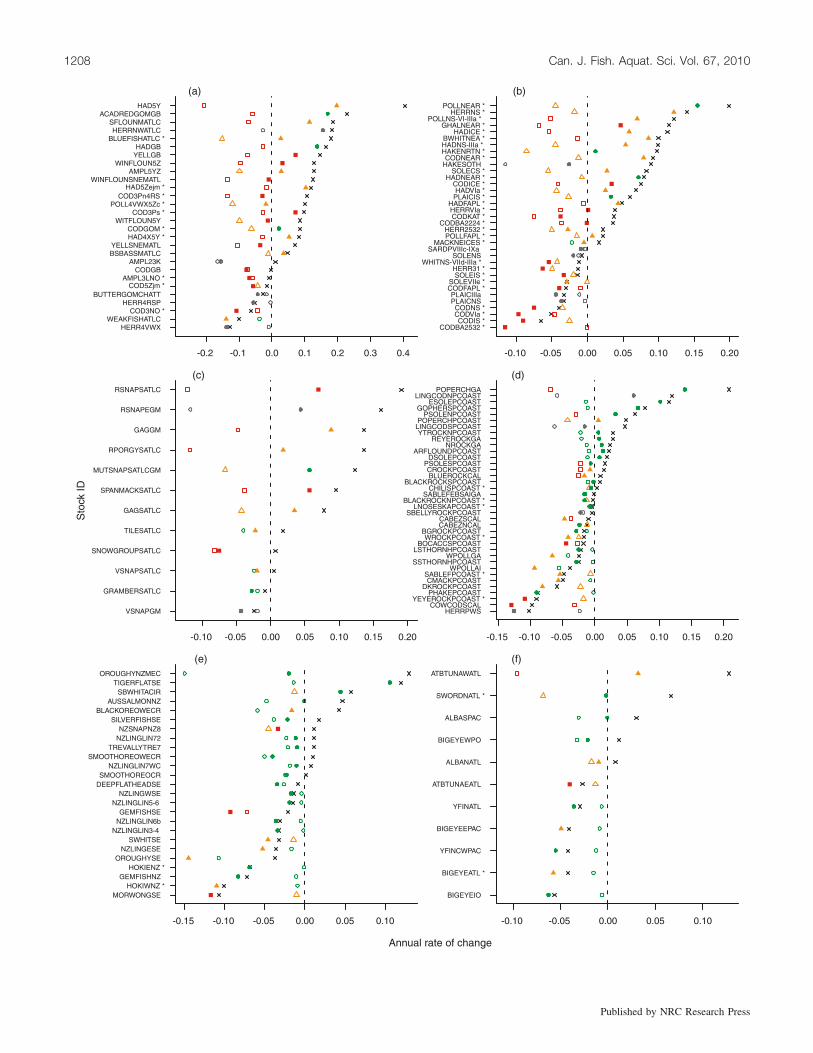
Regionally, the slope difference was positive for mostpopulations in the Northwest Atlantic (78%), Northeast At-lantic (70%), and North Mid-Atlantic (90%), areas in whichmost populations were below BMSY in 1992 and, on average,remain so today (Figs. 1a–1c). By comparison, the slope dif-ference was positive for slightly less than half of the popula-tions on the High Seas (45%), Australia – New Zealand(48%), and Northeast Pacific (45%) (Figs. 1d–1f), areaswhere most populations were larger than BMSY in 1992.
For populations in decline prior to 1992 and that are stillexhibiting a declining trend after 1992, despite a reductionin the rate of decline (n = 32), there were broad-scale re-gional differences in abundance relative to the MSY refer-ence point. In the North Atlantic (Figs. 1a–1c), all 12 ofthese populations are below their reference targets and morethan half (n = 7) are below 0.5BMSY. By contrast, among theremaining 19 populations (which are found in other regions),14 are larger than BMSY and only one (Chrysophrys auratus;New Zealand Area 8) is below 0.5BMSY (Figs. 1d–1f). (Pop-ulations below 0.5BMSY are defined as being overfished inthe US and Australia (Hilborn and Stokes 2010).)
Most of the populations for which the rate of decline hasincreased since 1992 are top-level predators (maximum tro-phic level ‡ 4.3 for the 37 of 53 populations for which spe-cies-level diet data are available from www.fishbase.org),such as Atlantic cod (Gadus morhua), orange roughy (Hop-lostethus atlanticus), and hoki (Macruronus novaezelan-diae). Regionally, among the 15 North Atlantic populationsdeclining more rapidly since 1992 (Figs. 1a–1c), 14 are be-low BMSY and 12 are below 0.5BMSY. By comparison, fewpopulations declining at faster rates elsewhere are below0.5BMSY (6 of 37 populations) and almost half (18 of 37)are above BMSY (Figs. 1d–1f). Percentage changes wereslightly higher when estimated by the discontinuous piece-wise and random-walk models (Supplementary Table S1,Supplementary Figs. S1, S2)3.
Multispecies indices of abundanceOverall, populations (n = 174) declined 38% between the
first (1970–1974) and the last five years (2005–2009) in thetime series. However, the index has stabilized since theearly 1990s. The pattern of temporal change differed be-
tween pelagic and demersal fishes, which declined 28% and41%, respectively.
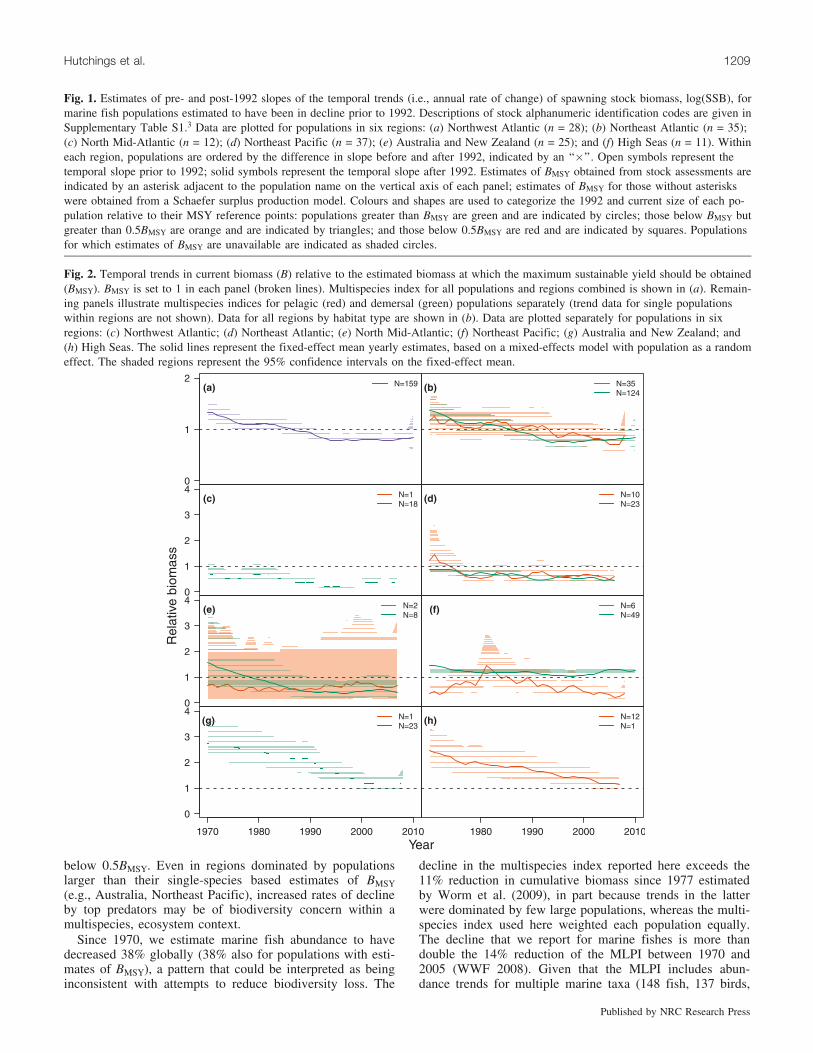
Restricting the multispecies indices to the 159 populationsfor which estimates of B/BMSY were available for the timeperiod under consideration, populations declined 38% over-all (from B/BMSY = 1.28 to 0.79; Fig. 2a) and by 37% forpelagic (1.18 to 0.75) and 38% for demersal (1.30 to 0.80)populations (Fig. 2b). Regional B/BMSY indices (Figs. 2c–2h) indicate that the steady decline in pelagic populationssince the early 1970s, to levels below BMSY beginning inthe early 1990s (Fig. 2b), is evident in all regions exceptthe North Mid-Atlantic (Fig. 2e). With the exception ofHigh Seas populations (Fig. 2h), pelagic populations are, onaverage, below BMSY on a regional basis.
Since declining from the early 1970s to the early mid-1990s, the demersal multispecies index has stabilized or pos-sibly increased in recent years; demersal populations havebeen below BMSY since the early 1980s (Fig. 2b). ComparingB/BMSY in 2005–2009 with that from 1970–1974, demersalpopulations have declined 44% in the Northwest Atlantic(from B/BMSY = 0.61 to 0.34), 46% in the Northeast Atlantic(0.88 to 0.47), 67% in the North Mid-Atlantic (1.40 to 0.47),and 59% in Australia – New Zealand (2.70 to 1.12). On aver-age, demersal populations are below BMSY in most regionsexcept the Northeast Pacific and Australia – New Zealand.
DiscussionInterpreted literally, the CBD 2010 target might be said to
have been met for marine fishes. Globally, rates of declinehave eased for most (59%) populations declining prior to1992. In three of six regions examined, rates of declinehave eased for 63% or more of the populations. In the otherregions examined, where rates of decline have eased for45%–50% of populations, many declining populations (52of 75) remain above BMSY and would not normally be con-sidered of conservation concern. In regions where popula-tions are below BMSY, multispecies trends in abundanceappear to have stabilized in some areas and to be possiblyincreasing in others.
However, a strong argument can be made that a simplechange in trends (which is what the 2010 target ultimatelyamounts to quantitatively) is insufficient as a metric formonitoring meaningful changes in biodiversity (Balmford etal. 2005; Hutchings and Baum 2005; Walpole et al. 2009).One obvious limitation is that it is not actually necessaryfor populations to be increasing in abundance for the targetto be met; they simply need not be declining at a rate equalto or greater than what was experienced previously. Com-pounding this caveat is the observation that many popula-tions remain low relative to their MSY reference points. Forexample, despite an easing of their rates of decline, allNorth Atlantic populations still decreasing after 1992 remainbelow BMSY and more than half are below 0.5BMSY. Under-scoring further the weak standard offered by the 2010 targetare the observations that despite a reduction in rate of lossby 59% of marine fish populations, (i) the percentage ofpopulations below BMSY has remained unchanged since1992 and (ii) the rate of decline has increased for 41% ofpopulations, most of which comprise top predators and sev-eral of which (e.g., 80% of North Atlantic populations) are
Hutchings et al. 1207
Published by NRC Research Press
1208 Can. J. Fish. Aquat. Sci. Vol. 67, 2010
Published by NRC Research Press
below 0.5BMSY. Even in regions dominated by populationslarger than their single-species based estimates of BMSY(e.g., Australia, Northeast Pacific), increased rates of declineby top predators may be of biodiversity concern within amultispecies, ecosystem context.
Since 1970, we estimate marine fish abundance to havedecreased 38% globally (38% also for populations with esti-mates of BMSY), a pattern that could be interpreted as beinginconsistent with attempts to reduce biodiversity loss. The
decline in the multispecies index reported here exceeds the11% reduction in cumulative biomass since 1977 estimatedby Worm et al. (2009), in part because trends in the latterwere dominated by few large populations, whereas the multi-species index used here weighted each population equally.The decline that we report for marine fishes is more thandouble the 14% reduction of the MLPI between 1970 and2005 (WWF 2008). Given that the MLPI includes abun-dance trends for multiple marine taxa (148 fish, 137 birds,
Fig. 1. Estimates of pre- and post-1992 slopes of the temporal trends (i.e., annual rate of change) of spawning stock biomass, log(SSB), formarine fish populations estimated to have been in decline prior to 1992. Descriptions of stock alphanumeric identification codes are given inSupplementary Table S1.3 Data are plotted for populations in six regions: (a) Northwest Atlantic (n = 28); (b) Northeast Atlantic (n = 35);(c) North Mid-Atlantic (n = 12); (d) Northeast Pacific (n = 37); (e) Australia and New Zealand (n = 25); and (f) High Seas (n = 11). Withineach region, populations are ordered by the difference in slope before and after 1992, indicated by an ‘‘�’’. Open symbols represent thetemporal slope prior to 1992; solid symbols represent the temporal slope after 1992. Estimates of BMSY obtained from stock assessments areindicated by an asterisk adjacent to the population name on the vertical axis of each panel; estimates of BMSY for those without asteriskswere obtained from a Schaefer surplus production model. Colours and shapes are used to categorize the 1992 and current size of each po-pulation relative to their MSY reference points: populations greater than BMSY are green and are indicated by circles; those below BMSY butgreater than 0.5BMSY are orange and are indicated by triangles; and those below 0.5BMSY are red and are indicated by squares. Populationsfor which estimates of BMSY are unavailable are indicated as shaded circles.
Fig. 2. Temporal trends in current biomass (B) relative to the estimated biomass at which the maximum sustainable yield should be obtained(BMSY). BMSY is set to 1 in each panel (broken lines). Multispecies index for all populations and regions combined is shown in (a). Remain-ing panels illustrate multispecies indices for pelagic (red) and demersal (green) populations separately (trend data for single populationswithin regions are not shown). Data for all regions by habitat type are shown in (b). Data are plotted separately for populations in sixregions: (c) Northwest Atlantic; (d) Northeast Atlantic; (e) North Mid-Atlantic; (f) Northeast Pacific; (g) Australia and New Zealand; and(h) High Seas. The solid lines represent the fixed-effect mean yearly estimates, based on a mixed-effects model with population as a randomeffect. The shaded regions represent the 95% confidence intervals on the fixed-effect mean.
Hutchings et al. 1209
Published by NRC Research Press
49 mammals, 7 reptiles), one possible explanation for ourresult is that marine fishes have been declining at a fasterrate than other marine species.
One potential strength of our analysis is that it is limitedto data obtained from models prepared and peer-reviewed byfisheries stock assessment scientists. We elected not to in-clude trend data based solely on survey and fishery catchrates because of unestimated temporal and spatial biasesthat can exist in these data. However, by excluding catchand catch-rate data, we have also excluded data-poor speciesfrom areas where severe depletions are thought to have oc-curred (e.g., west Africa, southeast Asia), noncommercialspecies, and many species of conservation concern. For ex-ample, of the 38 marine fishes assessed as being endan-gered, threatened, or of special concern in Canadian waters(www.cosewic.gc.ca; accessed 4 June 2010), only eight arerepresented here. Our strict criterion also resulted in the ex-clusion of all but one chondrichthyan, a class of fishes con-sidered to be at heightened risk of extinction worldwide(Baum et al. 2003; Dulvy and Forrest 2010). Our findingsshould also be tempered by the fact that many specieswhose catches (direct and incidental) are illegal or unre-ported have not been included.
It is difficult to judge precisely how the inclusion of thesespecies might have influenced our results. On the one hand,their inclusion might have increased the percentage of popu-lations meeting the 2010 target. Of Hutchings and Baum’s(2005) 54 data sets that were based solely on catch rates,76% showed a positive slope difference, which might parti-ally account for the considerably higher percentage of popu-lations (81%) that they reported as having a positive slopedifference since 1992. On the other hand, because of theirgenerally higher pre-1992 slopes and higher post-1992 slopedifferences, inclusion of these populations may have had theeffect of accentuating some declines or of dampening someincreases in multispecies indices of abundance.
The present work represents a significant expansion of dataconsidered in the only previous analysis of changes in the rateof decline of marine fishes (Hutchings and Baum 2005). Mostpopulations assessed by national and international agencieswere declining before 1992. Since then, the rate of declinehas been reduced in 59% of populations, a pattern consistentwith the 2010 CBD target. For the remaining 41% of popula-tions, most of which comprise top predators, the rate of de-cline has increased; most of those in the North Atlanticremain below 0.5BMSY, whereas the majority of those else-where are above their MSY reference target. Although declin-ing trends have been reversed in many populations,meaningful progress in recovering marine fish biodiversitywill almost certainly involve the establishment of specific re-covery targets and specific time lines to achieve those targets(Hutchings and Baum 2005; Shelton and Sinclair 2008).
AcknowledgementsWe are pleased to acknowledge numerous colleagues and
institutions from around the world for sharing the fisheriesstock assessment data that comprise the RAM Legacy Data-base and that formed the primary empirical source of ouranalyses. In this regard, we also wish to thank members ofthe National Center for Ecological Analysis and Synthesis
(NCEAS) Working Group organized by R. Hilborn and B.Worm and to acknowledge the financial support for databaseconstruction provided by Natural Sciences and EngineeringResearch Council (NSERC) grants to J.A.H. and a CanadianFoundation for Innovation Grant to H. Lotze. The presentstudy was supported by a NSERC Discovery Grant toJ.A.H.; J.K.B. and O.P.J. were supported by David H. SmithConservation Research Fellowships and a Schmidt ResearchVessel Foundation Fellowship. We are also grateful to theanonymous referees who reviewed a previous version of themanuscript.
ReferencesBalmford, A., Crane, P., Dobson, A., Green, R.E., and Mace, G.M.
2005. The 2010 challenge: data availability, information needsand extraterrestrial insights. Philos. Trans R. Soc. B Biol. Sci.360(1454): 221–228. doi:10.1098/rstb.2004.1599.
Baum, J.K., Myers, R.A., Kehler, D.G., Worm, B., Harley, S.J., andDoherty, P.A. 2003. Collapse and conservation of shark populationsin the Northwest Atlantic. Science (Washington, D.C.), 299(5605):389–392. doi:10.1126/science.1079777. PMID:12532016.
Dulvy, N.K., and Forrest, R.E. 2010. Life histories, population dy-namics and extinction risks in chondrichthyans. In Sharks andtheir relatives II: biodiversity, adaptive physiology, and conser-vation. Edited by J.C. Carrier, J.A. Musick, and M.R. Heithaus.CRC Press, Boca Raton, Florida. pp. 639–679.
Durbin, J., and Koopman, S.J. 2001. Time series analysis by statespace methods. Oxford University Press, Oxford, UK.
Hilborn, R., and Stokes, K. 2010. Defining overfished stocks: havewe lost the plot? Fisheries, 35(3): 113–120. doi:10.1577/1548-8446-35.3.113.
Hutchings, J.A., and Baum, J.K. 2005. Measuring marine fish bio-diversity: temporal changes in abundance, life history and demo-graphy. Philos. Trans. R. Soc. B Biol. Sci. 360(1454): 315–338.doi:10.1098/rstb.2004.1586.
Schindler, D.E., Hilborn, R., Chasco, B., Boatright, C.P., Quinn,T.P., Rogers, L.A., and Webster, M.S. 2010. Population diversityand the portfolio effect in an exploited species. Nature (London),465(7298): 609–612. doi:10.1038/nature09060. PMID:20520713.
Shelton, P.A., and Sinclair, A.F. 2008. It’s time to sharpen our de-finition of sustainable fisheries management. Can. J. Fish.Aquat. Sci. 65(10): 2305–2314. doi:10.1139/F08-151.
Walpole, M., Almond, R.E.A., Besancon, C., Butchart, S.H.M.,Campbell-Lendrum, D., Carr, G.M., Collen, B., Collette, L., Da-vidson, N.C., Dulloo, E., Fazel, A.M., Galloway, J.N., Gill, M.,Goverse, T., Hockings, M., Leaman, D.J., Morgan, D.H.W., Re-venga, C., Rickwood, C.J., Schutyser, F., Simons, S., Statters-field, A.J., Tyrrell, T.D., Vie, J.-C., and Zimsky, M. 2009.Ecology. Tracking progress toward the 2010 biodiversity targetand beyond. Science (Washington, D.C.), 325(5947): 1503–1504. doi:10.1126/science.1175466. PMID:19762630.
World Wildlife Fund for Nature. 2008. Living planet report 2008.World Wide Fund for Nature (WWF), Gland, Switzerland.Av a i l a b l e f rom ht t p : / / a s se t s . pa nd a .o rg / downlo ad s /living_planet_report_2008.pdf
Worm, B., Hilborn, R., Baum, J.K., Branch, T.A., Collie, J.S.,Costello, C., Fogarty, M.J., Fulton, E.A., Hutchings, J.A., Jen-nings, S., Jensen, O.P., Lotze, H.K., Mace, P.M., McClanahan,T.R., Minto, C., Palumbi, S.R., Parma, A.M., Ricard, D., Rosen-berg, A.A., Watson, R., and Zeller, D. 2009. Rebuilding globalfisheries. Science (Washington, D.C.), 325(5940): 578–585.doi:10.1126/science.1173146. PMID:19644114.
1210 Can. J. Fish. Aquat. Sci. Vol. 67, 2010
Published by NRC Research Press