Embed Size (px)
Citation preview

1
Trends in prolonged sitting time among European adults: 27 country analysis
Karen Milton 1 2*, Joanne Gale2, Emmanuel Stamatakis3, Adrian Bauman2
1 British Heart Foundation Centre on Population Approaches for Non-Communicable
Disease Prevention, Nuffield Department of Population Health, University of Oxford, New
Richards Building, Old Road Campus, Headington, Oxford, OX3 7LF, England 2 Prevention research Collaboration, School of Public Health, University of Sydney, Charles
Perkins Centre, University of Sydney, Camperdown, NSW 2050, Australia 3 Exercise and Sport Sciences, Faculty of Health Sciences, University of Sydney, Charles
Perkins Centre, University of Sydney, Camperdown, NSW 2050, Australia
*Corresponding author
Corresponding author contact details:
British Heart Foundation Centre on Population Approaches for Non-Communicable Disease
Prevention
Nuffield Department of Population Health
University of Oxford
New Richards Building
Old Road Campus
Headington
Oxford
OX3 7LF
England
Tel: +44 (0)1865 289474
Co-authors email addresses: [email protected]

2
Trends in prolonged sitting time among European adults: 27 country analysis
Objective: To examine trends in adult sitting time across 27 European countries.
Method: Data were from the Eurobarometer surveys collected in 2002, 2005, and 2013.
Sitting time data were used to categorise respondents into ‘low’ (0 to 4h30mins), ‘middle’
(4h31 to 7h30mins), and ‘high’ levels of sitting (>7h30mins). We modelled the likelihood of
being in the high sitting group within a given country and overall across the three time
points, controlling for age, gender, education, employment status, and physical activity.
Results: In total 17 countries had sitting data at all three time points; among these countries
the prevalence of ‘high sitting’ decreased steadily from 23.1% (95% CI = 22.2 - 24.1) in 2002
to 21.8% (95% CI = 20.8 - 22.8) in 2005, and 17.8% (95% CI = 16.9 - 18.7) in 2013. A further
10 countries had data only over the latter two time points; among these countries the
prevalence of high sitting decreased from 27.7% (95% CI = 26.0 - 29.4) in 2005 to 19.0%
(95% CI = 17.6 - 20.5) in 2013.
Conclusion: Time spent in sedentary behaviour may not be increasing in the European
region, and prolonged sitting may, in fact, be decreasing. This finding has important
implications for the sedentary behaviour debate and the policy response.
Keywords: Sedentary behaviour, sitting time, trends, Europe, Eurobarometer
Highlights
The paper examines trends in sedentary behaviour in the European region
The results confirm that European adults spend large amounts of time sitting
Overall sitting time does not appear to be increasing in the European region
In no country does there appear to be a consistent trend towards more sitting

3
Introduction
It has long been established that participation in moderate to vigorous physical activity for
at least 150 minutes per week is associated with improved population health, and a reduced
risk of developing a wide range of non-communicable diseases (NCDs) (Physical Activity
Guidelines Advisory Committee, 2008; World Health Organization, 2010). Physical inactivity
(failure to meet recommended physical activity levels) has been identified as the fourth
leading risk factor for global mortality (World Health Organization, 2009) and is estimated to
account for 9% of premature deaths (Lee et al., 2012).
‘Sedentary behaviour’ has also emerged as a topical issue in public health. Sedentary
behaviour is defined as ‘any waking behaviour characterized by an energy low expenditure
while in a sitting or reclining posture’ (Sedentary Behaviour Research Network, 2012).
Because sedentary behaviour refers to time spent sitting/lying, it is not the same as a lack of
physical activity (Owen, Healy, Matthews, & Dunstan, 2010). Individuals can meet or exceed
the public health guidelines for physical activity but still spend a considerable amount of
time in sedentary behaviours (Edwardson et al., 2012; Sugiyama, Healy, Dunstan, Salmon, &
Owen, 2008). The most common form of sedentary behaviour is ‘sitting’, for example while
travelling by car, train or bus, at school/work, and watching television.
Epidemiological studies suggest that time spent in sedentary behaviours may be associated
with increased risk of all-cause mortality, cardiovascular mortality and cardiovascular
diseases, poor cardio-metabolic biomarker profiles, and increased risk of diabetes (Chau et
al. 2013; Katzmarzyk et al. 2009; Bauman et al. 2013; Wilmot et al. 2012); although several
studies have shown null associations between accelerometry based sedentary behaviour
and cardio-metabolic outcomes (Stamatakis, Davis, Stathi, & Hamer, 2012; Stamatakis,
Hamer, Tiling, & Lawlor, 2012). In addition, some recent evidence suggests the observed
risks of sedentary behaviour may not be independent of total physical activity levels (Maher,
Olds, Mire, & Katzmarzyk, 2014).
Over the past 50 years, increasing use of computers at work, labour saving devices in the
home, and building and transportation practices that require driving for most trips, have led

4
to reductions in physical activity levels globally (Brownson, Boehmer, & Luke, 2005; Knuth &
Hallal, 2009; Kohl III et al., 2012; Sallis et al., 2006). It is assumed that the reductions in
physical activity are accompanied by concomitant increases in sedentary behaviour (Owen,
Sparling, Healy, Dunstan, & Matthews, 2010; Thorp, Owen, Neuhaus, & Dunstan, 2011).
Interest in sedentary behaviour has grown exponentially in public health and the issue has
pervaded the scientific literature and the media. For example, in 2014 alone there were
over 340 scientific papers published with ‘sedentary’ in the title (Scopus, October 2014) and
the issue has appeared in many newspapers worldwide with headlines such as ‘Sitting is the
new smoking’ and ‘Sitting down is KILLING you!’ (Berry, 2013; Levine, 2014). There has also
been increasing mention of the need for sedentary behaviour reduction in national physical
activity policy recommendations, for example in Australia, Canada, Finland and Switzerland.
Although it is recognised that adults in Western countries spend large amounts of time
engaged in sedentary behaviours (Matthews et al., 2008; The Information Centre for Health
and Social Care, 2009), to date there has been limited population surveillance data to
determine whether time spent in sedentary behaviours is actually increasing. Gaining a
better understanding of trends in sedentary behaviour could inform public health policy and
the need for action. The aim of this study was to examine trends in sitting time across 27
European countries between 2002 and 2013 using Eurobarometer data, a standardised
long-term pan-European survey covering a wide range of social, economic, and health
issues.
Methods
Recruitment and Participants
The Eurobarometer, established in 1973, is a set of cross-national serial surveys conducted
on behalf of the European Commission (European Commission, 2014). Since 1990 (EB34),
the survey has consisted of two elements. The first is the ‘Standard EB’ which contains the
core set of questions which are similar in every survey. The second part is the ‘Special EB’
which is a supplementary optional survey on specific topic areas.

5
The 2002 Special EB (EB58.2) included physical activity and sitting time, using the
International Physical Activity Questionnaire (IPAQ; Craig et al., 2003). The IPAQ provides
data on total time spent in vigorous intensity activity, moderate intensity activity, and
walking. In addition, it includes a validated single-item question on sitting (Rosenberg, Bull,
Marshall, Sallis, & Bauman, 2008). These questions were also asked in EB64.3 conducted in
2005 and EB80.2 conducted in 2013, providing comparable information for our research
question, to examine trend data on adult sitting time in Europe.
Eurobarometer surveys cover the population, aged 15 years and over, of the respective
nationalities of the EU member states. For each survey independent samples were drawn
from each member state using a multi-stage, random (probability) sampling design. The
number of sampling points was drawn with probability proportional to population size (for a
total coverage of the country) and to population density. The sampling points represented
the whole territory of member states, and the distribution of the populations in terms of
metropolitan, urban, and rural areas. Sample sizes within countries ranged from 302 in
Northern Ireland in 2002 to 1039 in West Germany in 2013. The total participant numbers in
2002, 2005, and 2013 were 16 230, 29 193, and 27 919 respectively. All interviews were
face-to-face in the respondent's home and in the appropriate national language. More
information on the Eurobarometer series can be found at
http://www.gesis.org/en/eurobarometer/survey-series/standard-special-eb/.
Measures and Data Management
The IPAQ provided data on total physical activity (walking, moderate, and vigorous intensity
activity) in the last seven days and total sitting time on a typical week day. In the 2002 and
2005 surveys, participants were asked to estimate their usual weekday sitting time using an
open-ended response scale; however, for the 2013 survey participants were given a choice
of 11 categorical response options, ranging from ‘≤ 60 mins’ to ‘>8h30mins’. For the
purposes of this study, sitting time data over all three time points were used to categorise
respondents into ‘low’ (0 to 4h30mins), ‘middle’ (4h31 to 7h30mins), and ‘high’ sitting
groups (>7h30mins). The threshold to define high sitting was based on the cut point for
increased risk obtained from a meta-analysis of the dose-response relationship between
total sitting time and all-cause mortality (Chau et al., 2013). Similarly to estimated sitting

6
time, in the 2002 and 2005 surveys, participants were asked to estimate the amount of time
they spent doing physical activity (walking, moderate and vigorous intensity) using an open
ended response scale; however this was changed to a categorical response scale for the
2013 survey. Since the 2013 data contained only categorical data of minutes of physical
activity per day, it was not possible to calculate total physical activity using the IPAQ scoring
system. Instead, total physical activity was calculated by summing the total number of days
of walking, moderate, and vigorous intensity activity, and then classifying participants
according to quartiles within each survey year. To control for the influences of socio-
demographic factors on sitting time, data on age group (15-24yrs, 25-34yrs, 35-44yrs, 45-
54yrs, 55-64yrs and 65yrs and above), gender (male or female), education level (18 years
and less or 19 years and more), and employment status (student, employed, or
unemployed/retired) from each Eurobarometer survey were used in the analysis. The
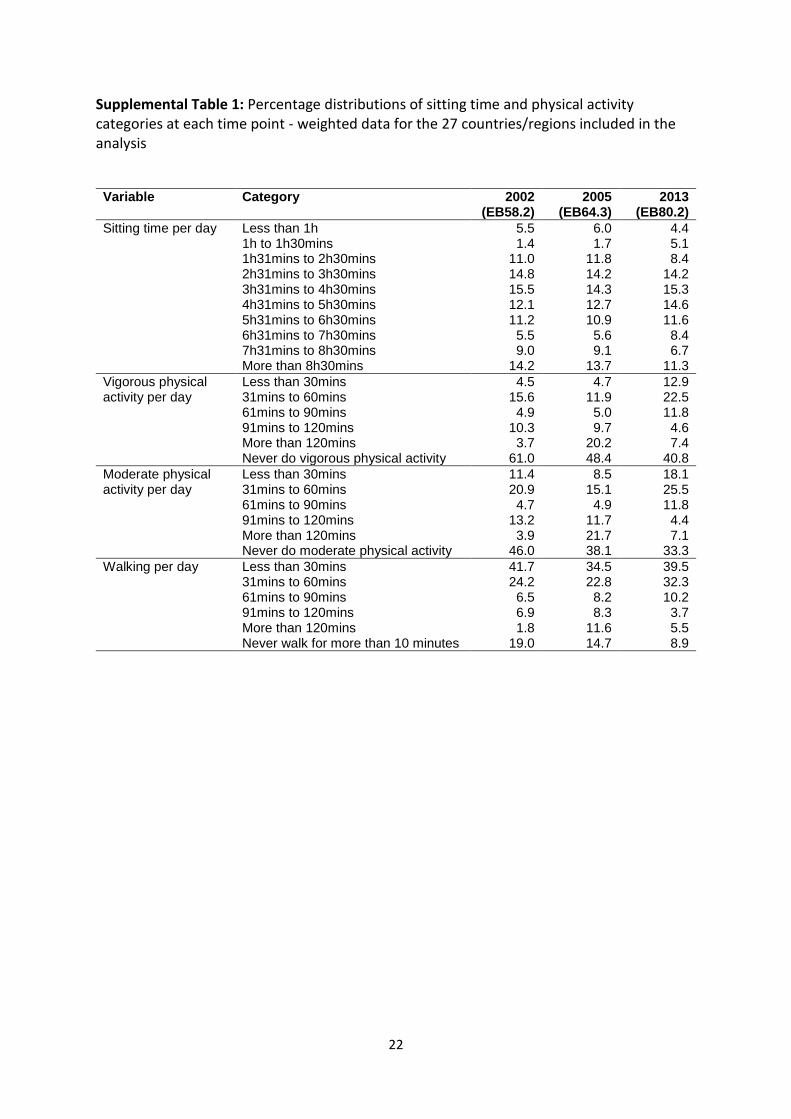
frequency of participants in each physical activity and sitting time category in each survey
year are shown in Supplemental Table 1.
Statistical Analysis
Descriptive statistics were calculated to show frequencies of each sample within each sitting
category (low, middle, and high) for each country across each survey year. Multiple logistic
regression was used to model the probability of being in the high sitting group within a
given country and overall across the three survey years. These models were controlled for
age group, gender, education level, employment status, and physical activity quartile. Post
stratification weights were applied across all analyses, where the data for each participant
was weighted using population within country and country population within the member
states. Post stratification weights are available in each Eurobarometer data set and are
calibrated according to either the entire European community or particular groupings. More
information can be found at http://www.gesis.org/en/eurobarometer/survey-
series/standard-special-eb/weighting-overview/.
Results
In total 17 countries/regions had valid sitting data in all three time points (2002, 2005, 2013)
and a further 10 countries/regions had valid data in the latter two time points only (2005,
7
2013). Table 1 presents the weighted mean, median, and interquartile range of sitting time
as well as the distribution of the key characteristics of the sample (age, gender, education,
employment status) in each of the three Eurobarometer time points. Supplemental Table 2
presents the weighted mean, median, and interquartile range of sitting time by country and
time point.
Temporal trends 2002-2013 across 17 countries/regions
Temporal trends in overall distribution of sitting
Figure 1 presents the weighted frequency distribution of low (0 to 4h30mins), middle (4h31
to 7h30mins), and high (>7h30mins) sitting in the pooled sample of countries that had data
in all three time points. The low sitting group remained stable, while the middle sitting
group increased; there was a slight increase in the middle sitting group between 2002 and
2005, and a more pronounced increase between 2005 and 2013. The prevalence of high
sitting decreased steadily from 23.1% (95% CI = 22.2 - 24.1) in 2002 to 21.8% (95% CI = 20.8 -
22.8) in 2005, and 17.8% (95% CI = 16.9 - 18.7) in 2013. Supplemental Figure 1 presents the
country specific prevalence trends in the three sitting time categories across the three time
points, and shows mostly the same pattern, with downward trends in the high sitting group
in 10 out of 17 countries.
Temporal trends in high sitting time (>7h30mins)
Figure 2 shows the weighted country-specific temporal trends in high sitting (>7h30mins)
for each of the 17 counties/regions with complete data. In some countries the proportion of
the population in the high sitting category has remained relatively stable over time;
however, more commonly there is a trend towards reductions in high sitting across the
three survey time points. In no country does there appear to be a trend towards greater
prevalence of high sitting. Supplemental Table 3 presents the multivariable-adjusted odds
for high sitting time for each country/region separately and all 17 countries pooled. The
adjusted odds of high sitting decreased gradually over time. Compared to 2002, the high
sitting time odds ratio was 0.87 (95% CI = 0.80 - 0.95) in 2005 and 0.69 (95% CI = 0.63 - 0.76)
in 2013. In comparison to 2002, lower odds for high sitting in 2013 were evident in 9 out of
17 countries/regions (Belgium, West Germany, East Germany, Italy, Denmark, Ireland,

8
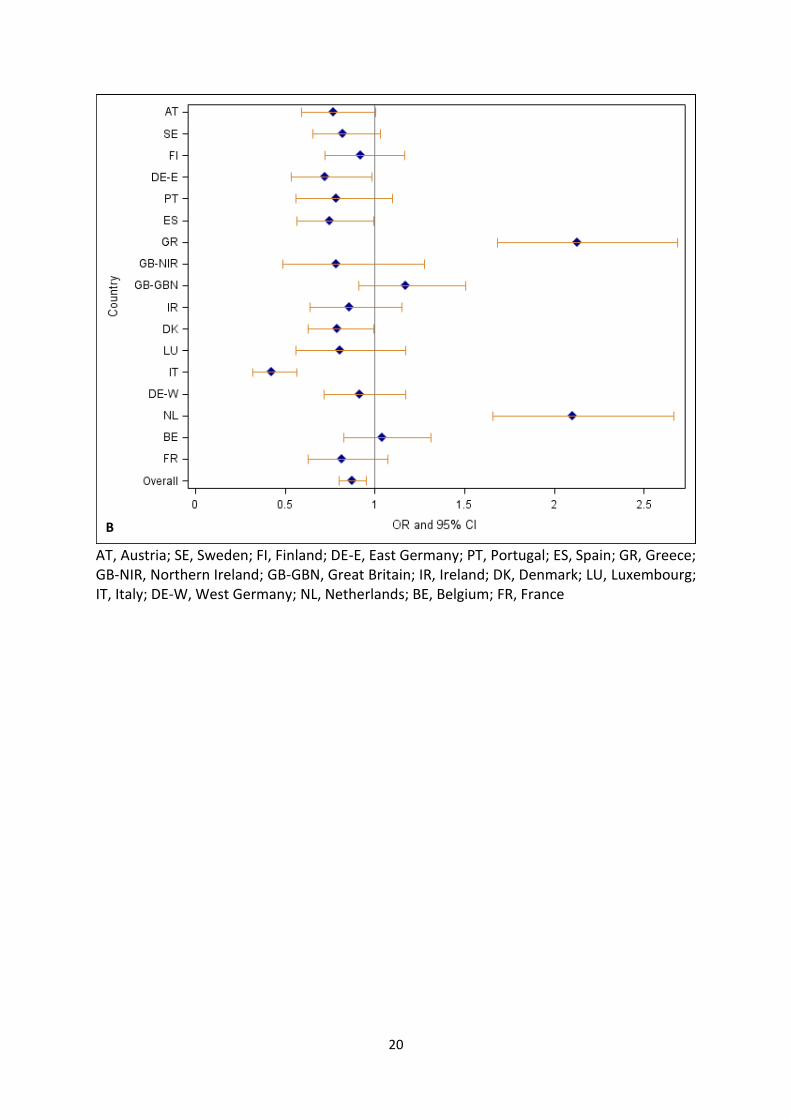
Greece, Spain, and Portugal). Figures 3A and 3B present the multivariable-adjusted odds
ratios and 95% CIs for high sitting in 2013 compared to 2002, and in 2005 compared to
2002, respectively. Figure 3A shows the tendency towards lower odds for high sitting in
2013 compared to 2002; Figure 3B shows that this trend towards a reduction in high sitting
was already present (although non-significant in most cases) in 2005.
Changes between 2005 and 2013 across 10 countries/regions
Changes in overall distribution of sitting
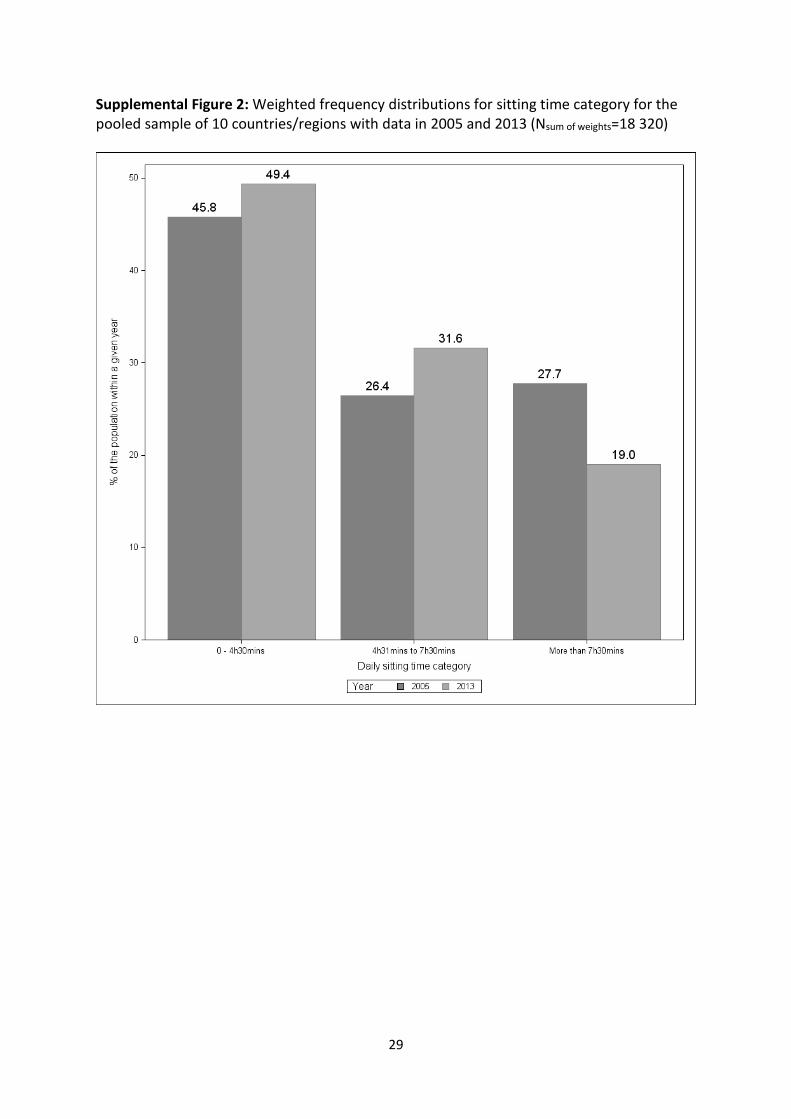
Supplemental Figure 2 presents the weighted frequency distribution of low (0 to 4h30mins),
middle (4h31 to 7h30mins), and high (>7h30mins) sitting in the pooled sample of
countries/regions that had data in 2005 and 2013 only. There was an increase in the
percentage of the pooled 10 country sample classified in the low sitting group, from 45.8%
(95% CI = 44.0 - 47.7) to 49.4% (95% CI = 47.5 - 51.2), and in the middle sitting group, from
26.4% (95% CI = 24.8 - 28.1) to 31.6% (95% CI = 29.9 - 33.3). The prevalence of high sitting
decreased from 27.7% (95% CI = 26.0 - 29.4) in 2005 to 19.0% (95% CI = 17.6 - 20.5) in 2013.
Supplemental Figure 3 presents the country-specific changes in the three sitting time
categories between 2005 and 2013. Consistent with the pooled analysis of the 10 countries,
reductions in high sitting prevalence was evident across most individual countries.
Overall changes between 2005 and 2013 in all 27 countries/regions
Changes in overall distribution of sitting
Supplemental Figure 4 presents the weighted frequency distribution of low (0 to 4h30mins),
middle (4h31 to 7h30mins), and high (>7h30mins) sitting in 2005 and 2013 in the pooled
sample of all 27 countries/regions. The proportion of the sample in the low sitting group
remained relatively stable over time, with 48.0% (95% CI = 47.0 - 49.0) in this category in
2002 and 47.4% (46.4 - 48.4) classified in the low sitting group in 2013. There was an
increase between 2005 and 2013 in the percentage of the sample in the middle sitting
group, from 29.2% (95% CI = 28.3 - 30.2) to 34.6% (95% CI = 33.7 - 35.6), and a decrease in
the percentage of the sample in the high sitting group, from 22.8% (95% CI = 22.0 - 23.6) to
18.0% (95% CI = 17.2 - 18.8).

9
Changes in high sitting time (>7h30mins)
When all 27 countries were pooled, the odds of high sitting were lower in 2013 compared to
2005 (OR = 0.79, 95% CI = 0.73 - 0.86). Figure 4 presents the country-specific multivariable-
adjusted odds ratios and 95% CIs for high sitting in 2013 compared to 2005. Although there
was a tendency for lower likelihood of high sitting in the majority of countries, the
difference was statistically significant in 9 of the 27 countries/regions (Slovenia, Poland,
Czech Republic, Cyrpus, Hungary, Spain, Greece, Netherlands and Belgium). The only
countries where the likelihood of high sitting was higher in 2013 compared to 2005 were
Austria and France.
Discussion
The Eurobarometer is the first cross-national study to provide trend data on sitting time
among adults. This paper examined data from the Eurobarometer over three time points, to
determine whether time spent in sedentary behaviours has changed in the European region.
The results confirm that European adults spend large amounts of time engaged in sedentary
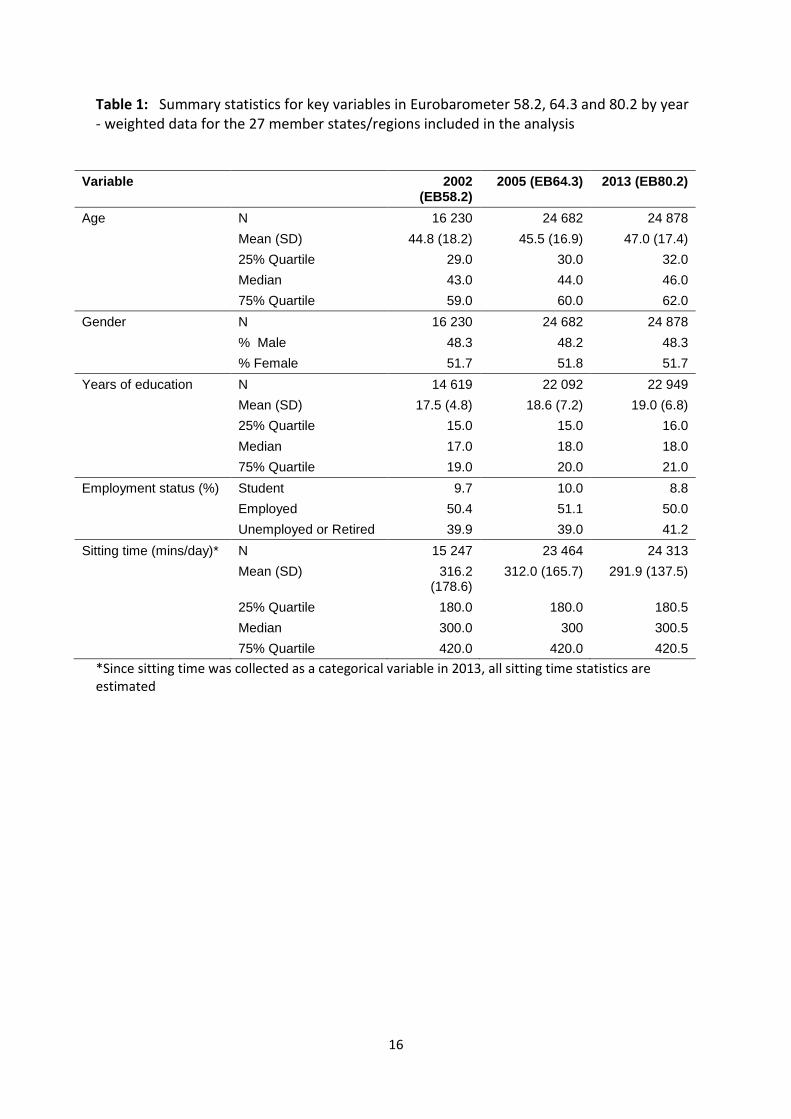
behaviours. Across all countries which were included in the analyses, the mean daily sitting
time in minutes was 316.2, 312.0, and 291.9 in 2002, 2005, and 2013 respectively, and the
median and interquartile range for all three surveys was around 300 (180 - 420) minutes.
These sitting time values are similar to what has been reported previously, both in Europe
and elsewhere (Bauman et al., 2011; Bennie et al., 2013). For example, an earlier analysis of
sitting time in Europe, using Eurobarometer data from 32 countries, reported a median
sitting time value of 300 minutes with an interquartile range of 180 - 420 (Bennie et al.,
2013), and an analysis of sitting time in 20 diverse countries (including both European and
non-European countries) reported a median value of 300 minutes/day with an interquartile
range of 180 - 480 minutes (Bauman et al., 2011).
Previous research has identified that each hour of daily sitting time is associated with a 2%
increase in all-cause mortality risk, after taking the protective health effects of physical

10
activity into account. However, when adults sit for 7 hours or more per day, the risk
increases by 5% for each incremental hour in daily sitting time (Chau et al., 2013).
Therefore, people who sit for more than 7 hours per day are at particularly high risk of the
adverse health consequences of sedentary behaviour. For the current study we were
restricted by the categorical response scale used in the Eurobarometer 80.2 (2013), and
consequently we used a category of greater than 7h30mins to define ‘high sitting time’, as
opposed to the previously identified threshold of 7 hours (Chau et al., 2013).
The analyses were undertaken in two parts; the first included countries/regions with data
from all three time points (2002, 2005, 2013). This grouping of 17 countries/regions are of
particular interest, as the three time points provide more robust evidence on the pattern of
change in sedentary behaviour over time. The current research found that across these
three time points the overall proportion of participants in the low sitting category remained
relatively stable; however the proportion in the middle category steadily increased, while
the proportion in the high category steadily decreased. Although there were variations in
the pattern of change between countries, in no country does there appear to be a
consistent trend towards a greater prevalence of high sitting.
The second part of the analysis included the 10 countries/regions with data for the latter
two time points only. Between 2005 and 2013, these countries demonstrated an increase in
the proportion of participants in the low and middle sitting categories and a decrease in the
high sitting category. The reduction in high sitting was particularly pronounced among these
10 countries. Across all 27 countries/regions, the results show an overall significant
reduction in the proportion of participants in the most at risk (high sitting) group in 2013 in
comparison to 2005. Although the sitting time question has remained consistent, the
response scale differed between the 2005 and 2013 surveys, which may have confounded
these results.
While several studies have documented trends towards lower overall physical activity levels
(Brownson et al., 2005; Knuth & Hallal, 2009; Kohl III et al., 2012; Sallis et al., 2006) and
declines in occupational physical activity, for example in the USA and in Norway (Church et
al., 2011; Graff-Iversen, Skurtveit, Sørensen, & Nybø, 2001), particularly over the past 50

11
years, studies have not assessed whether there has been an overall change in total sitting
time. While physical activity surveillance has a relatively long history, sedentary behaviour
surveillance is a relatively new development. Thus, it has previously been assumed that as
physical activity decreases, sedentary behaviour increases, although to date there has been
limited longitudinal trend data on sedentary behaviour to support this supposition.
This is one of the first studies to report trends in sedentary behaviour over time using a
standardised long-term survey. The results suggest that, contrary to popular belief, sitting
time may not be increasing in the European region. Although little change was observed in
the proportion of people in the low and middle sitting categories, there appears to have
been a decline over time in the proportion of people who sit for more than 7h30mins per
day. This is an important finding for public health policy, given the emerging risks associated
with prolonged sitting.
Incorporating serial questions on sedentary behaviour into other surveillance systems is
needed to corroborate or refute these Eurobarometer observations. In addition, further
research is needed to explore the factors which may be contributing to the reported
reduction in sitting time across the European region. These findings point to the need for
further investment into understanding the prevalence and trends in sedentary behaviour, as
well as the health consequences of prolonged sitting, to inform an appropriate and
proportional policy response to the issue.
Several limitations of this research should be acknowledged. Firstly, sitting data from the
Eurobarometer are from a self-report survey (IPAQ). Although the IPAQ is a validated tool,
with the question on sitting time demonstrating better validity coefficients than the physical
activity questions (Craig et al., 2003; Rosenberg et al., 2008), all self-report tools are subject
to social desirability and recall biases (Shephard, 2003). Previous research suggests that
participants are likely to under-estimate the time that they spend sitting when completing
self-report surveys (Clemes, David, Zhao, Han, & Brown, 2012), but there is no information
on whether this bias is differential over time. In addition, for the 2013 Eurobarometer
survey the response scale for the sitting time question was changed from an open ended to

12
a categorical response scale. It is possible that the revised response scale influenced how
respondents perceived and reported their sitting time.
It is likely that increased media attention on sedentary behaviour has led to increased public
awareness of the issue. This media attention may have led to reductions in sedentary
behaviour; it is also possible however, that increased awareness has simply led people to
under-report their sedentary time, rather than influencing their behaviour. This supports
the need for objective population assessment of sedentary behaviour. Finally, the
Eurobarometer uses population-based samples, and not true representative sampling;
however, the sampling methods (and therefore selection bias) have remained consistent
over-time, and thus the Eurobarometer provides a useful tool for comparing trends, despite
not being truly representative at the country level.
Conclusion
The current study used data from the Eurobarometer survey at three time points over the
past 15 years, to examine trends in adult sitting time in the European region. The results
show that, contrary to recent reports (Owen, Sparling, et al., 2010; Thorp et al., 2011), time
spent in sedentary behaviour may not be increasing in the European region, and prolonged
sitting may, in fact, be decreasing. This finding emphasises the importance of collecting
comparable cross-country data, monitored over time. It also emphasises the need to better
understand the prevalence, trends, and health consequences of sedentary behaviour to
inform the scale of the response afforded by communities, the media and policymakers.
Conflict of interest statement:
The authors declare that they have no conflicts of interest.
Acknowledgement:
Eurobarometer data provided by the GESIS Social Science Data archive, at the Leibniz
Institute for the Social Sciences, Germany.
13
References
Bauman, A., Ainsworth, B., Sallis, J., Hagströmer, M., Craig, C., Bull, F., … Group, I. (2011). The descriptive epidemiology of sitting - A 20-country comparison using the International Physical Activity Questionnaire (IPAQ). American Journal of Preventive Medicine, 41(2), 228–235.
Bauman, A., Chau, J., Ding, D., & Bennie, J. (2013). Too much sitting and cardio-metabolic risk: An update of epidemiological evidence. Current Cardiovascular Risk Reports, DOI 10.1007/s12170–013–0316–y.
Bennie, J., Chau, J., van der Ploeg, H., Stamatakis, E., Do, A., & Bauman, A. (2013). The prevalence and correlates of sitting in European adults - a comparison of 32 Eurobarometer-participating countries. International Journal of Behavioural Nutrition and Physical Activity, 10, 107.
Berry, S. (2013, May 30). Sitting is the new smoking. The Sydney Morning Herald. Retrieved from http://www.smh.com.au/lifestyle/life/sitting-is-the-new-smoking-20130529-2nca0.html
Brownson, R., Boehmer, T., & Luke, D. (2005). Declining rates of physical activity in the United States: what are the contributors? Annual Review of Public Health, 26, 421–443.
Chau, J., Grunseit, A., Chey, T., Stamatakis, E., Brown, W., Matthews, C., … van der Ploeg, H. (2013). Daily sitting time and all-cause mortality: A meta-analysis. PLoS One, 8(11), e80000.
Church, T., Thomas, D., Tudor-Locke, C., Katzmarzyk, P., Earnest, C., Rodarte, R., … Bouchard, C. (2011). Trends over 5 decades in U.S. occupation-related physical activity and their associations with obesity. PLoS One, 6(5), e19657. doi:10.1371/journal.pone.0019657.
Clemes, S., David, B., Zhao, Y., Han, X., & Brown, W. (2012). Validity of two self-report measures of sitting time. Journal of Physical Activity and Health, 9(4), 533–539.
Craig, C., Marshall, A., Sjöström, M., Bauman, A., Booth, M., Ainsworth, B., … Oja, P. (2003). International physical activity questionnaire: 12-country reliability and validity. Medicine and Science in Sports and Exercise, 35(8), 1381–1395.
Edwardson, C., Gorely, T., Davies, M., Gray, L., Khunti, K., Wilmot, E., … Biddle, S. (2012). Association of sedentary behaviour with metabolic syndrome: a meta-analysis. PLoS One, 7(4), e34916. doi: 10.1371/journal.pone.0034916.
European Commission. (2014). Public opinion. Retrieved from http://ec.europa.eu/public_opinion/index_en.htm

14
Graff-Iversen, S., Skurtveit, S., Sørensen, M., & Nybø, A. (2001). Occupational physical activity and overweight: what are the associations? Tidsskr Nor Lægeforen, 121, 2579–2583.
Hallal, P., Andersen, L., Bull, F., Guthold, R., Haskell, W., & Ekelund, U. (2012). Global physical activity levels: Surveillance progress, pitfalls, and prospects. The Lancet, 380, 247–257.
Katzmarzyk, P., Church, T., Craig, C., & Bouchard, C. (2009). Sitting time and mortality from all causes, cardiovascular disease, and cancer. Medicine & Science in Sports & Exercise, 41(5), 998–1005.
Knuth, A., & Hallal, P. (2009). Temporal trends in physical activity: a systematic review. Journal of Physical Activity and Health, 6, 548–559.
Kohl III, H., Craig, C., Lambert, E., Inoue, S., Alkandari, J., Leetongin, G., … for the Lancet Physical Activity Series Working Group. (2012). The pandemic of physical inactivity: Global action for public health. Lancet, 380, 294–305.
Lee, I., Shiroma, E., Lobelo, F., Puska, P., Blair, S., & Katzmarzyk, P. (2012). Effects of physical inactivity on major non-communicable diseases worldwide: An analysis of burden of disease and life expectancy. The Lancet, 380, 219–229.
Levine, J. (2014, July 26). Sitting down is KILLING you! Daily Mail Australia. Retrieved from http://www.dailymail.co.uk/news/article-2706317/Sitting-KILLING-Heart-disease-obesity-depression-crumbling-bones-terrifying-new-book-doctor-reveals-linked-hours-spend-chairs.html
Maher, C., Olds, T., Mire, E., & Katzmarzyk, P. (2014). Reconsidering the Sedentary Behaviour Paradigm. PLoS One, 9(1), e86403. doi:doi:10.1371/ journal.pone.0086403
Matthews, C., Chen, K., Freedson, P., Buchowski, M., Beech, B., Pate, R., & Troiano, R. (2008). Amount of time spent in sedentary behaviors in the United States, 2003-2004. American Journal of Epidemiology, 167(7), 875–881.
Owen, N., Healy, G., Matthews, C., & Dunstan, D. (2010). Too much sitting: the population health science of sedentary behavior. Exercise and Sport Sciences Reviews, 38(3), 105–113.
Owen, N., Sparling, P., Healy, G., Dunstan, D., & Matthews, C. (2010). Sedentary behavior: Emerging evidence for a new health risk. Mayo Clinic Proceedings, 85(12), 1138–1141.
Physical Activity Guidelines Advisory Committee. (2008). Physical activity guidelines advisory committee report 2008. Washington, DC.
Rosenberg, D., Bull, F., Marshall, A., Sallis, J., & Bauman, A. (2008). Assessment of sedentary behavior with the International Physical Activity Questionnaire. Journal of Physical Activity and Health, 5(Supplement 1), S30–S44.
15
Sallis, J., Cervero, R., Ascher, W., Henderson, K., Kraft, M., & Kerr, J. (2006). An ecological approach to creating active living communities. Annual Reviews of Public Health, 27, 297–322.
Sedentary Behaviour Research Network. (2012). Letter to the editor: standardized use of the terms “sedentary” and “sedentary behaviours.” Applied Physiology, Nutrition, and Metabolism, 37(3), 540–542.
Shephard, R. (2003). Limits to the measurement of habbuitual physical activity by questionnaires. British Journal of Sports Medicine, 37, 197–206.
Stamatakis, E., Davis, M., Stathi, A., & Hamer, M. (2012). Associations between multiple indicators of objectively-measured and self-reported sedentary behaviour and cardiometabolic risk in older adults. Preventive Medicine, 54, 82–87.
Stamatakis, E., Hamer, M., Tiling, K., & Lawlor, D. (2012). Sedentary time in relation to cardio-metabolic risk factors: differential associations for self-report versus accelerometry in working age adults. International Journal of Epidemiology, 41(5), 1328 – 1337.
Sugiyama, T., Healy, G., Dunstan, D., Salmon, J., & Owen, N. (2008). Joint associations of multiple leisure-time sedentary behaviours and physical activity with obesity in Australian adults. International Journal of Behavioural Nutrition and Physical Activity, 5(35).
The Information Centre for Health and Social Care. (2009). Health Survey for England 2008. Volume 1. Physical activity and fitness. Leeds, UK.
Thorp, A., Owen, N., Neuhaus, M., & Dunstan, D. (2011). Sedentray behaviors and subsequent health outcomes in adults: A systematic review of longitudinal studies. American Journal of Preventive Medicine, 41(2), 207–215.
Wilmot, E., Edwardson, C., Achana, F., Davies, M., Gorely, T., Gray, L., … Biddle, S. (2012). Sedentary time in adults and the association with diabetes, cardiovascular disease and death: systematic review and meta-analysis. Diabetologia, 55(11), 2895–2905.
World Health Organization. (2009). Global health risks: Mortality and burden of disease attributable to selected major risks. Geneva.
World Health Organization. (2010). Global recommendations on physical activity for health. Geneva.
16
Table 1: Summary statistics for key variables in Eurobarometer 58.2, 64.3 and 80.2 by year - weighted data for the 27 member states/regions included in the analysis
Variable 2002 (EB58.2)
2005 (EB64.3) 2013 (EB80.2)
Age N 16 230 24 682 24 878
Mean (SD) 44.8 (18.2) 45.5 (16.9) 47.0 (17.4)
25% Quartile 29.0 30.0 32.0
Median 43.0 44.0 46.0
75% Quartile 59.0 60.0 62.0
Gender N 16 230 24 682 24 878
% Male 48.3 48.2 48.3
% Female 51.7 51.8 51.7
Years of education N 14 619 22 092 22 949
Mean (SD) 17.5 (4.8) 18.6 (7.2) 19.0 (6.8)
25% Quartile 15.0 15.0 16.0
Median 17.0 18.0 18.0
75% Quartile 19.0 20.0 21.0
Employment status (%) Student 9.7 10.0 8.8
Employed 50.4 51.1 50.0
Unemployed or Retired 39.9 39.0 41.2
Sitting time (mins/day)* N 15 247 23 464 24 313
Mean (SD) 316.2 (178.6)
312.0 (165.7) 291.9 (137.5)
25% Quartile 180.0 180.0 180.5
Median 300.0 300 300.5
75% Quartile 420.0 420.0 420.5
*Since sitting time was collected as a categorical variable in 2013, all sitting time statistics are estimated

17
Figure 1: Weighted frequency distributions for sitting time category for the pooled sample of 17 countries/regions with data in all three time points (Nsum of weights=47 486)

18
Figure 2: Weighted country-specific temporal trends in the prevalence of high sitting time
(>7h30mins)

19
Figure 3: Country-specific adjusted odds ratios and 95% CIs for high sitting time (>7h30mins) in 2013 compared to 2002 (A); and in 2005 compared to 2002 (B) for the 17 countries/regions with data in all three time points
A
20
AT, Austria; SE, Sweden; FI, Finland; DE-E, East Germany; PT, Portugal; ES, Spain; GR, Greece; GB-NIR, Northern Ireland; GB-GBN, Great Britain; IR, Ireland; DK, Denmark; LU, Luxembourg; IT, Italy; DE-W, West Germany; NL, Netherlands; BE, Belgium; FR, France
B

21
Figure 4: Country-specific adjusted odds ratios and 95% CIs for high sitting time (>7h30mins) in 2013 compared to 2005 in all 27 countries/regions
SI, Slovenia; SK, Slovakia (Slovak Republic); PL, Poland; MT, Malta; LT, Lithuania ; LV, Latvia; HU, Hungary; EE, Estonia; CZ, Czech Republic ; CY, Cyprus; AT, Austria; SE, Sweden; FI, Finland; DE-E, East Germany; PT, Portugal; ES, Spain; GR, Greece; GB-NIR, Northern Ireland; GB-GBN, Great Britain; IR, Ireland; DK, Denmark; LU, Luxembourg; IT, Italy; DE-W, West Germany; NL, Netherlands; BE, Belgium; FR, France
22
Supplemental Table 1: Percentage distributions of sitting time and physical activity categories at each time point - weighted data for the 27 countries/regions included in the analysis
Variable Category 2002 (EB58.2)
2005 (EB64.3)
2013 (EB80.2)
Sitting time per day Less than 1h 5.5 6.0 4.4 1h to 1h30mins 1.4 1.7 5.1 1h31mins to 2h30mins 11.0 11.8 8.4 2h31mins to 3h30mins 14.8 14.2 14.2 3h31mins to 4h30mins 15.5 14.3 15.3 4h31mins to 5h30mins 12.1 12.7 14.6 5h31mins to 6h30mins 11.2 10.9 11.6 6h31mins to 7h30mins 5.5 5.6 8.4 7h31mins to 8h30mins 9.0 9.1 6.7 More than 8h30mins 14.2 13.7 11.3
Vigorous physical activity per day
Less than 30mins 4.5 4.7 12.9 31mins to 60mins 15.6 11.9 22.5 61mins to 90mins 4.9 5.0 11.8 91mins to 120mins 10.3 9.7 4.6 More than 120mins 3.7 20.2 7.4 Never do vigorous physical activity 61.0 48.4 40.8
Moderate physical activity per day
Less than 30mins 11.4 8.5 18.1 31mins to 60mins 20.9 15.1 25.5 61mins to 90mins 4.7 4.9 11.8 91mins to 120mins 13.2 11.7 4.4 More than 120mins 3.9 21.7 7.1 Never do moderate physical activity 46.0 38.1 33.3
Walking per day Less than 30mins 41.7 34.5 39.5 31mins to 60mins 24.2 22.8 32.3 61mins to 90mins 6.5 8.2 10.2 91mins to 120mins 6.9 8.3 3.7 More than 120mins 1.8 11.6 5.5 Never walk for more than 10 minutes 19.0 14.7 8.9

23
Supplemental Table 2: Summary statistics for sitting time (minutes) in Eurobarometer 58.2, 64.3 and 80.2 by year and country (weighted data)
Country Statistic 2002 2005 2013
France N 988 976 1011
Mean (SD) 292.2 (266.4) 286.7 (301.8) 292.6 (260.3)
50% Quartile [25%, 75%] 240 [180,390] 240 [180,360] 300.5 [180.5,420.5]
Belgium N 1016 992 1072
Mean (SD) 320.9 (119.8) 343.4 (143.2) 300.7 (109.3)
50% Quartile [25%, 75%] 300 [180,480] 300 [180,480] 300.5 [180.5,420.5]
Netherlands N 970 1011 1026
Mean (SD) 357.3 (155.4) 409.7 (189.5) 376.1 (123.1)
50% Quartile [25%, 75%] 300 [240,480] 360 [240,540] 360.5 [300.5,540]
West Germany N 917 894 1010
Mean (SD) 337.3 (315.3) 337.1 (312.7) 297.5 (256.9)
50% Quartile [25%, 75%] 300 [180,480] 300 [181,465] 300.5 [180.5,420.5]
Italy N 974 960 965
Mean (SD) 334.7 (266) 267.7 (302) 266.7 (253.3)
50% Quartile [25%, 75%] 300 [180,480] 240 [120,360] 240.5 [180.5,360.5]
Luxembourg N 564 492 504
Mean (SD) 332.7 (32.4) 323.7 (42.9) 322.1 (36.5)
50% Quartile [25%, 75%] 300 [180,480] 300 [180,480] 300.5 [180.5,480.5]
Denmark N 955 977 1002
Mean (SD) 392 (87.2) 387.2 (103.6) 368.5 (75.6)
50% Quartile [25%, 75%] 360 [240,480] 360 [240,490] 360.5 [240.5,480.5]
Ireland N 985 894 981
Mean (SD) 286.4 (65) 290.8 (74.5) 266.8 (64.9)
50% Quartile [25%, 75%] 240 [180,360] 240 [180,360] 240.5 [180.5,360.5]
Great Britain N 980 900 982
Mean (SD) 294.7 (278.6) 324.5 (339.6) 299.8 (261.9)
50% Quartile [25%, 75%] 240 [180,360] 300 [180,420] 300.5 [180.5,420.5]
Northern Ireland
N 285 286 320
Mean (SD) 301 (84.1) 299.2 (90.2) 278.6 (82.6)
50% Quartile [25%, 75%] 240 [180,420] 240 [180,360] 240.5 [180.5,420.5]
Greece N 984 996 1005
Mean (SD) 309.6 (123.7) 370.8 (124.9) 304.7 (108.4)
50% Quartile [25%, 75%] 300 [180,420] 360 [240,480] 300.5 [180.5,420.5]
Spain N 936 949 1005
Mean (SD) 295.6 (221.2) 281.4 (244.7) 265 (201.9)
50% Quartile [25%, 75%] 240 [180,385] 244 [179,366] 240.5 [180.5,360.5]
Portugal N 951 1000 996
Mean (SD) 234.1 (97.4) 198.4 (119.6) 230.9 (106.1)
50% Quartile [25%, 75%] 180 [120,300] 180 [60,300] 180.5 [120.5,360.5]
East Germany N 913 530 555
Mean (SD) 339.9 (140.1) 313.6 (202.9) 284.4 (182.7)
50% Quartile [25%, 75%] 300 [180,480] 300 [180,420] 240.5 [180.5,360.5]
Finland N 994 979 958
Mean (SD) 362 (87.8) 345.9 (109.8) 339.4 (74.9)
50% Quartile [25%, 75%] 330 [210,480] 300 [180,480] 360.5 [240.5,420.5]
Sweden N 957 1030 993
Mean (SD) 355 (110.4) 343.2 (120.3) 356.7 (97.2)
50% Quartile [25%, 75%] 300 [240,480] 300 [180,480] 360.5 [240.5,480.5]
Austria N 878 1002 961
Mean (SD) 305.6 (106.2) 302.9 (108.4) 329.2 (85.7)
50% Quartile [25%, 75%] 270 [180,420] 300 [180,400] 300.5 [240.5,420.5]
Cyprus N 467 498
Mean (SD) 367.7 (52.6) 298.2 (44.5)

24
50% Quartile [25%, 75%] 360 [210,480] 300.5 [180.5,420.5]
Czech Republic
N 943 1005
Mean (SD) 386 (144.1) 326.9 (115.3)
50% Quartile [25%, 75%] 360 [240,540] 300.5 [240.5,480.5]
Estonia N 950 1002
Mean (SD) 335.4 (43.1) 313.6 (36.9)
50% Quartile [25%, 75%] 300 [180,480] 300.5 [180.5,420.5]
Hungary N 969 989
Mean (SD) 271.1 (127.8) 252.6 (103.8)
50% Quartile [25%, 75%] 240 [150,360] 240.5 [120.5,360.5]
Latvia N 1000 996
Mean (SD) 273.2 (56.7) 290.1 (44.4)
50% Quartile [25%, 75%] 240 [120,420] 300.5 [180.5,420.5]
Lithuania N 872 1006
Mean (SD) 265.7 (81.6) 298.1 (60.2)
50% Quartile [25%, 75%] 240 [120,360] 300.5 [180.5,420.5]
Malta N 444 492
Mean (SD) 250.9 (37.1) 253.7 (32.9)
50% Quartile [25%, 75%] 240 [120,360] 240.5 [120.5,360.5]
Poland N 964 892
Mean (SD) 335 (272.5) 279.5 (221.7)
50% Quartile [25%, 75%] 300 [180,480] 240.5 [180.5,420.5]
Slovakia N 982 976
Mean (SD) 321.3 (89.9) 311.7 (81.9)
50% Quartile [25%, 75%] 300 [180,420] 300.5 [180.5,420.5]
Slovenia N 1005 1111
Mean (SD) 309.1 (59.8) 249 (47.3)
50% Quartile [25%, 75%] 240 [180,480] 240.5 [120.5,360.5]
*Since sitting time was collected as a categorical variable in 2013, all sitting time statistics are estimated

25
Supplemental Table 3: Odds Ratios (±95%CI) from a series of logistic regressions modelling the probability of being in the highest sitting category by country (values displayed in Figures 3 and 4)
Year Year
Compared Country
Lower 95% CI
OR Upper 95%
CI
2013 2002 Austria 0.77 1.01 1.31
Sweden 0.74 0.95 1.22
Finland 0.65 0.85 1.10
East Germany 0.35 0.49 0.68
Portugal 0.47 0.64 0.88
Spain 0.31 0.43 0.58
Greece 0.60 0.77 0.99
Northern Ireland 0.62 1.00 1.60
Great Britain 0.75 0.97 1.25
Ireland 0.46 0.65 0.90
Denmark 0.60 0.76 0.95
Luxembourg 0.57 0.80 1.13
Italy 0.24 0.32 0.43
West Germany 0.55 0.71 0.91
Netherlands 0.92 1.18 1.51
Belgium 0.46 0.59 0.75
France 0.80 1.03 1.33
Overall 0.63 0.69 0.76
2005 2002 Austria 0.59 0.77 1.00
Sweden 0.65 0.82 1.03
Finland 0.72 0.92 1.17
East Germany 0.53 0.72 0.98
Portugal 0.56 0.78 1.10
Spain 0.56 0.75 0.99
Greece 1.68 2.13 2.69
Northern Ireland 0.49 0.79 1.27
Great Britain 0.91 1.17 1.51
Ireland 0.64 0.86 1.15
Denmark 0.63 0.79 1.00
Luxembourg 0.56 0.81 1.17
Italy 0.32 0.43 0.56
West Germany 0.72 0.92 1.17
Netherlands 1.66 2.10 2.67
Belgium 0.83 1.04 1.31
France 0.63 0.82 1.07
Overall 0.80 0.87 0.95
2013
2005 Slovenia 0.33 0.43 0.57
Slovakia 0.64 0.82 1.07
Poland 0.38 0.49 0.63
Malta 0.78 1.29 2.12
Lithuania 0.59 0.78 1.03
Latvia 0.75 0.98 1.27
Hungary 0.47 0.63 0.84
Estonia 0.67 0.85 1.08
Czech Republic 0.47 0.59 0.73
Cyprus 0.33 0.46 0.66
Austria 1.07 1.39 1.81
Sweden 0.96 1.23 1.56
Finland 0.76 0.98 1.27
East Germany 0.50 0.74 1.08
Portugal 0.64 0.90 1.26

26
Spain 0.46 0.64 0.88
Greece 0.32 0.40 0.51
Northern Ireland 0.84 1.35 2.17
Great Britain 0.70 0.89 1.15
Ireland 0.57 0.80 1.12
Denmark 0.81 1.02 1.29
Luxembourg 0.71 1.04 1.53
Italy 0.58 0.81 1.11
West Germany 0.64 0.83 1.07
Netherlands 0.50 0.62 0.77
Belgium 0.47 0.59 0.76
France 1.04 1.36 1.77
Overall 0.73 0.79 0.86
Italics = 95% CI does not span 1.0

27
Supplemental Figure 1: Weighted frequency distributions for sitting time category for each country/region with data in all three time points

28
29
Supplemental Figure 2: Weighted frequency distributions for sitting time category for the pooled sample of 10 countries/regions with data in 2005 and 2013 (Nsum of weights=18 320)

30
Supplemental Figure 3: Weighted frequency distributions for sitting time category for each of the 10 countries/regions with data in 2005 and 2013

31
Supplemental Figure 4: Weighted frequency distributions for sitting time category in 2005 and 2013 for the pooled sample of 27 countries/regions (Nsum of weights=49 559)


![#APMP2016 - cdn.ymaws.com · Vivekananda ) #APMP2016 Spine - Autonomic Nervous System ... Research has linked health risks with both sitting and standing for prolonged periods.[1]](https://img.pdfslide.us/doc/110x75/5e764e6e2d5f7669f52d12f8/apmp2016-cdnymawscom-vivekananda-apmp2016-spine-autonomic-nervous-system.jpg)