Embed Size (px)
Citation preview
Journal of the American College of Cardiology Vol. 61, No. 22, 2013� 2013 by the American College of Cardiology Foundation ISSN 0735-1097/$36.00Published by Elsevier Inc. http://dx.doi.org/10.1016/j.jacc.2013.03.023
Cardiovascular Risk
Trends in Predicted 10-Year Risk ofCoronary Heart Disease and Cardiovascular DiseaseAmong U.S. Adults From 1999 to 2010
Earl S. Ford, MD, MPH
Atlanta, Georgia
From the D
Prevention
Atlanta, Ge
and do not n
and Prevent
contents of
Manuscri
2013, accept
Objectives T
ivision of Population H
and Health Promotion,
orgia. The findings and co
ecessarily represent the of
ion. Dr. Ford has report
this paper to disclose.
pt received November 28
ed March 12, 2013.
he objective of this study was to examine trends in predicted 10-year risk for coronary heart disease (CHD) andcardiovascular disease (CVD) from 1999 to 2000 and from 2009 to 2010 among adults in the United States.
Background E
xamining trends in predicted risk for CHD and CVD may offer insights into the direction of cardiovascular health.Methods D
ata from 7,751 fasting participants, ages 30 to 74 years, of 6 consecutive 2-year cycles of the National Health andNutrition Examination Survey were used. Predicted 10-year risk for CHD and CVD was calculated using riskequations derived from data from the Framingham Heart Study.Results M
ean predicted 10-year risk for CHD was 7.2% during 1999 to 2000 and 6.5% during 2009 to 2010 (p for lineartrend ¼ 0.005), and for CVD it was 9.2% during 1999 to 2000 and 8.7% during 2009 to 2010 (p for linear trend ¼0.152). Mean predicted risk for CHD and CVD declined significantly among participants ages 40 to 49 years, 50 to59 years, 60 to 74 years, and among women. Mean predicted risk for CHD declined significantly among men andwhites but nonsignificantly among Mexican Americans (p for linear trend ¼ 0.067). Mean predicted risk increasednonsignificantly among African Americans for both CHD (p for linear trend ¼ 0.063) and CVD (p for linear trend ¼0.059). Of the modifiable cardiovascular risk factors included in the risk equations, favorable trends were noted formean systolic and diastolic blood pressure, mean concentrations of total cholesterol and high-density lipoproteincholesterol, and smoking status. The prevalence of diabetes mellitus worsened.Conclusions P
redicted 10-year risk for CHD improved modestly. Reversing the seemingly rising trend in risk among African-American adults should be a high priority. (J Am Coll Cardiol 2013;61:2249–52) ª 2013 by the American Collegeof Cardiology FoundationNational data about incident coronary heart disease (CHD)and cardiovascular disease (CVD) in the United States haveproven historically difficult to collect, and consequently,alternative sources of information are needed to generateinsights into this essential surveillance need. In recent years,several regional U.S. studies have shown decreases inincident CHD (1). Examining the trend in predicted risk forCHD and CVD represents a potential window into thefuture dynamics of incident CHD and CVD. Previousstudies have examined changes in predicted 10-year risk ofCHD using national data through 2004 (2,3). The objectiveof the current study is to examine recent trends in predictedrisk for CHD and CVD among U.S. adults.
ealth, National Center for Chronic Disease
Centers for Disease Control and Prevention,
nclusions in this article are those of the author
ficial position of the Centers for Disease Control
ed that he has no relationships relevant to the
, 2012; revised manuscript received January 30,
Methods
Data from 6 consecutive 2-year cycles of NHANES(National Health and Nutrition Examination Survey) from1999 to 2000 and 2009 to 2010 were used (4). Usinga multistage, stratified sampling design, NHANES selectednational samples representative of the civilian, noninstitu-tionalized U.S. population. Trained interviewers adminis-tered study questionnaires to participants in their homes andextended an invitation to participants to have an examina-tion at a mobile examination center where they were asked toundergo various examinations, provide a blood sample, andcomplete additional questionnaires. The response rates forall the surveys exceeded 70%. The National Center forHealth Statistics Research Ethics Review Board grantedapproval for the surveys, and participants were asked to signan informed consent form.
Predicted 10-year risk for CHD (angina pectoris,myocardial infarction, coronary insufficiency, and CHDdeath) and CVD (coronary death, myocardial infarction,coronary insufficiency, angina, ischemic stroke, hemorrhagic
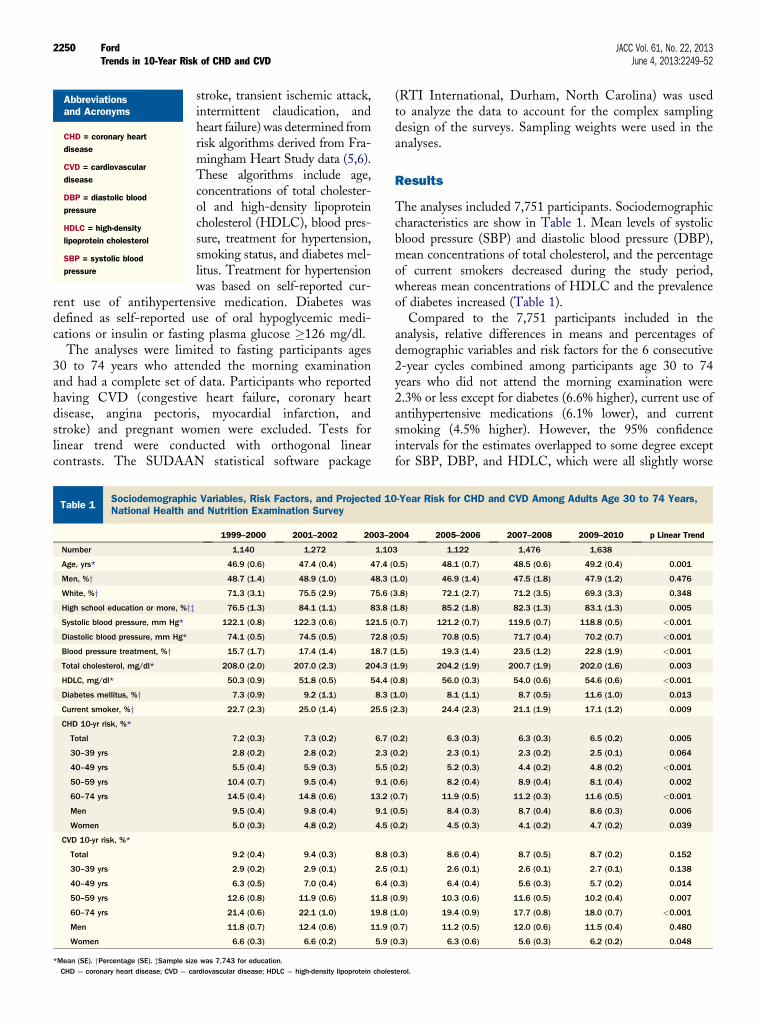
Table 1SociodemographicNational Health an
Number
Age, yrs*
Men, %yWhite, %yHigh school education or more, %yzSystolic blood pressure, mm Hg*
Diastolic blood pressure, mm Hg*
Blood pressure treatment, %yTotal cholesterol, mg/dl*
HDLC, mg/dl*
Diabetes mellitus, %yCurrent smoker, %yCHD 10-yr risk, %*
Total
30–39 yrs
40–49 yrs
50–59 yrs
60–74 yrs
Men
Women
CVD 10-yr risk, %*
Total
30–39 yrs
40–49 yrs
50–59 yrs
60–74 yrs
Men
Women
*Mean (SE). yPercentage (SE). zSample sizCHD ¼ coronary heart disease; CVD ¼ ca
Abbreviationsand Acronyms
CHD = coronary heart
disease
CVD = cardiovascular
disease
DBP = diastolic blood
pressure
HDLC = high-density
lipoprotein cholesterol
SBP = systolic blood
pressure
Ford JACC Vol. 61, No. 22, 2013Trends in 10-Year Risk of CHD and CVD June 4, 2013:2249–52
2250
stroke, transient ischemic attack,intermittent claudication, andheart failure) was determined fromrisk algorithms derived from Fra-mingham Heart Study data (5,6).These algorithms include age,concentrations of total cholester-ol and high-density lipoproteincholesterol (HDLC), blood pres-sure, treatment for hypertension,smoking status, and diabetes mel-litus. Treatment for hypertensionwas based on self-reported cur-
rent use of antihypertensive medication. Diabetes wasdefined as self-reported use of oral hypoglycemic medi-cations or insulin or fasting plasma glucose �126 mg/dl.
The analyses were limited to fasting participants ages30 to 74 years who attended the morning examinationand had a complete set of data. Participants who reportedhaving CVD (congestive heart failure, coronary heartdisease, angina pectoris, myocardial infarction, andstroke) and pregnant women were excluded. Tests forlinear trend were conducted with orthogonal linearcontrasts. The SUDAAN statistical software package
Variables, Risk Factors, and Projected 10d Nutrition Examination Survey
1999–2000 2001–2002 2003–2
1,140 1,272 1,10
46.9 (0.6) 47.4 (0.4) 47.4 (
48.7 (1.4) 48.9 (1.0) 48.3 (
71.3 (3.1) 75.5 (2.9) 75.6 (
76.5 (1.3) 84.1 (1.1) 83.8 (
122.1 (0.8) 122.3 (0.6) 121.5 (
74.1 (0.5) 74.5 (0.5) 72.8 (
15.7 (1.7) 17.4 (1.4) 18.7 (
208.0 (2.0) 207.0 (2.3) 204.3 (
50.3 (0.9) 51.8 (0.5) 54.4 (
7.3 (0.9) 9.2 (1.1) 8.3 (
22.7 (2.3) 25.0 (1.4) 25.5 (
7.2 (0.3) 7.3 (0.2) 6.7 (
2.8 (0.2) 2.8 (0.2) 2.3 (
5.5 (0.4) 5.9 (0.3) 5.5 (
10.4 (0.7) 9.5 (0.4) 9.1 (
14.5 (0.4) 14.8 (0.6) 13.2 (
9.5 (0.4) 9.8 (0.4) 9.1 (
5.0 (0.3) 4.8 (0.2) 4.5 (
9.2 (0.4) 9.4 (0.3) 8.8 (
2.9 (0.2) 2.9 (0.1) 2.5 (
6.3 (0.5) 7.0 (0.4) 6.4 (
12.6 (0.8) 11.9 (0.6) 11.8 (
21.4 (0.6) 22.1 (1.0) 19.8 (
11.8 (0.7) 12.4 (0.6) 11.9 (
6.6 (0.3) 6.6 (0.2) 5.9 (
e was 7,743 for education.rdiovascular disease; HDLC ¼ high-density lipoprotein choles
(RTI International, Durham, North Carolina) was usedto analyze the data to account for the complex samplingdesign of the surveys. Sampling weights were used in theanalyses.
Results
The analyses included 7,751 participants. Sociodemographiccharacteristics are show in Table 1. Mean levels of systolicblood pressure (SBP) and diastolic blood pressure (DBP),mean concentrations of total cholesterol, and the percentageof current smokers decreased during the study period,whereas mean concentrations of HDLC and the prevalenceof diabetes increased (Table 1).
Compared to the 7,751 participants included in theanalysis, relative differences in means and percentages ofdemographic variables and risk factors for the 6 consecutive2-year cycles combined among participants age 30 to 74years who did not attend the morning examination were2.3% or less except for diabetes (6.6% higher), current use ofantihypertensive medications (6.1% lower), and currentsmoking (4.5% higher). However, the 95% confidenceintervals for the estimates overlapped to some degree exceptfor SBP, DBP, and HDLC, which were all slightly worse
-Year Risk for CHD and CVD Among Adults Age 30 to 74 Years,
004 2005–2006 2007–2008 2009–2010 p Linear Trend
3 1,122 1,476 1,638
0.5) 48.1 (0.7) 48.5 (0.6) 49.2 (0.4) 0.001
1.0) 46.9 (1.4) 47.5 (1.8) 47.9 (1.2) 0.476
3.8) 72.1 (2.7) 71.2 (3.5) 69.3 (3.3) 0.348
1.8) 85.2 (1.8) 82.3 (1.3) 83.1 (1.3) 0.005
0.7) 121.2 (0.7) 119.5 (0.7) 118.8 (0.5) <0.001
0.5) 70.8 (0.5) 71.7 (0.4) 70.2 (0.7) <0.001
1.5) 19.3 (1.4) 23.5 (1.2) 22.8 (1.9) <0.001
1.9) 204.2 (1.9) 200.7 (1.9) 202.0 (1.6) 0.003
0.8) 56.0 (0.3) 54.0 (0.6) 54.6 (0.6) <0.001
1.0) 8.1 (1.1) 8.7 (0.5) 11.6 (1.0) 0.013
2.3) 24.4 (2.3) 21.1 (1.9) 17.1 (1.2) 0.009
0.2) 6.3 (0.3) 6.3 (0.3) 6.5 (0.2) 0.005
0.2) 2.3 (0.1) 2.3 (0.2) 2.5 (0.1) 0.064
0.2) 5.2 (0.3) 4.4 (0.2) 4.8 (0.2) <0.001
0.6) 8.2 (0.4) 8.9 (0.4) 8.1 (0.4) 0.002
0.7) 11.9 (0.5) 11.2 (0.3) 11.6 (0.5) <0.001
0.5) 8.4 (0.3) 8.7 (0.4) 8.6 (0.3) 0.006
0.2) 4.5 (0.3) 4.1 (0.2) 4.7 (0.2) 0.039
0.3) 8.6 (0.4) 8.7 (0.5) 8.7 (0.2) 0.152
0.1) 2.6 (0.1) 2.6 (0.1) 2.7 (0.1) 0.138
0.3) 6.4 (0.4) 5.6 (0.3) 5.7 (0.2) 0.014
0.9) 10.3 (0.6) 11.6 (0.5) 10.2 (0.4) 0.007
1.0) 19.4 (0.9) 17.7 (0.8) 18.0 (0.7) <0.001
0.7) 11.2 (0.5) 12.0 (0.6) 11.5 (0.4) 0.480
0.3) 6.3 (0.6) 5.6 (0.3) 6.2 (0.2) 0.048
terol.
JACC Vol. 61, No. 22, 2013 FordJune 4, 2013:2249–52 Trends in 10-Year Risk of CHD and CVD
2251
among participants who did not attend the morningexamination.
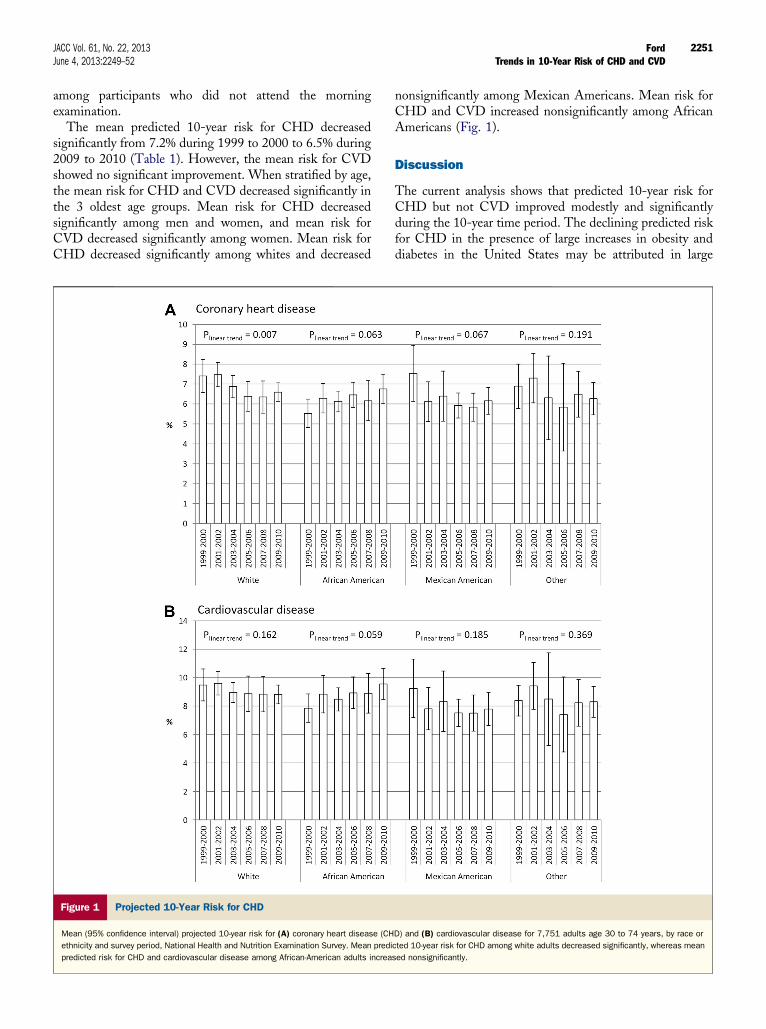
The mean predicted 10-year risk for CHD decreasedsignificantly from 7.2% during 1999 to 2000 to 6.5% during2009 to 2010 (Table 1). However, the mean risk for CVDshowed no significant improvement. When stratified by age,the mean risk for CHD and CVD decreased significantly inthe 3 oldest age groups. Mean risk for CHD decreasedsignificantly among men and women, and mean risk forCVD decreased significantly among women. Mean risk forCHD decreased significantly among whites and decreased
Figure 1 Projected 10-Year Risk for CHD
Mean (95% confidence interval) projected 10-year risk for (A) coronary heart disease (CH
ethnicity and survey period, National Health and Nutrition Examination Survey. Mean predi
predicted risk for CHD and cardiovascular disease among African-American adults increa
nonsignificantly among Mexican Americans. Mean risk forCHD and CVD increased nonsignificantly among AfricanAmericans (Fig. 1).
Discussion
The current analysis shows that predicted 10-year risk forCHD but not CVD improved modestly and significantlyduring the 10-year time period. The declining predicted riskfor CHD in the presence of large increases in obesity anddiabetes in the United States may be attributed in large
D) and (B) cardiovascular disease for 7,751 adults age 30 to 74 years, by race or
cted 10-year risk for CHD among white adults decreased significantly, whereas mean
sed nonsignificantly.
Ford JACC Vol. 61, No. 22, 2013Trends in 10-Year Risk of CHD and CVD June 4, 2013:2249–52
2252
measure to improvements in the prevalence of smoking,mean levels of SBP and DBP, and mean concentrations oftotal cholesterol and HDLC. In the absence of increasingprevalence of diabetes, predicted risk would have declined ata stronger pace.
The lack of significant improvements in mean SBP andconcentrations of total cholesterol coupled to strongincreases in prevalent diabetes among African Americanslargely account for the racial differences (data not shown).Among whites, significant and larger improvements werenoted for mean levels of SBP and DBP as well as meanconcentrations of total cholesterol and HDLC. The changein diabetes from 6.4% to 10.3% among whites (p for lineartrend ¼ 0.115) proved less than the change from 7.9% to14.1% among African Americans (p for linear trend ¼0.008).
Changing the course of predicted risk for CHD andCVD among African-American adults will require bothpopulation and clinical approaches. Because blood pressure,lipids, and diabetes have powerful behavioral underpinnings,effective and efficient population-based approaches inpromoting heart-healthy diets and physical activity amongAfrican Americans are fundamental to achieving desirablechange (7). The National Prevention Strategy emphasizesthe need for eliminating health disparities and containsa series of recommendations aimed at improving diets andphysical activity levels (8). Complementary to population-based approaches is the need for clinical approaches inmanaging hypertension, dyslipidemias, and diabetes toeliminate health disparities in the treatment for abnormallevels of risk factors (9,10). Assuring access to qualitymedical care and availability of affordable medications willhelp in improving control of abnormal risk factor levels.
The different impressions conveyed by the trajectories forpredicted 10-year risk of CHD and CVD may seemcounterintuitive given that both risk algorithms use a similarset of risk factors to calculate risk. The risk algorithm forCHD uses both SBP and DBP but not treatment forhypertension, whereas the risk algorithm for CVD uses onlySBP but does make an allowance for treatment of elevatedblood pressure. Also, the manner in which the variables arespecified in the risk algorithms differs. Moreover, anginapectoris, myocardial infarction, coronary insufficiency, andCHD death represented the endpoints used to develop therisk equation for CHD, whereas the aforementionedendpoints as well as ischemic stroke, hemorrhagic stroke,transient ischemic attack, intermittent claudication, andheart failure represented the endpoints used to develop therisk equation for CVD. An examination of the risk functionsfor congestive heart failure and stroke derived from Fra-mingham Heart Study data shows different sets of predictorsfor the risk functions. For example, the risk function forpredicting congestive heart failure does not include lipids orsmoking status, and the risk function for predicting strokedoes not include lipids (11). Furthermore, there are differ-ences in the strength of the relationships between the various
risk factors employed by the risk equations and the specificendpoints that comprise CVD. Thus, the risk factors thatwere part of the risk equations for CHD and CVD may bemore specific to CHD than to CVD. These differences mayhave accounted in whole or in part for the different trajec-tories in predicted risk.
Conclusions
Since 1999 to 2000, predicted 10-year risk for CHD hasdeclined significantly but modestly. In contrast, the smalldecline in predicted 10-year risk for CVD was not statisti-cally significant. The trend in predicted 10-year risk forCHD is consistent with regional U.S. reports aboutdeclining incident CHD and suggests that a future declinein the incidence of CHD is possible. Nevertheless, themodest size of the improvements in predicted risk cautionsthat future gains in cardiovascular health cannot be auto-matically assumed and indicates that much work inadvancing cardiovascular health in the United States loomsahead.
Reprint requests and correspondence: Dr. Earl Ford, Centers forDisease Control and Prevention, 4770 Buford Highway, MS K67,Atlanta, Georgia 30341. E-mail: [email protected].
REFERENCES
1. Go AS, Mozaffarian D, Roger VL, et al. Heart disease and strokestatisticsd2013 update: a report from the American Heart Association.Circulation 2013;127:e6–245.
2. Ajani UA, Ford ES. Has the risk for coronary heart disease changedamong U.S. adults? J Am Coll Cardiol 2006;48:1177–82.
3. Lopez-Jimenez F, Batsis JA, Roger VL, Brekke L, Ting HH,Somers VK. Trends in 10-year predicted risk of cardiovascular diseasein the United States, 1976 to 2004. Circ Cardiovasc Qual Outcomes2009;2:443–50.
4. Centers for Disease Control and Prevention. National Health andNutrition Examination Survey. Available at: http://www.cdc.gov/nchs/nhanes.htm. Accessed January 11, 2013.
5. Wilson PW, D’Agostino RB, Levy D, Belanger AM, Silbershatz H,Kannel WB. Prediction of coronary heart disease using risk factorcategories. Circulation 1998;97:1837–47.
6. D’Agostino RB Sr., Vasan RS, Pencina MJ, et al. General cardiovas-cular risk profile for use in primary care: the Framingham Heart Study.Circulation 2008;117:743–53.
7. Whitt-Glover MC, Crespo CJ, Joe J. Recommendations for advancingopportunities to increase physical activity in racial/ethnic minoritycommunities. Prev Med 2009;49:292–3.
8. National Prevention Council. National Prevention Strategy. Availableat: http://www.healthcare.gov/prevention/nphpphc/strategy/report.pdf.Accessed January 11, 2013.
9. Institute of Medicine. Unequal Treatment: Confronting Racial andEthnic Disparities in Health Care. Washington, DC: NationalAcademy Press, 2003.
10. Agency for Healthcare Research and Quality. National HealthcareDisparities Report. Available at: http://www.ahrq.gov/research/findings/nhqrdr/nhqrdr11/qrdr11.html. Accessed January 11, 2013.
11. Framingham Heart Study. Risk score profiles. Available at: http://www.framinghamheartstudy.org/risk/index.html. Accessed January11, 2013.
Key Words: cardiovascular diseases - coronary artery disease - risk -
risk factors - trends.