Embed Size (px)
Citation preview
*Corresponding author. Tel. : 00353 1 706 2220; fax: 00353 1 283 7275.
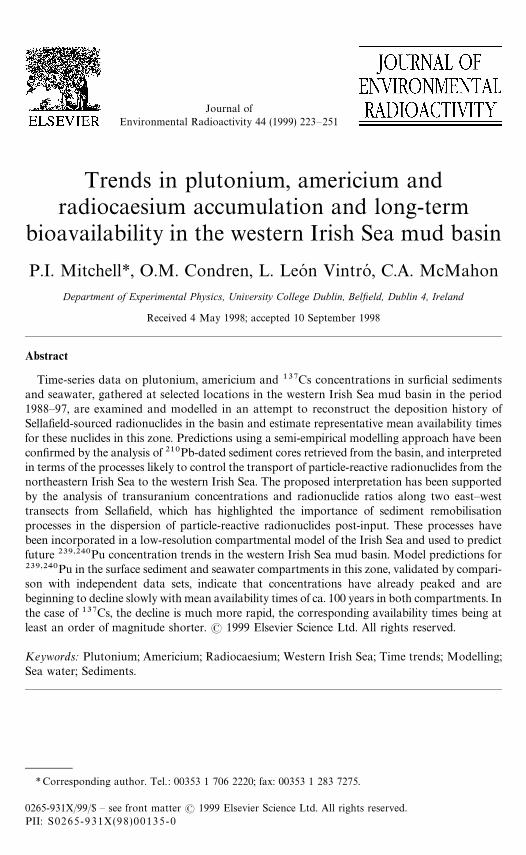
Journal ofEnvironmental Radioactivity 44 (1999) 223—251
Trends in plutonium, americium andradiocaesium accumulation and long-term
bioavailability in the western Irish Sea mud basin
P.I. Mitchell*, O.M. Condren, L. Leon Vintro, C.A. McMahon
Department of Experimental Physics, University College Dublin, Belfield, Dublin 4, Ireland
Received 4 May 1998; accepted 10 September 1998
Abstract
Time-series data on plutonium, americium and 137Cs concentrations in surficial sedimentsand seawater, gathered at selected locations in the western Irish Sea mud basin in the period1988—97, are examined and modelled in an attempt to reconstruct the deposition history ofSellafield-sourced radionuclides in the basin and estimate representative mean availability timesfor these nuclides in this zone. Predictions using a semi-empirical modelling approach have beenconfirmed by the analysis of 210Pb-dated sediment cores retrieved from the basin, and interpretedin terms of the processes likely to control the transport of particle-reactive radionuclides from thenortheastern Irish Sea to the western Irish Sea. The proposed interpretation has been supportedby the analysis of transuranium concentrations and radionuclide ratios along two east—westtransects from Sellafield, which has highlighted the importance of sediment remobilisationprocesses in the dispersion of particle-reactive radionuclides post-input. These processes havebeen incorporated in a low-resolution compartmental model of the Irish Sea and used to predictfuture 239,240Pu concentration trends in the western Irish Sea mud basin. Model predictions for239,240Pu in the surface sediment and seawater compartments in this zone, validated by compari-son with independent data sets, indicate that concentrations have already peaked and arebeginning to decline slowly with mean availability times of ca. 100 years in both compartments. Inthe case of 137Cs, the decline is much more rapid, the corresponding availability times being atleast an order of magnitude shorter. ( 1999 Elsevier Science Ltd. All rights reserved.
Keywords: Plutonium; Americium; Radiocaesium; Western Irish Sea; Time trends; Modelling;Sea water; Sediments.
0265-931X/99/$ — see front matter ( 1999 Elsevier Science Ltd. All rights reserved.PII: S0265-931X(98)00135-0

1. Introduction
The initial dispersion of radionuclides discharged to the marine environment fromSellafield is influenced by a number of factors including the chemical form ofthe radionuclides in the effluent, local hydrographic conditions, the compositionof bottom sediments and variations in the discharge rate. Data collected over a num-ber of decades have shown that those radionuclides which are relatively solublein seawater (e.g., 90Sr, 99Tc and 137Cs) are advected principally to the north andwest, leaving the Irish Sea via the North Channel with a mean transit timeof approximately one year (Jefferies et al., 1982; McKay et al., 1986; Leonard et al.,1997). In contrast, non-conservative nuclides such as plutonium and americium,released in particulate or hydrolysed form, are quickly removed from the watercolumn by direct precipitation or scavenging by suspended particulate matter(Hetherington, 1976).
The tendency of actinide radionuclides to adsorb onto particles and becomeassociated with deposited sediments strongly influences their present distribution andis probably the most relevant feature controlling their long-term fate. Indeed, seabedsediments and, in particular, muddy sediments, are known to be a sink (at leasttemporarily) for non-conservative, long-lived radionuclides. In the Irish Sea, muddysediments are mainly confined to two areas: an extensive belt of muds and muddysands parallel to the Cumbrian coast, and a large and relatively deep mud basin lyingbetween the Isle of Man and the coast of Ireland (Fig. 1).
In this paper, extensive new data, gathered annually since 1988 for radiologicalassessment purposes and with a view to predicting the likely long-term behaviour ofSellafield-sourced radionuclides in the western Irish Sea, are reviewed in detail.Specifically, transuranic concentrations in seawater, surficial sediment and sedimentcores collected by our laboratory at selected locations in the western Irish Sea mudbasin throughout a ten-year period are examined and modelled. To assist interpreta-tion, data on the temporal evolution of the levels of the considerably more solublenuclide, 137Cs, at the same stations are also included.
Two distinct modelling approaches have been adopted. Firstly, a semi-empiricalmodel, originally proposed by Nicholson and Hunt (1995), has been applied to thesedata sets in an attempt to (a) estimate concentrations arising from past dischargesbefore our sampling commenced, (b) predict future concentrations, and (c) establishthe likely time-span over which the various radionuclides are likely to remainbiologically available in the western Irish Sea. Model predictions for the period1952—97 have been confirmed by the analysis of 210Pb-dated sediment cores retrievedfrom the mud basin, which has enabled us to reconstruct the deposition history ofthese nuclides with some confidence. Secondly, a simple (low-resolution) compart-mental model, previously used by Jefferies and Steele (1989) to predict the concentra-tions of Sellafield-discharged 137Cs throughout the Irish Sea, and modified here totake account of the remobilisation of radionuclides from the seabed back into thewater column after the manner of MacKenzie and Nicholson (1987), has been used topredict the concentrations of plutonium in seawater and sediment in the westernIrish Sea. These predictions have been validated by comparison with our measured
P.I. Mitchell et al./J. Environ. Radioactivity 44 (1999) 223—251224
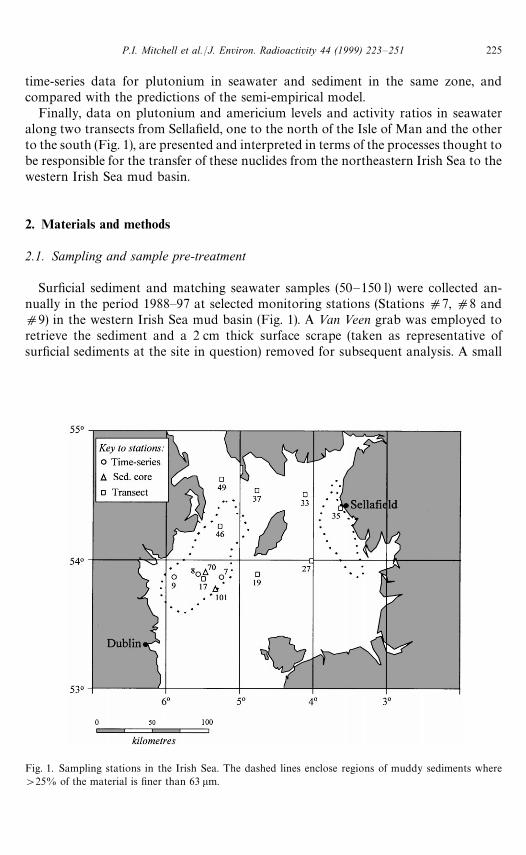
Fig. 1. Sampling stations in the Irish Sea. The dashed lines enclose regions of muddy sediments where'25% of the material is finer than 63 lm.
time-series data for plutonium in seawater and sediment in the same zone, andcompared with the predictions of the semi-empirical model.
Finally, data on plutonium and americium levels and activity ratios in seawateralong two transects from Sellafield, one to the north of the Isle of Man and the otherto the south (Fig. 1), are presented and interpreted in terms of the processes thought tobe responsible for the transfer of these nuclides from the northeastern Irish Sea to thewestern Irish Sea mud basin.
2. Materials and methods
2.1. Sampling and sample pre-treatment
Surficial sediment and matching seawater samples (50—150 l) were collected an-nually in the period 1988—97 at selected monitoring stations (Stations d7, d8 andd9) in the western Irish Sea mud basin (Fig. 1). A »an »een grab was employed toretrieve the sediment and a 2 cm thick surface scrape (taken as representative ofsurficial sediments at the site in question) removed for subsequent analysis. A small
P.I. Mitchell et al./J. Environ. Radioactivity 44 (1999) 223—251 225
number of sediment cores were also retrieved from the mud basin at Stations d8,d70 and d101 using a box corer and, in one case, a gravity corer. Sectioning of thesecores into 2 cm slices was carried out immediately after sampling. The samples weresealed in plastic bags and returned to the laboratory, where they were dried, groundand homogenised. In addition, samples of near-surface seawater (50—150 l) werecollected at eight stations along two east-west transects in the Irish Sea (Fig. 1) inDecember 1995. The samples were immediately filtered ((0.45 lm) and acidifiedprior to pre-concentration onboard ship.
2.2. Sample analysis
Cs-137 concentrations in sediment were determined by high-resolution gammaspectrometry using an n-type germanium detector with a relative efficiency of 30%and resolution of 1.70 keV (FWHM) at 1.33 MeV. Transuranic nuclides (238Pu,239,240Pu, 241Pu and 241Am) were extracted and purified from sub-samples (+10 g) ofthe same sediment using standard radiochemical techniques based on ion exchangeand solvent extraction (Condren, 1998). Following electrodeposition onto polishedstainless-steel discs and a storage period of at least two weeks, alpha-emitting nuclidelevels were determined by high-resolution alpha spectrometry using passivated, ion-implanted silicon detectors, while beta-emitting 241Pu was measured by supported-disc liquid scintillation counting in a Wallac Quantulus LSC (Condren et al., 1996a).Radiochemical recoveries were determined using NIST-certified 242Pu and 243Am asyield monitors.
2.3. Modelling
2.3.1. Semi-empirical modellingThe semi-empirical (or inverse compartment analysis) approach of Nicholson and
Hunt (1995) considers the environmental material in question (e.g., sediment) to be inequilibrium with its environs. This means that even though concentrations arecontrolled by a number of complex processes, the period of time in which a certainnuclide will be available to the material will only depend on the rates of physical decayand loss of the nuclide from the environment. Two parameters, optimised by a max-imum likelihood process, are derived from the experimental time-series data: the meanavailability time (i.e., the time for which the nuclide will effectively be available to thematerial, defined as the time in which the original concentration will decrease by theexponential factor, (e) and a constant incorporating the concentration factor and anyscaling effects such as distance from the discharge point. The values obtained are thenused to calculate the nuclide concentration in the material for a particular year, takinginto account the contributions of contemporary and historic discharges.
We have used the above approach here primarily to estimate concentrations ofplutonium, americium and 137Cs in sediment and seawater in the western Irish Sea inthe period prior to 1988 (when our measurements commenced), and to determinerepresentative mean availability times for these radionuclides in the same zone.
P.I. Mitchell et al./J. Environ. Radioactivity 44 (1999) 223—251226

Fig. 2. Regional structure of a low-resolution compartmental model for the Irish Sea (from: Jefferies& Steele, 1989).
2.3.2. Compartmental modellingThe compartmental model used by Jefferies and Steele (1989) to predict the
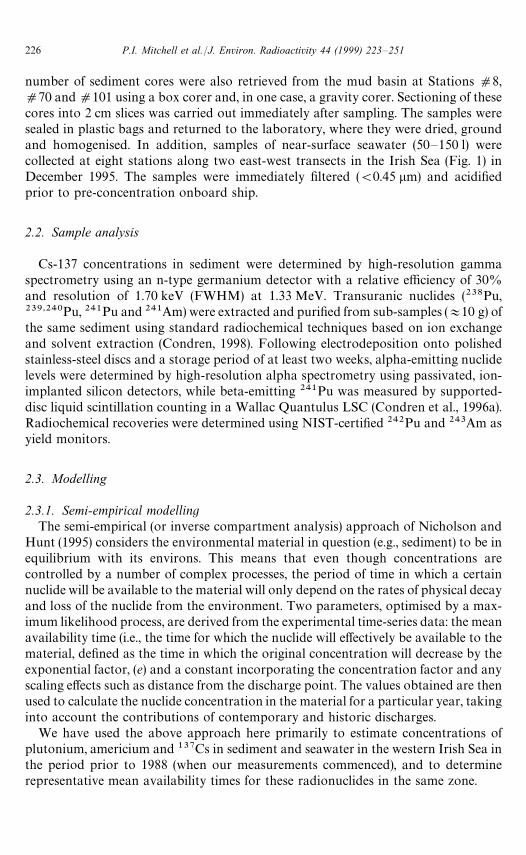
concentrations of 137Cs in seawater throughout the Irish Sea is based on the simpleregional structure proposed by Camplin et al. (1982). It consists of a small number ofinterconnected compartments representing various sea areas within the Irish Sea (Fig. 2).Radionuclide transport by water movement due to advection and dispersion pro-cesses is simulated by exchanges between compartments which are described by a setof transfer (rate) coefficients. These were determined by Jefferies and Steele (1989)using geographically and temporally characterised data on measured, Sellafield-sour-ced, 137Cs concentrations throughout the Irish Sea, constrained by hydrological dataon residual circulation in the Irish Sea. Although the adsorption of radionuclides onsuspended particulate and subsequent transfer to the sediment compartment byparticle scavenging are taken into account in this model, other sedimentary processessuch as bioturbation/mixing and resuspension (grouped together here as re-working),pore-water diffusion, and transfer to deep sediments are not. We have modified theoriginal model to include these processes by assigning to each compartment the morecomplex vertical structure depicted in Fig. 3, following the approach of other workers(MacKenzie & Nicholson, 1987; Nielsen et al., 1995). A list of model compart-ments/regions including the volume, mean depth, sedimentation rate and suspendedload assumed for each are given in Table 1, while the parameter values used to definetransfer of radionuclides between seawater and sediment are given in Table 2. Many ofthese parameter values are identical to those used by Jefferies and Steele (1989), and
P.I. Mitchell et al./J. Environ. Radioactivity 44 (1999) 223—251 227
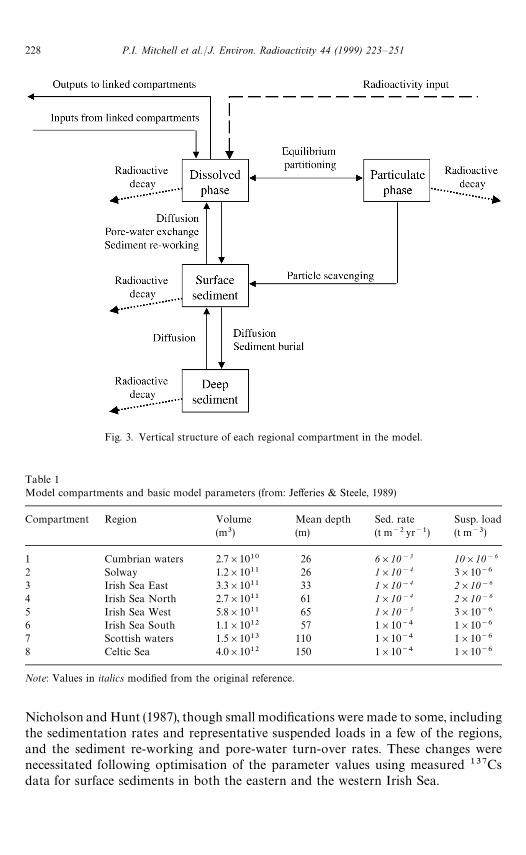
Fig. 3. Vertical structure of each regional compartment in the model.
Table 1Model compartments and basic model parameters (from: Jefferies & Steele, 1989)
Compartment Region Volume(m3)
Mean depth(m)
Sed. rate(t m~2 yr~1)
Susp. load(t m~3)
1 Cumbrian waters 2.7]1010 26 6]10!3 10]10!6
2 Solway 1.2]1011 26 1]10!4 3]10~6
3 Irish Sea East 3.3]1011 33 1]10!4 2]10!6
4 Irish Sea North 2.7]1011 61 1]10!4 2]10!6
5 Irish Sea West 5.8]1011 65 1]10!3 3]10~6
6 Irish Sea South 1.1]1012 57 1]10~4 1]10~6
7 Scottish waters 1.5]1013 110 1]10~4 1]10~6
8 Celtic Sea 4.0]1012 150 1]10~4 1]10~6
Note: Values in italics modified from the original reference.
Nicholson and Hunt (1987), though small modifications were made to some, includingthe sedimentation rates and representative suspended loads in a few of the regions,and the sediment re-working and pore-water turn-over rates. These changes werenecessitated following optimisation of the parameter values using measured 137Csdata for surface sediments in both the eastern and the western Irish Sea.
P.I. Mitchell et al./J. Environ. Radioactivity 44 (1999) 223—251228

Table 2Model parameters describing the transfer of radionuclides between seawater and sediment (from:MacKenzie & Nicholson, 1987)
Parameter Value
Sediment porosity 0.8Depth of surface sediment layer 0.1 mDiffusion coefficient 1]10~2 m2 yr~1
Sediment re-working rate 0.005 m yr~1
Pore-water turn-over rate 1 yr!1
Note: Values in italics modified from the original reference.
The model was implemented with the aid of commercially available modellingsoftware (STELLA' II), in which linear first order differential equations are used todescribe the transfer between compartments. Numerical solution of the system ofequations driving the model was carried out using a fourth-order Runge-Kuttaintegration and time-dependent concentrations in each of the compartments weregenerated using reported and estimated annual Sellafield activity discharges for theperiod 1952—96 (Gray et al., 1995; MAFF, 1994—97). These predictions have beenvalidated by comparison with our time-series data for plutonium in the western IrishSea, as well as with time-series data for plutonium in Cumbrian waters publishedelsewhere. None of these data, of course, had been used to calibrate the model.
3. Results and discussion
3.1. Time-trend analyses of 137Cs, 238Pu, 239,240Pu, 241Pu and 241Am levels in the westernIrish Sea mud basin
3.1.1. Surficial sedimentThe concentrations of 238Pu, 239,240Pu, 241Pu, 241Am and 137Cs, together with the
corresponding radionuclide ratios, in surficial sediment collected at Stations d7, d8and d9 in the western Irish Sea over the period 1988—97 are given in Table 3.
The most striking feature of these time series is the fact that while 137Cs concentra-tions have been falling continuously over the period of our sampling, comparativelylittle change appears to have occurred in plutonium concentrations. This is in sharpcontrast to the pattern observed in the northeastern Irish Sea, where 137Cs, plutoniumand americium concentrations have all been falling steadily since the mid-1970s asa result of successive reductions in annual discharges, leading to falling concentrationsin the water column and consequent remobilisation from the sediments (Hunt &Kershaw, 1990).
Comparison of our 1997 data with those of 1988 reveals a decrease in 137Csconcentrations over this period of 30—70%, i.e., an annual decrease of 3—8%. This isin good agreement with the value of+6.5% obtained from estimated total inventories
P.I. Mitchell et al./J. Environ. Radioactivity 44 (1999) 223—251 229

Tab
le3
Con
centr
atio
ns($
1p)of23
8Pu,23
9,24
0Pu,
241P
u,24
1Am
and
137C
sin
surfi
cial
sedim
ents
sam
pled
inth
ew
este
rnIr
ish
Sea
,19
88—9
7
Loca
tion
Yea
rC
once
ntr
atio
n(B
qkg~
1,dry
wt.)
238P
u/24
1Pu/
241A
m/
239,24
0Pu
239,24
0Pu
239,24
0Pu
238P
u23
9,24
0Pu
241P
u24
1Am
137C
s
Stn
.d
719
881.
34$
0.15
9.6$
0.6
156$
1212
.1$
0.5
115$
40.
140$
0.01
816
.2$
1.6
1.26
$0.
0953
°52@
N19
892.
13$
0.15
11.6$
0.5
157$
1111
.8$
0.4
104$
40.
183$
0.01
513
.5$
1.1
1.02
$0.
0605
°14@
W19
901.
79$
0.11
9.4$
0.5
123$
1013
.4$
0.6
93$
40.
189$
0.00
713
.0$
1.2
1.42
$0.
1019
911.
87$
0.07
10.5$
0.2
151$
812
.2$
0.5
109$
40.
177$
0.00
714
.4$
0.8
1.16
$0.
0519
922.
10$
0.14
10.7$
0.6
131$
1013
.5$
0.5
99$
40.
196$
0.01
712
.3$
1.2
1.26
$0.
0819
931.
85$
0.10
9.2$
0.2
124$
715
.8$
0.6
70$
30.
203$
0.01
013
.5$
0.8
1.72
$0.
0819
942.
44$
0.12
12.9$
0.4
150$
99.
7$0.
488
$3
0.18
9$0.
009
11.6$
0.8
0.75
$0.
0419
952.
40$
0.08
12.9$
0.3
143$
814
.6$
0.4
70$
30.
186$
0.00
611
.1$
0.7
1.13
$0.
0419
961.
74$
0.06
10.9$
0.2
89$
515
.4$
0.4
75$
30.
159$
0.00
68.
2$0.
51.
41$
0.04
1997
1.87
$0.
0910
.8$
0.3
101$
613
.4$
0.3
79$
30.
173$
0.00
89.
4$0.
61.
24$
0.04
Stn
.d
819
882.
3$0.
1514
.8$
0.5
190$
1214
.9$
0.8
276$
80.
155$
0.00
912
.8$
0.9
1.00
$0.
0753
°53
@N19
892.
49$
0.15
14.0$
0.5
194$
128.
4$0.
725
8$8
0.17
7$0.
010
13.8$
1.0
0.60
$0.
0605
°33
@W19
902.
72$
0.17
14.1$
0.5
167$
1313
.3$
0.7
259$
80.
193$
0.01
211
.9$
1.0
0.95
$0.
0619
912.
49$
0.14
15.5$
0.8
185$
1319
.2$
0.8
268$
40.
161$
0.00
511
.9$
1.1
1.24
$0.
0819
922.
17$
0.08
13.9$
0.3
164$
1017
.8$
0.6
198$
60.
156$
0.00
511
.8$
0.7
1.28
$0.
0519
932.
79$
0.15
18.7$
0.6
227$
1226
.0$
0.9
153$
50.
149$
0.00
812
.1$
0.8
1.39
$0.
0619
945.
58$
0.12
33.3$
0.9
377$
2135
$5
148$
50.
167$
0.00
611
.3$
0.7
1.05
$0.
1519
953.
52$
0.09
19.8$
0.4
195$
916
.2$
0.6
118$
30.
177$
0.00
49.
8$0.
50.
82$
0.03
1996
2.44
$0.
1314
.1$
0.4
117$
722
.4$
0.6
106$
30.
173$
0.00
98.
3$0.
51.
59$
0.06
1997
3.36
$0.
1219
.8$
0.5
165$
1028
.5$
0.6
150$
40.
169$
0.00
58.
3$0.
51.
44$
0.03
Stn
.d
919
881.
59$
0.09
9.1$
0.3
147$
122.
1$0.
123
0$6
0.17
5$0.
011
16.1$
1.4
0.23
$0.
0253
°52
@N19
891.
49$
0.05
8.0$
0.2
109$
95.
1$0.
313
8$4
0.18
5$0.
008
13.6$
1.2
0.64
$0.
0405
°53
@W19
901.
66$
0.06
9.2$
0.2
125$
87.
0$0.
314
4$4
0.18
0$0.
007
13.6$
0.9
0.77
$0.
0319
911.
67$
0.08
9.8$
0.3
83$
710
.0$
0.3
102$
30.
170$
0.01
28.
5$0.
81.
02$
0.04
1992
1.57
$0.
108.
5$0.
393
$8
6.4$
0.4
104$
30.
185$
0.01
411
.0$
1.1
0.75
$0.
0519
931.
46$
0.10
9.4$
0.4
104$
77.
9$0.
412
6$3
0.15
5$0.
011
11.0$
0.8
0.84
$0.
0519
941.
56$
0.06
8.6$
0.2
43$
36.
5$0.
595
$3
0.18
1$0.
007
5.0$
0.4
0.75
$0.
0619
951.
68$
0.06
9.3$
0.2
91$
66.
5$0.
375
$3
0.18
0$0.
006
9.8$
0.7
0.70
$0.
0419
961.
64$
0.07
9.2$
0.2
92$
67.
5$0.
263
$4
0.17
9$0.
007
10.0$
0.7
0.82
$0.
0319
971.
40$
0.07
8.5$
0.2
65$
48.
4$0.
280
$3
0.16
4$0.
008
7.6$
0.5
0.99
$0.
06
P.I. Mitchell et al./J. Environ. Radioactivity 44 (1999) 223—251230
Fig. 4. Temporal evolution of measured ($2p) and model-predicted concentrations of 137Cs (Bq kg~1,dry wt.) in surficial sediments at Stations d7, d8 and d9 in the western Irish Sea. The cumulative 137Csrelease from Sellafield in the period 1952—97 is also shown.
in Irish Sea sediments over the same period (Poole et al., 1997), and with calculationsby Hunt and Kershaw (1990) based on increased 137Cs concentrations in sea-water relative to the discharge rate over the period 1983—88. Predicted 137Cs concen-trations for each of the three stations using the semi-empirical modelling approach ofNicholson and Hunt (1995) show a similar pattern (Fig. 4), with concentrationsincreasing sharply in the early to mid-1970s, peaking in the late 1970s to early 1980sand declining thereafter. Although the broad shape of the concentration versus timetrend at these stations is similar to that of the decay-corrected cumulative 137Csrelease from Sellafield (Fig. 4), the fall-off since the early 1980s (factor of 2—5) ismore pronounced and lends weight to the view that 137Cs is also desorbing fromwestern Irish Sea sediments as a consequence of the general reduction in seawaterconcentrations.
Model-estimated 137Cs mean availability times for Stations d7, d8 and d9 werefound to be 16, 9 and 7 years, respectively. Variations between the three stations mostlikely reflect differences in physical dispersion and dilution processes which, in turn,are dependent on local hydrological conditions such as currents and depth. Theseavailability times are considerably longer than the estimate of 3 years reported byNicholson and Hunt (1995) for sediments close to the Sellafield outfall and the value of
P.I. Mitchell et al./J. Environ. Radioactivity 44 (1999) 223—251 231

Fig. 5. Estimation of the mean availability time for 239,240Pu at Station d9 in the western Irish Sea to theyear 2020. Note the sensitivity of the plots to the choice of availability time, particularly the shorter times.
5 years reported by MacKenzie et al. (1994) for sediments in the Solway Firth. This isnot surprising, as the likelihood of sediment resuspension is considerably higher in theshallower eastern Irish Sea (Kershaw et al., 1988a).
In the case of plutonium and americium, time-series analyses of surficial sedimentconcentrations in the northeastern Irish Sea show mean availability times of 5—8 yearsand 5—20 years, respectively (Hunt, 1985; MacKenzie et al., 1994; Nicholson & Hunt,1995). Accurate estimation of actinide mean availability times in the western Irish Seausing our time-series data is hampered by the near constancy of the measuredconcentrations over the period of sampling. This constancy implies an availabilitytime which, at the very least, is considerably longer than that for 137Cs. Predicted239,240Pu concentrations, using a range of availability times, s, are shown in Fig. 5 (forthe purpose of the calculation it has been assumed that annual discharges fromSellafield will remain at their present low level).
It is clear from these plots that a further decade of monitoring will be requiredbefore the availability time for 239,240Pu can be pinned down with accuracy using thesemi-empirical approach. Nevertheless, it would seem, on the basis of the existingdataset, that the actual value is likely to lie between one hundred and several hundredyears. If an availability time of 200 years is assumed, model-predicted 239,240Puconcentrations for each of the three stations show concentrations increasing rapidlyfrom the late 1960s until the early 1980s, at which point they level off and then begin todecline slowly. An example of the time dependence of 239,240Pu concentrations at one ofthe stations (d9) is shown in Fig. 6. Note the satisfactory agreement with the measured
P.I. Mitchell et al./J. Environ. Radioactivity 44 (1999) 223—251232
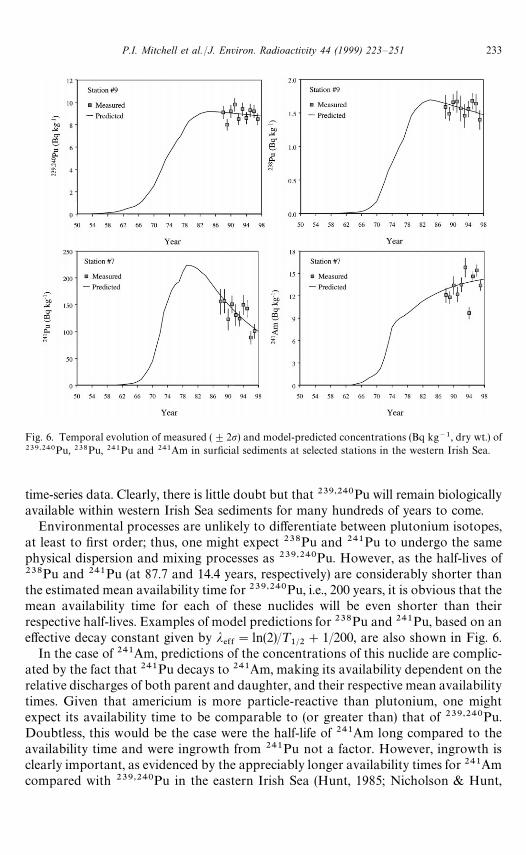
Fig. 6. Temporal evolution of measured ($2p) and model-predicted concentrations (Bq kg~1, dry wt.) of239,240Pu, 238Pu, 241Pu and 241Am in surficial sediments at selected stations in the western Irish Sea.
time-series data. Clearly, there is little doubt but that 239,240Pu will remain biologicallyavailable within western Irish Sea sediments for many hundreds of years to come.
Environmental processes are unlikely to differentiate between plutonium isotopes,at least to first order; thus, one might expect 238Pu and 241Pu to undergo the samephysical dispersion and mixing processes as 239,240Pu. However, as the half-lives of238Pu and 241Pu (at 87.7 and 14.4 years, respectively) are considerably shorter thanthe estimated mean availability time for 239,240Pu, i.e., 200 years, it is obvious that themean availability time for each of these nuclides will be even shorter than theirrespective half-lives. Examples of model predictions for 238Pu and 241Pu, based on aneffective decay constant given by j
%&&"ln(2)/¹
1@2#1/200, are also shown in Fig. 6.
In the case of 241Am, predictions of the concentrations of this nuclide are complic-ated by the fact that 241Pu decays to 241Am, making its availability dependent on therelative discharges of both parent and daughter, and their respective mean availabilitytimes. Given that americium is more particle-reactive than plutonium, one mightexpect its availability time to be comparable to (or greater than) that of 239,240Pu.Doubtless, this would be the case were the half-life of 241Am long compared to theavailability time and were ingrowth from 241Pu not a factor. However, ingrowth isclearly important, as evidenced by the appreciably longer availability times for 241Amcompared with 239,240Pu in the eastern Irish Sea (Hunt, 1985; Nicholson & Hunt,
P.I. Mitchell et al./J. Environ. Radioactivity 44 (1999) 223—251 233
1995). Indeed, studies have shown that while the cumulative environmental inventoryof 241Am in seabed sediments was 860 TBq by 1988, the total activity of 241Amreleased from Sellafield up to this time was only 540 TBq (McCartney et al., 1994). Theadditional 320 TBq had been introduced into the environment by the decay of 241Pu,also discharged from Sellafield. In the western Irish Sea, although the half-life of241Am is comparable to the mean availability time for 239,240Pu, the (semi-empirical)model predicts that ingrowth from 241Pu will give rise to a continuing slow increase in241Am concentrations in surficial sediments (Fig. 6), which should peak in or aboutthe year 2010 when levels are expected to be approximately 5% higher than at present.After this, the model predicts that 241Am concentrations will diminish slowly with anestimated mean availability time of approximately 150 years.
3.1.2. SeawaterSurveys of the concentrations of radiocaesium in filtered seawater from throughout
the Irish Sea have been conducted on a regular basis for many years (MAFF, 1967—97;Cunningham & O’Grady, 1986; Cunningham et al., 1988; O’Grady & Currivan, 1990;McGarry et al., 1994; Pollard et al., 1996; Long et al., 1996). The extensive data availableshow that general 137Cs levels peaked between 1975 and 1979 and have been decliningmore or less steadily ever since in line with the reduction in annual discharges. At theirpeak, 137Cs concentrations in the northeastern Irish Sea, close to the Sellafield outlet,were more than three orders of magnitude higher than representative fallout levels atsimilar latitudes in the northern hemisphere. In general, concentrations prevailing in thewestern Irish Sea zone in any given year were found to be about a factor of 20 lowerthan those in the north-eastern Irish Sea. Predicted and measured 137Cs concentra-tions in western Irish Sea surface waters for this period are shown in Fig. 7. Thepredicted concentration maximum ca. 1977—79 is in good agreement with experi-mental observation and the estimated mean availability time of 17 months is entirelyconsistent with the accepted clearance half-time for the Irish Sea of ca. 12 months.
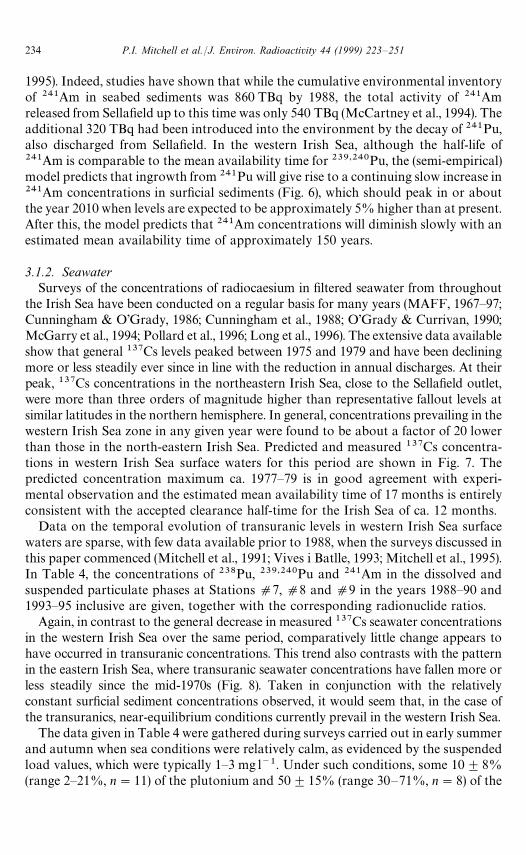
Data on the temporal evolution of transuranic levels in western Irish Sea surfacewaters are sparse, with few data available prior to 1988, when the surveys discussed inthis paper commenced (Mitchell et al., 1991; Vives i Batlle, 1993; Mitchell et al., 1995).In Table 4, the concentrations of 238Pu, 239,240Pu and 241Am in the dissolved andsuspended particulate phases at Stations d7, d8 and d9 in the years 1988—90 and1993—95 inclusive are given, together with the corresponding radionuclide ratios.
Again, in contrast to the general decrease in measured 137Cs seawater concentrationsin the western Irish Sea over the same period, comparatively little change appears tohave occurred in transuranic concentrations. This trend also contrasts with the patternin the eastern Irish Sea, where transuranic seawater concentrations have fallen more orless steadily since the mid-1970s (Fig. 8). Taken in conjunction with the relativelyconstant surficial sediment concentrations observed, it would seem that, in the case ofthe transuranics, near-equilibrium conditions currently prevail in the western Irish Sea.
The data given in Table 4 were gathered during surveys carried out in early summerand autumn when sea conditions were relatively calm, as evidenced by the suspendedload values, which were typically 1—3 mg l~1. Under such conditions, some 10$8%(range 2—21%, n"11) of the plutonium and 50$15% (range 30—71%, n"8) of the
P.I. Mitchell et al./J. Environ. Radioactivity 44 (1999) 223—251234

Fig. 7. Temporal evolution of measured and model-predicted 137Cs concentrations (Bqm~3) in surfaceseawater in the western Irish Sea (field data for the period 1982—1995 from Long et al., 1996; field data priorto 1982 from MAFF, 1969—82).
Fig. 8. Measured 239,240Pu concentrations (mBqm~3) in filtered surface seawater in the eastern Irish Sea,1973—1996 (data from: Hunt, 1985; Walker & McKay, 1991; McKay & Pattenden, 1993; Leonard et al.,1999; this study).
P.I. Mitchell et al./J. Environ. Radioactivity 44 (1999) 223—251 235
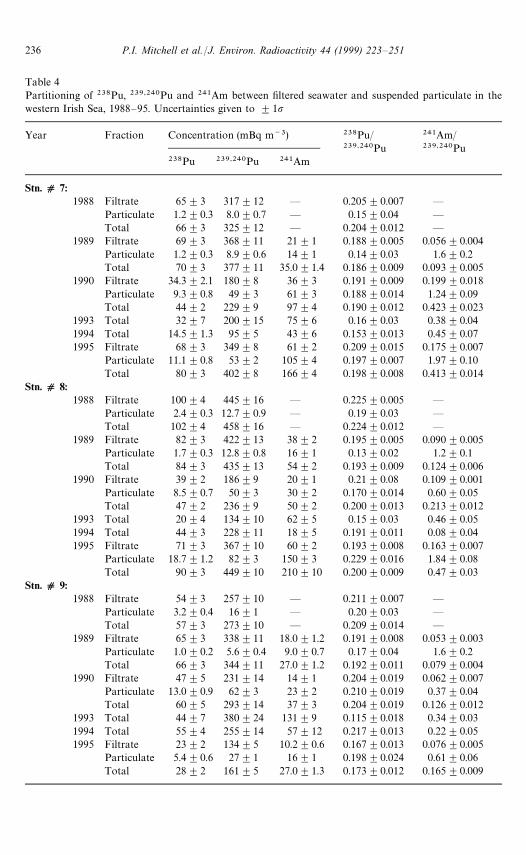
Table 4Partitioning of 238Pu, 239,240Pu and 241Am between filtered seawater and suspended particulate in thewestern Irish Sea, 1988—95. Uncertainties given to $1p
Year Fraction Concentration (mBq m~3) 238Pu/ 241Am/239,240Pu 239,240Pu
238Pu 239,240Pu 241Am
Stn. dd 7:1988 Filtrate 65$3 317$12 — 0.205$0.007 —
Particulate 1.2$0.3 8.0$0.7 — 0.15$0.04 —Total 66$3 325$12 — 0.204$0.012 —
1989 Filtrate 69$3 368$11 21$1 0.188$0.005 0.056$0.004Particulate 1.2$0.3 8.9$0.6 14$1 0.14$0.03 1.6$0.2Total 70$3 377$11 35.0$1.4 0.186$0.009 0.093$0.005
1990 Filtrate 34.3$2.1 180$8 36$3 0.191$0.009 0.199$0.018Particulate 9.3$0.8 49$3 61$3 0.188$0.014 1.24$0.09Total 44$2 229$9 97$4 0.190$0.012 0.423$0.023
1993 Total 32$7 200$15 75$6 0.16$0.03 0.38$0.041994 Total 14.5$1.3 95$5 43$6 0.153$0.013 0.45$0.071995 Filtrate 68$3 349$8 61$2 0.209$0.015 0.175$0.007
Particulate 11.1$0.8 53$2 105$4 0.197$0.007 1.97$0.10Total 80$3 402$8 166$4 0.198$0.008 0.413$0.014
Stn. dd 8:1988 Filtrate 100$4 445$16 — 0.225$0.005 —
Particulate 2.4$0.3 12.7$0.9 — 0.19$0.03 —Total 102$4 458$16 — 0.224$0.012 —
1989 Filtrate 82$3 422$13 38$2 0.195$0.005 0.090$0.005Particulate 1.7$0.3 12.8$0.8 16$1 0.13$0.02 1.2$0.1Total 84$3 435$13 54$2 0.193$0.009 0.124$0.006
1990 Filtrate 39$2 186$9 20$1 0.21$0.08 0.109$0.001Particulate 8.5$0.7 50$3 30$2 0.170$0.014 0.60$0.05Total 47$2 236$9 50$2 0.200$0.013 0.213$0.012
1993 Total 20$4 134$10 62$5 0.15$0.03 0.46$0.051994 Total 44$3 228$11 18$5 0.191$0.011 0.08$0.041995 Filtrate 71$3 367$10 60$2 0.193$0.008 0.163$0.007
Particulate 18.7$1.2 82$3 150$3 0.229$0.016 1.84$0.08Total 90$3 449$10 210$10 0.200$0.009 0.47$0.03
Stn. dd 9:1988 Filtrate 54$3 257$10 — 0.211$0.007 —
Particulate 3.2$0.4 16$1 — 0.20$0.03 —Total 57$3 273$10 — 0.209$0.014 —
1989 Filtrate 65$3 338$11 18.0$1.2 0.191$0.008 0.053$0.003Particulate 1.0$0.2 5.6$0.4 9.0$0.7 0.17$0.04 1.6$0.2Total 66$3 344$11 27.0$1.2 0.192$0.011 0.079$0.004
1990 Filtrate 47$5 231$14 14$1 0.204$0.019 0.062$0.007Particulate 13.0$0.9 62$3 23$2 0.210$0.019 0.37$0.04Total 60$5 293$14 37$3 0.204$0.019 0.126$0.012
1993 Total 44$7 380$24 131$9 0.115$0.018 0.34$0.031994 Total 55$4 255$14 57$12 0.217$0.013 0.22$0.051995 Filtrate 23$2 134$5 10.2$0.6 0.167$0.013 0.076$0.005
Particulate 5.4$0.6 27$1 16$1 0.198$0.024 0.61$0.06Total 28$2 161$5 27.0$1.3 0.173$0.012 0.165$0.009
P.I. Mitchell et al./J. Environ. Radioactivity 44 (1999) 223—251236

Fig. 9. Measured 238Pu/239,240Pu and 241Pu/239,240Pu activity ratios ($2p) in surficial sediments in thewestern Irish Sea (averaged over Stations d7, d8 and d9) compared with ratios in annual and cumulativedischarges. Discharge ratios taken from Gray et al. (1995).
americium in surface waters of the western Irish Sea were found to be associated withthe particulate phase ('0.45 lm).
3.1.3. Isotopic ratios in surficial sediment and seawaterAnnually recorded 238Pu/239,240Pu and 241Pu/239,240Pu activity ratios in surficial
sediments (corrected for the contribution from global fallout and averaged overStations d7, d8 and d9) are shown in Fig. 9, together with activity ratios derivedfrom annual and cumulative discharges (decay-corrected to the year in question).Clearly, measured ratios in western Irish Sea sediment are consistently lower thanthose reported for recent discharges and closely reflect those of the time-integrated orcumulative Sellafield discharge. This observation is not new and has been attributedto ‘pre-depositional’ mixing of contemporary and past discharges, rather than ‘post-depositional’ mixing in situ (Hunt, 1985; Kershaw et al., 1990; MacKenzie et al., 1994).The first mentioned is believed to take place mainly in the muddy sediments close tothe Sellafield outfall, where a combination of bioturbation, resuspension and settling,and very low net sedimentation rates ((0.1 mmyr~1, Kershaw et al., 1988b) leads toextensive vertical mixing (Kershaw, 1986; Kershaw et al., 1990).
Our mean 238Pu/239,240Pu ratio, at 0.174$0.015 (n"30), is identical to pre-viously reported values for marine materials (Fucus, sediment and water) in thewestern Irish Sea (Mitchell et al., 1987, 1995), but somewhat lower than that observedalong the Cumbrian and south-western Scottish coasts over the same period, namely0.212$0.009 (n"186; MAFF, 1989—96). Although small, this difference appears tobe real and has been attributed by various workers (e.g., McCartney et al., 1994) to theslow rate at which plutonium is dispersed following discharge, largely as a result ofactive sediment mixing and re-working in the vicinity of the release point. Moreover,surficial sediments near Sellafield are labelled with a relatively high proportion ofplutonium from recent discharges, characterised by a higher 238Pu/239,240Pu activityratio. Further afield, the proportion from earlier discharges increases, resulting inlower 238Pu/239,240Pu activity ratios.
P.I. Mitchell et al./J. Environ. Radioactivity 44 (1999) 223—251 237

The 238Pu/239,240Pu activity ratios in filtered seawater and suspended particulatein the western Irish Sea (Table 4) were found to be 0.199$0.015 (n"12) and0.18$0.03 (n"12), respectively. These ratios clearly indicate that the plutonium inthe water column at the present time is mainly sourced from sediments rather thanfrom contemporary discharges. As suggested above, dispersion of plutonium re-worked from a mixed pool of contaminated sediment, either by resolubilisation orresuspension, appears to be the most likely mechanism controlling plutonium concen-trations in western Irish Sea waters. Within the limits of analytical uncertainty andnatural variability between samples, it is possible on the basis of the measured ratiosto make a rough estimate of the contribution of eastern and western Irish Seasediments to present seawater concentrations. Taking the western and eastern IrishSea sediment pools (top 10 cm approximately) to have 238Pu/239,240Pu ratios of 0.174and 0.212, respectively, the measured mean ratios for the dissolved and suspendedparticulate fractions given above suggest that most of the dissolved plutonium andcomparatively little of the particulate plutonium is sourced directly from eastern IrishSea sediments. In other words, most of the particulate plutonium in western Irish Seawaters has its origins in the resuspension of local seabed sediment. That most of theplutonium sourced from the eastern Irish Sea is transferred to the western Irish Sea ina soluble form after resolubilisation from seabed sediments is in accord with theobservations of other workers (MacKenzie et al., 1987; Cook et al., 1997), who havesuggested that particle transport dominates in the northeastern Irish Sea but notfurther afield. Additional data in support of this hypothesis is discussed in Section 3.2below.
3.1.4. Reconstruction of 137Cs, plutonium and americium deposition history in the westernIrish Sea mud basin using dated sediment cores
Confirmation that the predicted concentration time-trends for 137Cs, plutoniumand americium in surficial sediments in the western Irish Sea are reliable has beenobtained from the analysis of 210Pb-dated sediment cores retrieved from the samezone. Excess 210Pb deposition profiles for three such cores are shown in Fig. 10. In allthree, a general decrease in the excess (or unsupported) 210Pb with depth is observed,with some excess 210Pb detectable at depths of over 50 cm. Measured inventories werefound to be about 1]104 Bq m~2 and are consistent with the values reportedpreviously by other workers for muddy sediments in the Irish Sea (McCartney et al.,1990). Elsewhere in the Irish Sea the inventories are considerably lower, beingtypically +1—3]103 Bqm~2 (McCartney et al., 1990). The higher inventories inmuddy areas are readily explained by the higher absorption capacity of finer-grainedsediments.
From the best exponential fit to the excess 210Pb deposition profiles, a meansedimentation rate of 3]10~3 t m~2 yr~1 was determined for these core sites. Thisvalue is consistent with the range of values quoted in the literature for the north-western Irish Sea, i.e., 1—5]10~3 t m~2 yr~1 (EC, 1995). The individual sedimentationrates for each core, as determined using the constant rate of supply (CRS) model(Goldberg, 1963; Appleby & Oldfield, 1978; Tobin & Schell, 1989), are given in Table5. It should be appreciated that these are apparent sedimentation rates only; the
P.I. Mitchell et al./J. Environ. Radioactivity 44 (1999) 223—251238
Fig. 10. Excess 210Pb depth profiles in cores from three separate stations in the western Irish Sea mudbasin.
Table 5Apparent sedimentation rates in the western Irish Sea mud basin as derived from sediment cores using theCRS model
Core Location Sedimentation rate
(t m~2 yr~1) (cmyr~1)
Stn. d101 53°46@N 05°27@W 3.3]10~3 0.73Stn. d70 53°53@N 05°33@W 3.0]10~3 0.52Stn. d8 53°53@N 05°33@W 2.7]10~3 0.40
actual rates may be lower, as it is recognised that biological and physical mixing in theupper layers of the sediment column can disturb the stratigraphic record and lead toan overestimate of the sedimentation rate (Officer, 1982). Gas (methane) ventingthrough fine-grained sediment to seafloor may also contribute to sediment distur-bance in the western Irish Sea (Croker, 1995). In fact, when optimising our compart-mental model for the Irish Sea (see Section 2.3.2 above), the best fit was obtained whena somewhat lower (generalised) sedimentation rate of 1]10~3 t m~2 yr~1 (Table 1)was assumed for the western Irish Sea compartment.
Each of the 137Cs profiles examined showed a clear sub-surface maximum ata depth of approximately 20 cm. If it is assumed that these maxima correspond to theyear 1981 (as predicted by the semi-empirical model), apparent sedimentation rates ofabout 1.9 cmyr~1 are implied. The seeming discrepancy between these rates and those
P.I. Mitchell et al./J. Environ. Radioactivity 44 (1999) 223—251 239
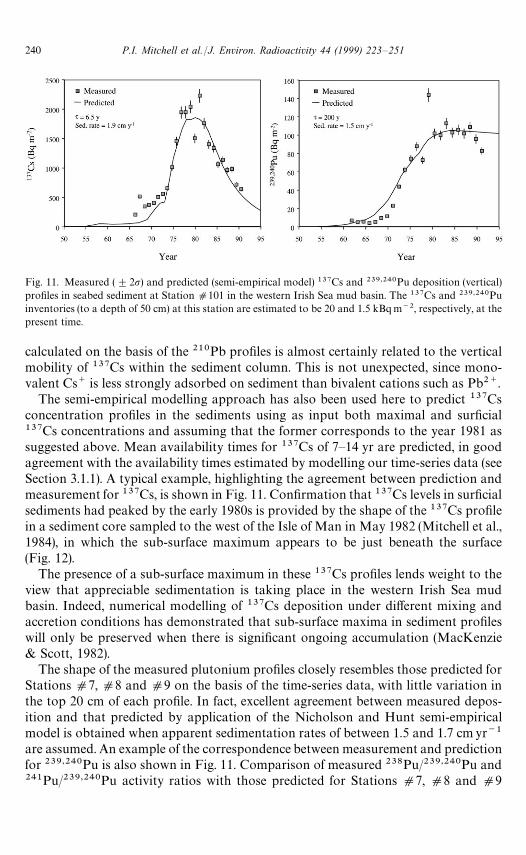
Fig. 11. Measured ($2p) and predicted (semi-empirical model) 137Cs and 239,240Pu deposition (vertical)profiles in seabed sediment at Station d101 in the western Irish Sea mud basin. The 137Cs and 239,240Puinventories (to a depth of 50 cm) at this station are estimated to be 20 and 1.5 kBqm~2, respectively, at thepresent time.
calculated on the basis of the 210Pb profiles is almost certainly related to the verticalmobility of 137Cs within the sediment column. This is not unexpected, since mono-valent Cs` is less strongly adsorbed on sediment than bivalent cations such as Pb2`.
The semi-empirical modelling approach has also been used here to predict 137Csconcentration profiles in the sediments using as input both maximal and surficial137Cs concentrations and assuming that the former corresponds to the year 1981 assuggested above. Mean availability times for 137Cs of 7—14 yr are predicted, in goodagreement with the availability times estimated by modelling our time-series data (seeSection 3.1.1). A typical example, highlighting the agreement between prediction andmeasurement for 137Cs, is shown in Fig. 11. Confirmation that 137Cs levels in surficialsediments had peaked by the early 1980s is provided by the shape of the 137Cs profilein a sediment core sampled to the west of the Isle of Man in May 1982 (Mitchell et al.,1984), in which the sub-surface maximum appears to be just beneath the surface(Fig. 12).
The presence of a sub-surface maximum in these 137Cs profiles lends weight to theview that appreciable sedimentation is taking place in the western Irish Sea mudbasin. Indeed, numerical modelling of 137Cs deposition under different mixing andaccretion conditions has demonstrated that sub-surface maxima in sediment profileswill only be preserved when there is significant ongoing accumulation (MacKenzie& Scott, 1982).
The shape of the measured plutonium profiles closely resembles those predicted forStations d7, d8 and d9 on the basis of the time-series data, with little variation inthe top 20 cm of each profile. In fact, excellent agreement between measured depos-ition and that predicted by application of the Nicholson and Hunt semi-empiricalmodel is obtained when apparent sedimentation rates of between 1.5 and 1.7 cmyr~1
are assumed. An example of the correspondence between measurement and predictionfor 239,240Pu is also shown in Fig. 11. Comparison of measured 238Pu/239,240Pu and241Pu/239,240Pu activity ratios with those predicted for Stations d7, d8 and d9
P.I. Mitchell et al./J. Environ. Radioactivity 44 (1999) 223—251240
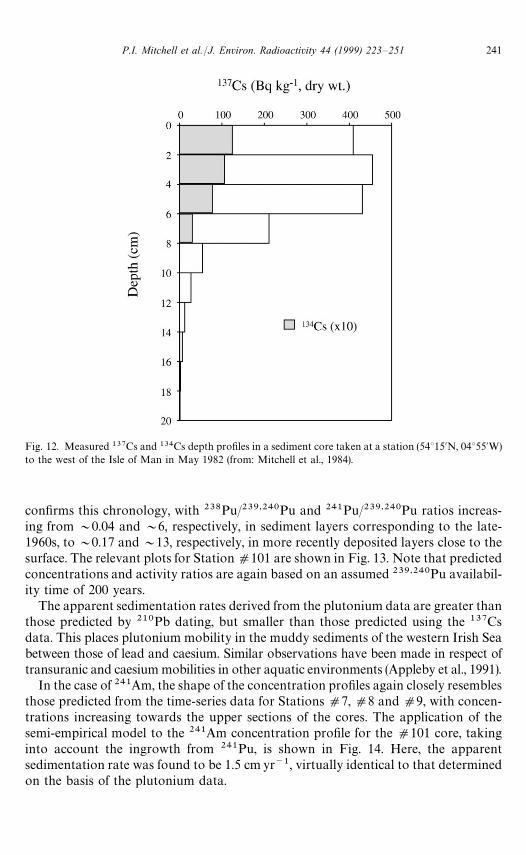
Fig. 12. Measured 137Cs and 134Cs depth profiles in a sediment core taken at a station (54°15@N, 04°55@W)to the west of the Isle of Man in May 1982 (from: Mitchell et al., 1984).
confirms this chronology, with 238Pu/239,240Pu and 241Pu/239,240Pu ratios increas-ing from&0.04 and&6, respectively, in sediment layers corresponding to the late-1960s, to&0.17 and&13, respectively, in more recently deposited layers close to thesurface. The relevant plots for Station d101 are shown in Fig. 13. Note that predictedconcentrations and activity ratios are again based on an assumed 239,240Pu availabil-ity time of 200 years.
The apparent sedimentation rates derived from the plutonium data are greater thanthose predicted by 210Pb dating, but smaller than those predicted using the 137Csdata. This places plutonium mobility in the muddy sediments of the western Irish Seabetween those of lead and caesium. Similar observations have been made in respect oftransuranic and caesium mobilities in other aquatic environments (Appleby et al., 1991).
In the case of 241Am, the shape of the concentration profiles again closely resemblesthose predicted from the time-series data for Stations d7, d8 and d9, with concen-trations increasing towards the upper sections of the cores. The application of thesemi-empirical model to the 241Am concentration profile for the d101 core, takinginto account the ingrowth from 241Pu, is shown in Fig. 14. Here, the apparentsedimentation rate was found to be 1.5 cm yr~1, virtually identical to that determinedon the basis of the plutonium data.
P.I. Mitchell et al./J. Environ. Radioactivity 44 (1999) 223—251 241
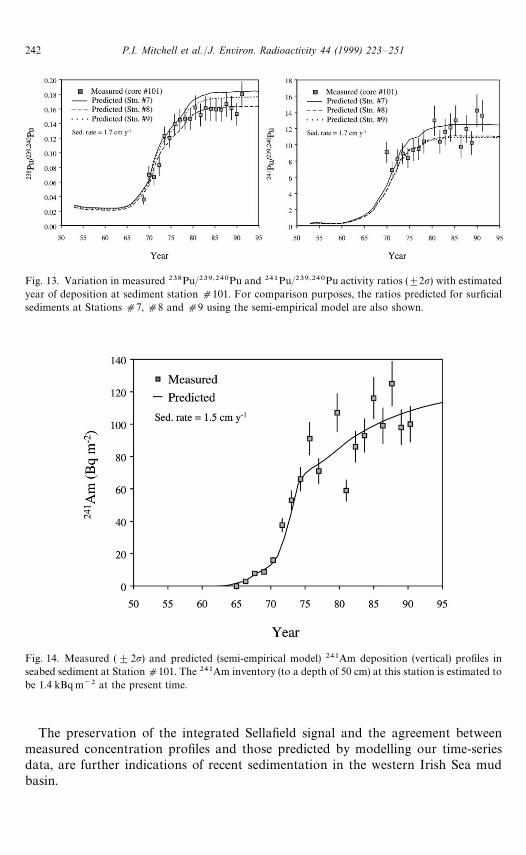
Fig. 13. Variation in measured 238Pu/239,240Pu and 241Pu/239,240Pu activity ratios ($2p) with estimatedyear of deposition at sediment station d101. For comparison purposes, the ratios predicted for surficialsediments at Stations d7, d8 and d9 using the semi-empirical model are also shown.
Fig. 14. Measured ($2p) and predicted (semi-empirical model) 241Am deposition (vertical) profiles inseabed sediment at Station d101. The 241Am inventory (to a depth of 50 cm) at this station is estimated tobe 1.4 kBqm~2 at the present time.
The preservation of the integrated Sellafield signal and the agreement betweenmeasured concentration profiles and those predicted by modelling our time-seriesdata, are further indications of recent sedimentation in the western Irish Sea mudbasin.
P.I. Mitchell et al./J. Environ. Radioactivity 44 (1999) 223—251242
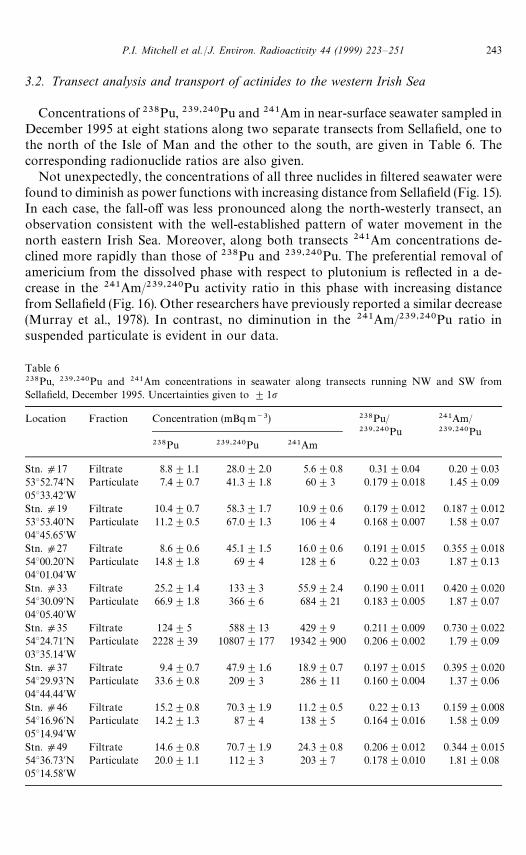
Table 6238Pu, 239,240Pu and 241Am concentrations in seawater along transects running NW and SW fromSellafield, December 1995. Uncertainties given to $1p
Location Fraction Concentration (mBqm~3) 238Pu/ 241Am/239,240Pu 239,240Pu
238Pu 239,240Pu 241Am
Stn. d17 Filtrate 8.8$1.1 28.0$2.0 5.6$0.8 0.31$0.04 0.20$0.0353°52.74@N Particulate 7.4$0.7 41.3$1.8 60$3 0.179$0.018 1.45$0.0905°33.42@WStn. d19 Filtrate 10.4$0.7 58.3$1.7 10.9$0.6 0.179$0.012 0.187$0.01253°53.40@N Particulate 11.2$0.5 67.0$1.3 106$4 0.168$0.007 1.58$0.0704°45.65@WStn. d27 Filtrate 8.6$0.6 45.1$1.5 16.0$0.6 0.191$0.015 0.355$0.01854°00.20@N Particulate 14.8$1.8 69$4 128$6 0.22$0.03 1.87$0.1304°01.04@WStn. d33 Filtrate 25.2$1.4 133$3 55.9$2.4 0.190$0.011 0.420$0.02054°30.09@N Particulate 66.9$1.8 366$6 684$21 0.183$0.005 1.87$0.0704°05.40@WStn. d35 Filtrate 124$5 588$13 429$9 0.211$0.009 0.730$0.02254°24.71@N Particulate 2228$39 10807$177 19342$900 0.206$0.002 1.79$0.0903°35.14@WStn. d37 Filtrate 9.4$0.7 47.9$1.6 18.9$0.7 0.197$0.015 0.395$0.02054°29.93@N Particulate 33.6$0.8 209$3 286$11 0.160$0.004 1.37$0.0604°44.44@WStn. d46 Filtrate 15.2$0.8 70.3$1.9 11.2$0.5 0.22$0.13 0.159$0.00854°16.96@N Particulate 14.2$1.3 87$4 138$5 0.164$0.016 1.58$0.0905°14.94@WStn. d49 Filtrate 14.6$0.8 70.7$1.9 24.3$0.8 0.206$0.012 0.344$0.01554°36.73@N Particulate 20.0$1.1 112$3 203$7 0.178$0.010 1.81$0.0805°14.58@W
3.2. Transect analysis and transport of actinides to the western Irish Sea
Concentrations of 238Pu, 239,240Pu and 241Am in near-surface seawater sampled inDecember 1995 at eight stations along two separate transects from Sellafield, one tothe north of the Isle of Man and the other to the south, are given in Table 6. Thecorresponding radionuclide ratios are also given.
Not unexpectedly, the concentrations of all three nuclides in filtered seawater werefound to diminish as power functions with increasing distance from Sellafield (Fig. 15).In each case, the fall-off was less pronounced along the north-westerly transect, anobservation consistent with the well-established pattern of water movement in thenorth eastern Irish Sea. Moreover, along both transects 241Am concentrations de-clined more rapidly than those of 238Pu and 239,240Pu. The preferential removal ofamericium from the dissolved phase with respect to plutonium is reflected in a de-crease in the 241Am/239,240Pu activity ratio in this phase with increasing distancefrom Sellafield (Fig. 16). Other researchers have previously reported a similar decrease(Murray et al., 1978). In contrast, no diminution in the 241Am/239,240Pu ratio insuspended particulate is evident in our data.
P.I. Mitchell et al./J. Environ. Radioactivity 44 (1999) 223—251 243

Fig. 15. Fall-off in 239,240Pu and 241Am concentrations ($2p) in filtered surface seawater with increasingdistance from the Sellafield outfall (NW and SW transects).
Fig. 16. Measured 241Am/239,240Pu activity ratios ($2p) in filtered seawater and suspended particulatewith increasing distance from the Sellafield outfall.
239,240Pu and 241Am concentrations in suspended particulate were also observedto diminish as power functions with increasing distance from Sellafield (Fig. 17).Again, a clear distinction was observed between the dispersion of particulate pluto-nium and americium in a northwesterly and a southwesterly direction, with a clearbias towards the former. This confirms the observation made in previous studies(Aston & Stanners, 1981; McDonald et al., 1990; Boust et al., 1996) that the advectionof particle-bound plutonium is more active in a northerly direction.
P.I. Mitchell et al./J. Environ. Radioactivity 44 (1999) 223—251244
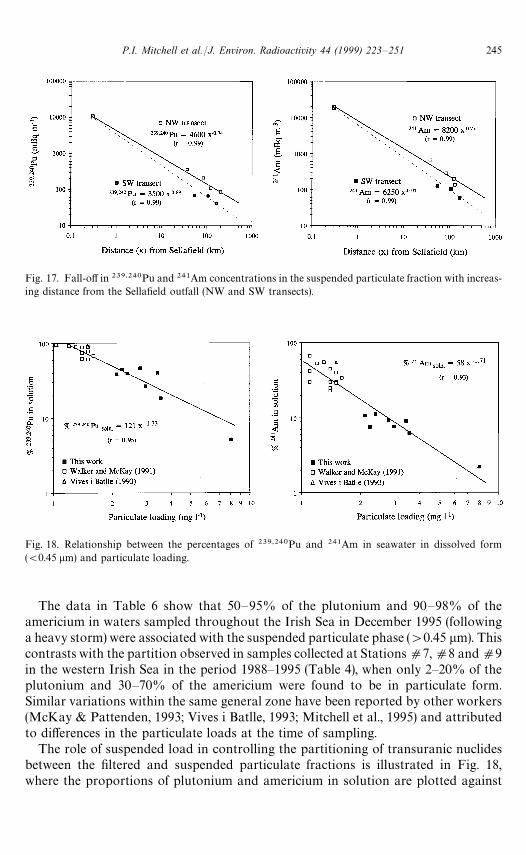
Fig. 17. Fall-off in 239,240Pu and 241Am concentrations in the suspended particulate fraction with increas-ing distance from the Sellafield outfall (NW and SW transects).
Fig. 18. Relationship between the percentages of 239,240Pu and 241Am in seawater in dissolved form((0.45 lm) and particulate loading.
The data in Table 6 show that 50—95% of the plutonium and 90—98% of theamericium in waters sampled throughout the Irish Sea in December 1995 (followinga heavy storm) were associated with the suspended particulate phase ('0.45 lm). Thiscontrasts with the partition observed in samples collected at Stations d7, d8 and d9in the western Irish Sea in the period 1988—1995 (Table 4), when only 2—20% of theplutonium and 30—70% of the americium were found to be in particulate form.Similar variations within the same general zone have been reported by other workers(McKay & Pattenden, 1993; Vives i Batlle, 1993; Mitchell et al., 1995) and attributedto differences in the particulate loads at the time of sampling.
The role of suspended load in controlling the partitioning of transuranic nuclidesbetween the filtered and suspended particulate fractions is illustrated in Fig. 18,where the proportions of plutonium and americium in solution are plotted against
P.I. Mitchell et al./J. Environ. Radioactivity 44 (1999) 223—251 245

Table 7Sediment—water distribution coefficients (K
$s) for plutonium and americium throughout the Irish Sea,
December 1995. Uncertainties given to $1p
Location K$
(total)
239,240Pu 241Am
Stn. d17 (4.3$0.4)]105 (3.1$0.5)]106
Stn. d19 (4.1$0.2)]105 (3.5$0.3)]106
Stn. d27 (6.4$0.5)]105 (3.4$0.2)]106
Stn. d33 (9.3$2.7)]105 (4.1$1.2)]106
Stn. d35 (2.3$0.1)]106 (5.6$0.3)]106
Stn. d37 (1.2$0.1)]106 (4.3$0.3)]106
Stn. d46 (5.5$0.3)]105 (5.5$0.3)]106
Stn. d49 (7.6$0.3)]105 (4.0$0.2)]106
Mean (n"8) (9$6)]105 (4.2$0.9)]106
particulate loading. It is obvious from these plots that temporal and spatialvariations in the partitioning of plutonium and americium between the dissolvedand particulate phases in open Irish Sea waters can largely be explained by variationsin particulate loading. The latter, of course, depends on a number of factorsincluding seasonality, meteorological conditions, currents, depth, nature of the sedi-ment, etc.
Again, as in the case of the western Irish Sea mud basin (Section 3.1.3), thereappears to be a small but significant difference between the mean 238Pu/239Pu activityratio in the filtered and suspended particulate fractions at locations well removedfrom Sellafield (viz., Stations d17, d19, d37, d46 and d49, all of which are locatedin the western/northwestern Irish Sea), reinforcing the view that most of the pluto-nium found in the western Irish Sea has been transported there in dissolved((0.45 lm) form following resolubilisation from the heavily labelled eastern Irish Seasediment pool. Some of the plutonium so transported is likely to have been incolloidal form (Mitchell et al., 1995).
3.3. Sediment-water distribution coefficients
Sediment-water distribution coefficients (K$s) for 239,240Pu and 241Am in both the
eastern and western Irish Sea zones have been deduced from the transect data and aregiven in Table 7. The mean K
$s for both nuclides are consistent with previously
reported values for the Irish Sea (Pentreath et al., 1986; Mitchell et al., 1995). However,there is a suggestion in the data that the K
$for 239,240Pu is slightly higher in the
general vicinity of Sellafield than it is further afield. Such an observation has beenmade previously (Mitchell et al., 1995) and, if correct, may be due to the fact thatplutonium is not in equilibrium within the sediment-water system of the eastern IrishSea at the present time.
P.I. Mitchell et al./J. Environ. Radioactivity 44 (1999) 223—251246

Fig. 19. Predicted (compartmental model) and measured 239,240Pu concentrations in (a) surface sedimentin the eastern Irish Sea; (b) surface sediment in the western Irish Sea; (c) filtered water in the eastern IrishSea; and (d) filtered water in the western Irish Sea (measured concentrations taken from MAFF, 1978—1996;Hunt, 1985; Walker & McKay, 1991; McKay & Pattenden, 1993; Condren et al., 1996b; Leon Vintro, 1997;Leonard et al., 1999; this study).
3.4. Compartmental model predictions
The correspondence between predicted and measured 239,240Pu concentrations insurface sediment and seawater in the Cumbrian and western Irish Sea regionalcompartments is shown in Fig. 19. It is evident from these plots that there is goodagreement between measured and model-predicted concentrations for this nuclide.Preliminary analysis showed that the field data could not be reproduced by the modelwithout the inclusion of the sedimentary processes discussed in Section 2.3.2 above.Overall, the agreement is satisfactory and gives confidence that the model can be usedto provide realistic estimates of future concentrations in the various regional compart-ments.
Model predictions to the year 2100 of 239,240Pu concentrations in surface sedimentand seawater in the western Irish Sea compartment are given in Fig. 20. Clearly,239,240Pu concentrations are now just past their peak and are predicted to showa slow but steady decline into the future. In the case of the western Irish Sea, the modelpredicts mean availability times of ca. 100 yr for 239,240Pu in seawater and surface
P.I. Mitchell et al./J. Environ. Radioactivity 44 (1999) 223—251 247

Fig. 20. Predicted (compartmental model) 239,240Pu concentrations in surface sediment and seawater inthe western Irish Sea for the period 1950—2100.
sediments. This is at the shorter end of the range predicted by the semi-empiricalmodel, though the validity of using the latter to predict concentrations hundreds ofyears ahead is clearly questionable, given the large uncertainty in the estimatedavailability time for 239,240Pu referred to in Section 3.1.1 above.
4. Conclusions
Our modelling results, supported by experimental observation, show conclusivelythat 137Cs concentrations in western Irish Sea water and surficial sediment havealready peaked and are now in steady decline, with estimated mean availability timesfor 137Cs of+17 months and+7—16 yr, respectively, at the present time. The totalinventory in surface and deep sediments (combined) is also falling, with the somewhatlonger mean availability time of+22 yr. These calculations are based on the assump-tion that discharges from Sellafield will remain at their present low level for severalhundreds of years to come. At the present time, 137Cs concentrations in seawater arelittle more than an order of magnitude higher than open ocean fallout levels, whileconcentrations in surface sediment are about two orders of magnitude higher.
In the case of 239,240Pu, our models show that concentrations in seawater andsurface sediment in the western Irish Sea mud basin peaked in the late 1970s and earlyto mid-1980s, respectively. However, they predict that the fall-off in both compart-ments will be very much slower than for 137Cs. A similar observation applies to241Am. Field measurements in the period 1988—97 are consistent with these predic-tions. In contrast, the 239,240Pu inventory in deep sediment has not yet peaked and isnot predicted to do so for at least several thousand years, provided these sediments arenot subjected to significant physical disturbance (e.g., seismic activity).
It has been clear for some time that the decreases observed in 137Cs and plutoniumconcentrations in the eastern Irish Sea can only be explained on the basis of
P.I. Mitchell et al./J. Environ. Radioactivity 44 (1999) 223—251248

remobilisation from the seabed sediments in this region. It is now evident that thetemporal evolution of 137Cs and plutonium concentrations in the western Irish Sea isbeing driven by the rate at which these nuclides are being remobilised in the easternIrish Sea and transferred to the western Irish Sea. Measurement of transuraniumactivity ratios in the western Irish Sea mud basin, as well as in filtered and suspendedparticulate sampled in east—west transects from Sellafield, indicate that desorption ofthese nuclides from the pool of well-mixed sediments in the eastern Irish Sea, followedby transfer, primarily in soluble form, to the western Irish Sea are the dominantmechanisms involved.
Acknowledgements
We gratefully acknowledge the support of the European Commission who partfunded this study under the European Union’s Radiation Protection Research Actioninitiative (Contracts Nos. Bi7-042 and F13P-CT92-0046). We also acknowledgeCEFAS (UK) and RPII (Ireland) for their generous invitations to participate ina number of ship-borne campaigns in the Irish Sea in the period 1988—97, inclusive.
References
Appleby, P. G., & Oldfield, F. (1978). The calculation of 210Pb dates assuming a constant rate of supply ofunsupported 210Pb to the sediment. Catena, 5, 1—8.
Appleby, P. G., Richardson, N., & Nowlan, P. J. (1991). 241Am dating of lake sediments. Hydrobiologia, 214,35—42.
Aston, S. R., & Stanners, D. A. (1981). Plutonium transport to and deposition and immobility in Irishintertidal sediments. Nature, 289, 581—582.
Boust, D., Mitchell, P. I., Garcia, K., Condren, O., Leon Vintro, L., & Leclerc, G. (1996). A comparativestudy of the speciation and behaviour of plutonium in the marine environment of two reprocessingplants. Radiochimica Acta, 74, 203—210.
Camplin, W. C., Durance, J. A., & Jefferies, D. F. (1982). A marine compartment model for collective doseassessment of liquid radioactive effluents. Sizewell Enquiry Series 4 (pp. 1—22). Lowestoft: MAFFDirectorate of Fisheries Research.
Condren, O. M. (1998). Plutonium, americium and radiocaesium in the western Irish Sea: Origin, bioavailabil-ity and ultimate fate. PhD Thesis, National University of Ireland, Dublin (160 pp).
Condren, O. M., Leon Vintro, L., Mitchell, P. I., & Ryan, T. P. (1996a). A new approach to quenchcorrection when measuring 241Pu in the presence of Pu-a by supported-disc liquid scintillationspectrometry. Applied Radiation and Isotopes, 47(9/10), 875—878.
Condren, O. M., Mitchell, P. I., Leon Vintro, L., & Downes, A. B. (1996b). Plutonium in western Irish Seasediments: Origin, bio-availability and ultimate fate. In B. F. Keegan, & R. O’Connor (Eds.), Irishmarine science 1995 (pp. 567—583). University College, Galway: Galway University Press.
Cook, G. T., MacKenzie, A. B., McDonald, P., & Jones, S. R. (1997). Remobilization of Sellafield-derivedradionuclides and transport from the north east Irish Sea. Journal of Environmental Radioactivity, 35,227—241.
Croker, P. F. (1995). Shallow gas accumulation and migration in the western Irish Sea. In P. F. Croker &P. M. Shannon (Eds.), ¹he petroleum geology of Ireland’s offshore basins. Geological Society SpecialPublication No. 93 (pp. 43—58).
P.I. Mitchell et al./J. Environ. Radioactivity 44 (1999) 223—251 249
Cunningham, J. D., & O’Grady, J. (1986). Radioactivity Monitoring of the Irish marine environment during1982—84 (26pp). Dublin: Nuclear Energy Board.
Cunningham, J. D., O’Grady, J., Rush, T. (1988). Radioactivity monitoring of the Irish marine environment,1985—86 (35pp). Dublin: Nuclear Energy Board.
EC (1995). Methodology for assessing the radiological consequences of routine releases of radionuclides to theenvironment. European Commission, Luxembourg, EUR 15760 EN.
Goldberg, E. D. (1963). Geochronology with 210Pb. In Radioactive dating. IAEA STI/PUB 68 (pp. 121—131).Gray, J. J., Jones, S. R., & Smith, A. D. (1995). Discharges to the environment from the Sellafield site,
1951—1992. Journal of Radiological Protection, 15, 99—131.Hetherington, J. A. (1976). The behaviour of plutonium nuclides in the Irish Sea. In W. Miller, & J. N.
Stannard (Eds.), Environmental toxicity of aquatic radionuclides (pp. 81—106). Ann Arbor, Michigan:Ann Arbor Science.
Hunt, G. J. (1985). Timescales for dilution and dispersion of transuranics in the Irish Sea near Sellafield.Science of the ¹otal Environment, 46, 261—278.
Hunt, G. J., & Kershaw, P. J. (1990). Remobilisation of artificial radionuclides from the sediment of the IrishSea. Journal of Radiological Protection, 10, 147—151.
Jefferies, D. F., & Steele, A. K. (1989). Observed and predicted concentrations of caesium-137 in seawater ofthe Irish Sea 1970—1985. Journal of Environmental Radioactivity, 10, 173—189.
Jefferies, D. F., Steele, A. K., & Preston, A. (1982). Further studies on the distribution of 137Cs in Britishcoastal waters — I. Irish Sea. Deep Sea Research, 29, 713—738.
Kershaw,P. J. (1986).Radiocarbondatingof IrishSea sediments.EstuarineandCoastalShelf Science, 23, 295—303.Kershaw, P. J., Pentreath, R. J., Woodhead, D. S., & Hunt, G. J. (1988a). Scavenging and bioturbation in the
Irish Sea from measurements of 234Th/238U and 210Pb/226Ra disequilibria. In J. C. Guary, P.Guegueniat, R. J. Pentreath (Eds.), Radionuclides: A tool for oceanography (pp. 131—142). London:Elsevier Applied Science.
Kershaw, P. J., Swift, D. J., & Denoon, D. C. (1988b). Evidence of recent sedimentation in the eastern IrishSea. Marine Geology, 85, 1—14.
Kershaw, P. J., Woodhead, D. S., Malcolm, S. J., Allington, D. J., & Lovett, M. B. (1990). A sediment historyof Sellafield discharges. Journal of Environmental Radioactivity, 12, 201—241.
Leonard, K. S., McCubbin, D., Brown, J., Bonfield, R., & Brooks, T. (1997). Distribution of technetium-99in UK coastal waters. Marine Pollution Bulletin, 34(8), 628—636.
Leonard, K. S. et al. (1999). Dissolved plutonium and americium in surface waters of the Irish Sea,1973—1996. Journal of Environmental Radioactivity, 44(2—3), 129—158.
Leon Vintro, L. (1997). ¹he determination of transuranium isotopic signatures in environmental materials and theirapplication to the study of marine processes. PhD Thesis, National University of Ireland, Dublin. (184 pp).
Long, S., Hayden, E., Lyons, S., Ryan, T. P., Smith, V., Pollard, D., McGarry, A., & Cunningham, J. D.(1996). Radioactivity monitoring of the Irish marine environment. In B. F. Keegan, & R. O’Connor(Eds.), Irish marine science 1995 (pp. 557—566). University College Galway: Galway University Press.
MacKenzie, A. B., & Scott, R. D. (1982). Radiocaesium and plutonium in inter-tidal sediments fromsouthern Scotland. Nature, 299, 613—616.
MacKenzie, J., & Nicholson, S. (1987). CO¸DOS — A computer code for the estimation of collective doses fromradioactive releases to the sea. United Kingdom Atomic Energy Authority Report. Safety and Reliabil-ity Directorate, SDR-R-389, 35pp.
MacKenzie, A. B., Scott, R. D., & Williams, T. M. (1987). Mechanisms for northwards dispersal of Sellafieldwaste. Nature, 329, 42—45.
MacKenzie, A. B., Scott, R. D., Allan, R. L., Ben Shaban, Y. A., Cook, G. T., & Pulford, I. D. (1994).Sediment radionuclide profiles: Implications for mechanisms of Sellafield waste dispersal in the IrishSea. Journal of Environmental Radioactivity, 23, 36—69.
MAFF (1967—97), Radioactivity in surface and coastal waters of the British Isles, 1963—94. Ministry ofAgriculture, Fisheries and Food, Directorate of Fisheries Research, Lowestoft, Technical Reports Nos.(FRL) 1, 2, 5, 7, 8, 9, 10, 11, 12 and 13; Aquatic Environment Monitoring Reports Nos. 3, 4, 6, 8, 9, 11,12, 13, 14, 18, 19, 21, 23, 29, 34, 38, 42 and 45; Radioactivity in Food and the Environment Reports Nos.(RIFE) 1, 2.
P.I. Mitchell et al./J. Environ. Radioactivity 44 (1999) 223—251250

McCartney, M., Kershaw, P. J., & Allington, D. J. (1990). The behaviour of 210Pb and 226Ra in the easternIrish Sea. Journal of Environmental Radioactivity, 12, 243—265.
McCartney, M., Kershaw, P. J., Woodhead, D. S., & Denoon, D. C. (1994). Artificial radionuclides in thesurface sediments of the Irish Sea, 1968—1988. Science of the ¹otal Environment, 141, 103—138.
McDonald, P., Cook, G. T., Baxter, M. S., & Thomson, J. C. (1990). Radionuclide transfer from Sellafield toSouth-West Scotland. Journal of Environmental Radioactivity, 12, 285—298.
McGarry, A., Lyons, S., McEnri, C., Ryan, T., O’Colmain, M., & Cunningham, J. D. (1994). Radioactivitymonitoring of the Irish marine environment, 1991 and 1992 (38pp). Dublin: Radiological ProtectionInstitute of Ireland.
McKay, W. A., & Pattenden, N. J. (1993). The behaviour of plutonium and americium in the shoreline waters ofthe Irish Sea: a review of Harwell studies in the 1980s. Journal of Environmental Radioactivity, 18, 99—132.
McKay, W. A., Baxter, M. S., Ellet, D. J., & Meldrum, D. T. (1986). Radiocaesium and circulation patternswest of Scotland. Journal of Environmental Radioactivity, 4, 205—232.
Mitchell, P. I., Gonzalo, M., & Vidal-Quadras, A. (1984). Levels of radioactive caesium and potassium inthe marine environment of Ireland. In Actas de la IX Reunio& n Anual de la Sociedad Nuclear EspanJ ola,Sevilla, 5—7 December 1983 (Vol. III, Sect. 3.8, pp. 1—20).
Mitchell, P. I., Sanchez-Cabeza, J. A., Vidal-Quadras, A., & Font, J. L. (1987). Distribution of plutonium ininshore waters around Ireland using Fucus vesiculosus as a bio-indicator. In Proceedings ofCEC/CIEMA¹ Seminar on the cycling of long-lived radionuclides in the biosphere: Observations andmodels, Madrid, 15—19 September 1986 (Vol. II, Section 4, pp. 1—13). Commission of the EuropeanCommunities, Luxembourg .
Mitchell, P.I., Vives i Batlle, J., Ryan, T.P., Schell, W.R., Sanchez-Cabeza, J.A., & Vidal- Quadras, A. (1991),Studies on the speciation of plutonium and americium in the western Irish Sea. In P. J. Kershaw, &D. S. Woodhead (Eds.), Radionuclides in the study of marine processes (pp. 37—51). London: ElsevierApplied Science.
Mitchell, P. I., Vives i Batlle, J., Downes, A. B., Condren, O. M., Leon Vintro, L., & Sanchez-Cabeza, J. A.(1995). Recent observations on the physico-chemical speciation of plutonium in the Irish Sea and thewestern Mediterranean. Applied Radiation and Isotopes, 46, 1175—1190.
Murray, C. N., Kautsky, H., Hoppenheit, M., & Domian, N. (1978). Actinide activities in water entering thenorthern North Sea. Nature, 276, 225—230.
Nicholson, M. D., & Hunt, G. J. (1995). Measuring the availability to sediments and biota of radionuclidesin wastes discharged to the sea. Journal of Environmental Radioactivity, 28, 43—56.
Nielsen, S. P., Iosjpe, M., & Strand, P. (1995). A preliminary assessment of potential doses to man fromradioactive waste dumped in the Arctic Sea. RIS" National Laboratory Report, RIS"-R-841(EN), 53 pp.
Officer, C. B. (1982). Mixing, sedimentation rates and age dating for sediment cores. Marine Geology, 46,261—278.
O’Grady, J., & Currivan, L. (1990). Radioactivity monitoring of the Irish marine environment, 1987 (28 pp).Dublin: Nuclear Energy Board.
Pentreath, R. J., Woodhead, D. S., Kershaw, P. J., Jefferies, D. F., & Lovett, M. B. (1986). The behaviour ofplutonium and americium in the Irish Sea. Rapports et Proces—»erbaux des Reunious Conseil Interna-tional pour Exploration de la Mer., 186, 60—69.
Pollard, D., Long, S., Hayden, E., Smith, V., Ryan, T. P., Dowdall, A., McGarry, A., & Cunningham, J. D.(1996). Radioactivity monitoring of the Irish marine environment, 1993 to 1995 (41pp) Dublin. Radi-ological Protection Institute of Ireland.
Poole, A. J., Denoon, D. C., & Woodhead, D. S. (1997). The distribution and inventory of 137Cs in sub-tidalsediments of the Irish Sea. Radioprotection — Colloques, 32(C2), 263—270.
Tobin, M. J., & Schell, W. R. (1989). Recent developments in sedimentation modelling and the statisticalreliability of the 210Pb method. In Proceedings of the International Symposium on ¹race Metals in¸akes (23pp). McMaster University, Ontario, Canada.
Vives i Batlle, J. (1993). Speciation and bioavailability of plutonium and americium in the Irish Sea and othermarine ecosystems. PhD Thesis, National University of Ireland, Dublin, (347pp).
Walker, M. I., & McKay, W. A. (1991). Radionuclide distributions in seawater around the Sellafieldpipeline. Estuarine and Coastal Shelf Science, 32, 385—393.
P.I. Mitchell et al./J. Environ. Radioactivity 44 (1999) 223—251 251