Embed Size (px)
Citation preview
Trends in Pay Determination:
What Does WERS Tell Us?
Alex Bryson
Principal Research Fellow, NIESR
Outline
• What is WERS?
• Findings from 2004-2011:
1. Pay Determination
2. Pay Settlements
3. Fringe Benefits
4. Incentive Pay
5. Appraisal
6. Pay Satisfaction
• Summary
• Further information
The Workplace Employment
Relations Survey
• National survey mapping employment relations in
workplaces across Britain.
• Unique and comprehensive: data collected from
managers, worker representatives and employees in
2,680 workplaces with 5+ employees.
• Well-established: 1980, 1984, 1990, 1998, 2004, 2011
• Independent: multiple funding sources.
• Endorsed by a range of employer, union and
independent organisations.
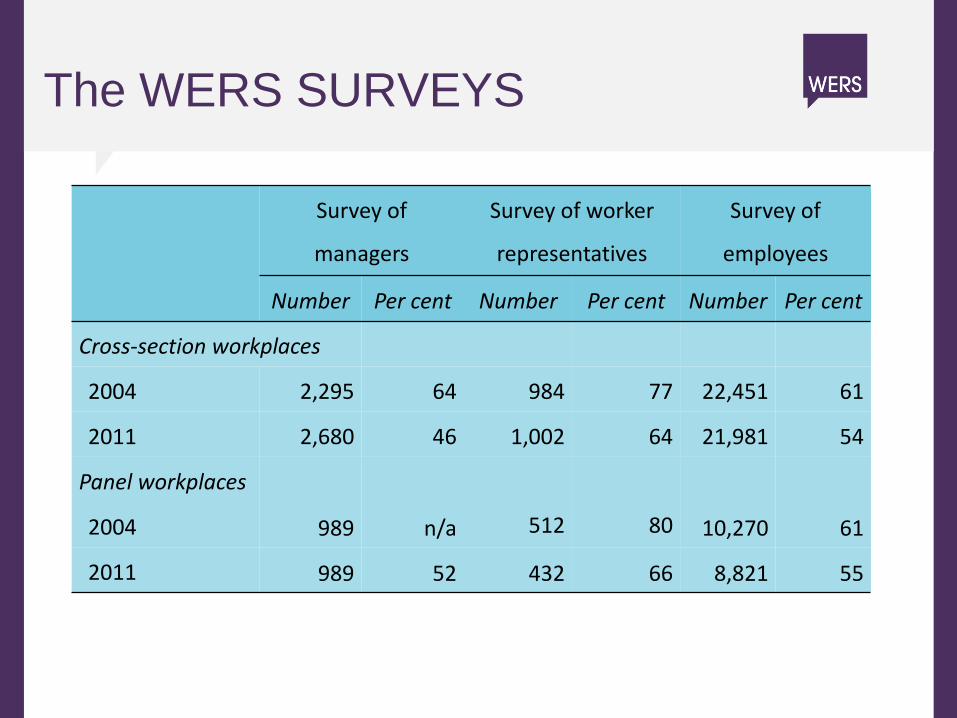
The WERS SURVEYS
Survey of
managers
Survey of worker
representatives
Survey of
employees
Number Per cent Number Per cent Number Per cent
Cross-section workplaces
2004 2,295 64 984 77 22,451 61
2011 2,680 46 1,002 64 21,981 54
Panel workplaces
2004 989 n/a 512 80 10,270 61
2011 989 52 432 66 8,821 55
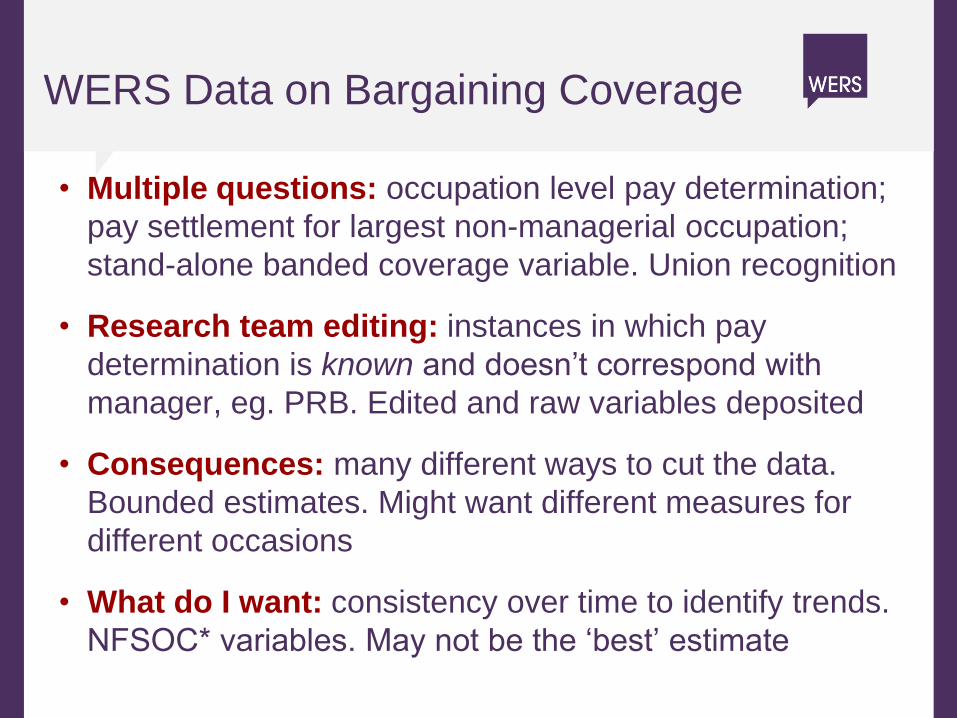
WERS Data on Bargaining Coverage
• Multiple questions: occupation level pay determination;
pay settlement for largest non-managerial occupation;
stand-alone banded coverage variable. Union recognition
• Research team editing: instances in which pay
determination is known and doesn’t correspond with
manager, eg. PRB. Edited and raw variables deposited
• Consequences: many different ways to cut the data.
Bounded estimates. Might want different measures for
different occasions
• What do I want: consistency over time to identify trends.
NFSOC* variables. May not be the ‘best’ estimate
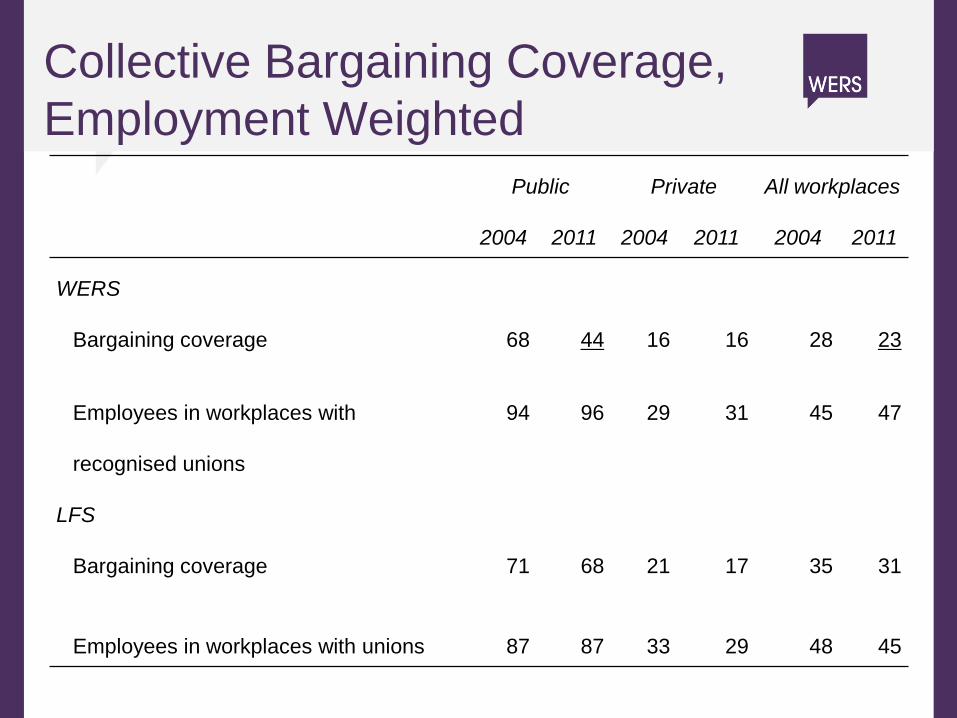
Collective Bargaining Coverage,
Employment Weighted
Public Private All workplaces
2004 2011 2004 2011 2004 2011
WERS
Bargaining coverage 68 44 16 16 28 23
Employees in workplaces with
recognised unions
94 96 29 31 45 47
LFS
Bargaining coverage 71 68 21 17 35 31
Employees in workplaces with unions 87 87 33 29 48 45
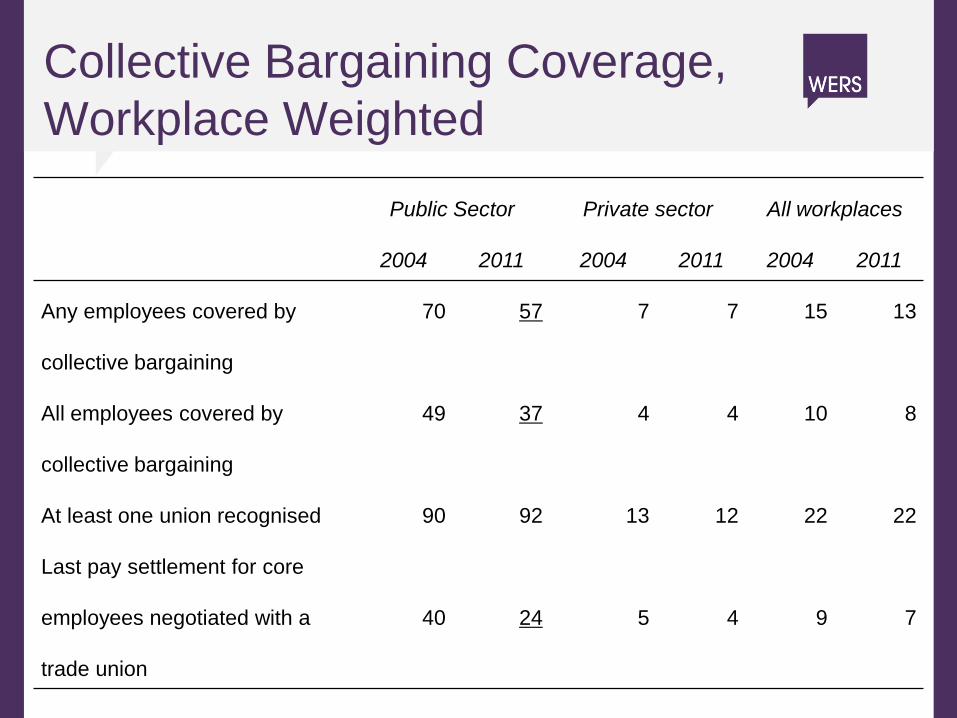
Collective Bargaining Coverage,
Workplace Weighted
Public Sector Private sector All workplaces
2004 2011 2004 2011 2004 2011
Any employees covered by
collective bargaining
70 57 7 7 15 13
All employees covered by
collective bargaining
49 37 4 4 10 8
At least one union recognised 90 92 13 12 22 22
Last pay settlement for core
employees negotiated with a
trade union
40 24 5 4 9 7
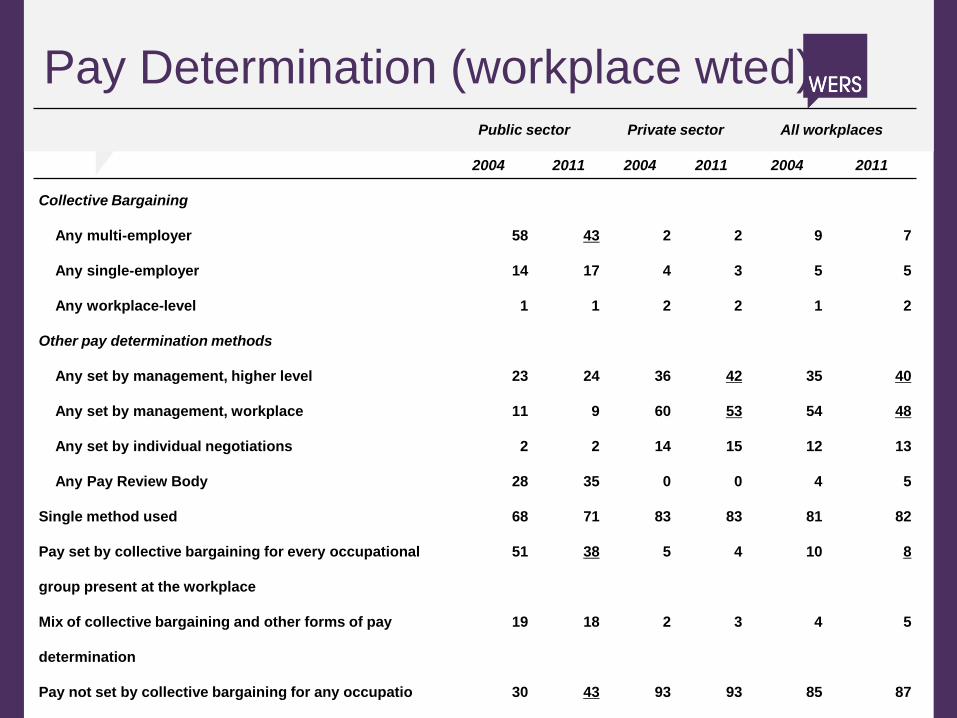
Pay Determination (workplace wted) Public sector Private sector All workplaces
2004 2011 2004 2011 2004 2011
Collective Bargaining
Any multi-employer 58 43 2 2 9 7
Any single-employer 14 17 4 3 5 5
Any workplace-level 1 1 2 2 1 2
Other pay determination methods
Any set by management, higher level 23 24 36 42 35 40
Any set by management, workplace 11 9 60 53 54 48
Any set by individual negotiations 2 2 14 15 12 13
Any Pay Review Body 28 35 0 0 4 5
Single method used 68 71 83 83 81 82
Pay set by collective bargaining for every occupational
group present at the workplace
51 38 5 4 10 8
Mix of collective bargaining and other forms of pay
determination
19 18 2 3 4 5
Pay not set by collective bargaining for any occupatio 30 43 93 93 85 87
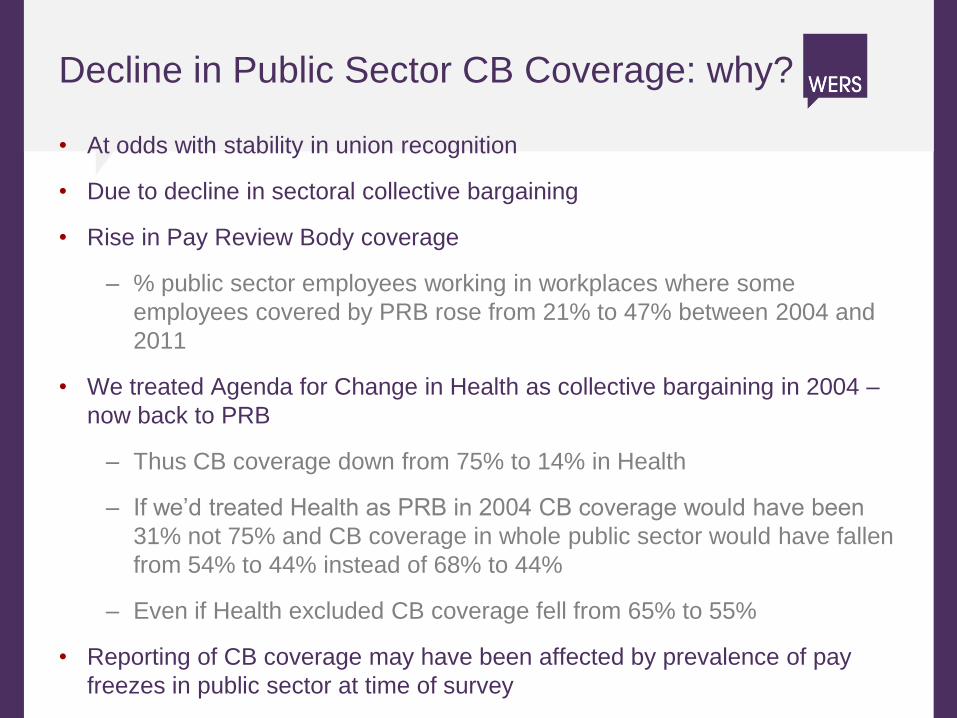
Decline in Public Sector CB Coverage: why?
• At odds with stability in union recognition
• Due to decline in sectoral collective bargaining
• Rise in Pay Review Body coverage
– % public sector employees working in workplaces where some
employees covered by PRB rose from 21% to 47% between 2004 and
2011
• We treated Agenda for Change in Health as collective bargaining in 2004 –
now back to PRB
– Thus CB coverage down from 75% to 14% in Health
– If we’d treated Health as PRB in 2004 CB coverage would have been
31% not 75% and CB coverage in whole public sector would have fallen
from 54% to 44% instead of 68% to 44%
– Even if Health excluded CB coverage fell from 65% to 55%
• Reporting of CB coverage may have been affected by prevalence of pay
freezes in public sector at time of survey
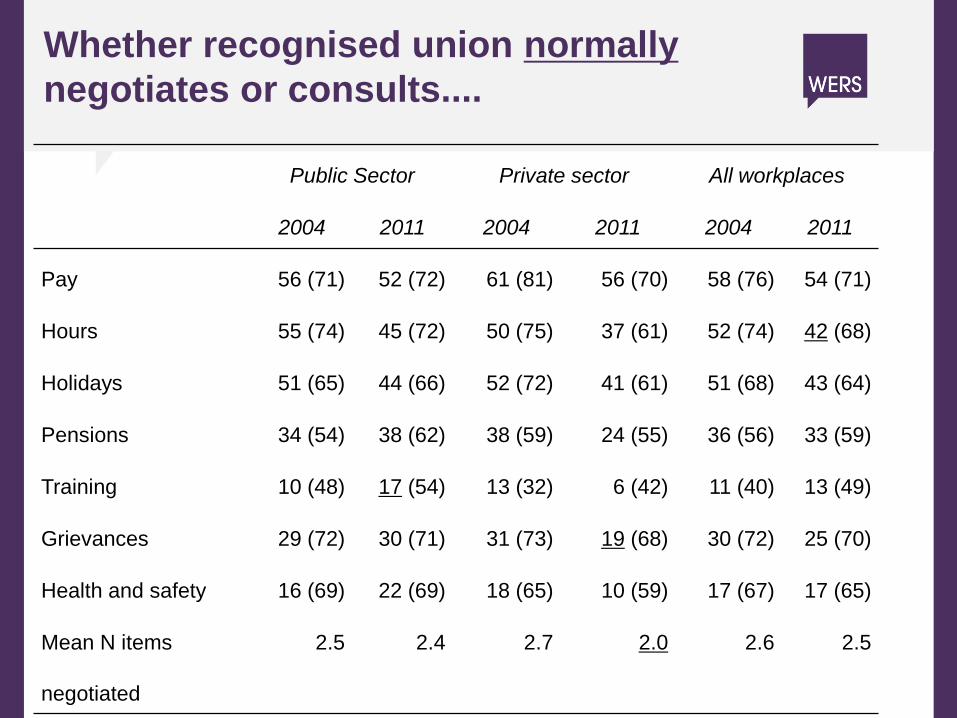
Whether recognised union normally
negotiates or consults....
Public Sector Private sector All workplaces
2004 2011 2004 2011 2004 2011
Pay 56 (71) 52 (72) 61 (81) 56 (70) 58 (76) 54 (71)
Hours 55 (74) 45 (72) 50 (75) 37 (61) 52 (74) 42 (68)
Holidays 51 (65) 44 (66) 52 (72) 41 (61) 51 (68) 43 (64)
Pensions 34 (54) 38 (62) 38 (59) 24 (55) 36 (56) 33 (59)
Training 10 (48) 17 (54) 13 (32) 6 (42) 11 (40) 13 (49)
Grievances 29 (72) 30 (71) 31 (73) 19 (68) 30 (72) 25 (70)
Health and safety 16 (69) 22 (69) 18 (65) 10 (59) 17 (67) 17 (65)
Mean N items
negotiated
2.5 2.4 2.7 2.0 2.6 2.5
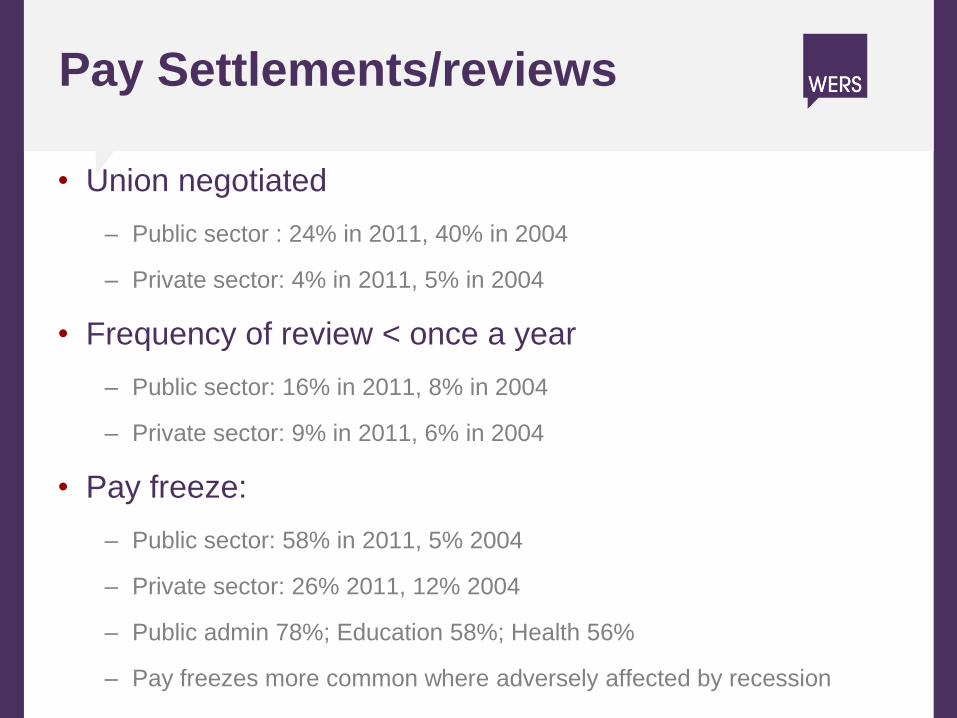
Pay Settlements/reviews
• Union negotiated
– Public sector : 24% in 2011, 40% in 2004
– Private sector: 4% in 2011, 5% in 2004
• Frequency of review < once a year
– Public sector: 16% in 2011, 8% in 2004
– Private sector: 9% in 2011, 6% in 2004
• Pay freeze:
– Public sector: 58% in 2011, 5% 2004
– Private sector: 26% 2011, 12% 2004
– Public admin 78%; Education 58%; Health 56%
– Pay freezes more common where adversely affected by recession
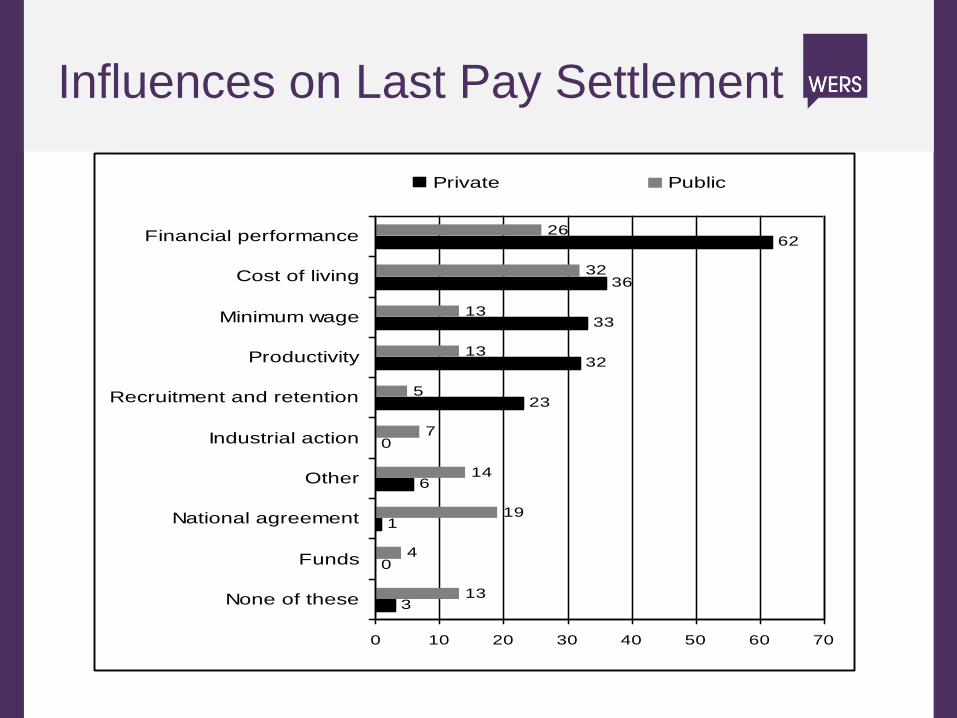
Influences on Last Pay Settlement
0
1
6
0
23
32
33
36
62
13
4
19
14
7
5
13
13
32
26
3
0 10 20 30 40 50 60 70
None of these
Funds
National agreement
Other
Industrial action
Recruitment and retention
Productivity
Minimum wage
Cost of living
Financial performance
Private Public
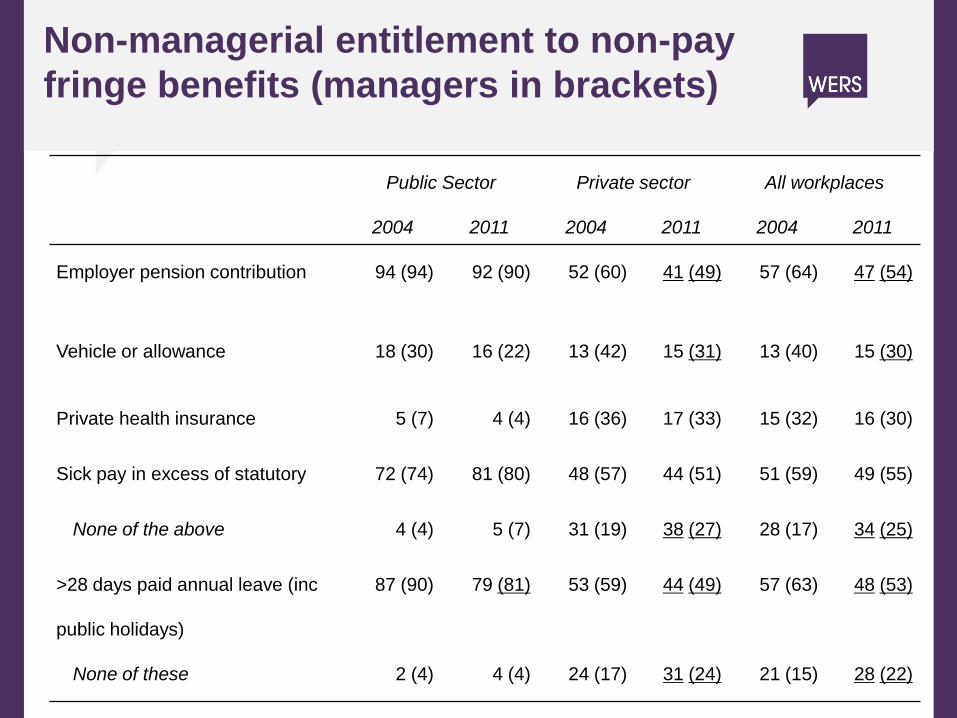
Non-managerial entitlement to non-pay
fringe benefits (managers in brackets)
Public Sector Private sector All workplaces
2004 2011 2004 2011 2004 2011
Employer pension contribution 94 (94) 92 (90) 52 (60) 41 (49) 57 (64) 47 (54)
Vehicle or allowance 18 (30) 16 (22) 13 (42) 15 (31) 13 (40) 15 (30)
Private health insurance 5 (7) 4 (4) 16 (36) 17 (33) 15 (32) 16 (30)
Sick pay in excess of statutory 72 (74) 81 (80) 48 (57) 44 (51) 51 (59) 49 (55)
None of the above 4 (4) 5 (7) 31 (19) 38 (27) 28 (17) 34 (25)
>28 days paid annual leave (inc
public holidays)
87 (90) 79 (81) 53 (59) 44 (49) 57 (63) 48 (53)
None of these 2 (4) 4 (4) 24 (17) 31 (24) 21 (15) 28 (22)
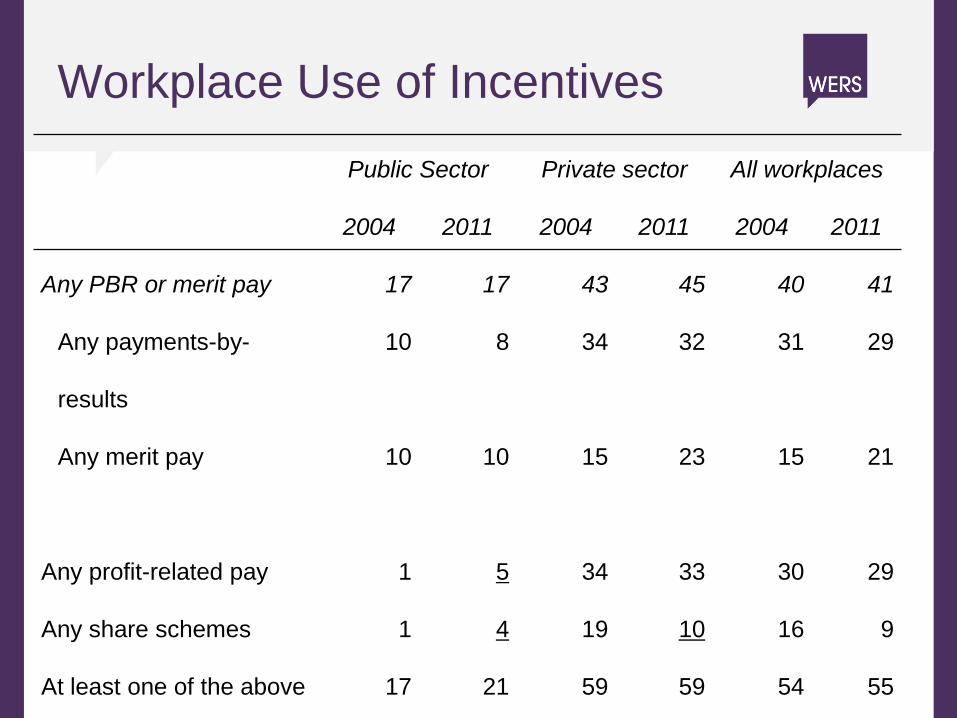
Workplace Use of Incentives
Public Sector Private sector All workplaces
2004 2011 2004 2011 2004 2011
Any PBR or merit pay 17 17 43 45 40 41
Any payments-by-
results
10 8 34 32 31 29
Any merit pay 10 10 15 23 15 21
Any profit-related pay 1 5 34 33 30 29
Any share schemes 1 4 19 10 16 9
At least one of the above 17 21 59 59 54 55
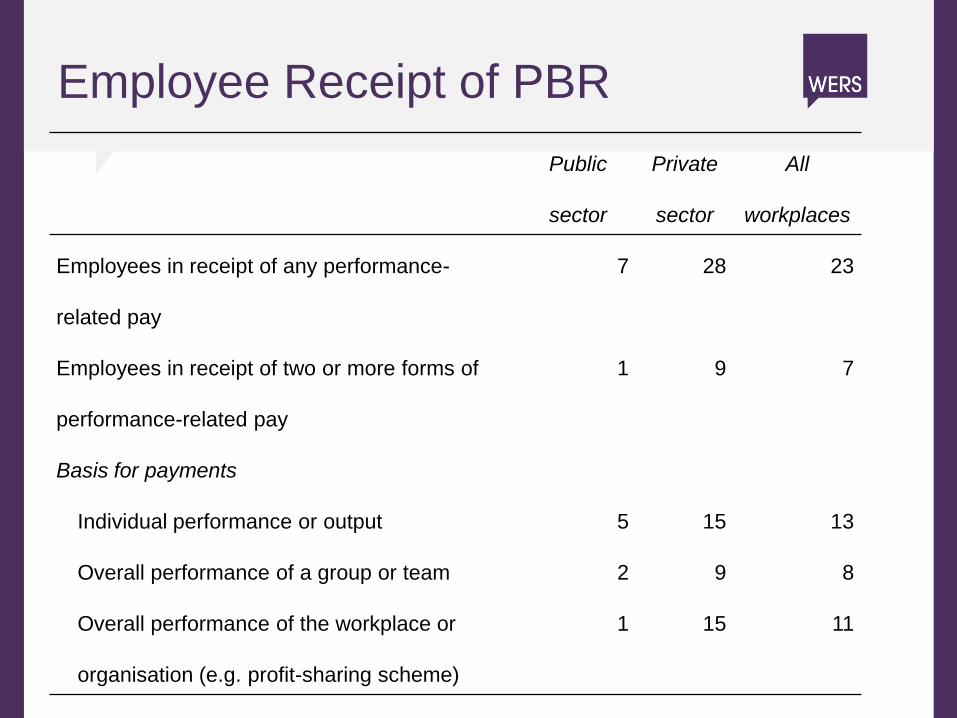
Employee Receipt of PBR
Public
sector
Private
sector
All
workplaces
Employees in receipt of any performance-
related pay
7 28 23
Employees in receipt of two or more forms of
performance-related pay
1 9 7
Basis for payments
Individual performance or output 5 15 13
Overall performance of a group or team 2 9 8
Overall performance of the workplace or
organisation (e.g. profit-sharing scheme)
1 15 11
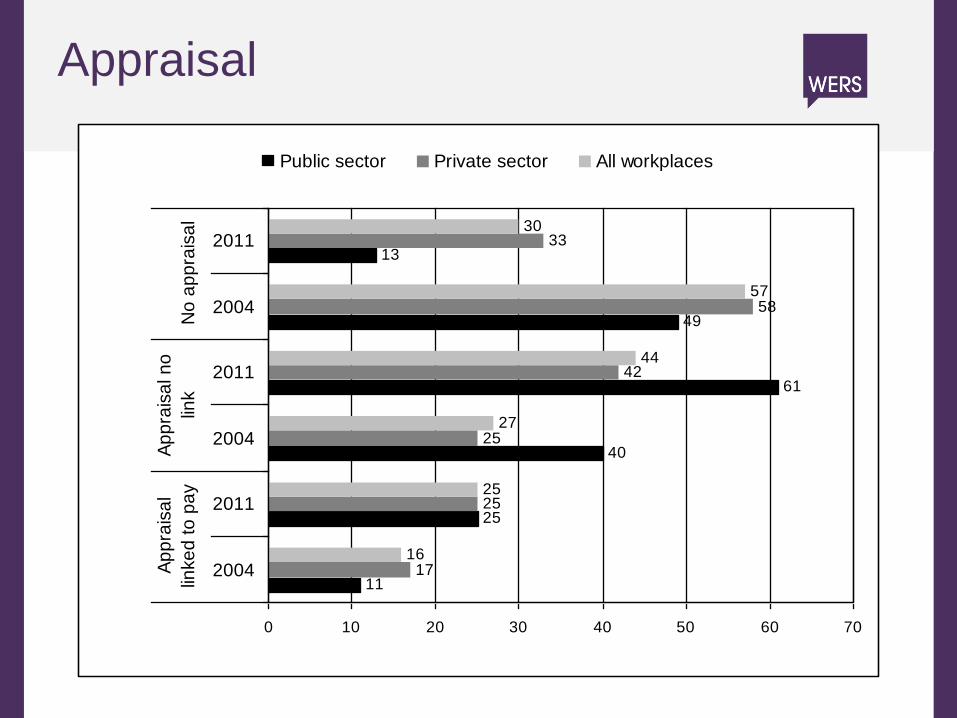
Appraisal
25
40
61
49
13
17
25
25
42
58
33
16
25
27
44
57
30
11
0 10 20 30 40 50 60 70
2004
2011
2004
2011
2004
2011
Ap
pra
isa
l
linke
d t
o p
ay
Ap
pra
isa
l n
o
link
No
ap
pra
isa
l
Public sector Private sector All workplaces
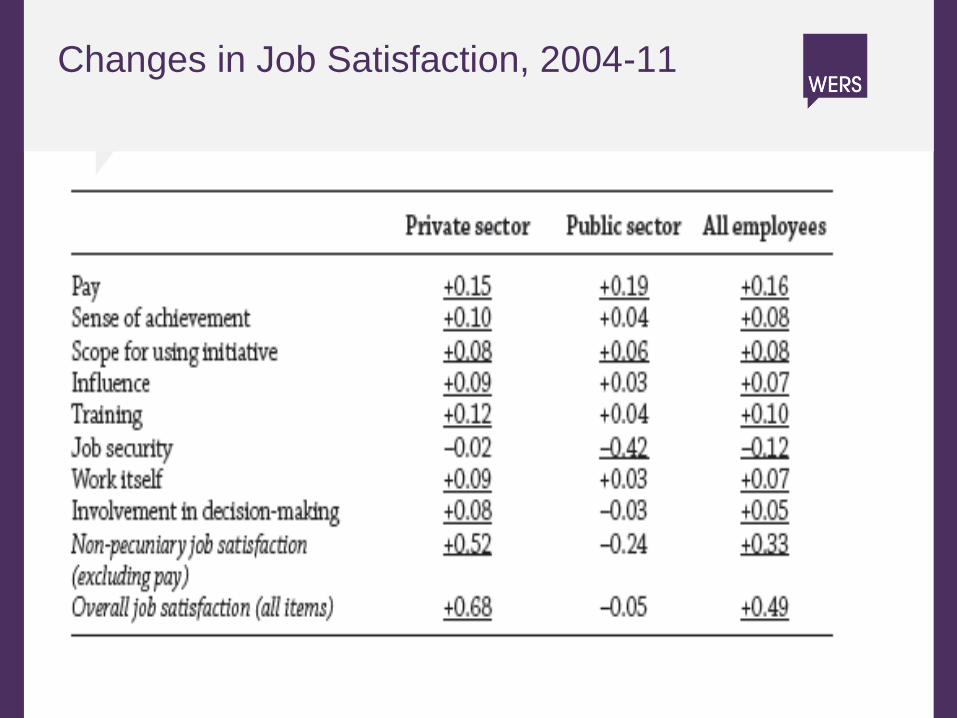
Changes in Job Satisfaction, 2004-11
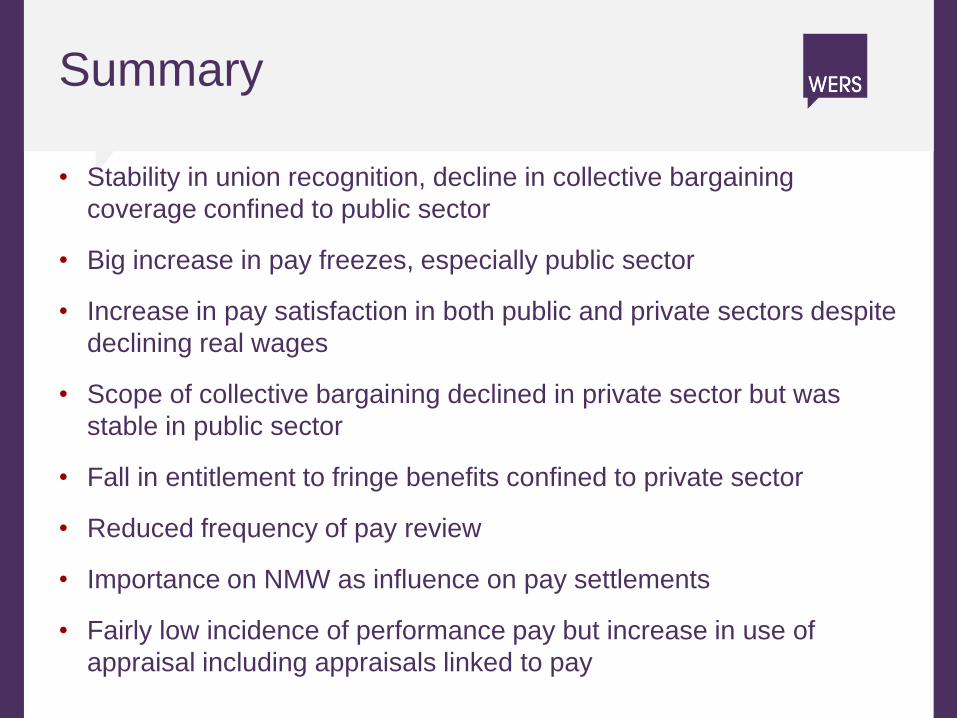
Summary
• Stability in union recognition, decline in collective bargaining
coverage confined to public sector
• Big increase in pay freezes, especially public sector
• Increase in pay satisfaction in both public and private sectors despite
declining real wages
• Scope of collective bargaining declined in private sector but was
stable in public sector
• Fall in entitlement to fringe benefits confined to private sector
• Reduced frequency of pay review
• Importance on NMW as influence on pay settlements
• Fairly low incidence of performance pay but increase in use of
appraisal including appraisals linked to pay
Further Information
• First Findings (2nd edition), and
transparency data, can be
downloaded from:
https://www.gov.uk/government/p
ublications/the-2011-workplace-
employment-relations-study-wers
• WERS data available from UK
Data Service.
• 2011 WERS book available from
Palgrave Macmillan in November.