Embed Size (px)
Citation preview
Trends in Natural Capital, Ecosystem Services and Economic Development in DorsetValuing Nature Research Project Report
Authors: Adrian Newton, Stephen Watson, Paul Evans – Bournemouth University
James Bullock, Morag McCracken, Lucy Ridding – Centre for Ecology & Hydrology
Annela Anger-Kraavi – University of Cambridge
Trends in Natural Capital, Ecosystem Services and Economic Development in DorsetValuing Nature Research Project ReportII
Trends in Natural Capital, Ecosystem Services and Economic Development in DorsetValuing Nature Research Project Report
Suggested citation: Newton, A.C., Watson, S.C.L., Evans, P., Ridding, L., McCracken, M., Anger-Kraavi, A., and Bullock, J. (2019). Trends in natural capital, ecosystem services and economic development in Dorset. Bournemouth University, Poole, UK.
Contents
Summary ................................................................................................................1
Context ...............................................................................................................3
Natural Capital, Ecosystem Services
and Tipping Points .............................................................................................5
Environmental Change in Dorset ...............................................................9
Trends in Natural Asset Status:
Habitat Area ........................................................................................................ 13
Trends in Natural Asset Status:
Condition and Fragmentation ................................................................... 15
Ecosystem Condition
and Service Flows ............................................................................................19
Trends in Ecosystem Services .................................................................... 21
Economic Trends and
Environmental Linkages .............................................................................. 23
Environmental and Economic Linkages:
Poole Harbour as a Case Study ................................................................27
Future Trends ...................................................................................................... 31
Conclusions ..........................................................................................................37
Recommendations ..........................................................................................43
Further information ........................................................................................44
Acknowledgements ........................................................................................45
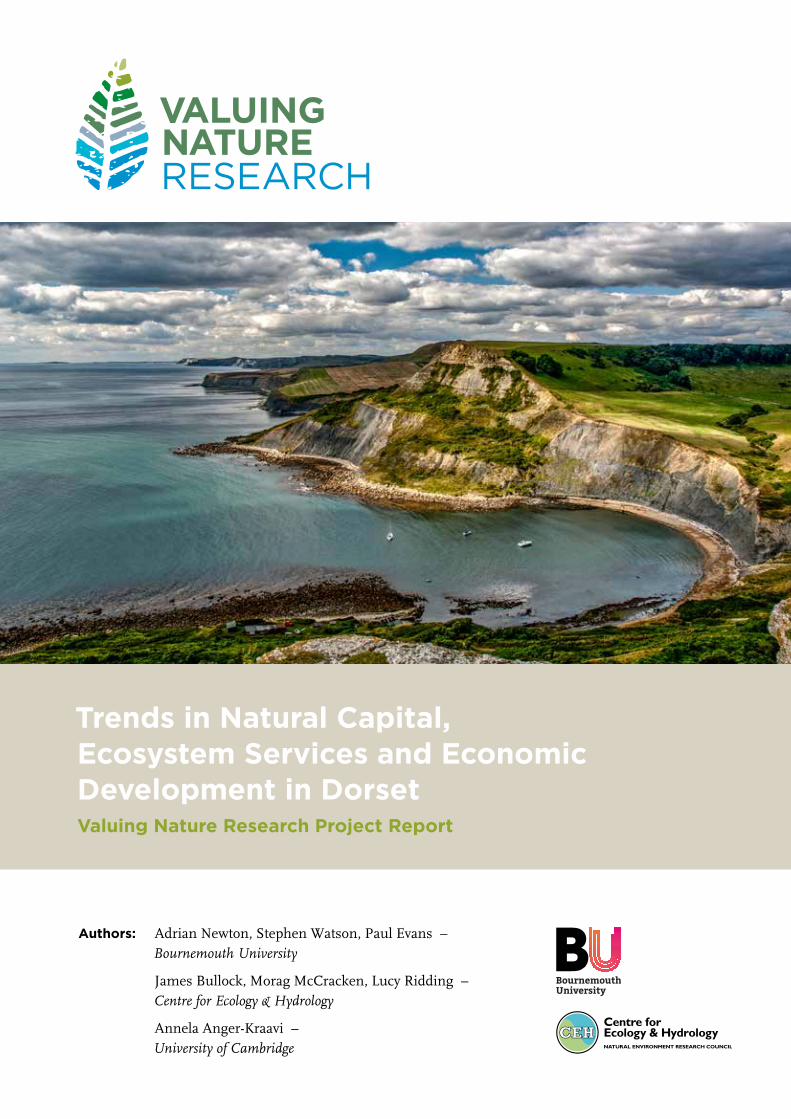
Cover image: Chapmans Pool © Roger Holman
Trends in Natural Capital, Ecosystem Services and Economic Development in Dorset Valuing Nature Research Project Report III
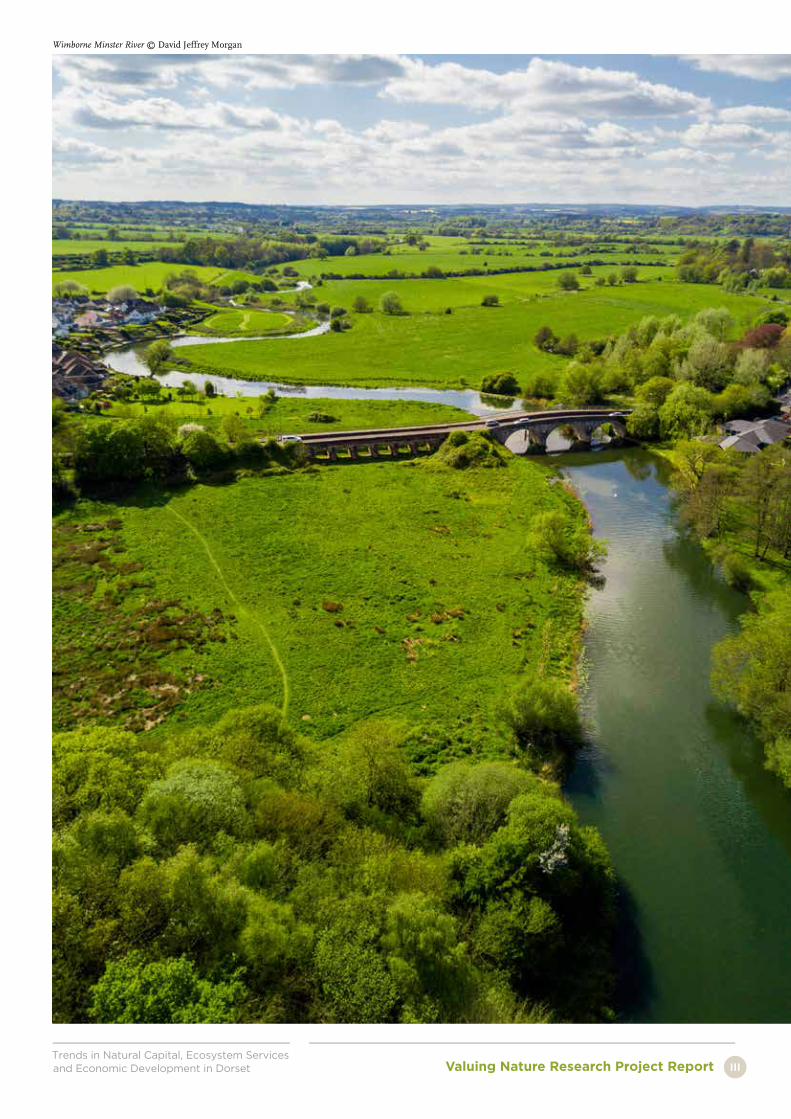
Wimborne Minster River © David Jeffrey Morgan
Trends in Natural Capital, Ecosystem Services and Economic Development in DorsetValuing Nature Research Project Report1
Summary
Specifically this research aimed to find out:
• How has the environment of Dorset changed in the recent past?
• How might it change in the near future?
• What are the implications of such change for human society, and
specifically for economic growth and employment?
Three main approaches were employed to address these questions:
(i) in the past, using analysis of historical and time-series data;
(ii) in the present, using assessments of gradients in the field; and
(iii) in the future, using scenario-building and modelling approaches.
How does environmental degradation affect economic development and employment? This report presents the results of research that addressed this question. The research was conducted by the project Tipping Points in Lowland Agricultural Landscapes (TPAL), which forms part of the Valuing Nature Programme. The research focused on the county of Dorset, situated on the south coast of England. Land use in Dorset is dominated by agriculture, yet the county is also of high value for wildlife, and has a burgeoning green economy. It therefore provides a valuable example of the potential synergies and conflicts between wildlife conservation, economic growth and development.
Trends in Natural Capital, Ecosystem Services and Economic Development in Dorset Valuing Nature Research Project Report 2
Dorset’s environment has been seriously
degraded over the past 80 years. Measures
of biodiversity value have undergone
a substantial decline in this period, as
illustrated by the 97% loss of neutral
grassland and 70% loss of calcareous
grassland. The condition of remaining
semi-natural habitats has been reduced
by nitrogen deposition and habitat
fragmentation; for example the mean area
of heathland patches has declined by 29%
since 1978. These trends are primarily
attributable to agricultural intensification
and changing farming practices.
Provision of most ecosystem services, or the
benefits provided by ecosytems to people, has
declined significantly since the 1930s. Some
services, such as soil quality and carbon storage,
have declined continuously over this interval,
with no sign of recovery. Others, such as
mitigation of flood risk, have increased in recent
years owing to changing land use, particularly
the transition from arable to livestock farming
that occurred over large areas after the 1950s.
The provision of ecosystem services is
important to local businesses. Overall, 47%
of the Dorset businesses surveyed stated
that they were at least somewhat dependent
on service flows. Economic sectors that
were highly dependent on ecosystem
services included tourism and travel,
manufacturing, education and agriculture.
The most important services to businesses
were provision of freshwater, waste and
water treatment, microclimate regulation,
water quality and carbon storage.
Economic analyses indicate that the further
expansion of agriculture would provide
limited benefits to the local economy. Even
if all remaining land in Dorset that is suitable
for agriculture were converted to farmland,
Gross Value-Added (GVA) would increase
by ≤ 0.3%. However, investment in natural
capital, aiming to improve the extent and
condition of semi-natural ecosystems,
could have a much greater impact on the
economy, with GVA increases of up to 5%
in the scenarios explored. Such investment
could deliver an £0.8 billion increase in GVA
and create more than 25,000 jobs.
Rural land use can significantly affect the
wider economy by influencing the provision
of ecosystem services to other business
sectors. This influence of farming on the
wider economy is ignored by conventional
approaches to economic forecasting, but
can substantially outweigh the value of the
agricultural sector itself.
We detected a number of ecological
thresholds in relation to the status of natural
capital assets. These suggest that future
environmental degradation could lead to
relatively abrupt changes in provision of
ecosystem services, which could have a
significant impact on the local economy and
employment. Investment in natural capital
could help mitigate these risks.
Recommendations are provided regarding
policy and management options for
strengthening natural capital in the region,
while supporting incomes to farmers.
Key results are summarized below:
Trends in Natural Capital, Ecosystem Services and Economic Development in DorsetValuing Nature Research Project Report3
Context
Although the importance of environmental change is widely appreciated,
its impacts on human society are less well understood. In particular,
there is uncertainty regarding how such changes might affect economic
development and employment. Is environmental change something
that we can readily live with, or adapt to? Or is it something that might
threaten our economy, jobs and wellbeing?
This report describes research undertaken to help answer these questions.
The project Tipping Points in Lowland Agricultural Landscapes (TPAL) formed
part of the Valuing Nature Programme (http://valuing-nature.net/),
a multi-disciplinary initiative designed to improve how the natural
environment is represented in valuation analyses and decision making.
The research focused on the county of Dorset, which is situated on the
south coast of England. Specifically we aimed to find out:
• How has the environment of Dorset changed in the recent past?
• How might it change in the near future?
• What are the implications of such change for human society, and
specifically for economic growth and employment?
We live in an era of unprecedented environmental change. Examples include rapid changes in global climate and land cover, increasing pollution and biodiversity loss, and widespread environmental degradation. These trends are creating major societal challenges owing to declining natural resources, and increasing risks to human health and wellbeing. These challenges are illustrated by the UN’s Sustainable Development Goals, more than half of which are explicitly linked to environmental degradation.
1 Ash Futures (2015). Dorset’s
Environmental Economy. Report for
Dorset County Council. Ash Futures,
Devon.
Trends in Natural Capital, Ecosystem Services and Economic Development in Dorset Valuing Nature Research Project Report 4
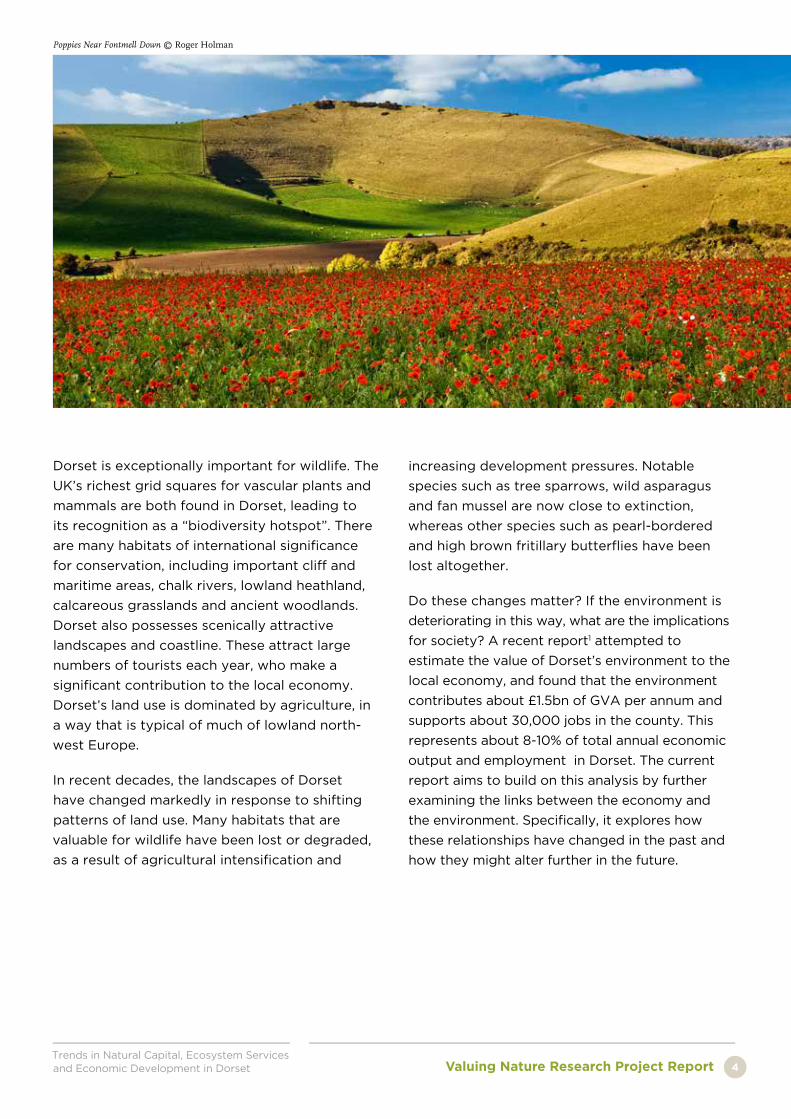
Dorset is exceptionally important for wildlife. The
UK’s richest grid squares for vascular plants and
mammals are both found in Dorset, leading to
its recognition as a “biodiversity hotspot”. There
are many habitats of international significance
for conservation, including important cliff and
maritime areas, chalk rivers, lowland heathland,
calcareous grasslands and ancient woodlands.
Dorset also possesses scenically attractive
landscapes and coastline. These attract large
numbers of tourists each year, who make a
significant contribution to the local economy.
Dorset’s land use is dominated by agriculture, in
a way that is typical of much of lowland north-
west Europe.
In recent decades, the landscapes of Dorset
have changed markedly in response to shifting
patterns of land use. Many habitats that are
valuable for wildlife have been lost or degraded,
as a result of agricultural intensification and
increasing development pressures. Notable
species such as tree sparrows, wild asparagus
and fan mussel are now close to extinction,
whereas other species such as pearl-bordered
and high brown fritillary butterflies have been
lost altogether.
Do these changes matter? If the environment is
deteriorating in this way, what are the implications
for society? A recent report1 attempted to
estimate the value of Dorset’s environment to the
local economy, and found that the environment
contributes about £1.5bn of GVA per annum and
supports about 30,000 jobs in the county. This
represents about 8-10% of total annual economic
output and employment in Dorset. The current
report aims to build on this analysis by further
examining the links between the economy and
the environment. Specifically, it explores how
these relationships have changed in the past and
how they might alter further in the future.
Poppies Near Fontmell Down © Roger Holman

Trends in Natural Capital, Ecosystem Services and Economic Development in DorsetValuing Nature Research Project Report5
Natural Capital, Ecosystem Services and Tipping Points
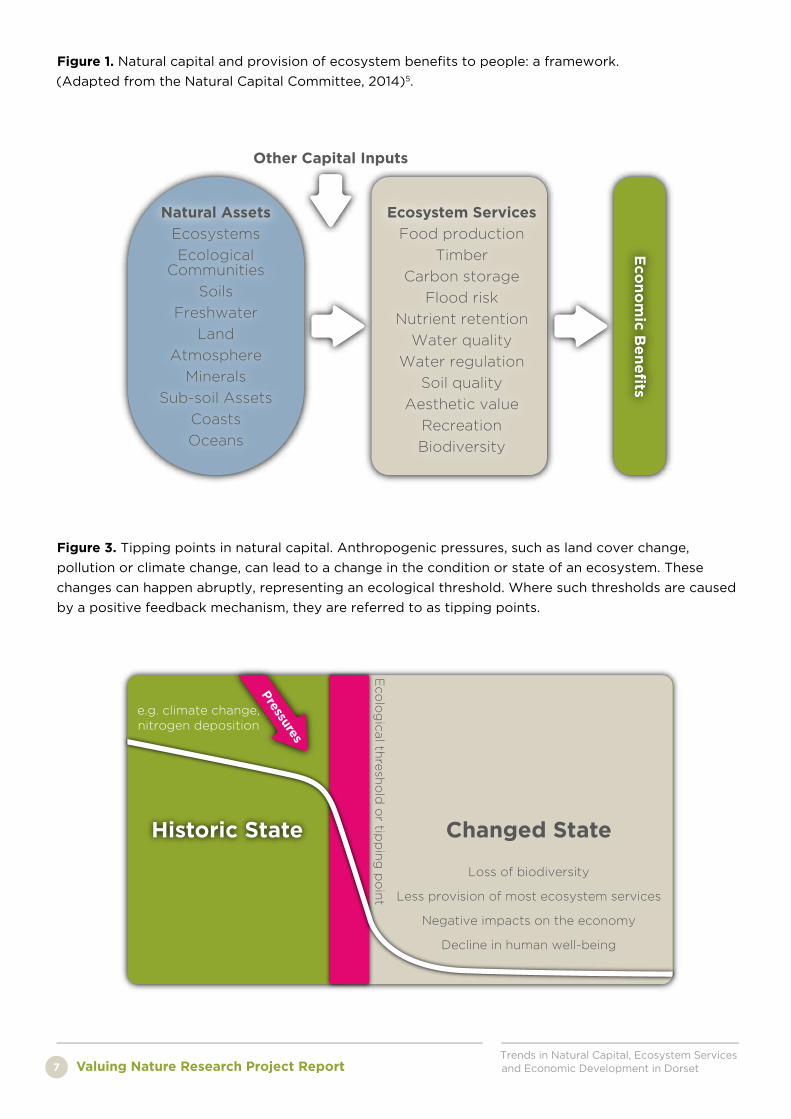
These natural assets represent natural capital stocks. Whereas stocks of
financial capital can provide flows of income or expenditure, stocks of
natural capital provide flows of benefits to people. These are referred
to as ecosystem services, and include many benefits on which human
lives depend, including clean air and water, food, materials and energy,
together with cultural and aesthetic benefits (Figure 1). Such ecosystem
services can be valued in monetary or non-monetary terms, but they are
generally omitted from traditional approaches to economic accounting
and planning.
The relationships between natural capital stocks and provision of
ecosystem services can change over time and place. In the context of
understanding the impacts of environmental change on human society,
the relationship between the condition of a natural asset and provision
of ecosystem benefits is of particular importance. Environmental
degradation may lead to a decline in natural asset status, which could
reduce the benefits provided to people3. Potentially, this relationship
could either be linear, or it could be non-linear (Figure 2). However,
the form of this relationship is not well understood. One of the main
objectives of the research described here was to determine the form of
this relationship, as it applies to natural capital assets in Dorset.
Recent efforts to understand the links between the environment and the economy have focused on the concept of natural capital. This can be viewed as one of the five types of capital asset that are needed to support the economy, along with social, human, manufactured and financial capital. Natural capital can be defined as the elements of nature that directly and indirectly produce value or benefits to people2. Natural capital assets include different components of the environment, including species, ecological communities and ecosystems, and the ecological processes that influence their structure and dynamics.
2 Natural Capital Committee (2014).
State of Natural Capital: Restoring
Our Natural Assets. 2nd report. NCC,
London
5 Natural Capital Committee (2014).
State of Natural Capital: Restoring
Our Natural Assets. 2nd report. NCC,
London
4 Groffman, P.M. et al. (2006).
Ecosystems 9, 1-13.
6 Mace, G.M. et al. (2015). J. Appl. Ecol. 52,
641-653.
3 Mace, G.M. et al. (2015). J. Appl. Ecol. 52,
641-653.
Trends in Natural Capital, Ecosystem Services and Economic Development in Dorset Valuing Nature Research Project Report 6
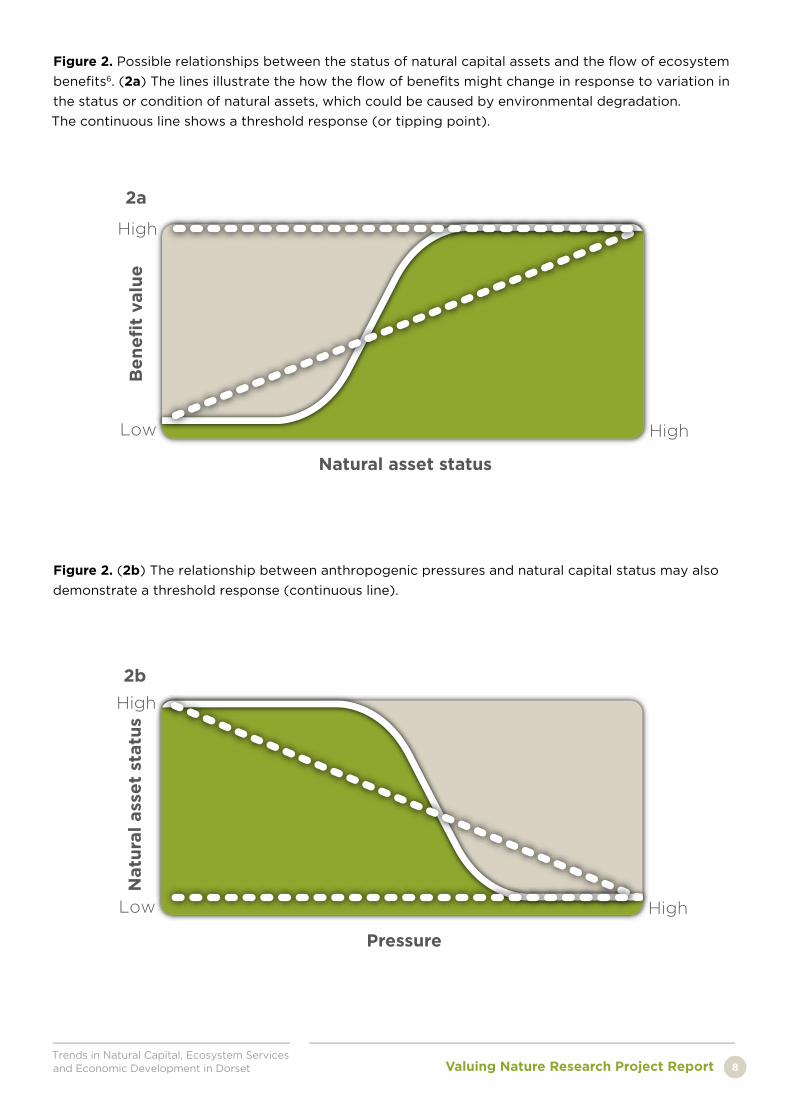
Why is the form of this relationship important?
If environmental change causes a decline in
the condition of natural capital assets, then this
might happen gradually. Alternatively, a small
change in natural asset status might lead to a
large decline in the flow of ecosystem benefits,
which might happen abruptly and unexpectedly.
This could occur if the relationship is non-linear,
for example if it is characterised by an ecological
threshold4.
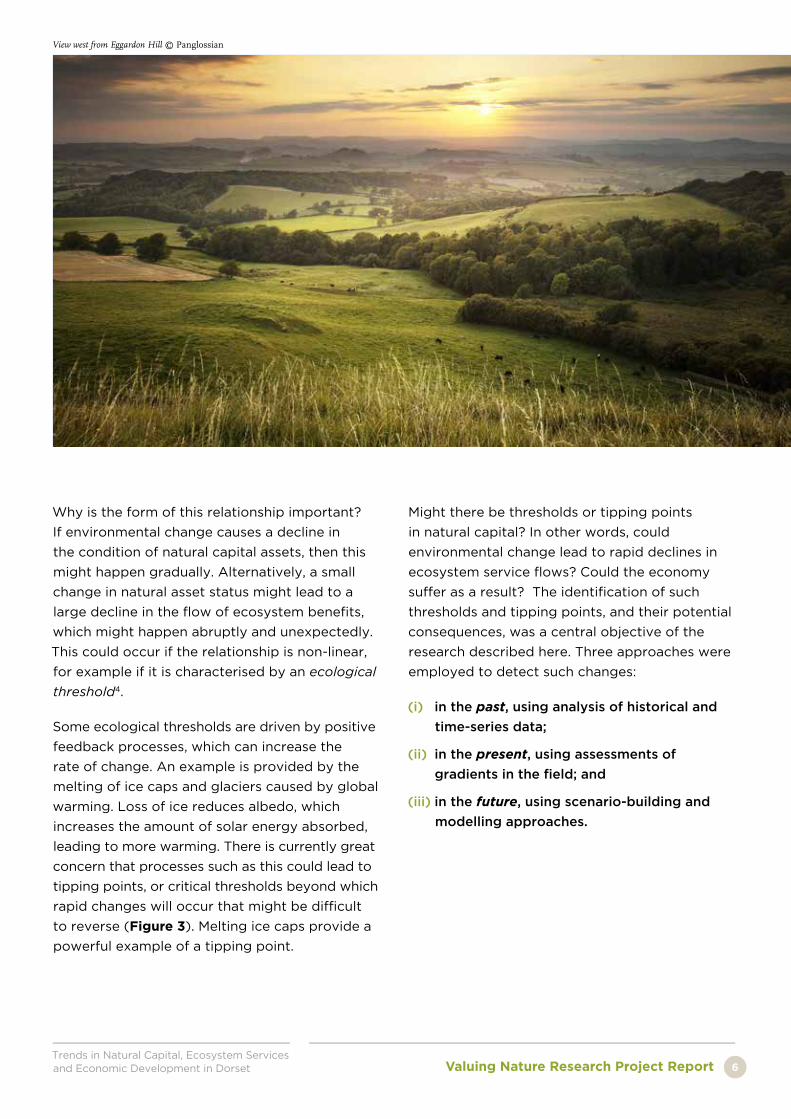
Some ecological thresholds are driven by positive
feedback processes, which can increase the
rate of change. An example is provided by the
melting of ice caps and glaciers caused by global
warming. Loss of ice reduces albedo, which
increases the amount of solar energy absorbed,
leading to more warming. There is currently great
concern that processes such as this could lead to
tipping points, or critical thresholds beyond which
rapid changes will occur that might be difficult
to reverse (Figure 3). Melting ice caps provide a
powerful example of a tipping point.
Might there be thresholds or tipping points
in natural capital? In other words, could
environmental change lead to rapid declines in
ecosystem service flows? Could the economy
suffer as a result? The identification of such
thresholds and tipping points, and their potential
consequences, was a central objective of the
research described here. Three approaches were
employed to detect such changes:
(i) in the past, using analysis of historical and
time-series data;
(ii) in the present, using assessments of
gradients in the field; and
(iii) in the future, using scenario-building and
modelling approaches.
View west from Eggardon Hill © Panglossian
Trends in Natural Capital, Ecosystem Services and Economic Development in DorsetValuing Nature Research Project Report7
Figure 3. Tipping points in natural capital. Anthropogenic pressures, such as land cover change,
pollution or climate change, can lead to a change in the condition or state of an ecosystem. These
changes can happen abruptly, representing an ecological threshold. Where such thresholds are caused
by a positive feedback mechanism, they are referred to as tipping points.
Natural Assets
Ecosystems
EcologicalCommunities
Soils
Freshwater
Land
Atmosphere
Minerals
Sub-soil Assets
Coasts
Oceans
Ecosystem Services
Food production
Timber
Carbon storage
Flood risk
Nutrient retention
Water quality
Water regulation
Soil quality
Aesthetic value
Recreation
Biodiversity
Other Capital InputsE
co
no
mic
Be
ne
fits
Historic State
Pressures
Changed State
Loss of biodiversity
Less provision of most ecosystem services
Negative impacts on the economy
Decline in human well-being
e.g. climate change,nitrogen deposition
Eco
log
ical th
resh
old
or tip
pin
g p
oin
t
Figure 1. Natural capital and provision of ecosystem benefits to people: a framework.
(Adapted from the Natural Capital Committee, 2014)5.
Trends in Natural Capital, Ecosystem Services and Economic Development in Dorset Valuing Nature Research Project Report 8
Natural asset status
Low High
High
Low High
High
Be
ne
fit
valu
e
2a
2b
Natu
ral
ass
et
statu
s
Pressure
Natural asset status
Low High
High
Low High
High
Be
ne
fit
valu
e
2a
2b
Natu
ral
ass
et
statu
s
Pressure
Figure 2. Possible relationships between the status of natural capital assets and the flow of ecosystem
benefits6. (2a) The lines illustrate the how the flow of benefits might change in response to variation in
the status or condition of natural assets, which could be caused by environmental degradation.
The continuous line shows a threshold response (or tipping point).
Figure 2. (2b) The relationship between anthropogenic pressures and natural capital status may also
demonstrate a threshold response (continuous line).
Trends in Natural Capital, Ecosystem Services and Economic Development in DorsetValuing Nature Research Project Report9
Environmental Change in Dorset
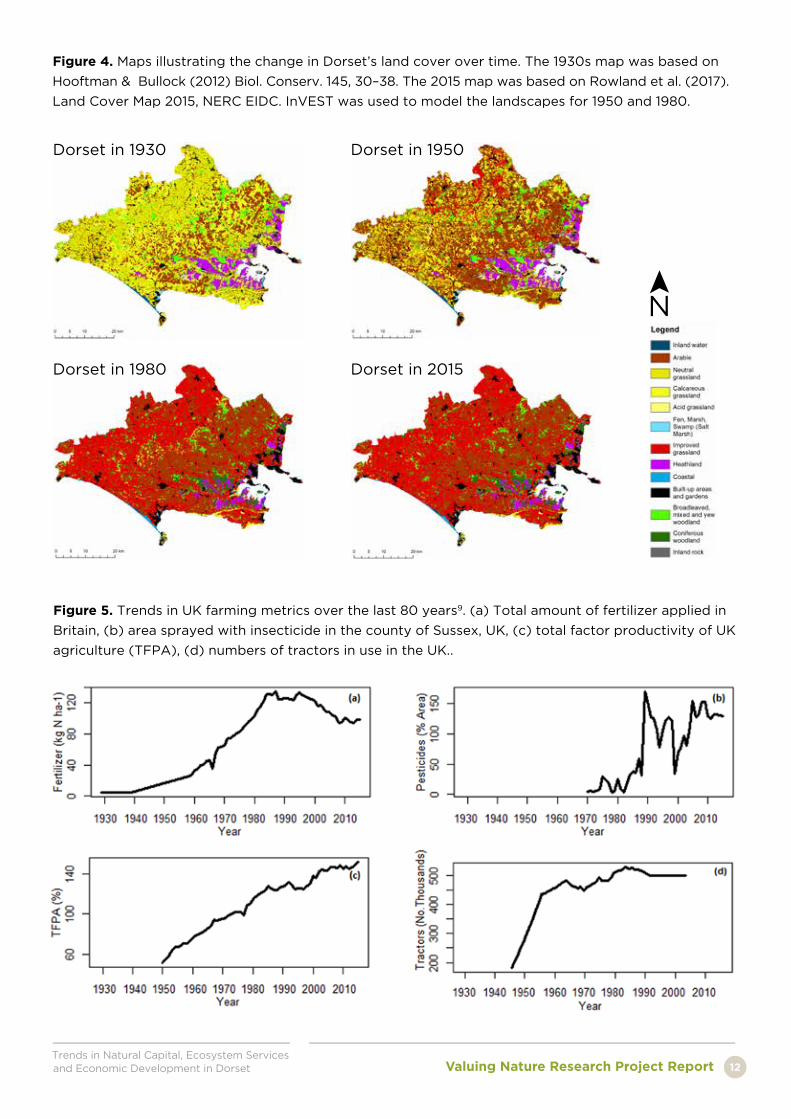
To answer this question, we created a series of land cover maps for
Dorset (Figure 4), which were based on available historical maps and
land use data, together with historical vegetation surveys and resurveys.
Results indicated that the total proportion of the land cover comprising
agricultural land remained roughly constant over the past 80 years.
However, there were significant changes in the extent and distribution
of different agricultural land use practices. Arable land, for example,
increased markedly in extent between 1930 and 1950, but declined
steadily thereafter. Conversely, improved grassland remained limited
in extent until 1950, but afterwards underwent a substantial increase,
reaching a maximum value at the present day. Other vegetation types that
increased in area over time included conifer plantations, ranging from a
value close to zero in 1930 to 3.4% of land area in 2015.
To illustrate the extent of these changes, by 2015:
• 31% of arable land present in 1930 had been converted to improved
grassland;
• 64% of neutral grassland had been converted to agriculturally
improved grassland;
• 43% of calcareous grassland had been converted to arable, and 47% to
improved grassland;
• 50% of acid grassland had been converted to improved grassland; and
• 22% of heathland and 17% of broadleaved woodland had been
converted to conifer plantations.
Today, around 75% of Dorset’s land area is farmed, of which about a third is arable farmland. In the UK as a whole, agriculture accounts for about 70% of land area, so Dorset can be considered as a fairly typical county in terms of patterns of land use. But how has this pattern changed over time?
Trends in Natural Capital, Ecosystem Services and Economic Development in Dorset Valuing Nature Research Project Report 10
Hambledon Hill © Roger Holman
Trends in Natural Capital, Ecosystem Services and Economic Development in DorsetValuing Nature Research Project Report11
Land cover change therefore represents the form of environmental
change that has affected the natural capital of Dorset most profoundly.
However, other types of change have also been influential. Our research
into changes in the composition of plant communities in Dorset over
the past 80 years7 has consistently revealed an influence of nutrient
enrichment. Even in vegetation that has not been converted to agricultural
use, there have been widespread changes in community composition,
with plant species favouring higher nutrient availability becoming more
abundant over time. Conversely, species favouring low-nutrient conditions
have become increasingly rare. This demonstrates how use of fertilizers
on farms has negatively affected ecosystems throughout Dorset.
In some plant communities, climate change has also had an impact,
with species tolerating higher temperatures becoming more abundant
over time. Other changes in Dorset include increasing urbanisation and
human population size, increasing pollution and waste, spread of invasive
species, and spread of novel diseases of plants and animals. While we
have not investigated these factors explicitly, they are all likely to have
affected natural capital over the past 80 years. For example, the spread of
myxomatosis in the 1950s devastated rabbit populations, and is likely to
have had a major impact on grassland habitats in particular.
What has driven these changes? Trends in agricultural land use are largely
attributable to the shifting provision of capital grants and subsidies,
reflecting changes in government policy. Since 1945, farming practices
have become increasingly intensive, leading to an almost fourfold increase
in yield. The productivity and efficiency of farming have increased steadily
since 1950, in a linear fashion (Figure 5). These increases were partly
accompanied by increased mechanisation of farming, as illustrated by
the number of tractors in use, which increased rapidly after 1945 to reach
a peak in the 1980s. Fertilizer use also increased steadily after 1940 to
reach a peak in the 1980s, after which it has declined somewhat. Pesticide
use was relatively low in the 1970s, but increased markedly after the late
1980s, and is currently near an all-time high. Over time, at the national
scale, farms have tended to increase in size and become more specialised;
chemical applications have increased massively; around 50% of
hedgerows have been removed; and farm labour has decreased by 77%8.
7 Keith, S.A. et al. (2011) Oikos 120(2),
302-331, Keith, S.A. et al. (2009) Proc.
Roy. Soc. 276, 3539-3544, Staley, J.T. et
al. (2013) Biol. Cons. 167, 97-105, Diaz,
A. et al. (2013) Biol. Cons.167, 325-333,
Newton, A.C. et al. (2012) J. Ecol. 100 (1),
196-209.
8 Robinson, R.A. and Sutherland, W.J.
(2002). J. Appl. Ecol., 39, 157-176.
9 Robinson, R.A. and Sutherland, W.J.
(2002). J. Appl. Ecol., 39, 157-176.
Trends in Natural Capital, Ecosystem Services and Economic Development in Dorset Valuing Nature Research Project Report 12
Figure 4. Maps illustrating the change in Dorset’s land cover over time. The 1930s map was based on
Hooftman & Bullock (2012) Biol. Conserv. 145, 30–38. The 2015 map was based on Rowland et al. (2017).
Land Cover Map 2015, NERC EIDC. InVEST was used to model the landscapes for 1950 and 1980.
N
Dorset in 1930
Dorset in 1980
Dorset in 1950
Dorset in 2015
Figure 5. Trends in UK farming metrics over the last 80 years9. (a) Total amount of fertilizer applied in
Britain, (b) area sprayed with insecticide in the county of Sussex, UK, (c) total factor productivity of UK
agriculture (TFPA), (d) numbers of tractors in use in the UK..
Trends in Natural Capital, Ecosystem Services and Economic Development in DorsetValuing Nature Research Project Report13
Trends in Natural Asset Status: Habitat Area
In relation to changes in area, we examined trends in habitats of relatively
high biodiversity value. To achieve this, we analysed field survey data in
conjunction with the time series of land cover maps. The field data were
based on a systematic survey of plant species undertaken in the 1930s
by Professor Ronald Good at 7575 sites across Dorset. These “Good sites”
were resurveyed in the 1980s by Anne Horsfall, and more recently by the
current authors and their colleagues.
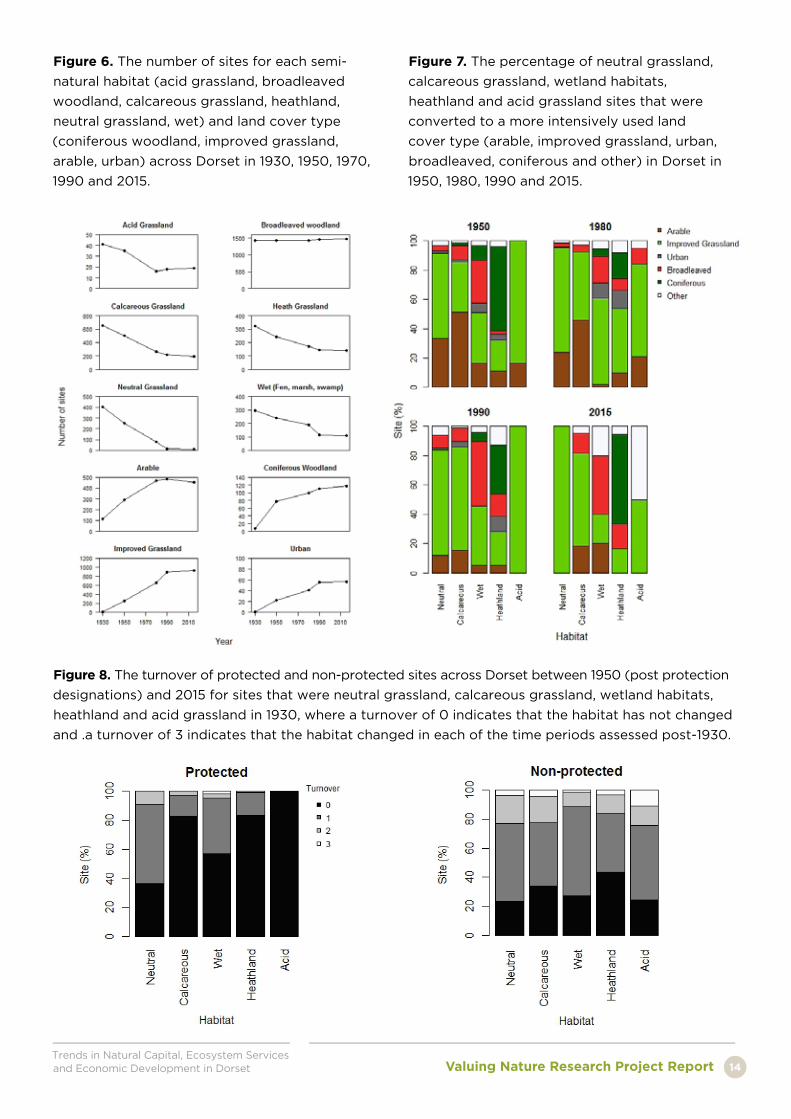
Over the last 80 years there has been a considerable loss of semi-natural
habitat in Dorset, including calcareous grassland, acid grassland, neutral
grassland, wet habitats (fen, marsh swamp), and heathland. Neutral
grassland and calcareous grassland have suffered the greatest losses, with
declines of 97% and 70% of their initial area, respectively (Figure 6, 7).
Substantial declines were also recorded in wetland, acid grassland and
heathland sites, with losses recorded of 63%, 54% and 57%, respectively.
The highest rate of loss of these habitats occurred between the 1950s and
1980s (20% loss), followed by the 1930s to 1950s (14%). Only 1% of semi-
natural habitat sites were lost between 1990 and 2015.
Preliminary results from our research show that sites that were protected
through designation as a Sites of Special Scientific Interest (SSSI) were
more likely to remain as their original habitat, compared to those sites
that were not protected (Figure 8). These results show that statutory
protection has been beneficial in preventing habitat loss, which
provides important evidence to policy makers and land managers when
undertaking conservation decisions in the future.
There are three different aspects of natural capital assets that could potentially vary as a result of environmental change10: (i) the quantity or area of the asset; (ii) the quality or condition of the asset; and (iii) the spatial configuration or location and spatial distribution pattern of the asset. Our research examined how each of these three dimensions has changed over time, and how such changes affected flows of ecosystem services to people.
10 Mace, G.M. et al. (2015). J. Appl. Ecol. 52,
641-653.
Trends in Natural Capital, Ecosystem Services and Economic Development in Dorset Valuing Nature Research Project Report 14
Figure 6. The number of sites for each semi-
natural habitat (acid grassland, broadleaved
woodland, calcareous grassland, heathland,
neutral grassland, wet) and land cover type
(coniferous woodland, improved grassland,
arable, urban) across Dorset in 1930, 1950, 1970,
1990 and 2015.
Figure 7. The percentage of neutral grassland,
calcareous grassland, wetland habitats,
heathland and acid grassland sites that were
converted to a more intensively used land
cover type (arable, improved grassland, urban,
broadleaved, coniferous and other) in Dorset in
1950, 1980, 1990 and 2015.
Figure 8. The turnover of protected and non-protected sites across Dorset between 1950 (post protection
designations) and 2015 for sites that were neutral grassland, calcareous grassland, wetland habitats,
heathland and acid grassland in 1930, where a turnover of 0 indicates that the habitat has not changed
and .a turnover of 3 indicates that the habitat changed in each of the time periods assessed post-1930.
Trends in Natural Capital, Ecosystem Services and Economic Development in DorsetValuing Nature Research Project Report15
Trends in Natural Asset Status: Condition and Fragmentation
The relationships between environmental change, ecosystem condition,
ecosystem function and benefit flow are not well understood. Here we
examined changes in condition by examining two key drivers that have
affected ecosystems in Dorset: nitrogen deposition and climate change.
To achieve this, we compiled time-series data and associated models.
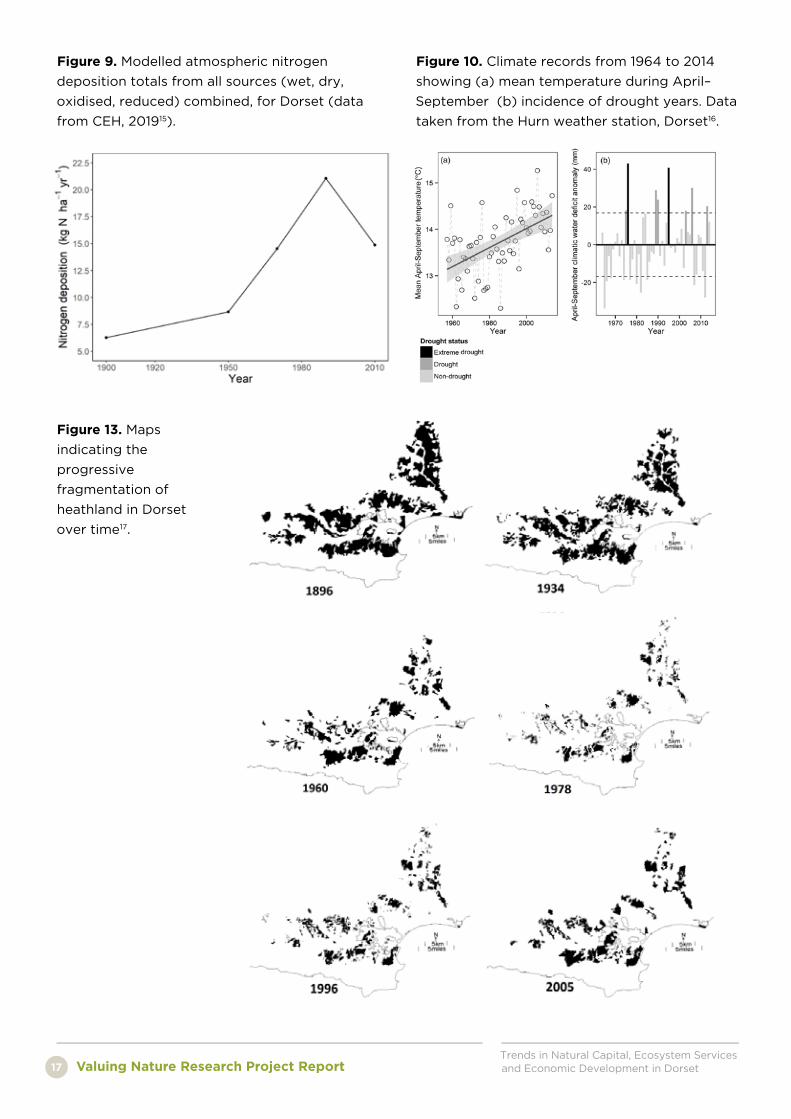
Nitrogen deposition can have major impacts on the structure and
composition of ecosystems; for example, under high nitrogen availability
heathlands can be transformed into grasslands. Ecosystem function can
also be adversely affected by nitrogen deposition. Results indicated that
nitrogen deposition increased steadily since the 1930s, to reach a peak in
the 1980s (Figure 9). Values of total nitrogen deposition include emissions
of oxidised nitrogen from fossil fuel combustion and reduced nitrogen
from agricultural sources. Recent trends of declining nitrogen deposition
partly reflect declining fertilizer use but are largely attributable to reduced
emissions from vehicles and heating sources.
Dorset has also experienced significant climate change over the past 80
years. Mean summer temperatures have increased by about 0.02 oC per
year (Figure 10). Although total mean annual rainfall has not increased
significantly, there have been changes in the pattern of rainfall distribution,
with a trend towards wetter winters and drier summers. There has also
been an increase in the incidence of drought. While the full impacts of
both climate change and nitrogen deposition on the condition of Dorset
ecosystems are unknown, there is clear evidence of significant changes in
species composition, as revealed by resurveys of vegetation data .
Spatial configuration provides a further measure of natural capital status.
Many species are dependent on maintenance of functional links between
different patches of habitat, in order to maintain viable populations. Many
In addition to area, our research examined two additional measures of natural asset status: condition and spatial configuration. In this context, condition refers to the functional capacity of a particular ecosystem. Environmental change can affect a variety of ecological processes influencing ecosystem function, including cycling of energy, water, nutrients and other materials. A decline in ecosystem function can reduce the capacity of ecosystems to provide benefits to people.
11 Keith, S.A. et al. (2011) Oikos 120(2), 302-
331, Keith, S.A. et al. (2009) Proc. Roy. Soc.
276, 3539-3544, Staley, J.T. et al. (2013)
Biol. Cons. 167, 97-105, Diaz, A. et al. (2013)
Biol. Cons.167, 325-333, Newton, A.C. et al.
(2012) J. Ecol. 100 (1), 196-209.
12 McGarigal, K. et al. (2012) FRAGSTATS
4. https://www.umass.edu/landeco/
research/fragstats/fragstats.html
13 From Cordingley J.E. et al. (2015). PLOS
One 10(6), e0130004.
14 From Cordingley J.E. et al. (2015). PLOS
One 10(6), e0130004.
15 Tipping, E. et al. (2017). Sci. Rep. 7, 1–11.
16 Martin, P.A. et al. (2015). Forest Ecology
and Management 358, 130-138.
17 Cordingley, J.E. et al. (2015) Journal of
Applied Ecology 53(1), 96-105.
Trends in Natural Capital, Ecosystem Services and Economic Development in Dorset Valuing Nature Research Project Report 16
ecological processes, including the dispersal of
organisms and flows of energy and materials,
are influenced by the spatial configuration of
habitats. The size, density and connectivity of
habitat patches are of particular importance
in this context. Land cover change can result
in increased habitat fragmentation, leading to
declining patch size and connectivity. Globally,
this has been identified as a major cause of
biodiversity loss.
Using the time series of land cover maps of
Dorset, we analysed how different habitats have
become increasingly fragmented over time. This
was achieved using FRAGSTATS, a software
program designed to calculate a wide range
of landscape pattern metrics . Results showed
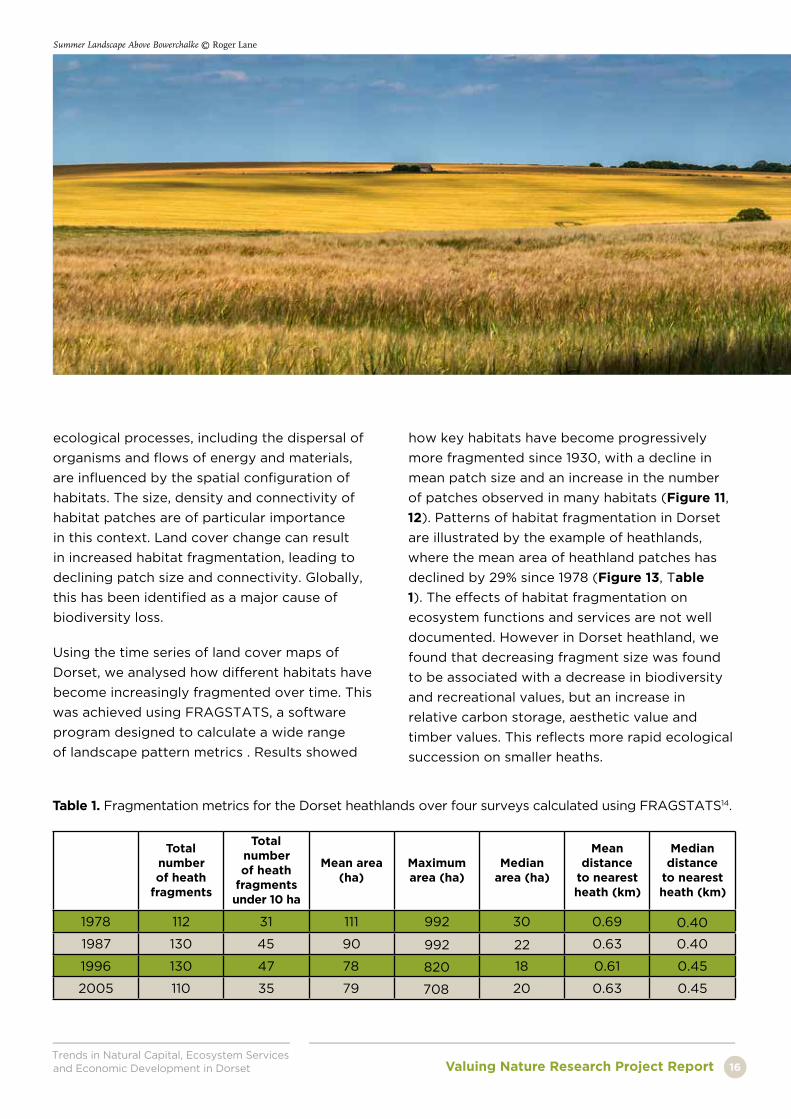
Table 1. Fragmentation metrics for the Dorset heathlands over four surveys calculated using FRAGSTATS14.
Total
number of heath
fragments
Total number of heath
fragments under 10 ha
Mean area (ha)
Maximum area (ha)
Median area (ha)
Mean distance
to nearest heath (km)
Median distance
to nearest heath (km)
1978 112 31 111 992 30 0.69 0.40 1987 130 45 90 992 22 0.63 0.40
1996 130 47 78 820 18 0.61 0.45
2005 110 35 79 708 20 0.63 0.45
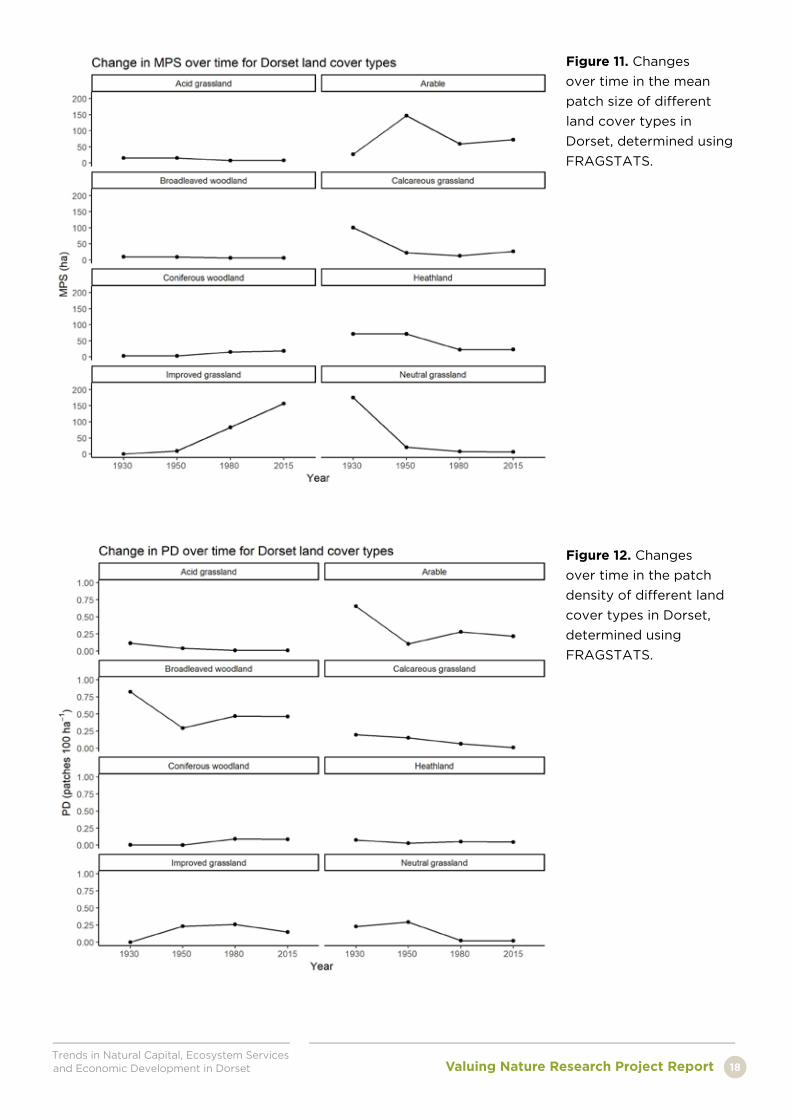
how key habitats have become progressively
more fragmented since 1930, with a decline in
mean patch size and an increase in the number
of patches observed in many habitats (Figure 11,
12). Patterns of habitat fragmentation in Dorset
are illustrated by the example of heathlands,
where the mean area of heathland patches has
declined by 29% since 1978 (Figure 13, Table
1). The effects of habitat fragmentation on
ecosystem functions and services are not well
documented. However in Dorset heathland, we
found that decreasing fragment size was found
to be associated with a decrease in biodiversity
and recreational values, but an increase in
relative carbon storage, aesthetic value and
timber values. This reflects more rapid ecological
succession on smaller heaths.
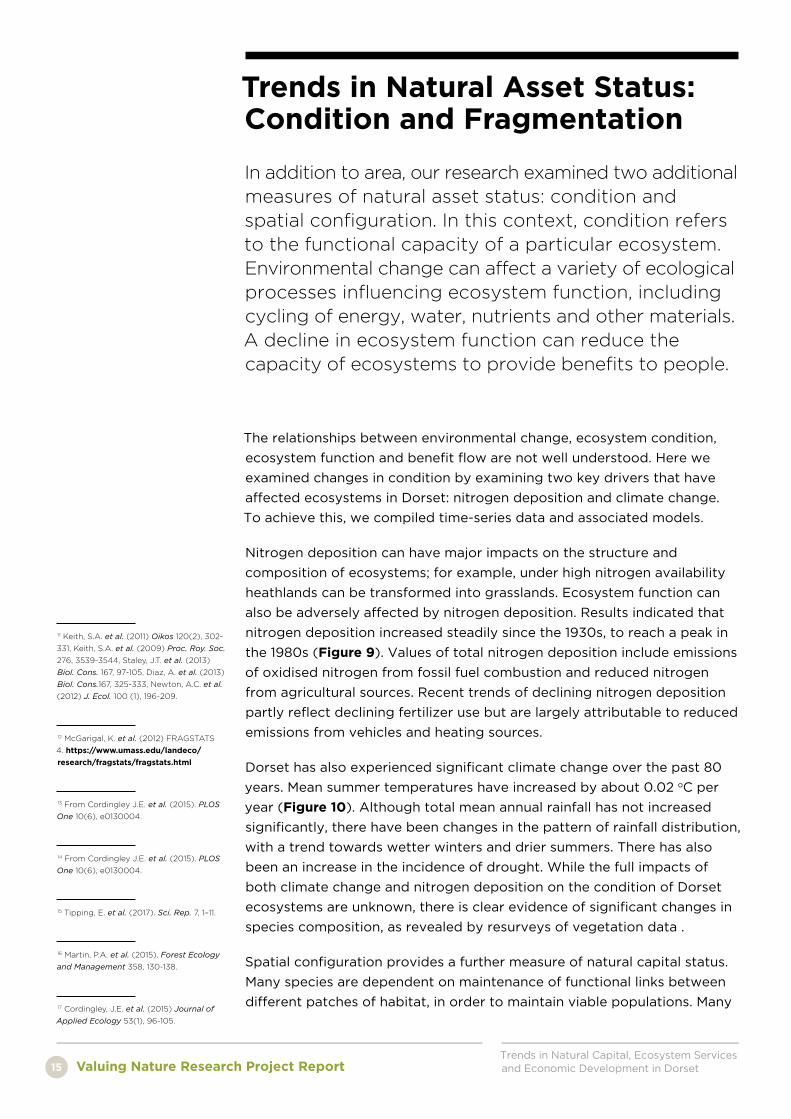
Summer Landscape Above Bowerchalke © Roger Lane
Trends in Natural Capital, Ecosystem Services and Economic Development in DorsetValuing Nature Research Project Report17
Figure 13. Maps
indicating the
progressive
fragmentation of
heathland in Dorset
over time17.
Figure 9. Modelled atmospheric nitrogen
deposition totals from all sources (wet, dry,
oxidised, reduced) combined, for Dorset (data
from CEH, 201915).
Figure 10. Climate records from 1964 to 2014
showing (a) mean temperature during April–
September (b) incidence of drought years. Data
taken from the Hurn weather station, Dorset16.
Trends in Natural Capital, Ecosystem Services and Economic Development in Dorset Valuing Nature Research Project Report 18
Figure 11. Changes
over time in the mean
patch size of different
land cover types in
Dorset, determined using
FRAGSTATS.
Figure 12. Changes
over time in the patch
density of different land
cover types in Dorset,
determined using
FRAGSTATS.
Trends in Natural Capital, Ecosystem Services and Economic Development in DorsetValuing Nature Research Project Report19
Ecosystem Condition and Service Flows
Three habitats were selected on the basis of their high ecological value:
calcareous grassland, heathland and broadleaved woodland. Only sites
that had been identified as these respective habitats by field surveys
conducted in the 1930s were selected. Thirteen sites were chosen for each
habitat type to provide gradients of decreasing ecosystem condition,
representing the common patterns of ecosystem degradation in Dorset.
The gradients were as follows:
Calcareous grasslands (SSSI quality) \ restoring calcareous grassland \
improved grassland
Heathland (SSSI quality) \ gorse-covered heathland \
coniferous plantation
Ancient woodland (SSSI quality) \ broadleaved woodland \
coniferous plantation
Measurements were made within 50 x 50 m sample plots located
randomly within each site. Analysis of floristic composition enabled each
site to be classified according to the National Vegetation Classification
(NVC). Ecosystem condition was assessed as the degree of similarity in
vegetation composition to that of relatively undisturbed sites, using the
NVC classification as a reference.
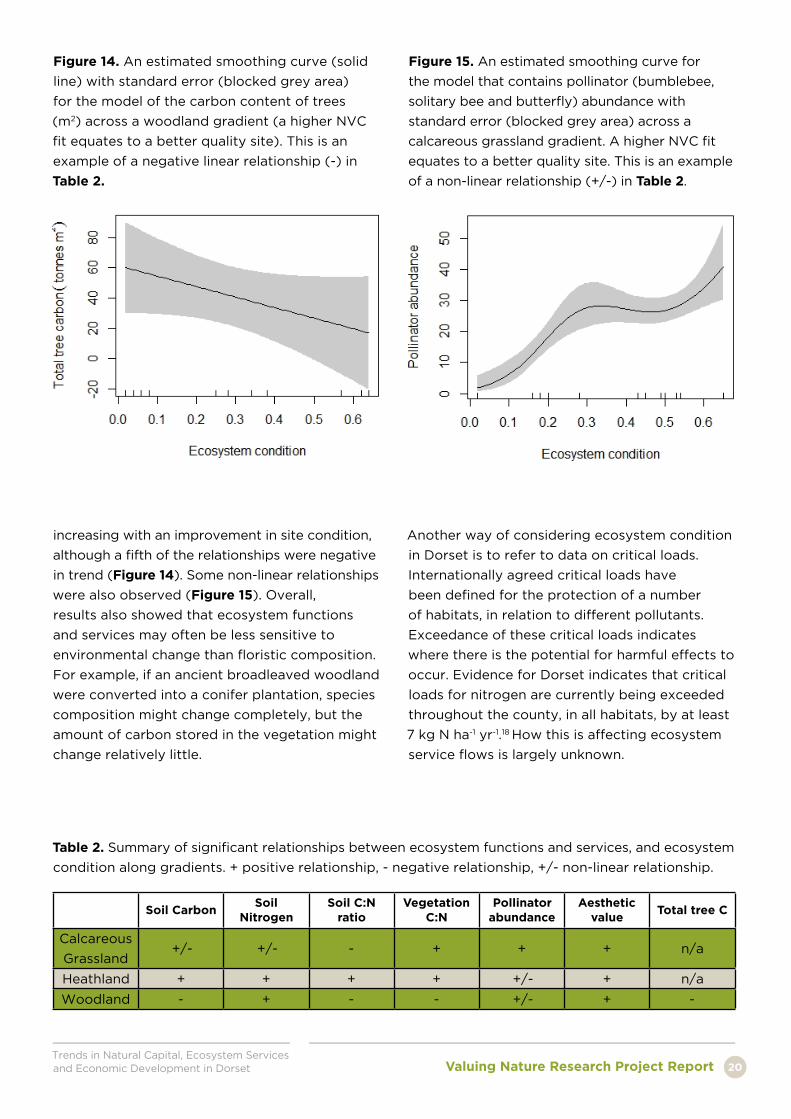
The majority of ecosystem functions and services displayed linear
relationships with ecosystem condition, along the gradients (Table 2).
Over half of the variables assessed displayed a positive relationship,
Many human activities can potentially reduce the condition of ecosystems, including pollution, harvesting of plants or animals, and use of livestock or fire. However, the relationships between ecosystem condition and the provision of ecosystem benefits to people are not well understood. Here we examined these relationships by conducting a field survey in Dorset along gradients of ecosystem condition. A range of different variables were measured to provide insights into variation in ecosystem functions and services, including soil carbon and nitrogen content, pollinator abundance, and both aesthetic and recreational value.
18 http://www.cldm.ceh.ac.uk/
exceedances/maps
Trends in Natural Capital, Ecosystem Services and Economic Development in Dorset Valuing Nature Research Project Report 20
Table 2. Summary of significant relationships between ecosystem functions and services, and ecosystem
condition along gradients. + positive relationship, - negative relationship, +/- non-linear relationship.
Soil CarbonSoil
NitrogenSoil C:N
ratioVegetation
C:NPollinator
abundanceAesthetic
valueTotal tree C
Calcareous
Grassland+/- +/- - + + + n/a
Heathland + + + + +/- + n/a
Woodland - + - - +/- + -
increasing with an improvement in site condition,
although a fifth of the relationships were negative
in trend (Figure 14). Some non-linear relationships
were also observed (Figure 15). Overall,
results also showed that ecosystem functions
and services may often be less sensitive to
environmental change than floristic composition.
For example, if an ancient broadleaved woodland
were converted into a conifer plantation, species
composition might change completely, but the
amount of carbon stored in the vegetation might
change relatively little.
Figure 14. An estimated smoothing curve (solid
line) with standard error (blocked grey area)
for the model of the carbon content of trees
(m2) across a woodland gradient (a higher NVC
fit equates to a better quality site). This is an
example of a negative linear relationship (-) in
Table 2.
Figure 15. An estimated smoothing curve for
the model that contains pollinator (bumblebee,
solitary bee and butterfly) abundance with
standard error (blocked grey area) across a
calcareous grassland gradient. A higher NVC fit
equates to a better quality site. This is an example
of a non-linear relationship (+/-) in Table 2.
Another way of considering ecosystem condition
in Dorset is to refer to data on critical loads.
Internationally agreed critical loads have
been defined for the protection of a number
of habitats, in relation to different pollutants.
Exceedance of these critical loads indicates
where there is the potential for harmful effects to
occur. Evidence for Dorset indicates that critical
loads for nitrogen are currently being exceeded
throughout the county, in all habitats, by at least
7 kg N ha-1 yr-1.18 How this is affecting ecosystem
service flows is largely unknown.
Trends in Natural Capital, Ecosystem Services and Economic Development in DorsetValuing Nature Research Project Report21
Trends in Ecosystem Services
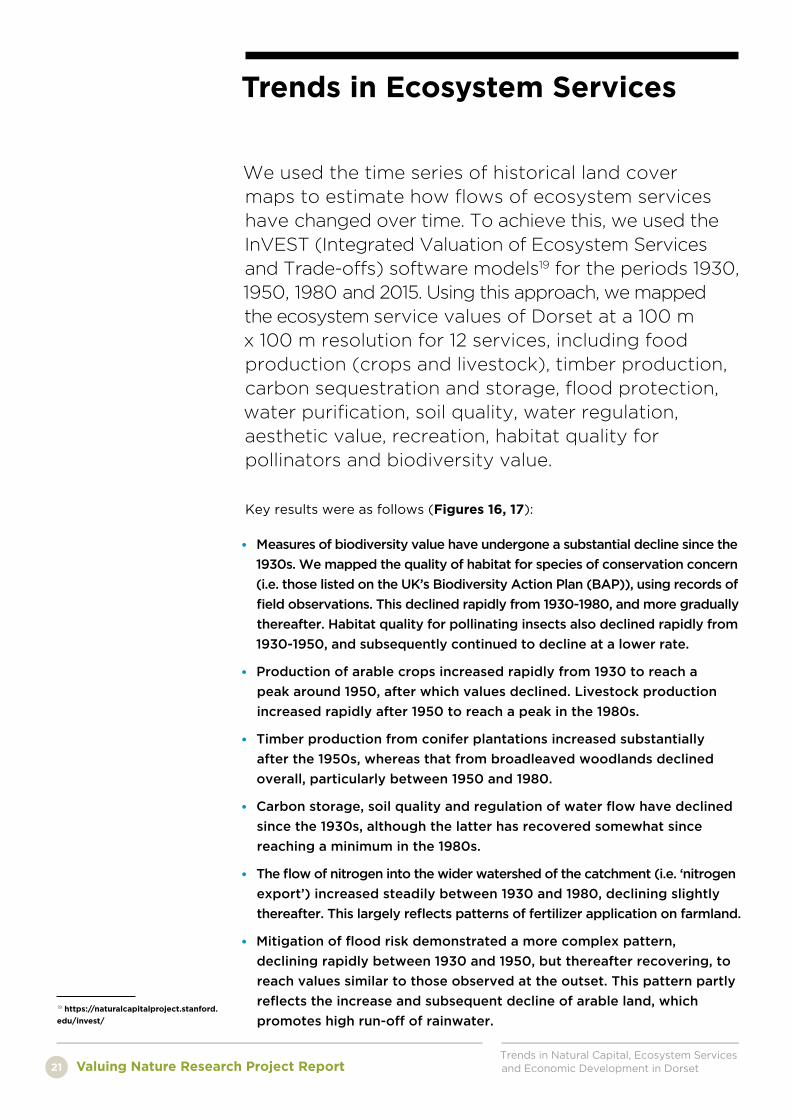
Key results were as follows (Figures 16, 17):
• Measures of biodiversity value have undergone a substantial decline since the
1930s. We mapped the quality of habitat for species of conservation concern
(i.e. those listed on the UK’s Biodiversity Action Plan (BAP)), using records of
field observations. This declined rapidly from 1930-1980, and more gradually
thereafter. Habitat quality for pollinating insects also declined rapidly from
1930-1950, and subsequently continued to decline at a lower rate.
• Production of arable crops increased rapidly from 1930 to reach a
peak around 1950, after which values declined. Livestock production
increased rapidly after 1950 to reach a peak in the 1980s.
• Timber production from conifer plantations increased substantially
after the 1950s, whereas that from broadleaved woodlands declined
overall, particularly between 1950 and 1980.
• Carbon storage, soil quality and regulation of water flow have declined
since the 1930s, although the latter has recovered somewhat since
reaching a minimum in the 1980s.
• The flow of nitrogen into the wider watershed of the catchment (i.e. ‘nitrogen
export’) increased steadily between 1930 and 1980, declining slightly
thereafter. This largely reflects patterns of fertilizer application on farmland.
• Mitigation of flood risk demonstrated a more complex pattern,
declining rapidly between 1930 and 1950, but thereafter recovering, to
reach values similar to those observed at the outset. This pattern partly
reflects the increase and subsequent decline of arable land, which
promotes high run-off of rainwater.
We used the time series of historical land cover maps to estimate how flows of ecosystem services have changed over time. To achieve this, we used the InVEST (Integrated Valuation of Ecosystem Services and Trade-offs) software models19 for the periods 1930, 1950, 1980 and 2015. Using this approach, we mapped the ecosystem service values of Dorset at a 100 m x 100 m resolution for 12 services, including food production (crops and livestock), timber production, carbon sequestration and storage, flood protection, water purification, soil quality, water regulation, aesthetic value, recreation, habitat quality for pollinators and biodiversity value.
19 https://naturalcapitalproject.stanford.
edu/invest/
Trends in Natural Capital, Ecosystem Services and Economic Development in Dorset Valuing Nature Research Project Report 22
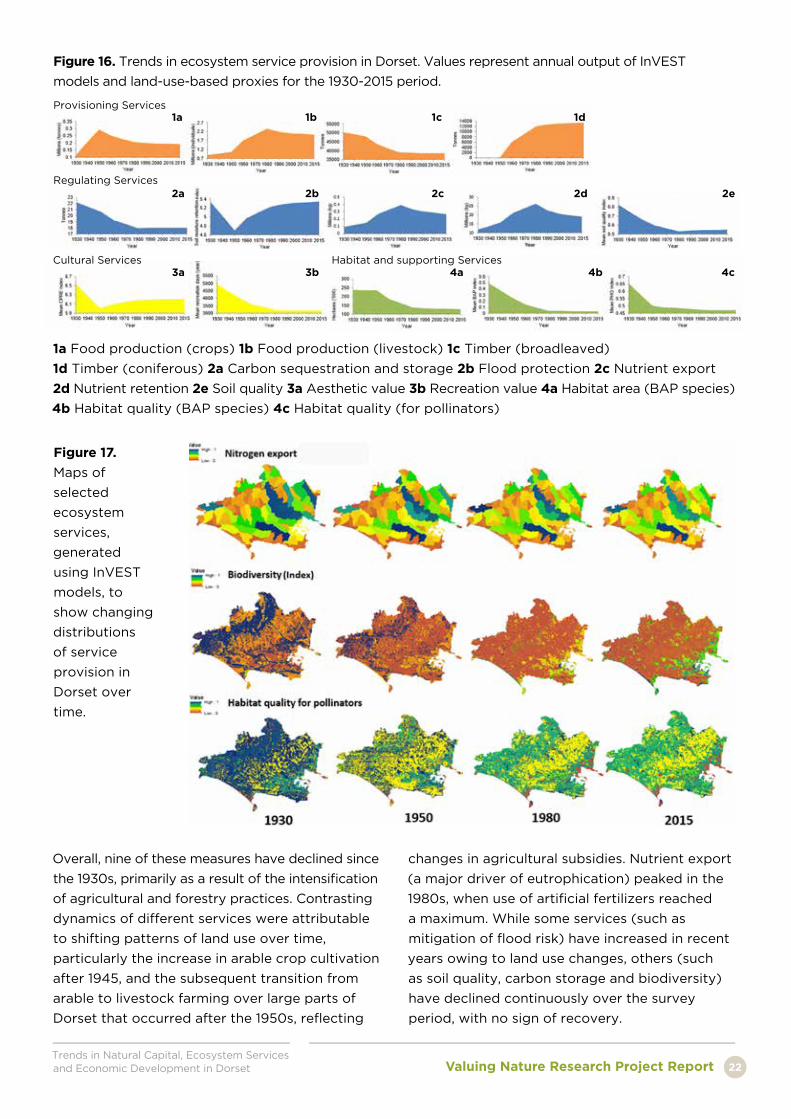
Figure 16. Trends in ecosystem service provision in Dorset. Values represent annual output of InVEST
models and land-use-based proxies for the 1930-2015 period.
Overall, nine of these measures have declined since
the 1930s, primarily as a result of the intensification
of agricultural and forestry practices. Contrasting
dynamics of different services were attributable
to shifting patterns of land use over time,
particularly the increase in arable crop cultivation
after 1945, and the subsequent transition from
arable to livestock farming over large parts of
Dorset that occurred after the 1950s, reflecting
changes in agricultural subsidies. Nutrient export
(a major driver of eutrophication) peaked in the
1980s, when use of artificial fertilizers reached
a maximum. While some services (such as
mitigation of flood risk) have increased in recent
years owing to land use changes, others (such
as soil quality, carbon storage and biodiversity)
have declined continuously over the survey
period, with no sign of recovery.
Figure 17.
Maps of
selected
ecosystem
services,
generated
using InVEST
models, to
show changing
distributions
of service
provision in
Dorset over
time.
1a Food production (crops) 1b Food production (livestock) 1c Timber (broadleaved)
1d Timber (coniferous) 2a Carbon sequestration and storage 2b Flood protection 2c Nutrient export
2d Nutrient retention 2e Soil quality 3a Aesthetic value 3b Recreation value 4a Habitat area (BAP species)
4b Habitat quality (BAP species) 4c Habitat quality (for pollinators)
Cultural Services Habitat and supporting Services
Regulating Services
Provisioning Services1a
2a
3a
1b
2b
3b
1c
2c
4a
1d
2d
4b
2e
4c
Trends in Natural Capital, Ecosystem Services and Economic Development in DorsetValuing Nature Research Project Report23
Economic Trends and Environmental Linkages
Analysis of official statistics shows that Dorset’s economy has grown
continuously over the past 50 years, indicated by a seven-fold increase
in GVA (Figure 18). Employment has also risen, although at a much
lower rate (Figure 19). These data illustrate how Dorset’s economy has
developed, even though the environment has deteriorated over the
same period, as documented earlier in this report. This raises a pertinent
question: do these opposing trends indicate that economic growth has
been fuelled by environmental degradation? Or are the environment and
economy simply disconnected?
We examined the links between the environment and economic activity by
conducting a questionnaire survey of 200 Dorset businesses, drawn from
a range of different sectors. We asked them how dependent their business
activities were on the provision of different ecosystem services. Overall,
47% of businesses stated that they were at least somewhat dependent on
flows of ecosystem services (Table 3). Results also showed that:
Dorset has around 30,000 businesses, about 90% of which are relatively small (i.e. fewer than 10 employees). The most important sectors in terms of their contribution to the overall economy are currently the retail trade, construction, financial and insurance, health, and public administration and defence. In terms of employment, the most important sectors are the retail trade, education, health and construction. Currently, agriculture and forestry account for just over 1% of Dorset’s economy, and less than 1% of employment. Employment in agriculture has declined by more than half since 1981.
20 Watson, S.C.L. and Newton, A.C. (2018).
Sustainability 10(5), 1368 https://doi.
org/10.3390/su10051368.
21 ONS Office for National Statistics (2015).
22 ONS Office for National Statistics (2015).
23 Watson, S.C.L. and Newton, A.C. (2018).
Sustainability 10(5), 1368
Trends in Natural Capital, Ecosystem Services and Economic Development in Dorset Valuing Nature Research Project Report 24
• Sectors that were highly dependent on
ecosystem service flows included tourism and
travel, manufacturing (food and beverages),
education and agriculture (Table 3)
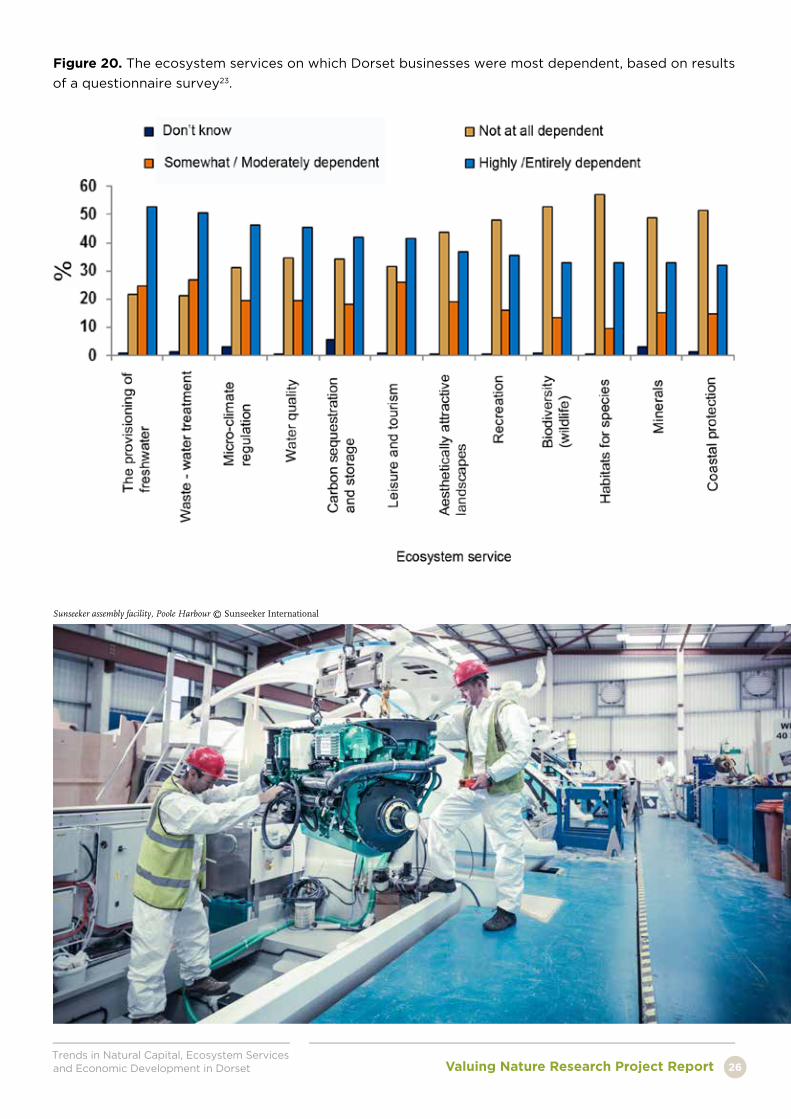
• The most important services to businesses
were provision of freshwater, waste and
water treatment, microclimate regulation,
water quality and carbon storage (Figure 20).
• More than 50% of businesses reported that
the quality of the natural environment was
one of the main reasons for conducting
business in Dorset.
• Many businesses placed high importance on
locally produced materials and utilities, with
>50% of businesses surveyed suggesting
locally produced fuel, energy, water (for human
consumption and industrial use) and building
materials (including timber) were an important
factor for locating their businesses in Dorset.
• Many businesses indicated little or no
dependence on services such as pollination
and soil condition, which may reflect a lack
of awareness of dependencies occurring
upstream of their value chains.
Our research also showed that Dorset’s economy
is geographically structured. Most businesses are
located in urban areas, which are concentrated
in the south-east corner of the county. Yet most
ecosystem services are produced in rural parts
of the county. This shows that although the
direct contribution of agriculture to the economy
is low, its indirect impact on the economy is
much higher. Many of Dorset’s businesses are
at least partly dependent on ecosystem service
flows from rural areas, which are profoundly
affected by the prevailing patterns of land
use. How the land is used therefore has a
major impact on economic development and
employment, beyond the immediate contribution
of agriculture as an economic sector.
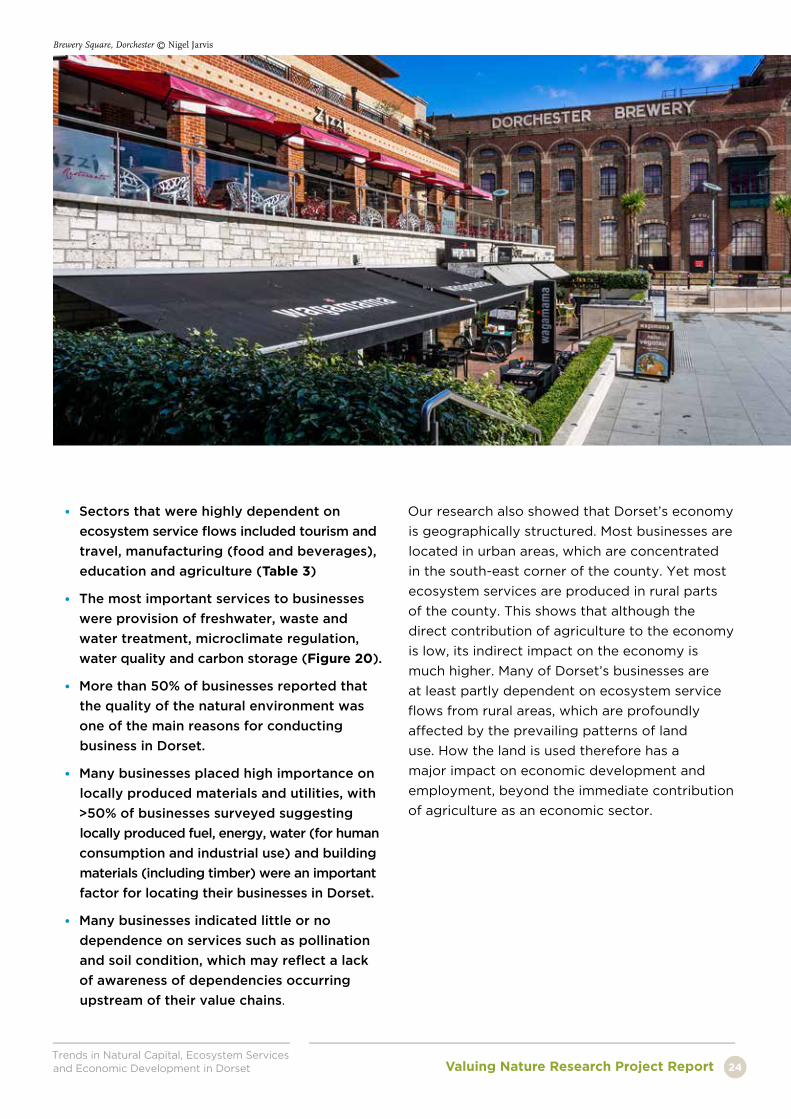
Brewery Square, Dorchester © Nigel Jarvis
Trends in Natural Capital, Ecosystem Services and Economic Development in DorsetValuing Nature Research Project Report25
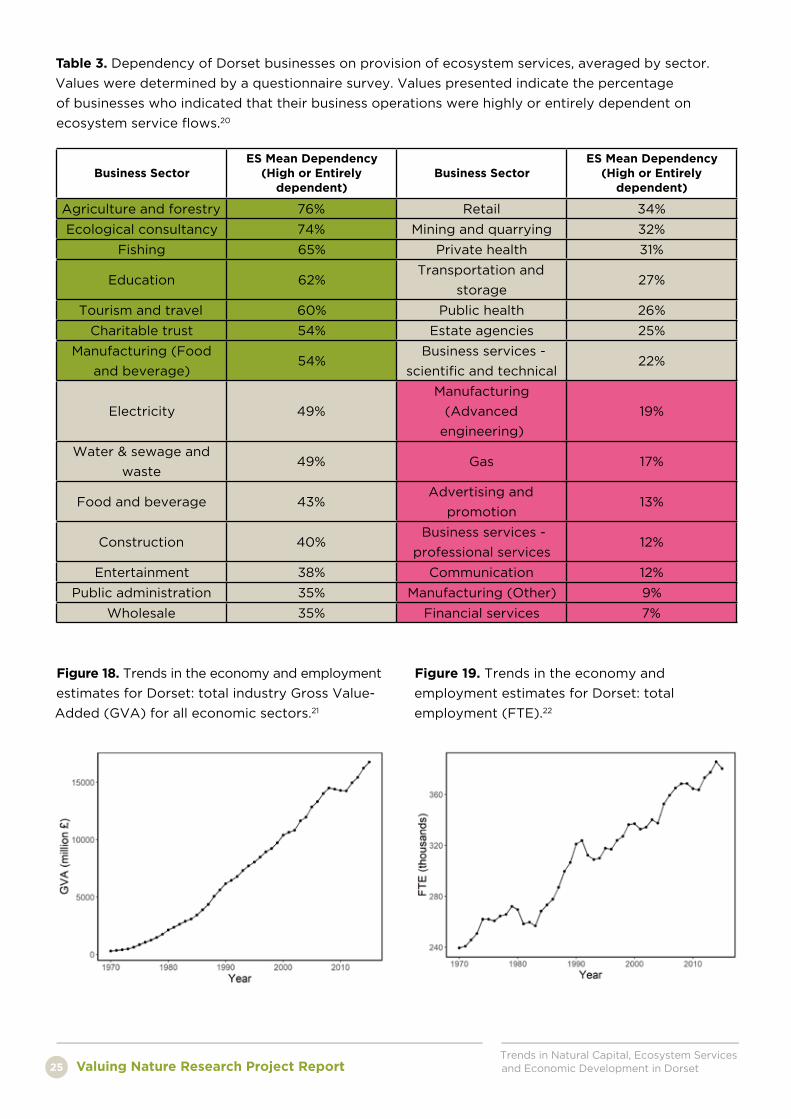
Table 3. Dependency of Dorset businesses on provision of ecosystem services, averaged by sector.
Values were determined by a questionnaire survey. Values presented indicate the percentage
of businesses who indicated that their business operations were highly or entirely dependent on
ecosystem service flows.20
Business SectorES Mean Dependency
(High or Entirely dependent)
Business SectorES Mean Dependency
(High or Entirely dependent)
Agriculture and forestry 76% Retail 34%
Ecological consultancy 74% Mining and quarrying 32%
Fishing 65% Private health 31%
Education 62%Transportation and
storage 27%
Tourism and travel 60% Public health 26%
Charitable trust 54% Estate agencies 25%
Manufacturing (Food
and beverage)54%
Business services -
scientific and technical 22%
Electricity 49%
Manufacturing
(Advanced
engineering)
19%
Water & sewage and
waste49% Gas 17%
Food and beverage 43%Advertising and
promotion 13%
Construction 40%Business services -
professional services 12%
Entertainment 38% Communication 12%
Public administration 35% Manufacturing (Other) 9%
Wholesale 35% Financial services 7%
Figure 18. Trends in the economy and employment
estimates for Dorset: total industry Gross Value-
Added (GVA) for all economic sectors.21
Figure 19. Trends in the economy and
employment estimates for Dorset: total
employment (FTE).22
Trends in Natural Capital, Ecosystem Services and Economic Development in Dorset Valuing Nature Research Project Report 26
Figure 20. The ecosystem services on which Dorset businesses were most dependent, based on results
of a questionnaire survey23.
Sunseeker assembly facility, Poole Harbour © Sunseeker International
Trends in Natural Capital, Ecosystem Services and Economic Development in DorsetValuing Nature Research Project Report27
Environmental and Economic Linkages: Poole Harbour as a Case Study
The environmental value of Poole Harbour is recognised by its designation as
a Special Protected Area (SPA) and as a Ramsar site. The area is particularly
notable for the large populations of waterbirds that it supports, which feed
on the extensive intertidal mud-flats and areas of grazing marsh. One of the
main threats affecting the area is increasing nutrient enrichment, which is
principally caused by agricultural run-off entering the rivers that flow into the
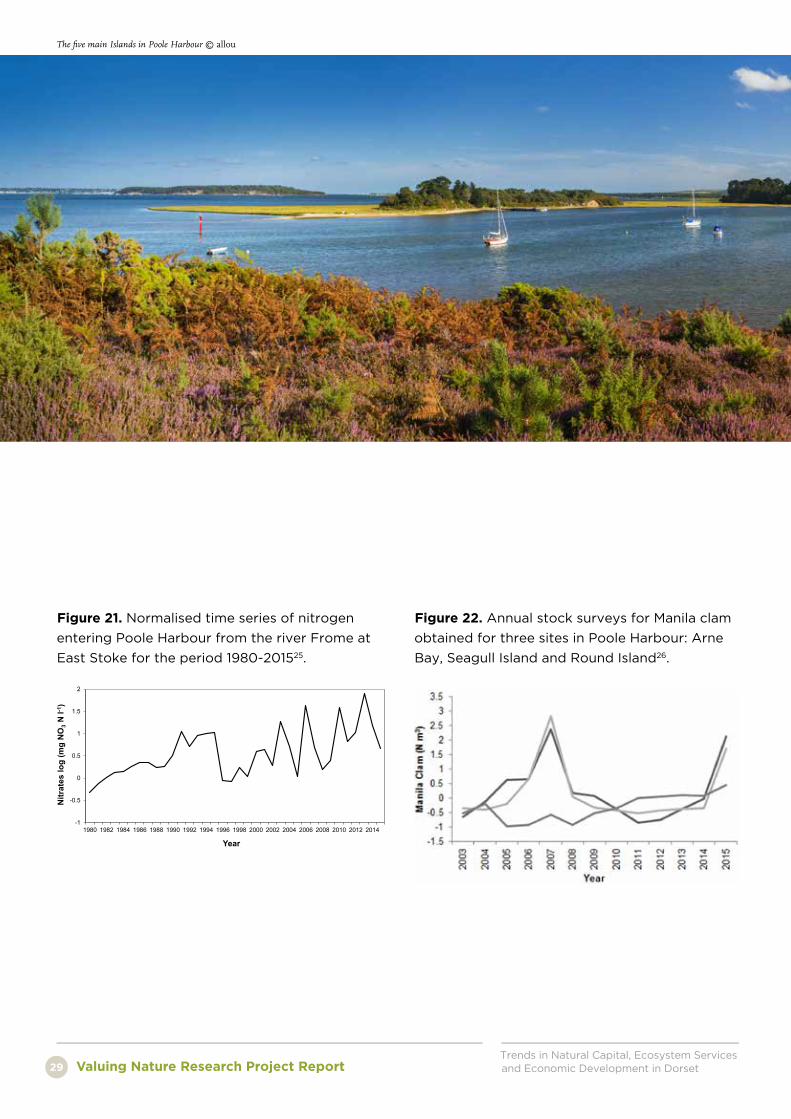
Harbour (Figure 21). This contributes to the growth of algal mats, which can
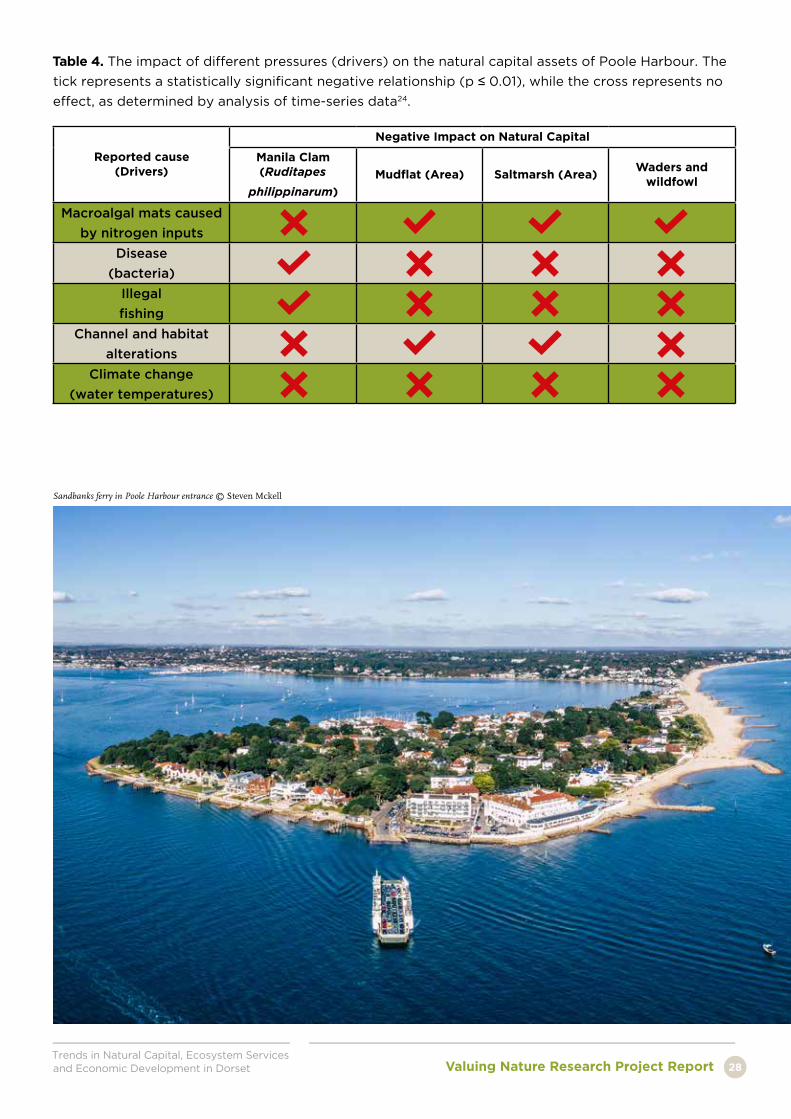
restrict the food available for wading birds. In this study we found a direct
link between the proliferation of algal mats and decreases in mudflat area,
saltmarsh area and populations of overwintering wading birds (Table 4).
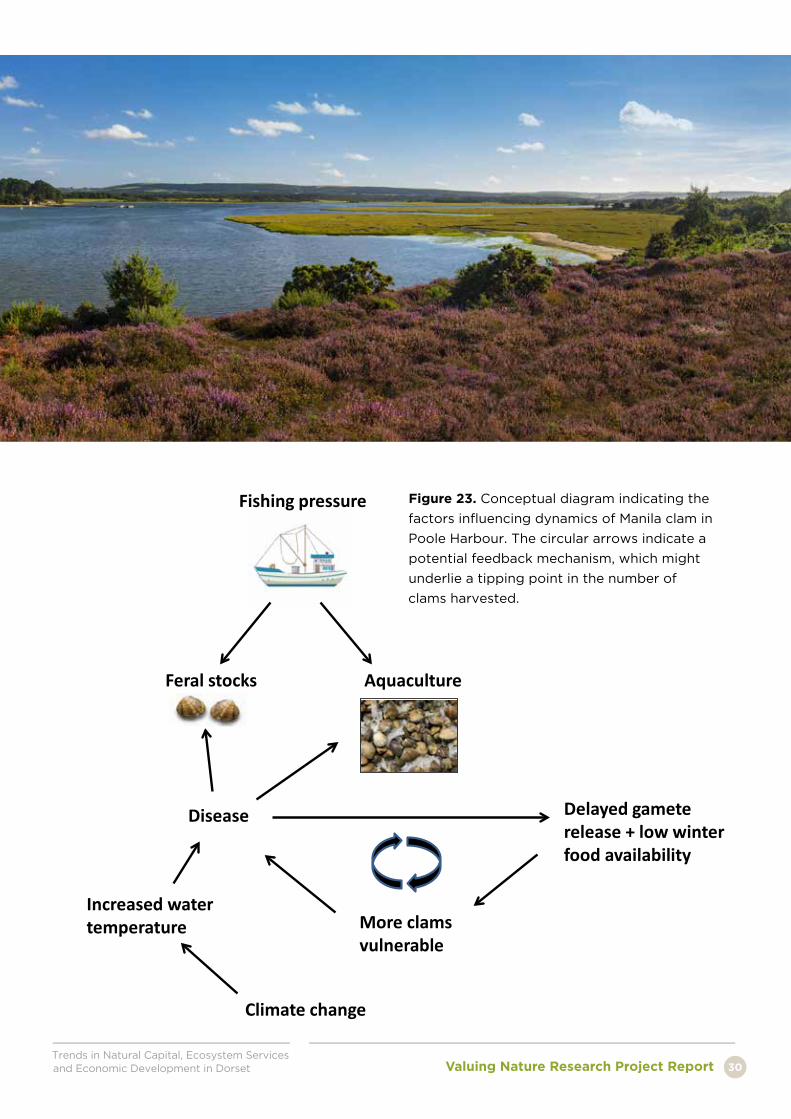
We also examined dynamics of the Manila clam (Ruditapes philippinarum)
industry within the Harbour. This fishery developed in the 1980s after the
species was first introduced for aquaculture. It then spread and started to
reproduce, enabling development of an industry harvesting ‘wild’ populations,
which is currently worth some £1.4 million annually. Analysis of time-series
catch data indicated that populations of Manila clam collapsed in 2008,
having reached a peak the previous year (Figure 22). This decline was partly
attributable to illegal fishing pressure, although other factors such as disease
also appear to have been influential. Potentially, interactions between climate
change, fishing pressure and disease could provide a feedback mechanism
leading to a tipping point in the provision of this ecosystem service (Figure
23). More recently feral clam stocks of the harbour have recovered, owing to
improved management measures taken by the local inshore fisheries and the
conservation authority (IFCA). These efforts have recently been recognised
by certification by the Marine Stewardship Council (MSC).
As one of the world’s largest natural harbours, Poole Harbour provides an informative example of economic links with the environment. The south side of the harbour is home to extensive areas of semi-natural habitats of high conservation value, including saltmarsh, mudflats, sand dunes and heathland. This contrasts with the high-value residential areas located on the northern side, which neighbour the port and its associated industrial areas. Poole Harbour illustrates some of the many conflicts and challenges that can occur when centres of economic activity are located in places that also have high environmental value.
24 Watson, S.C.L. et al. (2018). Estuarine,
Coastal and Shelf Science, 215, 112-123.
25 Data from the Freshwater Biological
Association.
26 Data from the Southern IFCA.
Trends in Natural Capital, Ecosystem Services and Economic Development in Dorset Valuing Nature Research Project Report 28
Table 4. The impact of different pressures (drivers) on the natural capital assets of Poole Harbour. The
tick represents a statistically significant negative relationship (p ≤ 0.01), while the cross represents no
effect, as determined by analysis of time-series data24.
Reported cause (Drivers)
Negative Impact on Natural Capital
Manila Clam (Ruditapes
philippinarum)
Mudflat (Area) Saltmarsh (Area)Waders and
wildfowl
Macroalgal mats caused
by nitrogen inputs
Disease
(bacteria)
Illegal
fishing
Channel and habitat
alterations
Climate change
(water temperatures)
Sandbanks ferry in Poole Harbour entrance © Steven Mckell
Trends in Natural Capital, Ecosystem Services and Economic Development in DorsetValuing Nature Research Project Report29
-1
-0.5
0
0.5
1
1.5
2
1980 1982 1984 1986 1988 1990 1992 1994 1996 1998 2000 2002 2004 2006 2008 2010 2012 2014
Nitr
ates
log
(mg
NO
3N
l-1 )
Year
Figure 21. Normalised time series of nitrogen
entering Poole Harbour from the river Frome at
East Stoke for the period 1980-201525.
Figure 22. Annual stock surveys for Manila clam
obtained for three sites in Poole Harbour: Arne
Bay, Seagull Island and Round Island26.
The five main Islands in Poole Harbour © allou
Trends in Natural Capital, Ecosystem Services and Economic Development in Dorset Valuing Nature Research Project Report 30
Aquaculture Feral stocks
Disease
Increased water temperature
Delayed gamete release + low winter food availability
More clams vulnerable
Fishing pressure
Climate change
Figure 23. Conceptual diagram indicating the
factors influencing dynamics of Manila clam in
Poole Harbour. The circular arrows indicate a
potential feedback mechanism, which might
underlie a tipping point in the number of
clams harvested.
Trends in Natural Capital, Ecosystem Services and Economic Development in DorsetValuing Nature Research Project Report31
Future Trends
To explore the potential impacts of possible future trends, we developed
scenarios of future land use in collaboration with local stakeholders.
Representatives of local businesses, conservation organisations and
government agencies were invited to evaluate different land use options
at a project workshop. Scenario development was further supported by
use of two modelling approaches: (i) an input-output economic model,
and (ii) an agent-based model. While input-output models are widely
used to support economic planning, they do not explicitly consider links
with the environment. For this reason an agent-based model (DONC)
was developed that incorporates land cover maps of Dorset, and enables
simulation of ecosystem service flows to businesses under different
scenarios of environmental change. The two models were used in
combination to explore the potential impacts of different scenarios of land
cover change.
How might Dorset’s environment and economy change in the future? This is a very pertinent question, given the current political uncertainty surrounding the UK’s relationship with the EU. If the UK leaves the EU as planned following the referendum result in 2016, this will have major implications for agriculture. Specifically, Brexit involves departure from the EU’s Common Agricultural Policy (CAP) schemes, which are currently an important source of revenue for farmers. While the UK will be able to develop its own agricultural policy to replace the CAP, the details of this have not yet been finalised. It appears that farmers and land managers will likely be able to receive government funds for the provision of environmental services and benefits27, as well as traditional products such as food and timber. This policy shift might provide economic opportunities for managing the landscapes of Dorset in a profoundly different way.
27 https://www.gov.uk/government/
publications/the-future-for-food-
farming-and-the-environment-policy-
statement-2018
28 Lawton, J.H. et al. (2010). Making Space
for Nature: a review of England’s wildlife
sites and ecological network. Report to
Defra.
29 See also the “Biodiversity 2020”
strategy produced by Defra.
30 https://www.gov.uk/government/
publications/25-year-environment-
plan/25-year-environment-plan-our-
targets-at-a-glance
31 http://www.biodiversitysouthwest.org.
uk/nmap.html
Trends in Natural Capital, Ecosystem Services and Economic Development in Dorset Valuing Nature Research Project Report 32
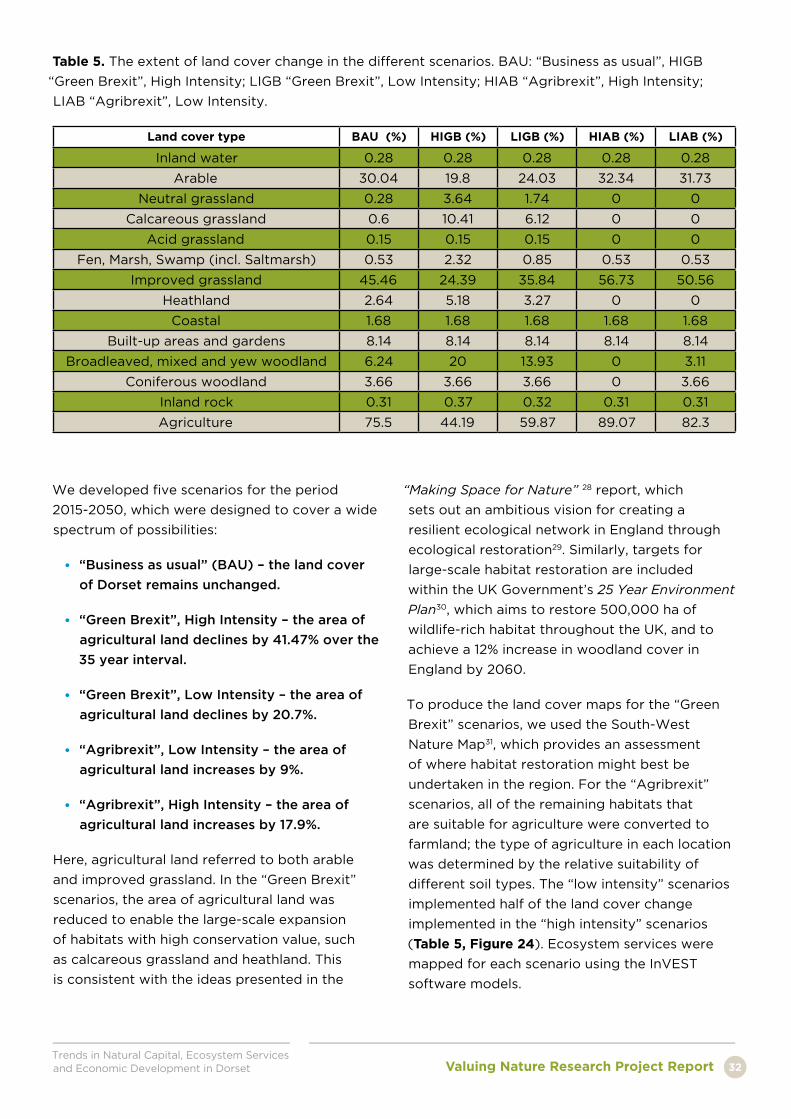
We developed five scenarios for the period
2015-2050, which were designed to cover a wide
spectrum of possibilities:
• “Business as usual” (BAU) – the land cover
of Dorset remains unchanged.
• “Green Brexit”, High Intensity – the area of
agricultural land declines by 41.47% over the
35 year interval.
• “Green Brexit”, Low Intensity – the area of
agricultural land declines by 20.7%.
• “Agribrexit”, Low Intensity – the area of
agricultural land increases by 9%.
• “Agribrexit”, High Intensity – the area of
agricultural land increases by 17.9%.
Here, agricultural land referred to both arable
and improved grassland. In the “Green Brexit”
scenarios, the area of agricultural land was
reduced to enable the large-scale expansion
of habitats with high conservation value, such
as calcareous grassland and heathland. This
is consistent with the ideas presented in the
“Making Space for Nature” 28 report, which
sets out an ambitious vision for creating a
resilient ecological network in England through
ecological restoration29. Similarly, targets for
large-scale habitat restoration are included
within the UK Government’s 25 Year Environment
Plan30, which aims to restore 500,000 ha of
wildlife-rich habitat throughout the UK, and to
achieve a 12% increase in woodland cover in
England by 2060.
To produce the land cover maps for the “Green
Brexit” scenarios, we used the South-West
Nature Map31, which provides an assessment
of where habitat restoration might best be
undertaken in the region. For the “Agribrexit”
scenarios, all of the remaining habitats that
are suitable for agriculture were converted to
farmland; the type of agriculture in each location
was determined by the relative suitability of
different soil types. The “low intensity” scenarios
implemented half of the land cover change
implemented in the “high intensity” scenarios
(Table 5, Figure 24). Ecosystem services were
mapped for each scenario using the InVEST
software models.
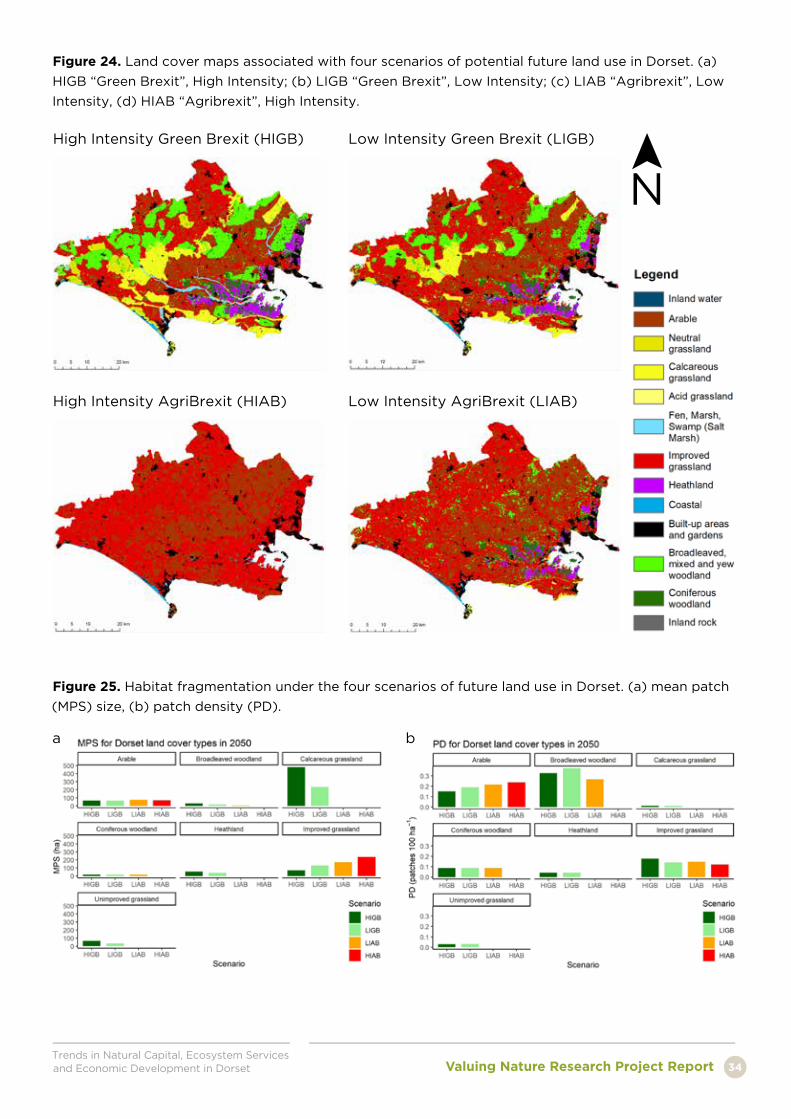
Table 5. The extent of land cover change in the different scenarios. BAU: “Business as usual”, HIGB
“Green Brexit”, High Intensity; LIGB “Green Brexit”, Low Intensity; HIAB “Agribrexit”, High Intensity;
LIAB “Agribrexit”, Low Intensity.
Land cover type BAU (%) HIGB (%) LIGB (%) HIAB (%) LIAB (%)
Inland water 0.28 0.28 0.28 0.28 0.28
Arable 30.04 19.8 24.03 32.34 31.73
Neutral grassland 0.28 3.64 1.74 0 0
Calcareous grassland 0.6 10.41 6.12 0 0
Acid grassland 0.15 0.15 0.15 0 0
Fen, Marsh, Swamp (incl. Saltmarsh) 0.53 2.32 0.85 0.53 0.53
Improved grassland 45.46 24.39 35.84 56.73 50.56
Heathland 2.64 5.18 3.27 0 0
Coastal 1.68 1.68 1.68 1.68 1.68
Built-up areas and gardens 8.14 8.14 8.14 8.14 8.14
Broadleaved, mixed and yew woodland 6.24 20 13.93 0 3.11
Coniferous woodland 3.66 3.66 3.66 0 3.66
Inland rock 0.31 0.37 0.32 0.31 0.31
Agriculture 75.5 44.19 59.87 89.07 82.3

Trends in Natural Capital, Ecosystem Services and Economic Development in DorsetValuing Nature Research Project Report33
There is limited scope for further expansion
of agricultural land in Dorset; most of the
land that is suitable for farming has already
been converted to agricultural land use.
Even if all land suitable for agriculture were
converted, this would only increase the area
of farmland by about 18%.
In addition to increasing their area, the
“Green Brexit” scenarios also had a positive
impact on the fragmentation of habitats with
high conservation value, such as calcareous
grassland, broadleaved woodland, heathland
and unimproved grassland. This was
indicated by increases in mean patch size
and patch density (Figure 25).
As expected, the “Green Brexit” scenarios
had a positive impact on wildlife, values
of the overall biodiversity index and insect
pollinator index increasing significantly
over 2015 values. However, neither of these
indices achieved the values that were
present in 1930, indicating that much more
extensive habitat restoration measures
would be required to return the wildlife
value of Dorset to what it was around 80
years ago (Figure 26).
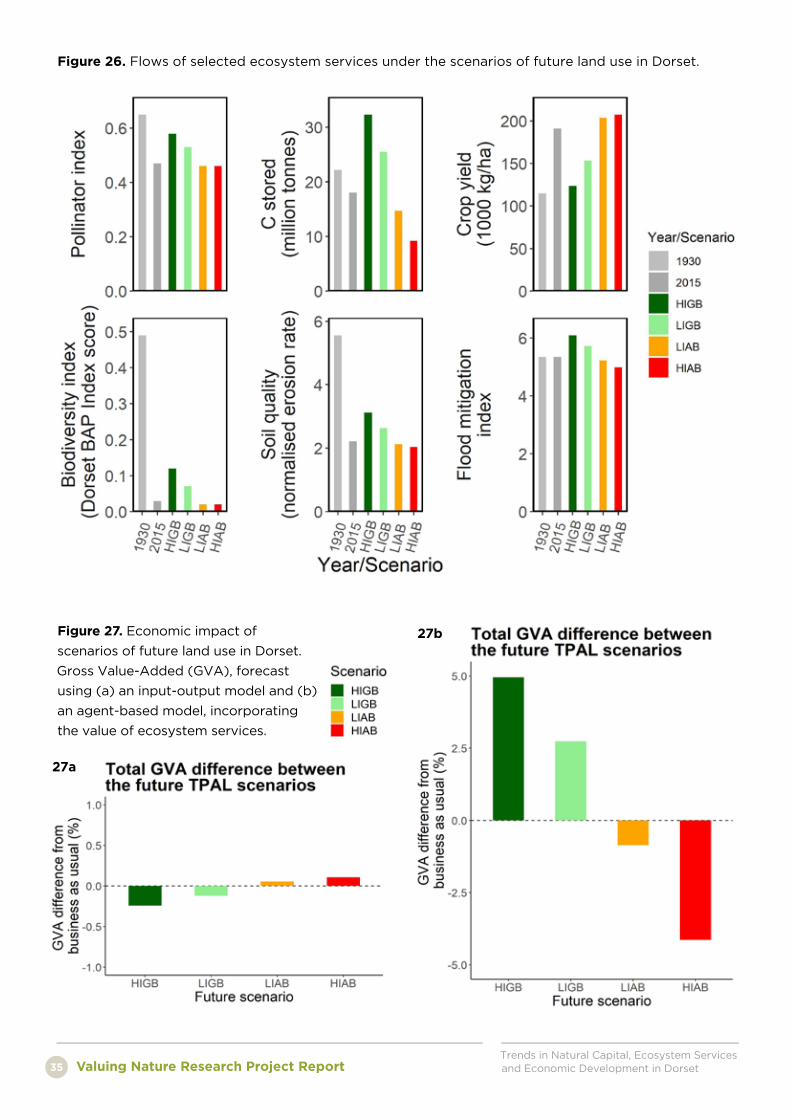
Other ecosystem services that increased
under the “Green Brexit” scenarios included
carbon storage, soil quality, retention
of nitrogen, recreation, aesthetic value
and water yield. Only crop yield and
livestock production were higher under the
“Agribrexit” scenarios.
Analysis using only the input-output model
indicated that the economic impact of
the simulated land cover change was very
slight, with values of GVA changing by ≤
0.3% under each scenario. However, when
the value of ecosystem service provision
was included by using the agent-based
model, the overall economic impact was
much greater (up to 5%) (Figure 27). In
addition, the relative impact of the different
scenarios was completely reversed: when
ecosystem services were considered, the
“Green Brexit” scenarios had a positive
economic impact, whereas the “Agribrexit”
scenarios had a negative economic impact.
This demonstrates how rural land use can
affect the wider economy by affecting
the provision of ecosystem services to
other business sectors. This influence of
farming on the wider economy is ignored
by conventional approaches to economic
forecasting.
Projections of employment mirrored those
obtained for economic growth. Changes in
employment values obtained with the input-
output model were very small, the total
number of jobs increasing by 0.25% in the
“Agribrexit” High Intensity scenario. Much
larger values were obtained using the agent-
based model, which incorporated ecosystem
service flows. Here, the largest increase
(of 8%) was obtained in the “Green Brexit”
High Intensity scenario. This demonstrates
how investment in natural capital can make
a significant contribution to increasing
employment.
Results indicated that:
Trends in Natural Capital, Ecosystem Services and Economic Development in Dorset Valuing Nature Research Project Report 34
Figure 24. Land cover maps associated with four scenarios of potential future land use in Dorset. (a)
HIGB “Green Brexit”, High Intensity; (b) LIGB “Green Brexit”, Low Intensity; (c) LIAB “Agribrexit”, Low
Intensity, (d) HIAB “Agribrexit”, High Intensity.
Figure 25. Habitat fragmentation under the four scenarios of future land use in Dorset. (a) mean patch
(MPS) size, (b) patch density (PD).
High Intensity Green Brexit (HIGB)
High Intensity AgriBrexit (HIAB)
N
Low Intensity Green Brexit (LIGB)
Low Intensity AgriBrexit (LIAB)
a b
Trends in Natural Capital, Ecosystem Services and Economic Development in DorsetValuing Nature Research Project Report35
Figure 26. Flows of selected ecosystem services under the scenarios of future land use in Dorset.
Figure 27. Economic impact of
scenarios of future land use in Dorset.
Gross Value-Added (GVA), forecast
using (a) an input-output model and (b)
an agent-based model, incorporating
the value of ecosystem services.
27a
27b
Trends in Natural Capital, Ecosystem Services and Economic Development in Dorset Valuing Nature Research Project Report 36
Garston Wood © Roger Lane
Trends in Natural Capital, Ecosystem Services and Economic Development in DorsetValuing Nature Research Project Report37
Conclusions
How degraded are Dorset’s ecosystems?
Dorset remains a very important county for wildlife, with extensive areas
of semi-natural habitats, high species richness and important populations
of many species of conservation concern. However, it is clear from our
analyses that Dorset’s wildlife value has undergone a substantial decline
in the past 80 years, as indicated by the loss and fragmentation of many
important habitats, such as calcareous grassland, neutral grassland and
heathland. Many of these habitats have lost more than half of the area that
was present in 1930. These losses are largely attributable to intensification
of agriculture and changing farming practices. Although the rate of habitat
loss has slowed in the past three decades, the productivity and efficiency
of agriculture continues to increase. This intensification is associated with
ongoing losses of biodiversity. All of Dorset’s semi-natural ecosystems are
receiving nitrogen deposition in exceedance of critical loads, and this is
changing the structure and composition of ecological communities. Such
trends are apparent throughout Dorset, showing that farming practices
are having a significant impact on surrounding habitats. However, trends
in ecosystem services reveal a more complex picture. While some services
such as carbon storage and soil quality have declined continuously over
the past 80 years, others such as mitigation of flood risk have displayed
more complex dynamics.
32 Woodcock, B. A. et al. (2017). Science,
356, 6345, 1393-1395.
33 See Philosophical Transactions of the
Royal Society special issue (2003), vol.
358, issue 1439.
34 https://www.metoffice.gov.uk/
research/collaboration/ukcp
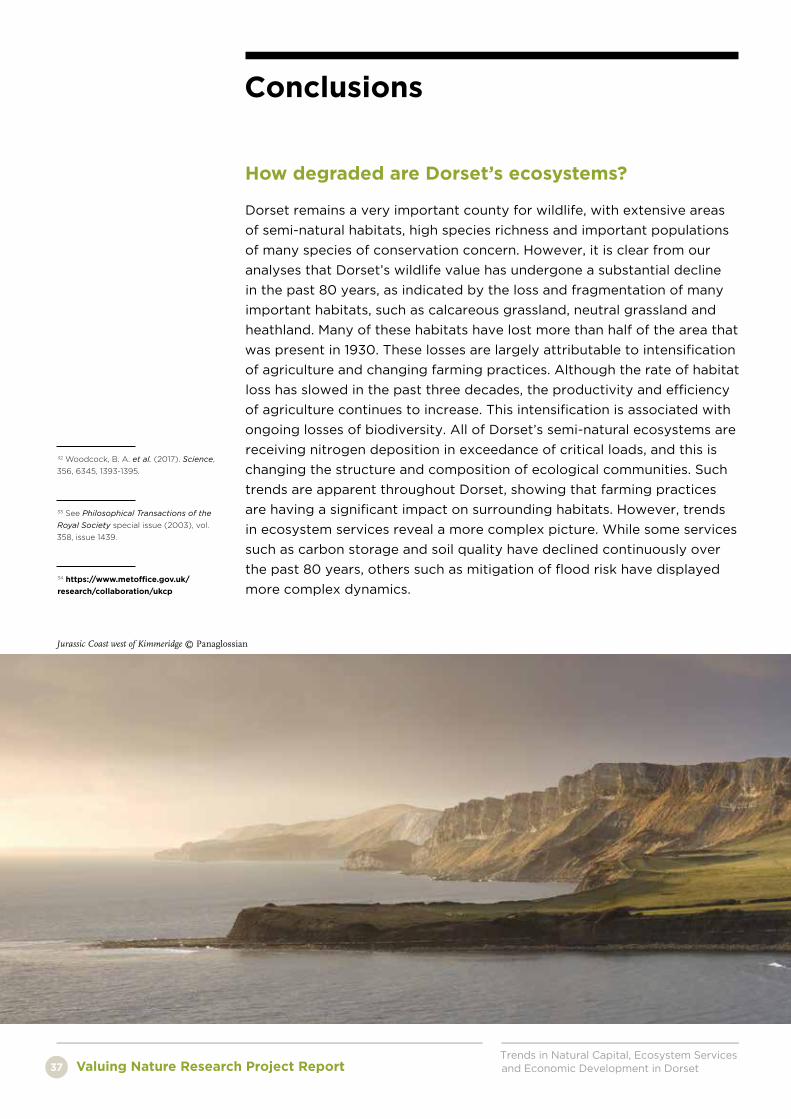
Jurassic Coast west of Kimmeridge © Panaglossian
Trends in Natural Capital, Ecosystem Services and Economic Development in Dorset Valuing Nature Research Project Report 38
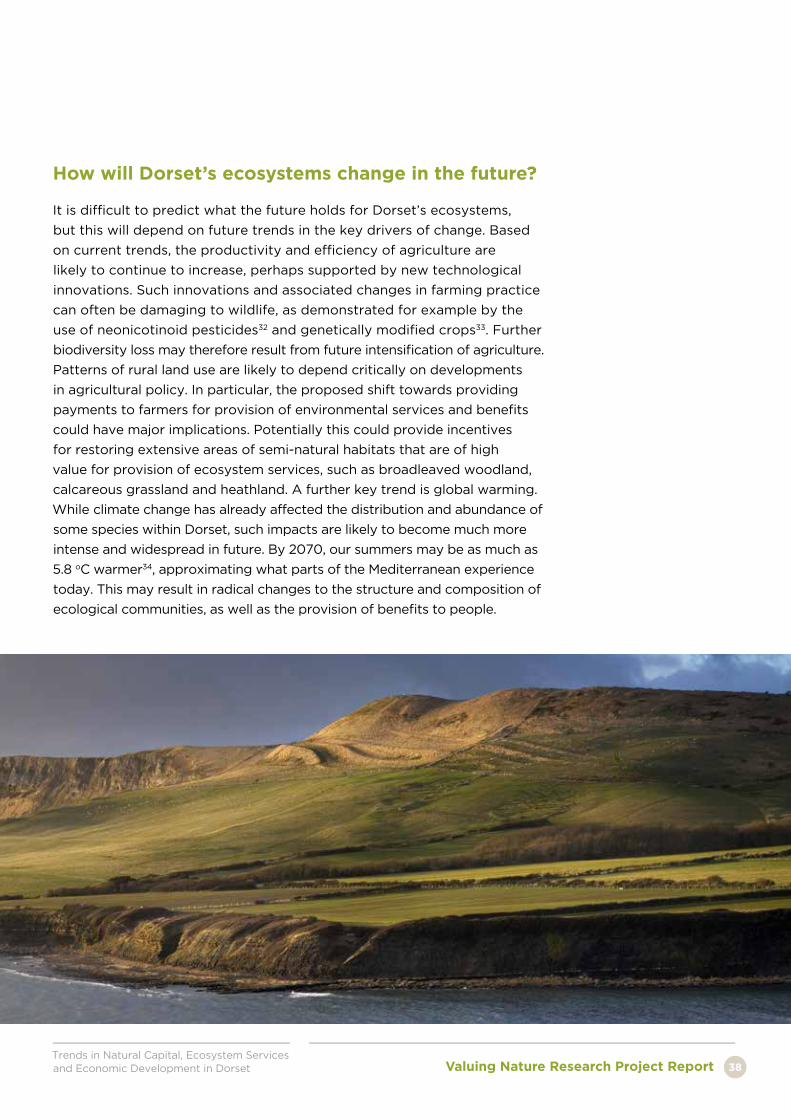
How will Dorset’s ecosystems change in the future?
It is difficult to predict what the future holds for Dorset’s ecosystems,
but this will depend on future trends in the key drivers of change. Based
on current trends, the productivity and efficiency of agriculture are
likely to continue to increase, perhaps supported by new technological
innovations. Such innovations and associated changes in farming practice
can often be damaging to wildlife, as demonstrated for example by the
use of neonicotinoid pesticides32 and genetically modified crops33. Further
biodiversity loss may therefore result from future intensification of agriculture.
Patterns of rural land use are likely to depend critically on developments
in agricultural policy. In particular, the proposed shift towards providing
payments to farmers for provision of environmental services and benefits
could have major implications. Potentially this could provide incentives
for restoring extensive areas of semi-natural habitats that are of high
value for provision of ecosystem services, such as broadleaved woodland,
calcareous grassland and heathland. A further key trend is global warming.
While climate change has already affected the distribution and abundance of
some species within Dorset, such impacts are likely to become much more
intense and widespread in future. By 2070, our summers may be as much as
5.8 oC warmer34, approximating what parts of the Mediterranean experience
today. This may result in radical changes to the structure and composition of
ecological communities, as well as the provision of benefits to people.
Trends in Natural Capital, Ecosystem Services and Economic Development in DorsetValuing Nature Research Project Report39
Might Dorset ecosystems be vulnerable to tipping points?
We detected a number of non-linear relationships in our analyses.
For example, many of the ecosystem services varied in a non-linear
fashion over time, even though agricultural intensification - the main
driver of land cover change - increased linearly. Some measures of land
cover change, such as the area of arable land, increased non-linearly.
We also detected some non-linear relationships along gradients of
ecosystem condition in our field surveys. This indicates that the existence
of some ecological thresholds in relation to the status of natural capital
assets, which could lead to relatively abrupt change in provision of
ecosystem services35. However, we found little evidence for true “tipping
points”, which require an underlying feedback mechanism to be identified.
This partly reflects the difficulty of identifying such feedback mechanisms.
The recent decline of Manila clam in Poole Harbour might provide an
example, with a potential feedback mechanism involving bacterial disease,
and possible interactions with fishing pressure, climate change and
eutrophication.
Currently, there is a lack of understanding of the feedback mechanisms
that might cause rapid shifts in Dorset’s ecosystems. It is becoming
clear, however, that agricultural use of pesticides can cause a massive
decline in insect populations36, which could potentially cause the collapse
of food webs and associated extinction cascades. Such processes may
account for the 75% decline in biomass of flying insects recently recorded
in protected areas in Germany over a period of 27 years37. It is possible
that similar trends are occurring in Dorset, although appropriate data are
currently lacking. However, our analysis of time-series data suggested
that profound shifts in Dorset’s ecosystems have already happened,
because the process of agricultural intensification is now well advanced.
For example, the conversion of 97% of neutral grassland and 70% of
calcareous grassland over the past 80 years must have been associated
with a major loss of functional capacity of these ecosystems, although
evidence for this is lacking. Furthermore, the fact that critical loads for
nitrogen deposition are being exceeded throughout Dorset implies that
an important ecological threshold has been crossed, which may have
implications for future provision of ecosystem benefits to people. Climate
change and its interaction with other drivers such as nitrogen deposition
increase the risk of abrupt changes in ecosystem service provision
occurring in the future.
35 Mace, G.M. et al. (2015). J. Appl. Ecol. 52,
641-653.
36 Sánchez-Bayo, F. and Wyckhuys, K.A.G.
(2019). Biological Conservation, 232, 8–27.
37 Hallmann, C.A. et al. (2017). PLoS ONE
12(10), e0185809.
Trends in Natural Capital, Ecosystem Services and Economic Development in Dorset Valuing Nature Research Project Report 40
What are the relationships between Dorset’s environment and its economy?
One of the most striking results that we obtained was the contrast
between environmental and economic trends. Whereas biodiversity
and the provision of many ecosystem services has declined over the
past 80 years, the economy has grown and employment has risen.
This implies that economic development has been achieved through the
liquidation of natural assets. However, another feature of these results is
the fact that agriculture comprises a very small part of Dorset’s economy.
This indicates that most economic development has not been driven
by direct exploitation of Dorset’s natural resources. Conversely, our
research has also showed that rural land use has a significant influence
on the overall economy in a way that is not captured by traditional
approaches to economic analysis. Patterns of rural land use profoundly
influence the provision of multiple ecosystem services on which many
businesses depend, to varying degrees. Our research also showed that
this contribution of rural land use to the economy may be of significantly
greater economic value than crop and livestock production. Does this
imply that the entire economy of Dorset is vulnerable to environmental
degradation? Model simulations suggested that if provision of ecosystem
services were to be significantly reduced by future environmental
degradation, overall economic activity (as measured by GVA) could
decline by more than a third. If employment were also to decline
significantly, the economic impacts could be substantially larger. Future
environmental trends such as climate change and ongoing agricultural
intensification may therefore have significant economic consequences for
Dorset, and other comparable areas.
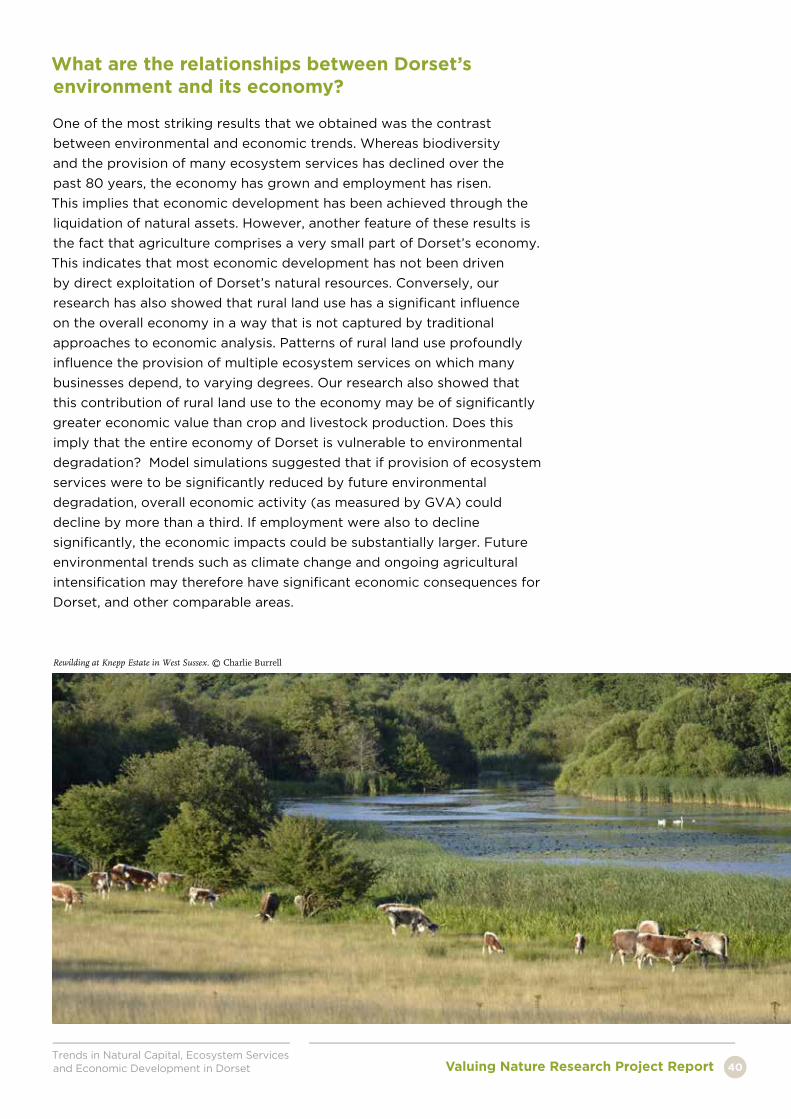
Rewilding at Knepp Estate in West Sussex. © Charlie Burrell
Trends in Natural Capital, Ecosystem Services and Economic Development in DorsetValuing Nature Research Project Report41
How might future investment in natural capital affect the economy?
Our results suggest that any investment in increasing agricultural
productivity or efficiency is unlikely to have a significant impact on the
local economy, despite its potential value for improving food sovereignty.
However, the scenarios we developed demonstrate how investment
in natural capital could potentially strengthen Dorset’s economy, by
improving provision of ecosystem services on which many businesses
depend. For example, according to our simulations, implementation of
ecological restoration at the scale described under the “Green Brexit –
High Intensity” scenario could potentially deliver an £0.8 billion increase
in GVA and create more than 25,000 jobs. How might investment in
natural capital be achieved in practice? Many different options have been
proposed38, including development of ecological networks, woodland
planting, development of green infrastructure, and creation of wetlands
or semi-natural grasslands. Each of these options was rated ‘highly’
or ‘very highly’ by more than half of the stakeholders consulted at our
project workshop, where different natural capital investment options were
explored. Any approach that improves the condition or extent of semi-
natural habitats could potentially strengthen the provision of ecosystem
services, including wildlife-friendly farming approaches such as organic
approaches to pest control and soil improvement, ecological restoration,
habitat enhancement schemes and maintenance of habitat diversity.
We examined one particular approach in detail: rewilding. The term
“rewilding” refers to a form of ecological restoration that seeks to
support the recovery of ecosystems primarily through the action of
natural ecological processes. The term has been applied to a wide variety
of different conservation practices including species reintroductions
(particularly of large vertebrates), taxon substitution, flood pattern
restoration and the abandonment of agricultural land. While rewilding is
increasingly being explored in many different parts of the world, including
the UK, its relevance to lowland agricultural landscapes such as Dorset has
been little explored. We therefore examined the potential application of
a number of different rewilding approaches39, involving the consultation
of local stakeholders. Survey results showed strong support for rewilding
among stakeholders, with the reintroduction of beavers and pine martens
being especially popular. Naturalistic grazing and farmland abandonment
were also identified as rewilding approaches that have widespread
potential across Dorset (Figure 28). On the basis of previous research
conducted into other rewilding sites in the UK, implementation
of such approaches is likely to significantly increase provision of
ecosystem services40. An example of how rewilding can be successfully
implemented in lowland agricultural landscapes is provided by the Knepp
Estate in West Sussex (see photo page 40).
38 For example, see the reports of the
Natural Capital Committee to the UK
Government; https://www.gov.uk/
government/groups/natural-capital-
committee
39 Loth, A.F., and Newton, A.C. (2018).
Journal for Nature Conservation, 46,
110-120.
40 Hodder, K.H. et al. (2014). International
Journal of Biodiversity Science, Ecosystem
Services and Management. 10(1). 71-83.
41 Loth, A.F., and Newton, A.C. (2018).
Journal for Nature Conservation, 46,
110-120.
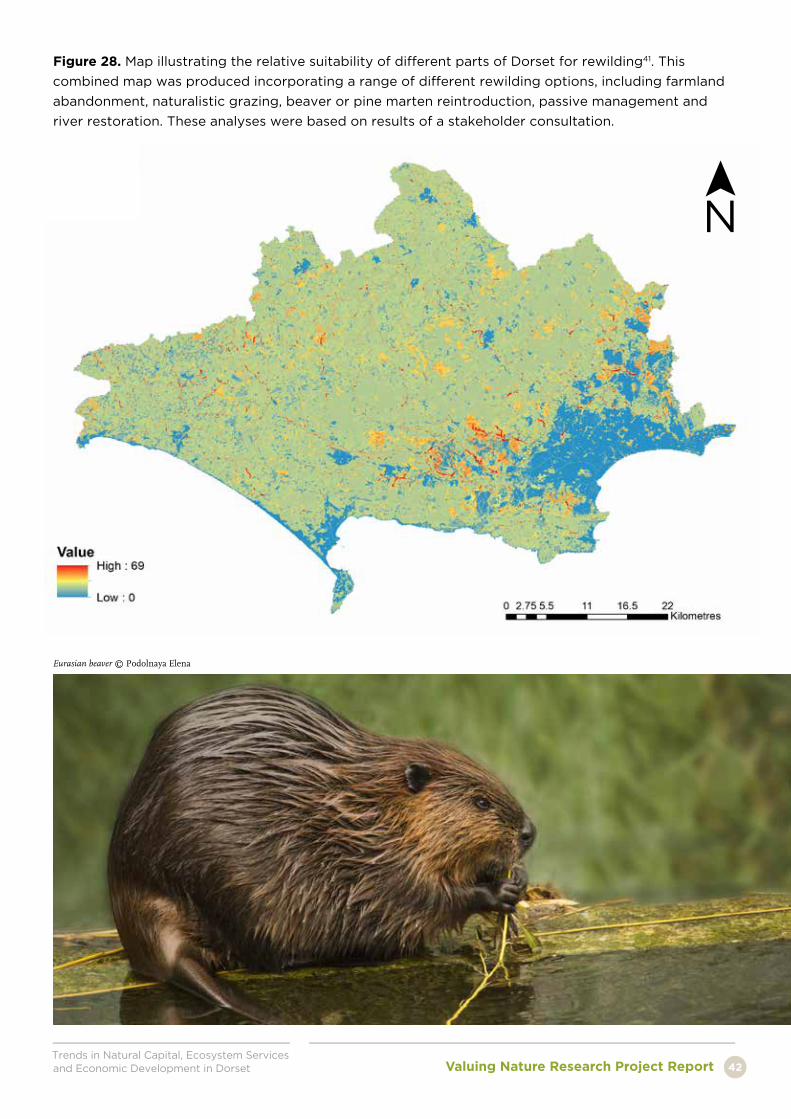
Trends in Natural Capital, Ecosystem Services and Economic Development in Dorset Valuing Nature Research Project Report 42
Figure 28. Map illustrating the relative suitability of different parts of Dorset for rewilding41. This
combined map was produced incorporating a range of different rewilding options, including farmland
abandonment, naturalistic grazing, beaver or pine marten reintroduction, passive management and
river restoration. These analyses were based on results of a stakeholder consultation.
N
Eurasian beaver © Podolnaya Elena
Trends in Natural Capital, Ecosystem Services and Economic Development in DorsetValuing Nature Research Project Report43
Recommendations
Invest in natural capital, by enhancing ecosystem condition
and by increasing the area of semi-natural habitats of high
conservation value. Such investment would provide direct
benefits to businesses, support economic growth and increase
employment, while also providing wider benefits to society and
to the environment.
Develop policies aimed at providing incentives for farmers to
produce environmental goods and services. Evidence indicates
that this would provide greater benefits to the economy than
increased production of traditional agricultural products.
Incorporate the value of ecosystem services provided by rural
land use in economic analysis and forecasting approaches.
The value of these services to the broader economy can potentially
exceed the economic value of the agricultural sector itself.
Use land use approaches that improve the condition and
extent of semi-natural habitats to strengthen the provision
of ecosystem services, including wildlife-friendly farming
approaches, organic approaches to pest control and soil
improvement, ecological restoration, habitat enhancement
schemes and maintenance of habitat diversity.
Reduce nitrogen deposition. There is an urgent need
to improve the condition of semi-natural ecosystems in
agricultural landscapes such as Dorset. Initiatives designed to
help farmers reduce nitrogen applications, such as the Code of
Good Agricultural Practice for Reducing Ammonia Emissions42,
should be strongly supported.
Develop and implement plans for large-scale habitat creation
and restoration. Environmental degradation can lead to abrupt
changes in the provision of ecosystem services, which could
negatively affect the economy and wider society. The risks
of such abrupt changes occurring are likely to intensify with
increasing climate change. Approaches aiming to increase
the extent and condition of semi-natural habitats, such
as ecological restoration, rewilding and development of
ecological networks, would help mitigate these risks. 42 https://www.gov.uk/government/
publications/code-of-good-agricultural-
practice-for-reducing-ammonia-
emissions
Trends in Natural Capital, Ecosystem Services and Economic Development in Dorset Valuing Nature Research Project Report 44
Further information
Loth, A.F., and Newton, A.C. (2018). Rewilding as a restoration strategy
for lowland agricultural landscapes: stakeholder-assisted multi-criteria
analysis in Dorset, UK. Journal for Nature Conservation, 46, 110-120.
McCracken, M.E., Evans, P., Hulmes, L., Hulmes, S., Newton, A., Ridding,
L.E., Watson, S.C.L., Bullock, J.M. (2019). Habitat condition gradients
and the provision of ecosystem service benefits across ecologically
important habitats in Dorset. Manuscript in preparation.
Newton, A.C., Evans, P., Watson, S.C.L., Brand, S., Ridding, L.E.,
McCracken, M.E., Bullock, J.M. (2019). Does investment in natural
capital make economic sense? Scenarios of post-Brexit land use
options. Manuscript in preparation.
Ridding, L.E., Watson, S.C.L., Newton, A.C., Rowland, C.S., Bullock,
J.M. (2019). Patterns and drivers of habitat loss in a rural landscape
over multiple time periods between 1930 and 2015. Manuscript in
preparation.
Watson, S.C.L., Grandfield, F.G., Herbert, R.J., and Newton, A.C. (2018).
Detecting ecological thresholds and tipping points in the natural
capital assets of a protected coastal ecosystem. Estuarine, Coastal and
Shelf Science, 215, 112-123.
Watson, S.C.L and Newton, A.C. (2018). Dependency of businesses on
flows of ecosystem services: a case study from the county of Dorset,
UK. Sustainability, 10(5).
Watson, S.C.L, Newton, A.C , Ridding, L,E., McCracken, M., Brand,
S.,Gosal, S.A., and Bullock, J, M (2019). Does agricultural intensification
contribute to tipping points in ecosystem services? Manuscript in
preparation.
Ridding L.E., Newton, A.C., Watson, S.C.L., Redhead, J.W., Rowland,
C.S., Bullock, J.M. (2019). Re-constructing maps of historical habitat
loss over multiple time periods. Manuscript in preparation.
Acknowledgements
Thanks to our partners Nigel Jump (Bournemouth University) and Steven Brand (University of Plymouth) for assistance with economic modelling, and to Rob Robinson (BTO) for agricultural data. Thanks also to Simon Cripps and Maria Clarke from the Dorset Local Nature Partnership (LNP) and Luke Rake from the Dorset Local Enterprise Partnership (LEP) for their advice and assistance with networking. This work is designed to support the work of both the Dorset LNP and LEP in improving the future environment and economy of Dorset. Our hope is that the results will also be of relevance to other lowland agricultural landscapes in the region.
Thank you to Ulrike Dragosits (CEH) for the nitrogen deposition data.
This report was funded by NERC grant reference number: NE/P007716/1 as part of the project Mechanisms and Consequences of Tipping Points in Lowland Agricultural Landscapes (TPAL), which forms part of the Valuing Nature Programme. The Valuing Nature Programme is a 5-year research programme that aims to improve understanding of the value of nature both in economic and non-economic terms, and improve the use of these valuations in decision making. It funds interdisciplinary research and builds links between researchers and people who make decisions that affect nature in business, policy-making and in practice.
The Valuing Nature Programme is funded by the Natural Environment Research Council, the Economic and Social Research Council, the Biotechnology and Biological Sciences Research Council, the Arts and Humanities Research Council, and the Department for Environment, Food and Rural Affairs.
[email protected] @ValuingN
valuing-nature.nettpalvaluing-nature.co.uk
Durdle Door at sunrise © Shaun Jacobs