Embed Size (px)
Citation preview
Birth Trends in Los Angeles County and Potential Public Health Impacts
Louise Rollin‐Alamillo, MSAlex Ho, MD, MPHMargaret Shih, MD, PhDChief Science Office

Objectives
• Show trends in births in LAC, 1990 ‐ 2011– Mother’s race/ethnicity – Mother’s nativity– Mother’s age
• Review factors possibly associated with trends– Demographic (migration)– Behavioral– Economic
• Public Health Impacts1

MethodsCalculation of rates and other statistics:
– Total fertility rates and age‐specific birth rates
–Mean age at first birth
2

Total fertility rates ‐ defined• A measure of completed family size.• Average number of children a woman would bear if today’s age‐specific rates of fertility prevailed throughout her lifetime.
• Best for making comparisons over time or between groups.
• The replacement rate is a TFR of 2.1 birth per woman.
3

Data Sources
–Birth data: Birth Statistical Master File (BSMF)
–Population denominators and statistics: • Public Use Microdata file (PUMS)• Summary File 1 from 1990 and 2000 Census
• American Community Survey (ACS)
4
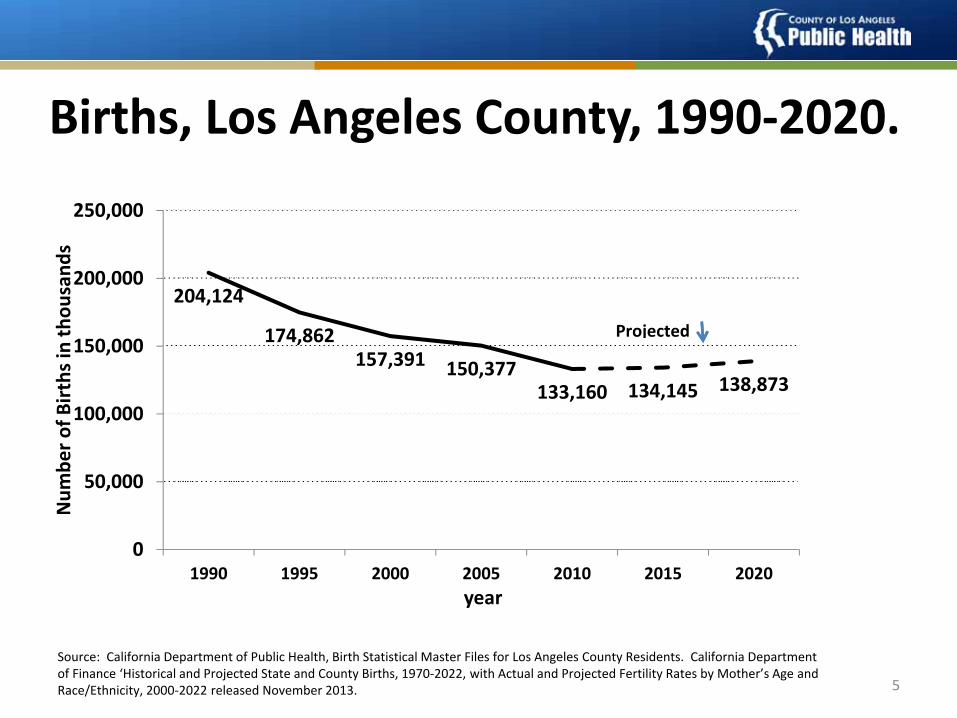
Births, Los Angeles County, 1990‐2020.
5
Source: California Department of Public Health, Birth Statistical Master Files for Los Angeles County Residents. California Department of Finance ‘Historical and Projected State and County Births, 1970‐2022, with Actual and Projected Fertility Rates by Mother’s Age and Race/Ethnicity, 2000‐2022 released November 2013.
204,124
174,862157,391 150,377
133,160 134,145 138,873
0
50,000
100,000
150,000
200,000
250,000
1990 1995 2000 2005 2010 2015 2020
Num
ber o
f Births in
thou
sand
s
year
Projected
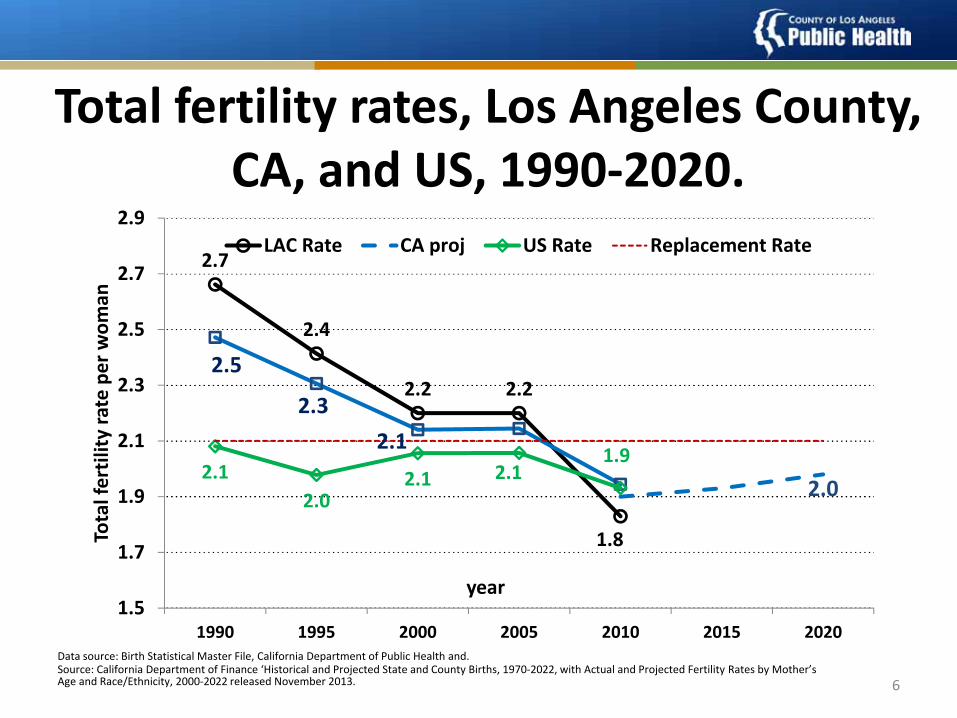
Total fertility rates, Los Angeles County, CA, and US, 1990‐2020.
6
Data source: Birth Statistical Master File, California Department of Public Health and.Source: California Department of Finance ‘Historical and Projected State and County Births, 1970‐2022, with Actual and Projected Fertility Rates by Mother’s Age and Race/Ethnicity, 2000‐2022 released November 2013.
2.7
2.4
2.2 2.2
1.8
2.5
2.32.1
2.02.1
2.02.1 2.1
1.9
1.5
1.7
1.9
2.1
2.3
2.5
2.7
2.9
1990 1995 2000 2005 2010 2015 2020
Total fertility
rate per wom
an
year
LAC Rate CA proj US Rate Replacement Rate

Total fertility rates by mother’s race/ethnicity, Los Angeles County, 1990‐2010
7
3.6
2.2
2.6
1.71.8
1.31.7
1.31.0
1.5
2.0
2.5
3.0
3.5
4.0
1990 1995 2000 2005 2010
Total Fertility
Rate pe
r wom
an
year
Hispanic African American (NH)White (NH) Asian (NH)Replacement Rate
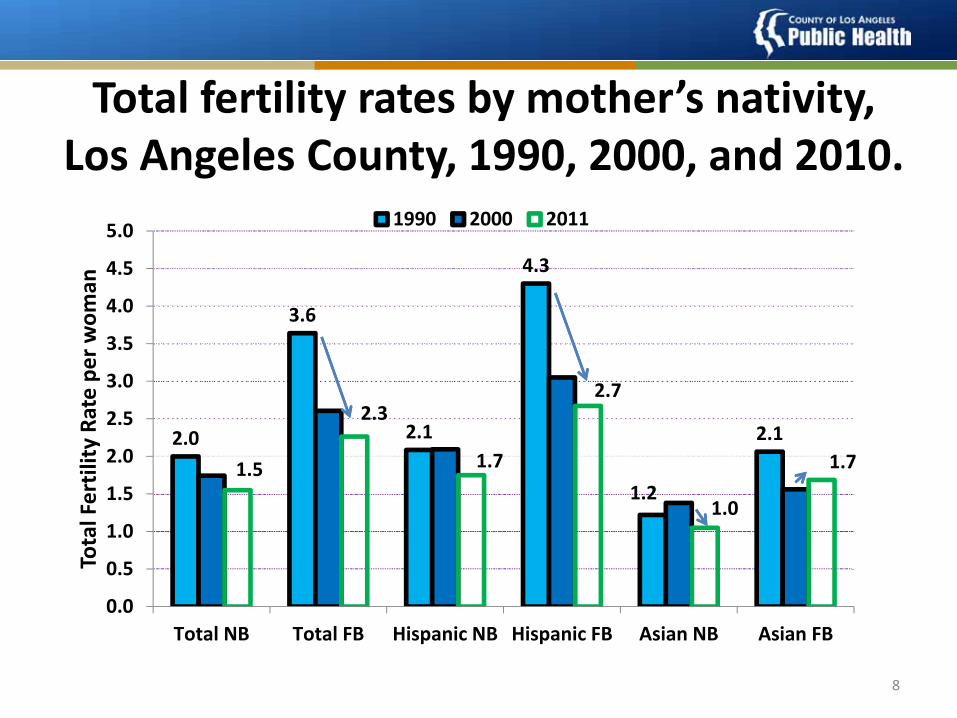
Total fertility rates by mother’s nativity, Los Angeles County, 1990, 2000, and 2010.
8
2.0
3.6
2.1
4.3
1.2
2.1
1.5
2.3
1.7
2.7
1.0
1.7
0.0
0.5
1.0
1.5
2.0
2.5
3.0
3.5
4.0
4.5
5.0
Total NB Total FB Hispanic NB Hispanic FB Asian NB Asian FB
Total Fertility
Rate pe
r wom
an
1990 2000 2011
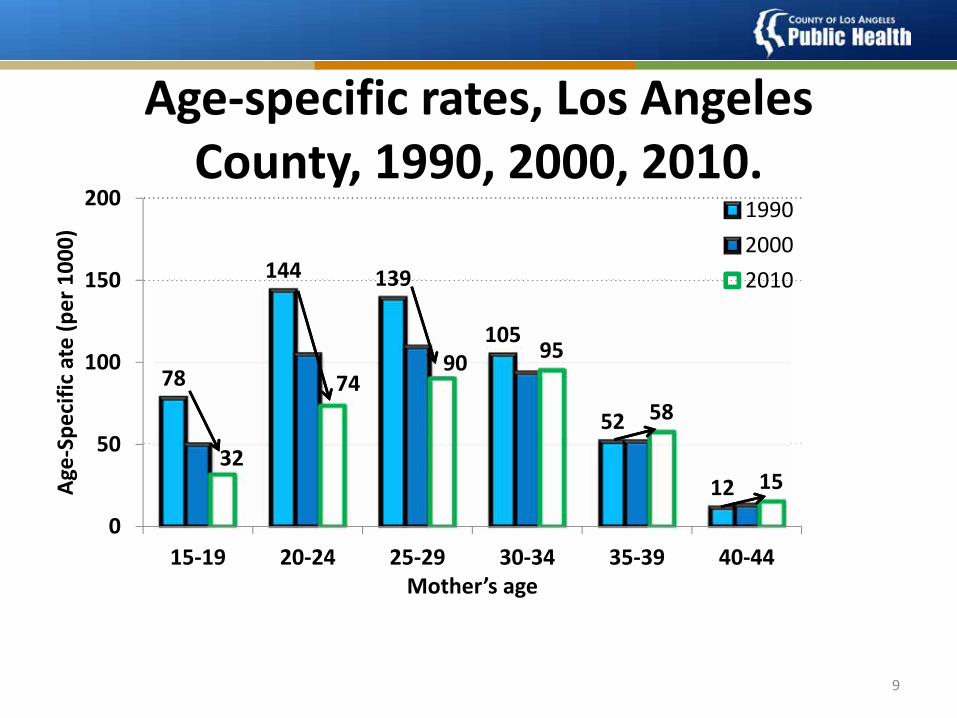
Age‐specific rates, Los Angeles County, 1990, 2000, 2010.
9
78
144 139
105
52
1232
7490 95
58
15
0
50
100
150
200
15‐19 20‐24 25‐29 30‐34 35‐39 40‐44
Age‐Specific ate (per 1000)
Mother’s age
199020002010
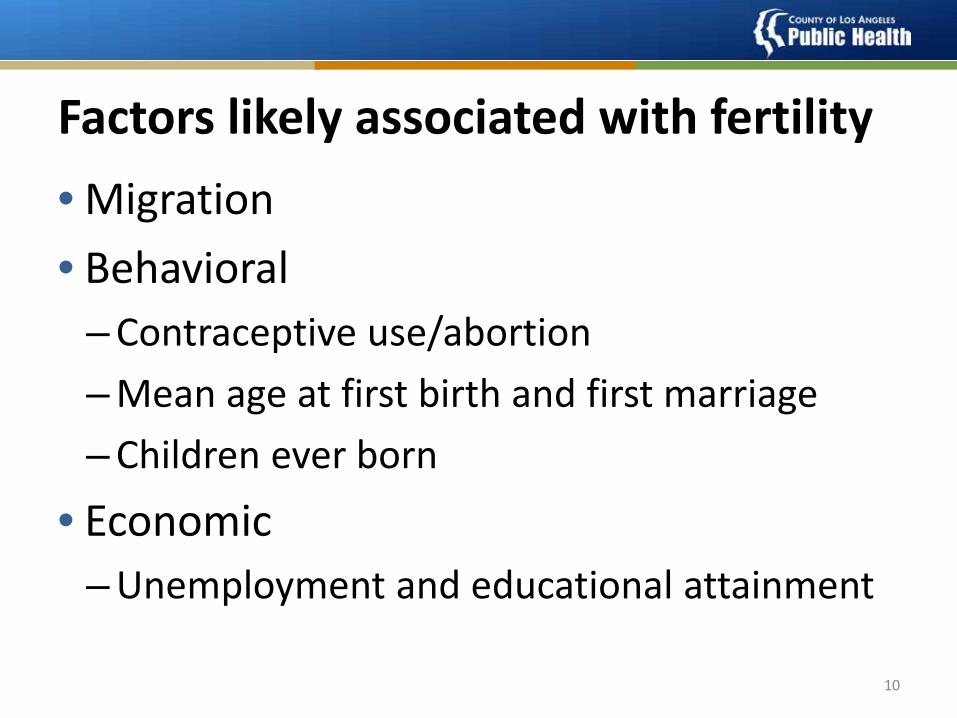
Factors likely associated with fertility• Migration • Behavioral
–Contraceptive use/abortion–Mean age at first birth and first marriage–Children ever born
• Economic–Unemployment and educational attainment
10

Changes in Migration
11
Data source: U.S. Census Bureau, 1990 Census, Summary File 1. 2000 Census Summary File 1, American Community Survey 2011 1‐year Survey.
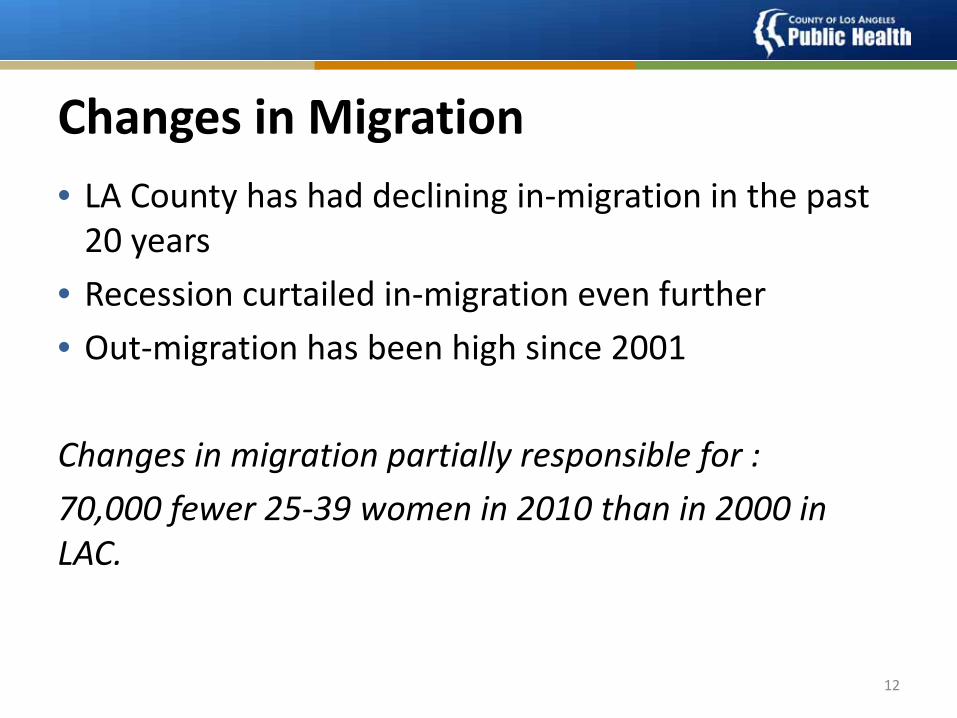
• LA County has had declining in‐migration in the past 20 years
• Recession curtailed in‐migration even further• Out‐migration has been high since 2001
Changes in migration partially responsible for :70,000 fewer 25‐39 women in 2010 than in 2000 in LAC.
Changes in Migration• LA County has had declining in‐migration in the past 20 years
• Recession curtailed in‐migration even further• Out‐migration has been high since 2001
Changes in migration partially responsible for :70,000 fewer 25‐39 women in 2010 than in 2000 in LAC.
12

Behavioral Factors• Contraception – sterilization becoming increasingly common
• Abortion –Decreased to lowest level since 1973 • Later age at first marriage
– From 23.9 in 1990 to 26.5 in 2011 (women) – For CA 27.6 for women in 2011
• Later age a first birth • Childlessness
13
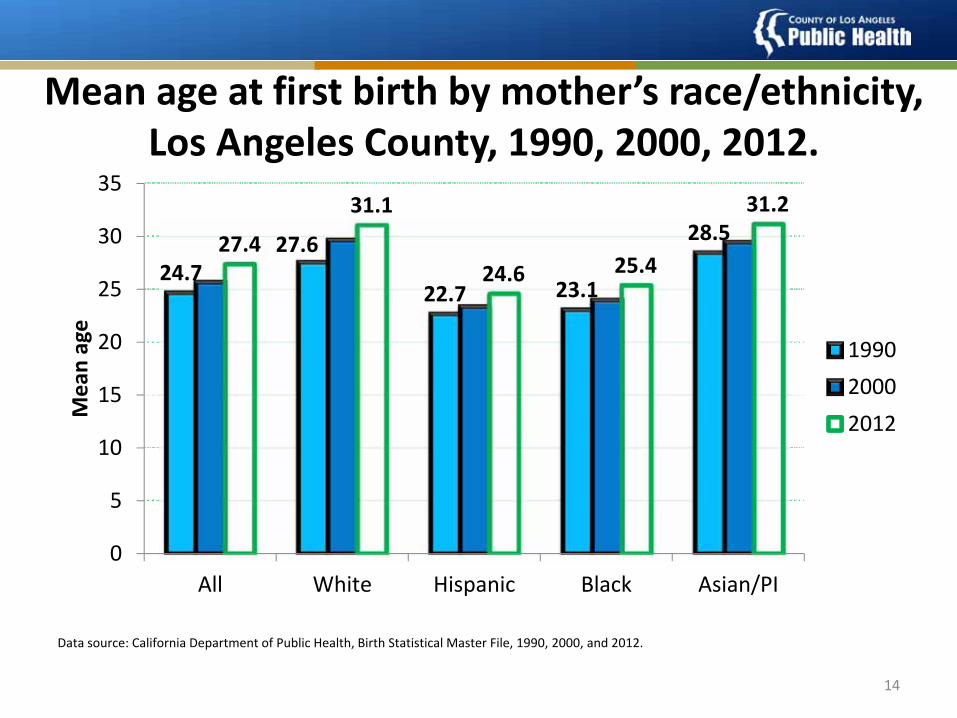
Mean age at first birth by mother’s race/ethnicity, Los Angeles County, 1990, 2000, 2012.
14
Data source: California Department of Public Health, Birth Statistical Master File, 1990, 2000, and 2012.
24.727.6
22.7 23.1
28.527.4
31.1
24.6 25.4
31.2
0
5
10
15
20
25
30
35
All White Hispanic Black Asian/PI
Mean age
199020002012

Economic Factors
Effects of the Great Recession?
– Increase in unemployment = decrease in births
– Birth rate for mothers with the lowest education attainment has declined
15

Change in unemployment rate and births, Los Angeles County, 2005‐2012.
0
2
4
6
8
10
12
14
115
120
125
130
135
140
145
150
155
2005 2006 2007 2008 2009 2010 2011 2012
Percent unemployedBi
rths in
thou
sand
s
year
birthsrate
16
Data source: Census Bureau’s American Community Survey 1‐year samples, Table S2301.California Department of Public Health’s Birth Statistical Master Files, Los Angeles County Residents
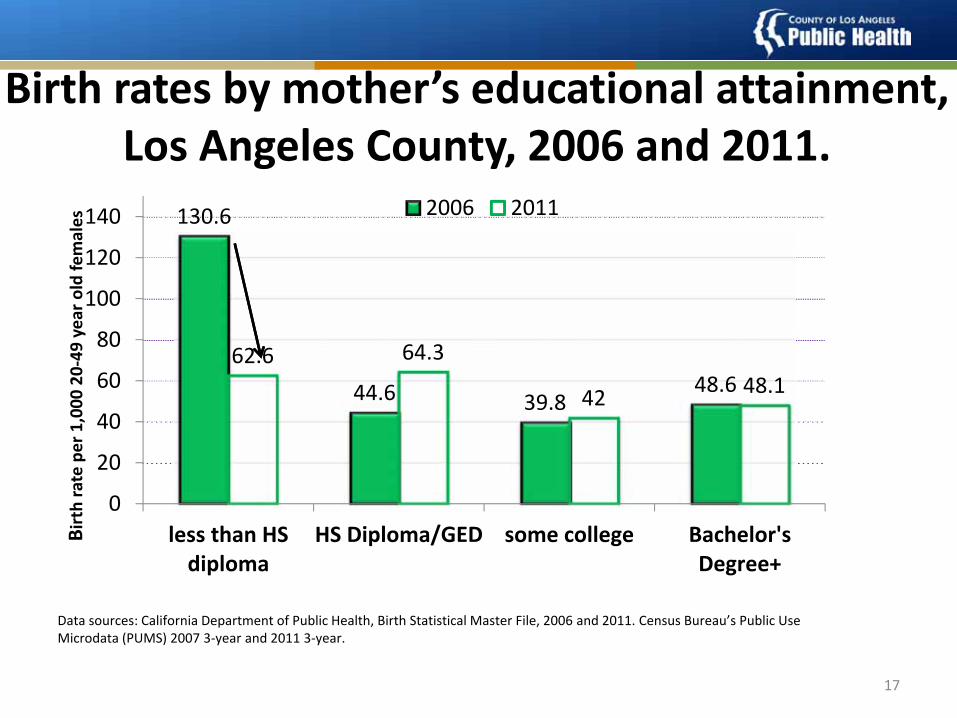
Birth rates by mother’s educational attainment, Los Angeles County, 2006 and 2011.
17
Data sources: California Department of Public Health, Birth Statistical Master File, 2006 and 2011. Census Bureau’s Public Use Microdata (PUMS) 2007 3‐year and 2011 3‐year.
130.6
44.6 39.848.6
62.6 64.3
42 48.1
0
20
40
60
80
100
120
140
less than HSdiploma
HS Diploma/GED some college Bachelor'sDegree+
Birth rate per 1,000
20‐49
year o
ld fe
males
2006 2011
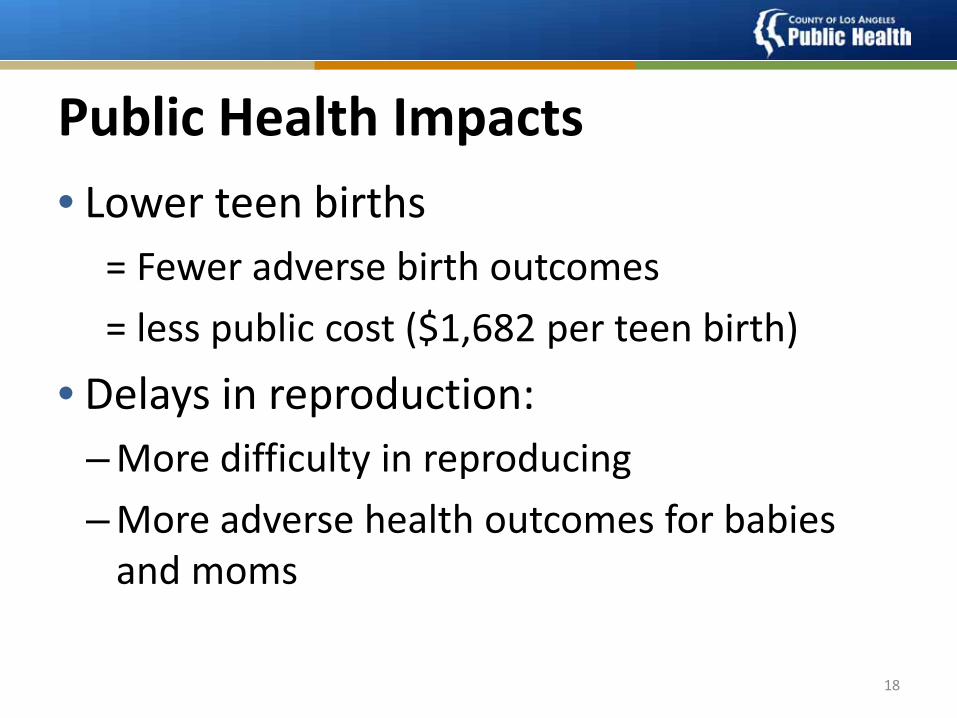
Public Health Impacts• Lower teen births
= Fewer adverse birth outcomes = less public cost ($1,682 per teen birth)
• Delays in reproduction:–More difficulty in reproducing–More adverse health outcomes for babies and moms
18
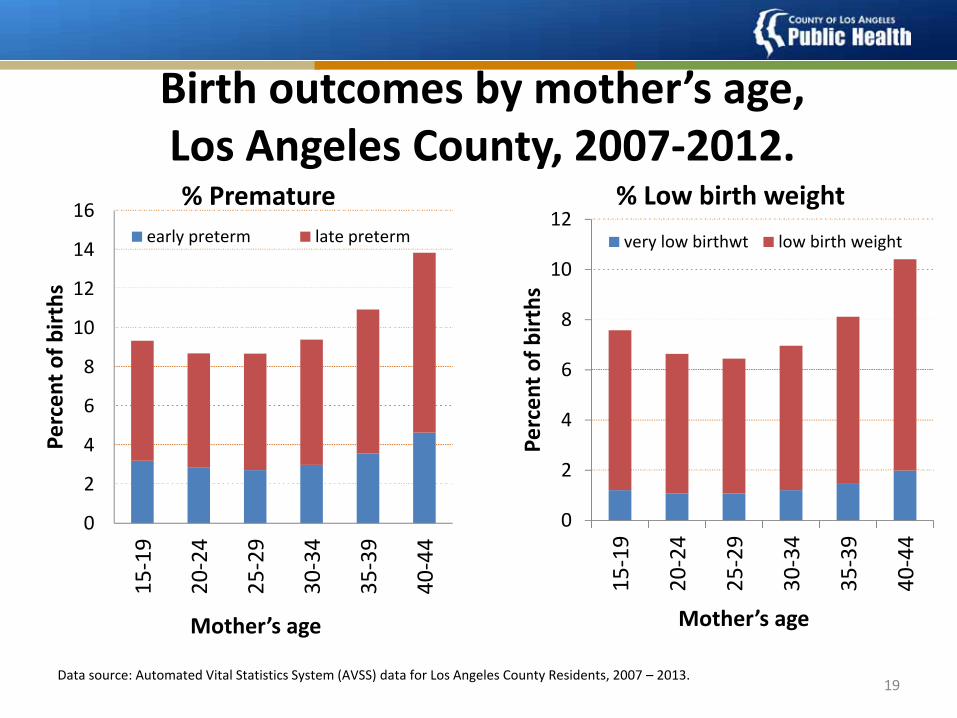
Birth outcomes by mother’s age, Los Angeles County, 2007‐2012.
19Data source: Automated Vital Statistics System (AVSS) data for Los Angeles County Residents, 2007 – 2013.
0
2
4
6
8
10
12
14
16
15‐19
20‐24
25‐29
30‐34
35‐39
40‐44
Percen
t of b
irths
Mother’s age
% Prematureearly preterm late preterm
0
2
4
6
8
10
12
15‐19
20‐24
25‐29
30‐34
35‐39
40‐44
Percen
t of b
irths
Mother’s age
% Low birth weightvery low birthwt low birth weight

Primary Cesareans by mother’s age, Los Angeles County, 2007‐2013.
22.5 22.119.8 18.5
20.122.2
27.8
0.0
5.0
10.0
15.0
20.0
25.0
30.010
‐14
15‐19
20‐24
25‐29
30‐34
35‐39
40‐44
Percen
t of b
irths
mother’s age
20
Data source: Automated Vital Statistics System (AVSS) data for Los Angeles County Residents, 2007 – 2013.

Percent of mothers who had twins or triplets by mother’s age, Los Angeles County, 2007‐2013.
0.6%0.9%
1.2%
1.7%
2.2%
2.9%
0%
1%
1%
2%
2%
3%
3%
4%
15‐19 20‐24 25‐29 30‐34 35‐39 40‐44
Percen
t of m
othe
rs
twins
triplets
21
Data source: Automated Vital Statistics System (AVSS) data for Los Angeles County Residents, 2007 – 2013..
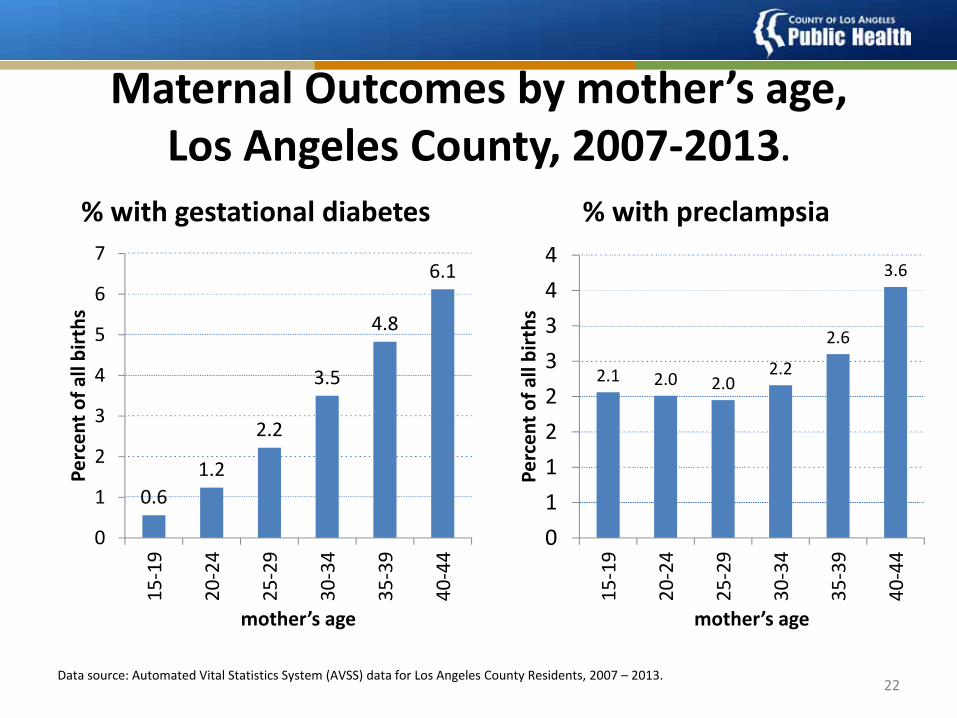
Maternal Outcomes by mother’s age, Los Angeles County, 2007‐2013.
% with gestational diabetes
0.61.2
2.2
3.5
4.8
6.1
0
1
2
3
4
5
6
7
15‐19
20‐24
25‐29
30‐34
35‐39
40‐44
Percen
t of a
ll births
mother’s age
% with preclampsia
2.1 2.0 2.02.2
2.6
3.6
011223344
15‐19
20‐24
25‐29
30‐34
35‐39
40‐44
Percen
t of a
ll births
mother’s age
22Data source: Automated Vital Statistics System (AVSS) data for Los Angeles County Residents, 2007 – 2013.

Public Health Impacts continued…• Fewer births fewer children
fewer working age adults.• Declining in‐migration• Baby boomers retiring AND higher life expectancy increasing ratio of seniors to working age adults.
= High Fiscal impacts
23
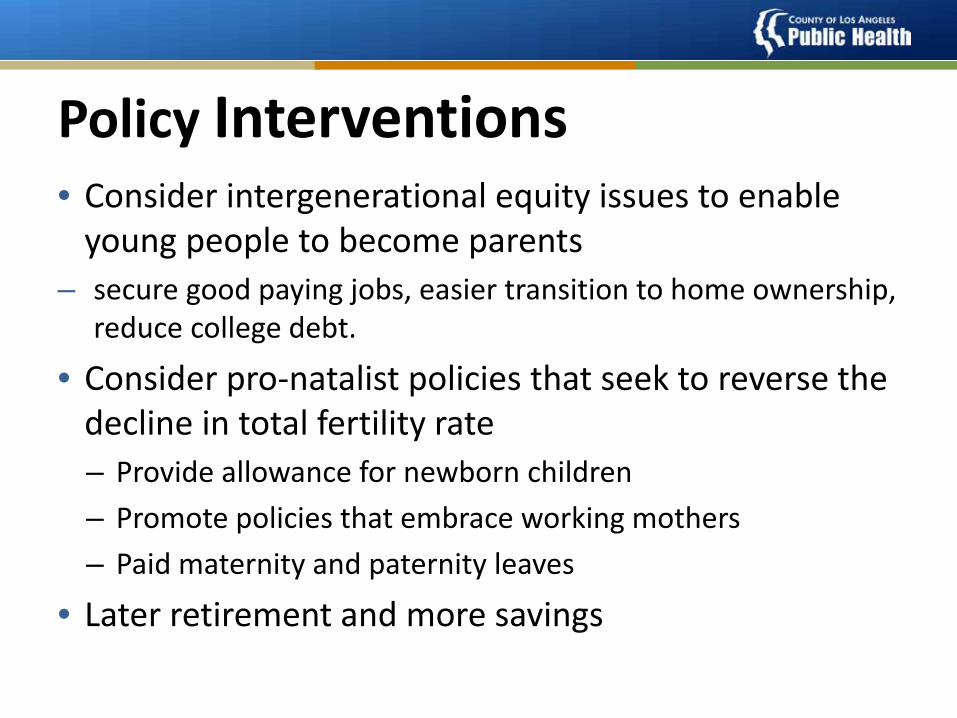
Policy Interventions• Consider intergenerational equity issues to enable young people to become parents
– secure good paying jobs, easier transition to home ownership, reduce college debt.
• Consider pro‐natalist policies that seek to reverse the decline in total fertility rate– Provide allowance for newborn children – Promote policies that embrace working mothers – Paid maternity and paternity leaves
• Later retirement and more savings