Embed Size (px)
Citation preview
c e n t e r o n j a p a n e s e e c o n o m y a n d b u s i n e s s
Working Paper Series May 2012, No. 302
Trends in Long-term Employment and Job Security in Japan and the United States: the Last Twenty-Five Years
Ryo Kambayashi and Takao Kato
This paper is available online at www.gsb.columbia.edu/cjeb/research
C O L U M B I A U N I V E R S I T Y I N T H E C I T Y O F N E W Y O R K

Trends in Long-term Employment and Job Security in Japan and the United States: the Last Twenty-Five Years*
Ryo Kambayashi and Takao Kato**
CJEB Working Paper #302, May 2012
Abstract Taking advantage of a recent relaxation of Japanese government’s data release policy, we conduct a cross-national analysis of micro data from Japan’s Employment Status Survey and its U.S. counterpart, Current Population Survey. Our focus is to document and contrast changes in long-term employment and job security over the last twenty five years between the two largest advanced economies. We find that in spite of the prolonged economic stagnation, the ten-year job retention rates of core employees (employees of prime age of 30-44 who have already accumulated at least five years of tenure) in Japan were remarkably stable at around 70 percent over the last twenty-five years, and there is little evidence that Japan’s Great Recession of the 1990s had a deleterious effect on job stability of such employees. In contrast, notwithstanding its longest economic expansion in history, the comparable job retention rates for core employees in the U.S. actually fell from over 50 percent to below 40 percent over the same time period. The probit estimates of job loss models in the two nations also point to the resilience of job security of core employees in Japan, whereas showing a significant loss of job security for similar employees in the U.S. Though core employees in Japan turned out to have weathered their Great Recession well, we find that mid-career hires and young new job market entrants were less fortunate, with their employment stability deteriorating significantly. We interpret the findings, based on the theory of institutional complementarity, and derive lessons for policy makers around the world who are currently facing their own Great Recessions and developing effective policy responses. (JEL: J63, J64, J41) Key words: Long-term employment, job security, Great Recession, Lost Decade, Japan and the U.S.
*We benefitted from comments by conference participants at the 2011 Trans-Pacific Labor Seminar meeting in Kyoto (March 2011) and at the Meeting of National Economic Research Organizations, OECD Headquarters (June 2011) as well as comments by seminar participants at the University of Lyon (November 2011). The research was facilitated by Kato’s extended visit to Hitotsubashi University as Visiting Scholar and Kambayashi’s extended visit to the OECD as Consultant in OECD Employment Analysis and Policy Division. We are grateful for their hospitality. The opinions expressed and arguments employed here are the responsibility of the author(s) and do not necessarily reflect those of the OECD. **Kato is W.S. Schupf Professor of Economics and Far Eastern Studies, Colgate University; Research Fellow, IZA Bonn; and Research Associate, Center on Japanese Economy and Business (Columbia Business School), Tokyo Center for Economic Research (University of Tokyo), and Center for Corporate Performance (Aarhus School of Business). Ryo Kambayashi is Associate Professor, Institute of Economic Research, Hitotsubashi University. Kato is the corresponding author: Email; [email protected]. Address: Department of Economics (Persson 222),Colgate University, 13 Oak Drive, Hamilton, NY 13346. Phone: 315-228-7562 Fax: 315-228-7033

1
Trends in Long-term Employment and Job Security in Japan and the United States: the Last Twenty-Five Years
1. Introduction
Taking advantage of a recent relaxation of Japanese government’s data release policy, we
conduct a cross-national analysis of micro data from Japan’s Employment Status Survey and Its
U.S. counterpart, Current Population Survey. Our focus is to document and contrast changes in
long-term employment and job security over the last twenty five years between the two largest
advanced economies.
Contrasting Japan’s experience to the U.S. experience over the last twenty five years is of
significant interest. First, considering that the U.S. and Japan represent the two largest advanced
market economies, a rigorous comparative study of the two nations is a valuable undertaking in
its own right. Second and perhaps more importantly, the U.S. and Japan have been considered
representing two contrasting employment systems. The U.S. employment system is often
characterized as a real-world example of a textbook neo-classical labor market with highly
mobile labor force and relatively unregulated firms responding freely and quickly to market
forces (see, for instance, Freeman, 2007). In contrast, Japan was traditionally known for an
alternative labor market model characterized by the practice of “lifetime employment” (or
implicit long-term employment guarantees for the regular workforce) 1; various mechanisms to
enhance employee involvement and voice; elaborate pay systems including employee ownership
and profit sharing; extensive training and multiskilling (including job rotation and various
1 The term “lifetime” is somewhat of a misnomer since except for executives, Japanese workers have been typically subject to mandatory retirement that occurs around age 60. A precise definition of the practice of lifetime employment is therefore implicit long-term employment contract that ends at mandatory retirement for the regular workforce. In addition, the practice of “lifetime employment” does not necessarily mean that layoffs never happen in large Japanese firms. It has been documented that Japanese firms, even large ones, did lay off some of their regular employees, following the first oil crisis (see, for example, Koike, 2005, Suruga, 1998, Nakata and Takehiro, 2003, Chuma, 2002).

2
training programs); and corporate welfare programs (see, for instance, Kato, 2003 and
Kambayashi and Kato, 2011).
Such an alternative labor market model was celebrated as a major source of the Japanese
economic success (e.g., high productivity growth, global competitiveness, and low
unemployment) in the postwar growth era (Aoki, 1990, Koike, 2005, Morita, 2005). Meanwhile,
many U.S. firms responded by benchmarking some of those successful Japanese firms and
adopting their employment practices (see, for example, Ichniowski and Shaw, 2009).2
However following the burst of the financial bubble at the end of the 1980s, the Japanese
economy fell into prolonged stagnation (Japan’s Great Recession), while the U.S. economy
started its longest economic expansion in history. The popular rhetoric about the relative strength
of the Japanese employment system to the U.S. system swung rather wildly. The inability of the
Japanese employment system to respond to rapidly changing market conditions during Japan’s
Great Recession was often accused of a structural impediment to the swift and robust recovery of
the Japanese economy (Ono and Rebick, 2003). Influential associations of Japanese business
leaders, such as Keizai Doyukai (Japan Association of Corporate Executives) and Nippon
Keidanren (Japan Business Federation) called for a replacement of the Japanese system with the
U.S. system. It was truly a remarkable reversal of the fortune of the Japanese employment
system visa vie the U.S. system.
Taking at face value, it appears as if the Japanese employment system and the U.S.
employment system are converging over the last twenty five years – initially the U.S. system
moved toward the Japanese system and then following the burst of Japan’s financial bubble, the
2 There is some evidence that the afore-mentioned Japanese employment system indeed
helped Japanese firms enhance their productivity (See, for instance, Jones and Kato, 1995, Ohkusa and Ohtake, 1997, and Kato and Morishima, 2002).

3
Japanese system moved toward the U.S. system.3 However, data limitation has been preventing
researchers from providing much rigorous comparative evidence on exactly what happened to
the Japanese employment system and the U.S. employment system over the last twenty five
years. This paper is aimed at providing such evidence and as such contributing to the debate over
the convergence theory.
Second, to understand accurately how the Japanese employment system responded to
Japan’s Great Recession will provide insights that are of great value to economic theorists.
Specifically, a number of economic theorists who explore the viability of alternative economic
organizations to textbook capitalist firms with shareholder-oriented corporate governance view
the Japanese economic system as a viable alternative to the Anglo-American model (see, for
example, Aoki, 1990, Milgrom and Roberts, 1994, Koike, 2005, Morita, 2005).
During Japan’s Great Recession, various institutions that are considered complementary
to the Japanese employment system (such as the Keiretsu system which ensures stable supply of
capital, parts and materials) were allegedly weakening. By providing rigorous evidence on how
the Japanese employment system responded to such evolving institutional environments, we can
offer novel insight on the economic theory of institutional complementarity.
To understand better how the Japanese employment system responded to her Great
Recession will be also of significant topical interest and relevance to policy makers around the
world. About ten years after Japan’s Great Recession, the U.S. and other major European
economies started to experience their own Great Recessions, following the financial meltdown in
the fall of 2008.4 By providing rigorous and comparative evidence on how Japan’s long-term
3 For the convergence theory and the related debate, see for instance Katz and Darbishire (2000),
Boyer (2001), Jacoby, Nason and Saguchi (2005), and Sako (2005). 4 Notwithstanding some important differences between Japan’s Great Recession and the recent
global Great Recession, there are some intriguing similarities (Koo, 2009). A number of serious attempts

4
employment and job security changed during her own Great Recession as compared to the U.S.,
we hope to be able to help policy makers in the U.S. and many advanced economies assess the
long-term employment effects of the financial meltdown in the fall of 2008 and subsequent
global Great Recession accurately, and develop well-informed policy responses.
In the next section, we present our key findings concerning changes in long-term
employment in Japan and the U.S. over the last twenty five years, computing and contrasting
various job retention rates between the two nations. In Section 3 we explore the nature and
causes of changes in job stability (or lack thereof) of Japanese workers over the last twenty five
years by estimating a probit model of job separations including both voluntary and involuntary
turnover. In Section 4 we take advantage of the availability of comparable job loss data for Japan
and the U.S. in recent years and conduct a cross-national probit analysis of job loss probability.
As such, the section presents new comparative evidence on changes in job security of Japanese
and U.S. employees. The concluding section follows.
2. Job retention rates of Japanese and U.S. workers over the Last Twenty-five Years
There is a long and fruitful tradition of comparing the prevalence of long-term
employment between Japan and the U.S. in labor economics and industrial relations. Hashimoto
and Rasian (1985) provide the first rigorous cross-national evidence on the practice of “lifetime
employment” during Japan’s high growth period (1962-77) by using aggregate data from the
Employment Status Survey (the Japanese counterpart of CPS tenure supplements of the U.S.). 5
have been made to contrast the Great Recession to Japan’s Great Recession in the 1990s, in search for historical lessons with regard to the causes and consequences of such severe and prolonged recession as well as appropriate policy responses (see, for instance, Hamada, Kashyap, and Weinstein, 2011 and Hoshi and Kashyap, 2010).
5 There is, however, an alternative dataset available for Japan, i.e., the Basic Survey of Wage Structure (often called the Wage Census data). Though the Wage Census data are obtained from an establishment-level
5
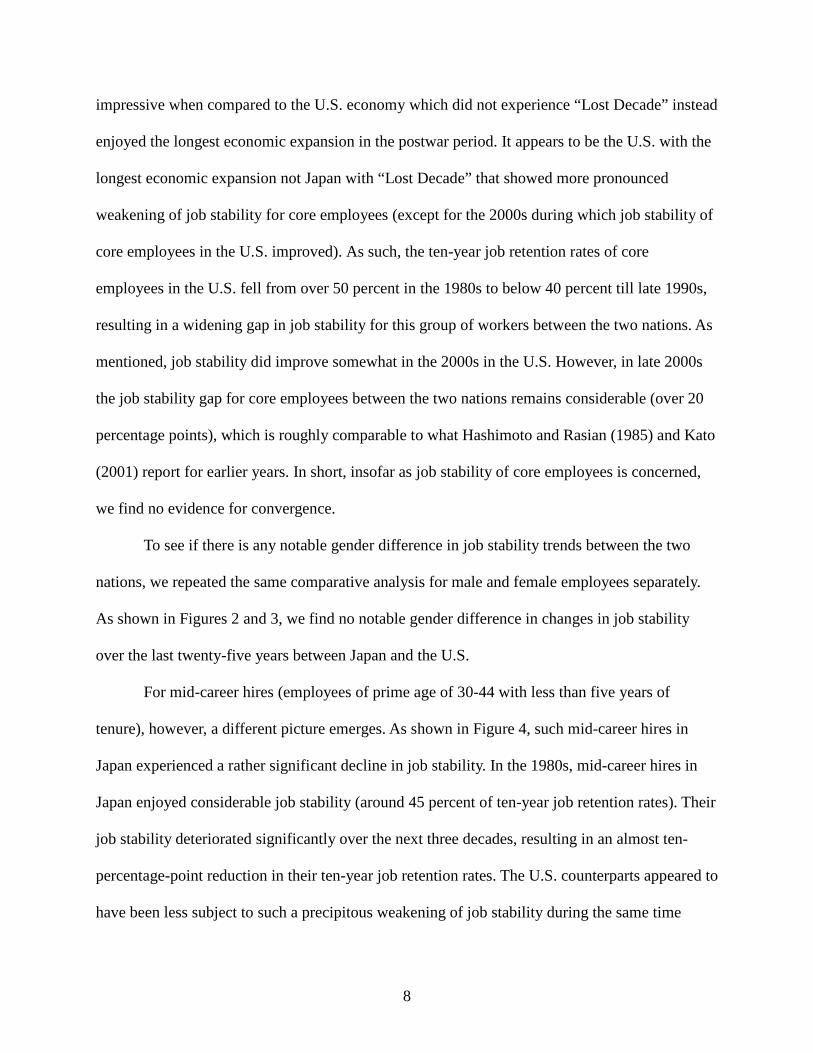
Their study was updated by Kato (2001) to include the first half of Japan’s Lost Decade with a
specific objective to examine the transformation (or lack thereof) of the contrasting prevalence of
long-term employment between the two nations. Recently Farber (2007b) uses aggregate tables
from the ESS from 2002 and earlier years for Japan and CPS Tenure Supplements for the U.S.,
and conducts an intriguing cross-national comparison of the evolution of long-term employment
between Japan and the U.S. with particular focus on the role of unique institutions in labor
adjustments to globalization in recent years.6
We contribute to the literature in three significant ways. Frist, our cross-national analysis
of job retention rates represents the longest and most updated comparison of job retention rates
between Japan and the U.S (1982-2007). In particular, the period under study includes Japan’s
prolonged economic stagnation in recent years and America’s longest economic expansion in
history in which there is little rigorous comparative evidence while there is much popular
rhetoric. Second, our probit analysis of long-run structural changes in job stability (measured by
job separations) in Japan sheds new light on the underlying causes of changes (or lack thereof) in
Japan’s long-term employment system. Third, our cross-national probit analysis of job security
(measured by job losses) in Japan and the U.S. provides new comparative evidence on the nature
and scope of job security in both nations.7
survey and hence not comparable to CPS tenure supplements, they provide information necessary to calculate job retention rates. A few scholars use this alternative establishment-level dataset and draw conclusions that are broadly consistent with those of recent studies using the ESS (Chuma, 1998 and Shimizutani and Yokoyama, 2009). However, Kawaguchi and Ueno (2010) recently conduct a careful study of the two datasets and suggest that the Basic Survey of Wage Structure data may be subject to a nonrandom selection of employees by each responding establishment and thereby lead to an overly optimistic conclusion on the resilience of Japan’s long-term employment system.
6 Interest in studies of the importance of long-term employment in the U.S. was rekindled in late 1990s in light of the rising popular perception of disappearing long-term jobs in the U.S. In response, a number of researchers in the U.S. have been using CPS tenure supplements to address this popular perception (see, for example, Farber, 1998, and Neumark, et. al., 2000).
7 Farber (2009) estimates a similar probit model for the U.S., and we apply a similar specification to our comparative job loss data.

6
We begin by calculating the ten-year job retention rates of Japanese employees in the
private sector, including both regular and non-regular employees (such as fixed-term contract
workers, subcontract temporary workers, part-timers and other contingent workers) for the four
time periods, 1982-1992, 1987-1997, 1992-2002 and 1997-2007. Specifically,
1. we first use the base year ESS (1982, 1987, 1992, and 1997) and calculate the proportion
of civilian noninstitutional population who are employees in each age-tenure category,
say ages 25-29 with 0-4 years of tenure (or the total number of employees ages 25-29
with 0-4 years of tenure), divided by the civilian noninstitutional population in the
corresponding age category or ages 25-29;
2. we then use the ESS ten years later (1992, 1997, 2002, and 2007) and calculate the
proportion of civilian noninstitutional population who are employees in ages 35-39 with
10-14 years of tenure (or the total number of employees ages 35-39 with 10-14 years of
tenure), divided by the civilian noninstitutional population in the corresponding age
category or ages 35-39; and
3. we finally divide the proportion of employees ages 35-39 with 10-14 years of tenure as
derived in the second step by the proportion of employees ages 25-29 with 0-4 years of
tenure as obtained in the first step.
The resulting ratio is the ten-year job retention rate of Japanese employees ages 25-29
with 0-4 years of tenure.8 We then use various CPS Supplements and calculate the comparable
ten-year job retention rates for U.S. employees. We repeat the same analysis for male and female
8 Using the number of employees in each age-tenure category itself instead of using its ratio to the
relevant civilian noninstitutional population results in no discernible change in the ten-year job retention rates, as expected for Japan since immigration and incarceration are far less important in Japan than in other major industrialized economies, such as the U.S. and Germany. These as well as all other unreported results are available upon request from the corresponding author ([email protected]).

7
employees separately.9
The resulting job retention rates are summarized in Tables 1 – 3. To insure meaningful
comparisons of ten-year job retention rates of employees between the two nations, we focus on
three broad categories of workers: (i) “core employees” (employees of prime age of 30-44 who
have already accumulated at least five years of tenure with the present firm); (ii) “mid-career
hires” (employees of prime age of 30-44 with less than five years of tenure); and (iii) “youth
employees” (employees of young age of 20-29 with less than five years of tenure). The proposed
grouping of workers is largely consistent with the literature on long-term employment of
Japanese workers (Hashimoto and Raisian, 1985, Kato, 2001, Ono, 2010 and Kambayashi and
Kato, 2011) . Due to the prevailing practice of mandatory retirement in Japan which was
originally set at 55 and then raised to 60 in the 1990s and 65 in the 2000s, we focus on those who
are below age 45. The ten-year job retention rates of those who are over age 45 will be subjected
to Japan’s prevailing mandatory retirement practice.
To demonstrate the differences in trends of job retention rates between the two nations
over the last twenty-five years more vividly, we further produced Figures 1 – 9 from the tables.
As shown in Figure 1, the ten-year job retention rates of core employees (employees of prime
age of 30-44 who have already accumulated at least five years of tenure) in Japan were
remarkably stable at around 70 percent over the last twenty-five years, and there is little evidence
that Japan’s “Lost Decade’ had a deleterious effect on job stability of such core employees. The
resilience of Japan’s long-term employment practice for core employees is particularly
9 Specifically, we use the following: 1981 Jan. Occupational Mobility and Job Tenure
(ICPSR_08115); 1987 Jan. Occupational Mobility and Job Tenure (ICPSR_08913); 1991 Jan. Job Training (ICPSR_09716); 1996 Feb Displaced Workers (ICPSR_06879); 1997 Feb. Contingent Work (ICPSR_02408); 2001 Feb. Contingent Work (ICPSR_03302); and 2006 Feb. Displaced Workers, Employee Tenure, and Occupational Mobility Supplement (ICPSR_04568). The relatively small sample size of CPS makes further disaggregated analysis (such as job retention rates of male employees with college degrees) somewhat unreliable.
8
impressive when compared to the U.S. economy which did not experience “Lost Decade” instead
enjoyed the longest economic expansion in the postwar period. It appears to be the U.S. with the
longest economic expansion not Japan with “Lost Decade” that showed more pronounced
weakening of job stability for core employees (except for the 2000s during which job stability of
core employees in the U.S. improved). As such, the ten-year job retention rates of core
employees in the U.S. fell from over 50 percent in the 1980s to below 40 percent till late 1990s,
resulting in a widening gap in job stability for this group of workers between the two nations. As
mentioned, job stability did improve somewhat in the 2000s in the U.S. However, in late 2000s
the job stability gap for core employees between the two nations remains considerable (over 20
percentage points), which is roughly comparable to what Hashimoto and Rasian (1985) and Kato
(2001) report for earlier years. In short, insofar as job stability of core employees is concerned,
we find no evidence for convergence.
To see if there is any notable gender difference in job stability trends between the two
nations, we repeated the same comparative analysis for male and female employees separately.
As shown in Figures 2 and 3, we find no notable gender difference in changes in job stability
over the last twenty-five years between Japan and the U.S.
For mid-career hires (employees of prime age of 30-44 with less than five years of
tenure), however, a different picture emerges. As shown in Figure 4, such mid-career hires in
Japan experienced a rather significant decline in job stability. In the 1980s, mid-career hires in
Japan enjoyed considerable job stability (around 45 percent of ten-year job retention rates). Their
job stability deteriorated significantly over the next three decades, resulting in an almost ten-
percentage-point reduction in their ten-year job retention rates. The U.S. counterparts appeared to
have been less subject to such a precipitous weakening of job stability during the same time
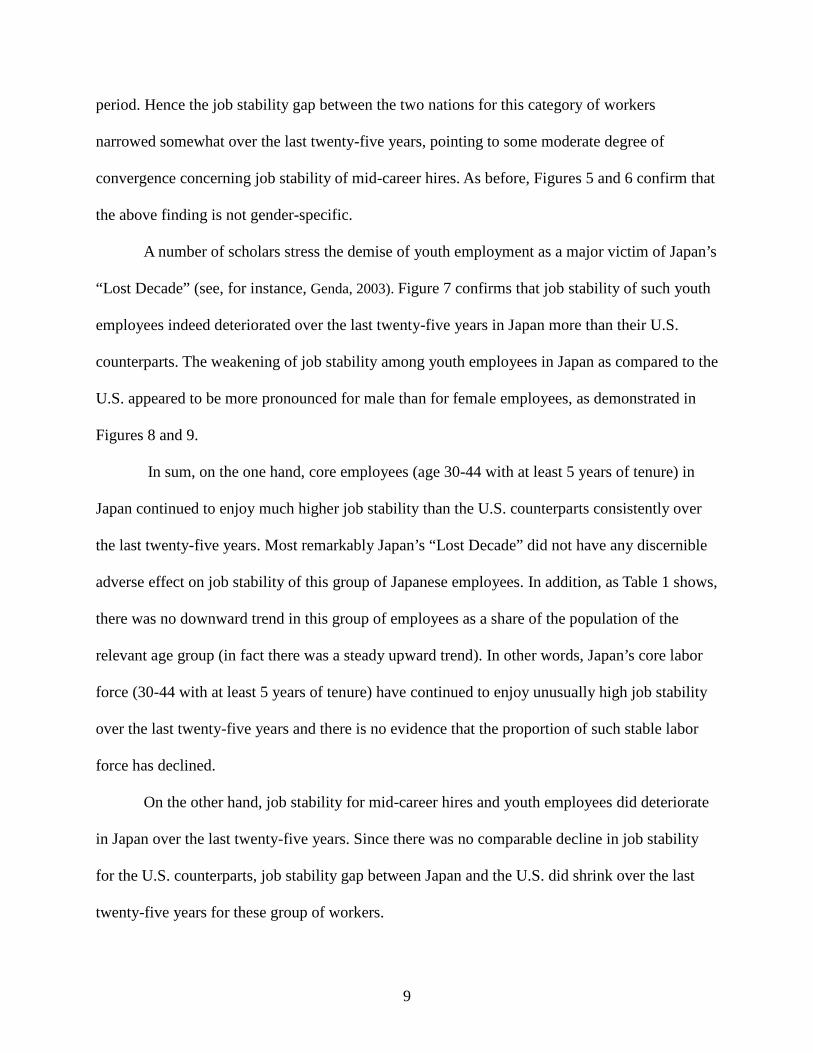
9
period. Hence the job stability gap between the two nations for this category of workers
narrowed somewhat over the last twenty-five years, pointing to some moderate degree of
convergence concerning job stability of mid-career hires. As before, Figures 5 and 6 confirm that
the above finding is not gender-specific.
A number of scholars stress the demise of youth employment as a major victim of Japan’s
“Lost Decade” (see, for instance, Genda, 2003). Figure 7 confirms that job stability of such youth
employees indeed deteriorated over the last twenty-five years in Japan more than their U.S.
counterparts. The weakening of job stability among youth employees in Japan as compared to the
U.S. appeared to be more pronounced for male than for female employees, as demonstrated in
Figures 8 and 9.
In sum, on the one hand, core employees (age 30-44 with at least 5 years of tenure) in
Japan continued to enjoy much higher job stability than the U.S. counterparts consistently over
the last twenty-five years. Most remarkably Japan’s “Lost Decade” did not have any discernible
adverse effect on job stability of this group of Japanese employees. In addition, as Table 1 shows,
there was no downward trend in this group of employees as a share of the population of the
relevant age group (in fact there was a steady upward trend). In other words, Japan’s core labor
force (30-44 with at least 5 years of tenure) have continued to enjoy unusually high job stability
over the last twenty-five years and there is no evidence that the proportion of such stable labor
force has declined.
On the other hand, job stability for mid-career hires and youth employees did deteriorate
in Japan over the last twenty-five years. Since there was no comparable decline in job stability
for the U.S. counterparts, job stability gap between Japan and the U.S. did shrink over the last
twenty-five years for these group of workers.
10
Lastly both academic and popular writings about the Japanese employment system tend
to highlight a notable distinction between regular employment and non-regular employment
(fixed-term contract workers, subcontract temporary workers, part-timers and other contingent
workers) in Japan, and attribute the rising importance of such non-regular employment to the
declining influence of the “lifetime employment” practice in Japan (Rebick, 2005, and Ono,
2010). To see if our key findings on trends in job stability of Japanese employees over the last
twenty-five years remain valid even when we focus only on regular employees, we recalculated
the ten-year job retention rates for Japanese employees by excluding all non-regular
employees.10
Reassuringly we find that our key findings on trends in job stability of Japanese
employees over the last twenty-five years remain valid even when we focus only on regular
employment. In other words, job stability of “regular employees” age 30-44 with at least five
years of tenure in Japan has not declined significantly over the last twenty-five years in general
and during Japan’s “Lost Decade” in particular. Moreover, there was no evidence for the
diminishing size of “regular employment” as a share of the relevant age population for this group
of workers (age 30-44 with at least five years of tenure). As in the case of all employees
including both regular and non-regular employees, job stability of “regular employees” who
10 As discussed in detail in Kambayashi and Kato (2012), there are two ways to define “regular
and non-regular employment” in Japan. First, “regular employees” can be defined as employees with the title of “seishain” and “non-regular employees” as employees without such a title. The second definition focuses on the nature of employment contacts. Specifically “regular employees” are defined as those on indefinite contracts and “non-regular employees” as those on fixed-term contacts (less than one year). The ESS provides data which enable researchers to use both definitions, whereas the Labor Force Survey (an alternative source of data on tenure of Japanese workers) allows for the use of the second definition only.
Kambayashi and Kato (2012) discover that the use of the first definition results in sharper differences in labor market outcomes between “regular” and “non-regular” employment than the use of the second definition. As such, Kambayashi and Kato (2012) conclude that whether an employee is hired as seishain is more consequential than whether an employee is hired on indefinite contract. For this paper, we use the first definition.

11
were mid-career hires (age 30-44 with less than five years of tenure) as well as youth “regular
employees” age 20-29 with less than five years of tenure) has fallen over the last twenty-five
years.11
3. Probit Analysis of Job Separation Rate of Japanese Workers over 1982-2007
To provide further systematic evidence on changes in job stability (or lack thereof), we
estimate a probit model of job separation rates. Fortunately, the ESS provides data on whether an
employee experienced a job separation during the previous year. Job separations include both
voluntary separations (quits) and involuntary separations (job losses) from their firms. We will
analyze such job separations of Japanese employees over the last twenty-five years, using the
ESS (1982, 1987, 1997, 2002, and 2007), and provide another set of evidence on trends in job
stability of Japanese employees.12 An obvious advantage of analyzing job separation rates is our
ability to conduct a multivariate regression analysis of changes in job stability of Japanese
employees and hence provide systematic evidence on specific sources of any changes in job
stability of Japanese employees.13 As we will explain in more detail in the next section, the U.S.
counterparts to the ESS provide data only on job losses (not on voluntary quits), and therefore
our probit analysis of job separation rates is limited to Japan.
As discussed earlier, due to the prevailing practice of mandatory retirement in Japan
which was originally set at 55 (and then raised to 60 in the 1990s and 65 in the 2000s), we focus
on those age 18 to 54. Table 4 presents summary statistics where separation=1 if an employee
11 The size of “regular employment” as a share of the total population did fall significantly since
1997 (especially for male), as reported in Kato and Kambayashi (2011). More detailed analysis of regular and non-regular employment in Japan is presented by Kambayashi and Kato (2012).
12 We focus on employees, and hence self-employed individuals are excluded from the data. Our key results change little even if we include self-employed individuals.
13 We were unable to retrieve micro data on separations reliably from the 1992 ESS, and therefore 1992 data were not included in our analysis.
12
separated voluntarily or involuntarily from her firm during the previous year, zero otherwise;
fixedterm=1 if an individual was on a fixed-term contract (as opposed to an indefinite contract)
during the previous year, zero otherwise;14 female=1 if an employee is female, zero otherwise;
age=years of age; juniorhigh=1 if an employee’s highest educational attainment was junior high
school during the previous year, zero otherwise; highschool=1 if an employee’s highest
educational attainment was high school during the previous year, zero otherwise; juniorcollege=1
if an employee’s highest educational attainment was 2-year junior college during the previous
year, zero otherwise; university=1 if an employee’s highest educational attainment was 4-year
university during the previous year, zero otherwise.
As shown in the table, the average annual separation rate for Japanese employees age 18-
54 for the last twenty five years in Japan rose steadily from 11 percent in 1982 to 14 percent in
2007. Over 10 percent of all employees age 18-54, including both non-separating and separating
employees, were on fixed-term contracts in 1982 and there was no upward trend since then. Note
that when we do not limit our sample to employees age 18-54 and include old employees, we
will observe a sharp rise in the proportion of employees on fixed-term contracts in 2000s. As
such, in Japan, the rising use of fixed-term contracts was mostly a phenomenon limited to older
workers in 2000s. Forty percent were female in 1982 and by 2007, female employees constituted
47 percent of all employees age 18-54. The average age rose from 35 to 38 over the last twenty
14 Unfortunately the labor turnover module of the ESS does not provide data on whether an
employee was a regular employee (seishain) during the previous year (this data limitation was eventually corrected in 1997), and hence we were unable to use a dummy variable indicating whether or not an employee was a regular employee during the previous year. Instead the labor turnover module of the ESS provides data on whether an employee was on a fixed-term contract (less than one year) or on an indefinite contract. As such we include fixedterm as an additional control variable in our regressions. Though not all regular employees are on indefinite contracts and not all non-regular employees are on fixed-term contracts, there is substantial overlap between being a regular employee (seishain) and being on indefinite contracts. See Kambayashi and Kato (2012) for more detailed analysis of the relationship between regular employment and indefinite contracts.
13
five years. The majority of them were high school graduates throughout the last twenty five
years, with a rising trend of educational attainment of Japanese employees over the last twenty
five years.
Table 5 presents the probit estimates of job separation rates in Japan for 1982, 1987, 1997,
2002 and 2007. Nearly all coefficients are estimated precisely, and are of expected signs. Those
on fixed-term contracts, female employees, less educated employees, and young employees are
found to be more likely to separate. There is an upward trend (except for 2002) in the marginal
effects of being on fixed-term contracts, suggesting that jobs for those on fixed-term contracts
has become more volatile over the last twenty five years.
Most importantly for the purpose of our paper, the probability of job separation is found
to be significantly higher for employees with 0-4 years of tenure than employees with 5-9 years
of tenure (omitted reference group) throughout the last twenty five years. To see how the gap in
job stability among employees with different tenure categories has changed over the last twenty
five years, we pooled all five years and re-estimated the probit model of separation rates with
year dummy variables and interaction terms involving tenure variables and year dummy
variables added to the same set of independent variables. We first calculate mean values for all
independent variables, and then for each year evaluate the probability of separation at these mean
values, using the estimated coefficients. The resulting probabilities of separation are the
predicted annual separation rates after controlling for all independent variables. In other words,
changes in the predicted annual separation rates over time capture changes in separation rates
due to changes in the structure of separation process as opposed to changes in separation rates
due to changes in independent variables.
In Figure 10, we depict such predicted separation rates on the vertical axis and tenure on

14
the horizontal axis for each year. The figure shows a downward-sloping “tenure-separation curve”
for each year, confirming that there is relatively greater job stability for core employees with
long tenure than mid-career hires with short tenure in Japan. Over the last twenty five years the
downward-sloping tenure-separation curve appears to have been rotating clockwise while the
predicted separation rate for employees with 15 and more years of tenure remained more or less
the same. The clockwise rotation of the tenure-separation curve was most pronounced in 2007.
The clockwise rotation of the tenure-separation curve over the last twenty five years is consistent
with the main finding from our earlier job retention rate analysis -- jobs for mid-career hires have
become less stable while jobs for core employees have remained stable.
Note that 2002 appears to be an anomaly. Though we do not have any definitive
explanation for the 2002 anomaly, the Japanese economy bottomed out in 2002, and started its
modest economic recovery in 2003. It was the final year of Japan’s “Lost Decade.” At the very
end of Japan’s Lost Decade, the Japanese employment system might have come finally
dangerously close to the breaking point yet fortunately the recovery started in the following year,
and quickly returned to its “safe” zone. We have no direct evidence to support our conjecture yet
according to a survey conducted by Tokyo Shoko Research, the number of firms listed in Japan’s
Stock Exchanges that used “voluntary” retirement programs peaked in 2002, and then fell
significantly in 2003. The conjecture may warrant further investigation in the future.
We repeated the same analysis for men and women separately, and drawn Figures 11 and
12. Largely similar pictures emerged for both genders although the resilience of implicit long-
term employment contracts for the core segment of the Japanese labor market and the weakening
of job stability for the secondary segment (mid-career hires) is more clearly shown for men than
for women.
15
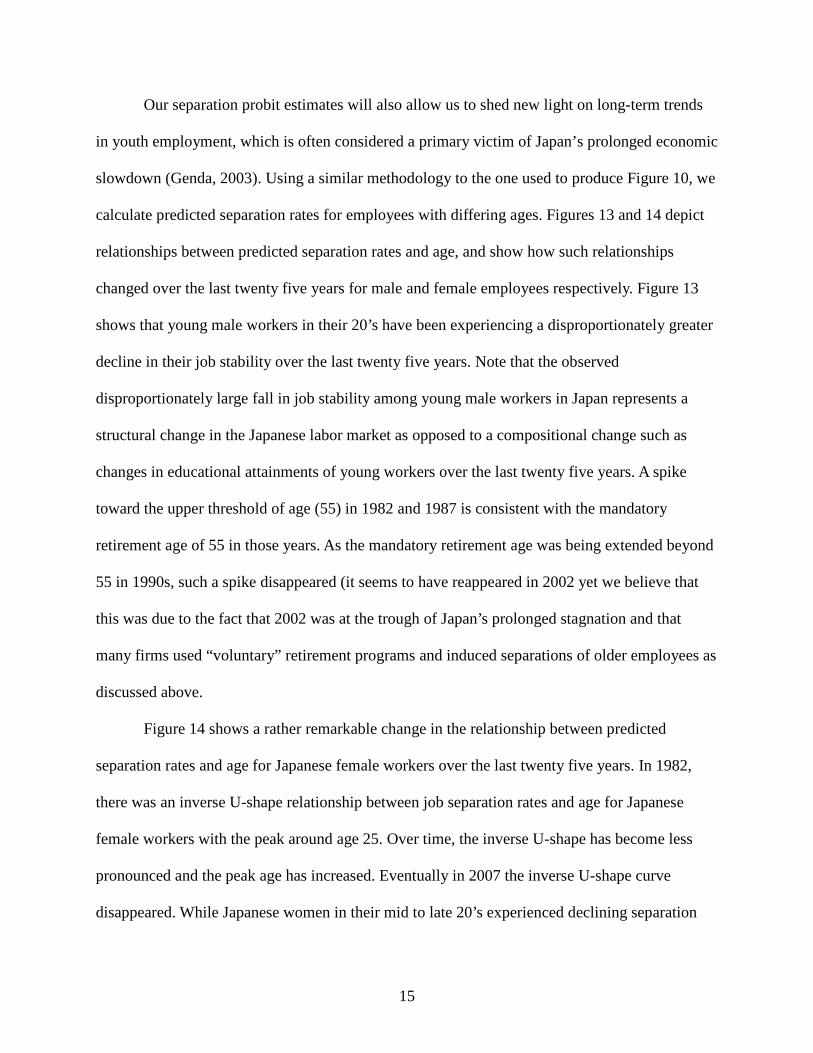
Our separation probit estimates will also allow us to shed new light on long-term trends
in youth employment, which is often considered a primary victim of Japan’s prolonged economic
slowdown (Genda, 2003). Using a similar methodology to the one used to produce Figure 10, we
calculate predicted separation rates for employees with differing ages. Figures 13 and 14 depict
relationships between predicted separation rates and age, and show how such relationships
changed over the last twenty five years for male and female employees respectively. Figure 13
shows that young male workers in their 20’s have been experiencing a disproportionately greater
decline in their job stability over the last twenty five years. Note that the observed
disproportionately large fall in job stability among young male workers in Japan represents a
structural change in the Japanese labor market as opposed to a compositional change such as
changes in educational attainments of young workers over the last twenty five years. A spike
toward the upper threshold of age (55) in 1982 and 1987 is consistent with the mandatory
retirement age of 55 in those years. As the mandatory retirement age was being extended beyond
55 in 1990s, such a spike disappeared (it seems to have reappeared in 2002 yet we believe that
this was due to the fact that 2002 was at the trough of Japan’s prolonged stagnation and that
many firms used “voluntary” retirement programs and induced separations of older employees as
discussed above.
Figure 14 shows a rather remarkable change in the relationship between predicted
separation rates and age for Japanese female workers over the last twenty five years. In 1982,
there was an inverse U-shape relationship between job separation rates and age for Japanese
female workers with the peak around age 25. Over time, the inverse U-shape has become less
pronounced and the peak age has increased. Eventually in 2007 the inverse U-shape curve
disappeared. While Japanese women in their mid to late 20’s experienced declining separation
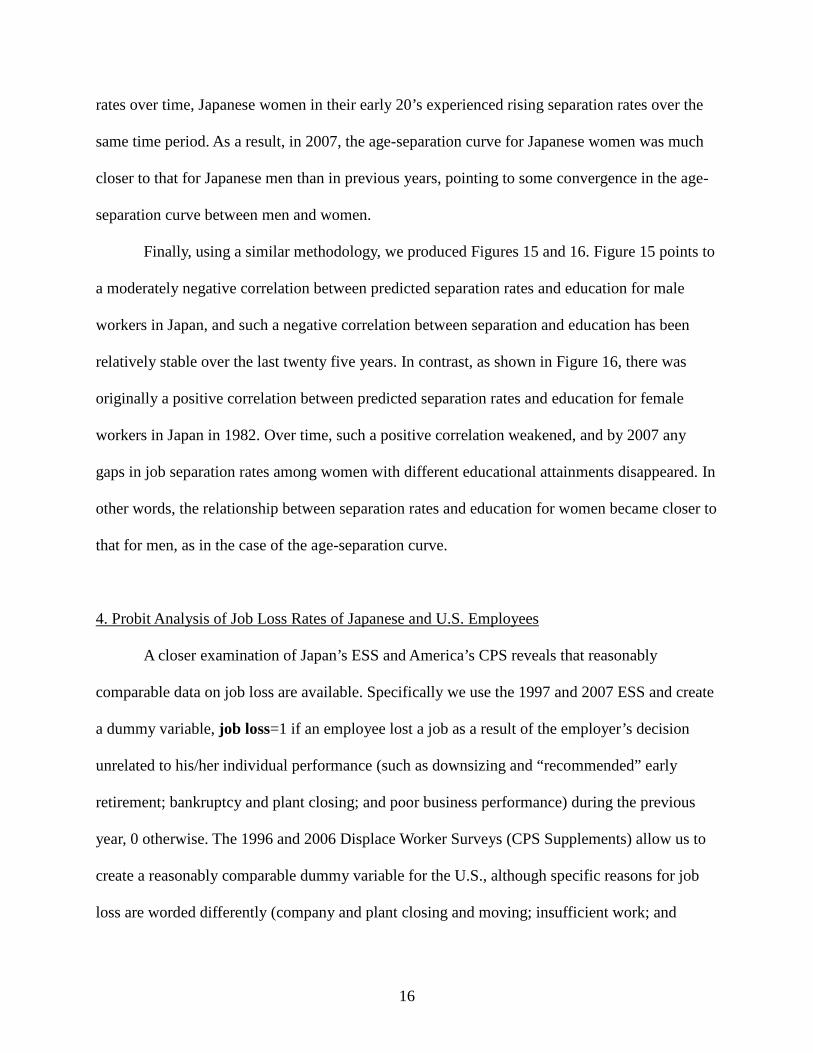
16
rates over time, Japanese women in their early 20’s experienced rising separation rates over the
same time period. As a result, in 2007, the age-separation curve for Japanese women was much
closer to that for Japanese men than in previous years, pointing to some convergence in the age-
separation curve between men and women.
Finally, using a similar methodology, we produced Figures 15 and 16. Figure 15 points to
a moderately negative correlation between predicted separation rates and education for male
workers in Japan, and such a negative correlation between separation and education has been
relatively stable over the last twenty five years. In contrast, as shown in Figure 16, there was
originally a positive correlation between predicted separation rates and education for female
workers in Japan in 1982. Over time, such a positive correlation weakened, and by 2007 any
gaps in job separation rates among women with different educational attainments disappeared. In
other words, the relationship between separation rates and education for women became closer to
that for men, as in the case of the age-separation curve.
4. Probit Analysis of Job Loss Rates of Japanese and U.S. Employees
A closer examination of Japan’s ESS and America’s CPS reveals that reasonably
comparable data on job loss are available. Specifically we use the 1997 and 2007 ESS and create
a dummy variable, job loss=1 if an employee lost a job as a result of the employer’s decision
unrelated to his/her individual performance (such as downsizing and “recommended” early
retirement; bankruptcy and plant closing; and poor business performance) during the previous
year, 0 otherwise. The 1996 and 2006 Displace Worker Surveys (CPS Supplements) allow us to
create a reasonably comparable dummy variable for the U.S., although specific reasons for job
loss are worded differently (company and plant closing and moving; insufficient work; and

17
position or shift abolished in the U.S.) As such, as in the case of most cross-national studies, the
results ought to be interpreted with caution.
We focus on employees age 20-54 in the private sector so that we can avoid further
complications caused by an important institutional difference between the two nations regarding
mandatory retirement as well as legal and regulatory differences between the two countries
surrounding public sector employment. We use age 20 as the lower threshold, following the
convention of prior empirical studies on job loss probability (such as Farber, 2009). We
experimented with different age threshold levels and found no discernible difference in the
results. In addition, we considered three-year odds of job loss instead of one-year odds of job
loss as done in Farber (2009). Again reassuringly we found little change in our key findings
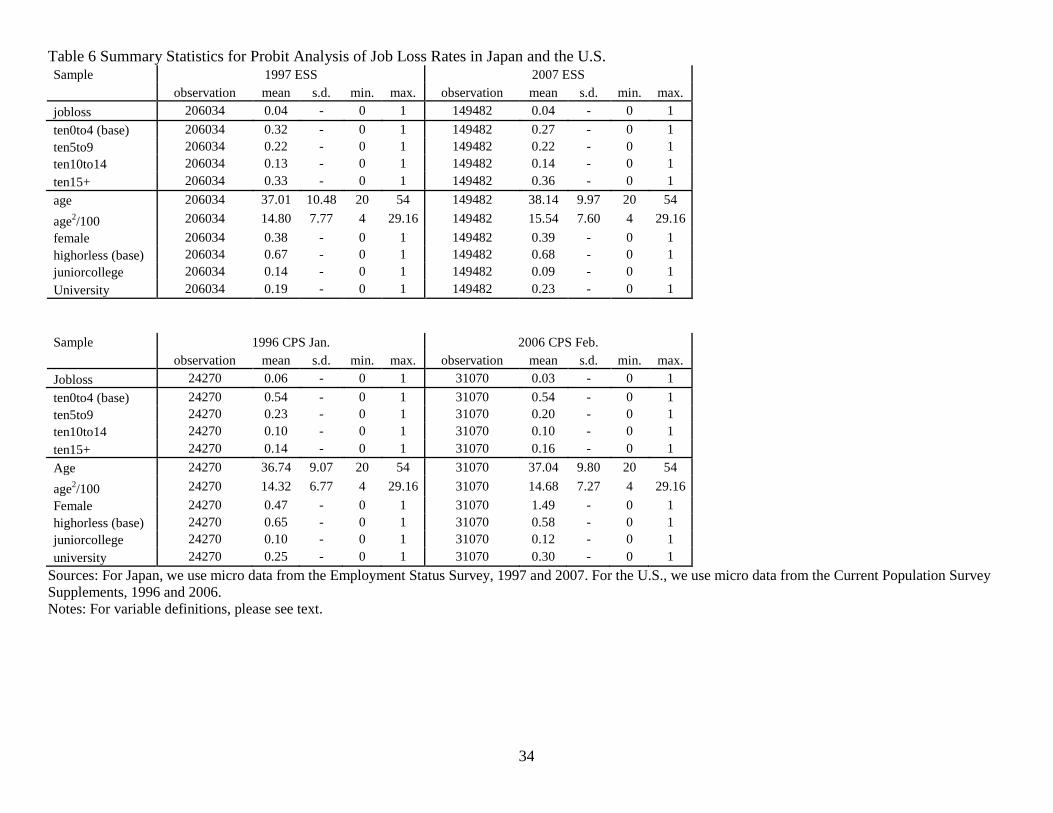
Table 6 presents summary statistics. Note that we create a new educational attainment
variable, highorless=1 if an employee’s highest educational attainment was high school or less
during the previous year, zero otherwise, for in the context of the U.S. schooling system, it does
not make sense to use two separate educational attainment variables, juniorhigh and highschool,
which we used for our analysis of Japanese employee separation data in the previous section.
Annual job loss rate for employees age 20-54 in the private sector in Japan in the midst of
her “Lost Decade” was 4 percent. The comparable U.S. job loss rate in 1996 was actually higher
(6 percent). Table 6 further reveals that annual job loss rate in Japan was still 4 percent in 2007
and that the U.S. job loss rate came down to the 3 percent level by 2006. Not surprisingly there
were relatively more employees with short tenure in the U.S. than in Japan in spite that average
age was comparable between the two nations (35 to 36). Educational attainment of employees
age 20-54 was moderately higher in the U.S. than in Japan.
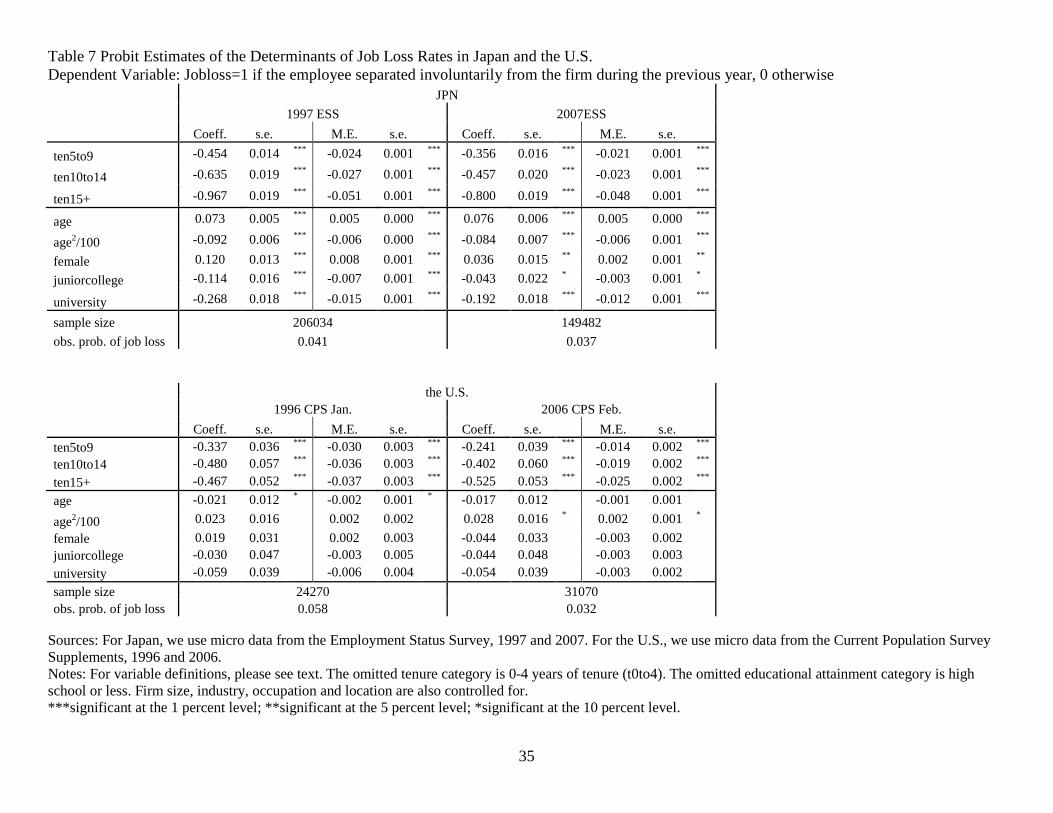
Table 7 summarizes the probit estimates of job loss rates in Japan and the U.S. The

18
results were qualitatively similar between the two nations: (i) job loss probability was lower for
employees with longer tenure; (ii) female employees face higher job loss probability; and (iii)
more educated employees enjoy lower job loss probability. Note that the estimated coefficients
are more precisely estimated for the Japanese sample than for the U.S. sample. One intriguing
contrast between the two nations is the relationship between job loss probability and age. Job
loss probability will increase significantly with age in Japan, whereas the reverse is true for the
U.S. though not very significant. The observed contrast in the age-job loss link between the two
nations is consistent with the “two-tier” employment system in Japan consisting of “home-grown
(haenuki)” employees (hired immediately upon graduation and climbing up internal promotion
ladders) and mid-career hires “chutosaiyou” (hired after some work experience at other firms).
Home-grown employees enjoy well-known Japanese employment practices characterized by
“lifetime employment” (strong job security); various mechanisms to enhance employee
involvement and voice; elaborate pay systems including employee ownership and profit sharing;
extensive training; and corporate welfare programs. Mid-career hires have only limited access to
such practices, including “lifetime employment” (see, for instance, Kato, 2003 and Kambayashi
and Kato, 2011). Once tenure is controlled for, older workers are more likely than younger
workers to be mid-career hires, and thereby face weaker job security in Japan.
Comparing the estimated marginal effects of tenure variables between 1997 and 2007 in
Japan, we find that there was no significant deterioration of job security for employees with long
tenure relative to employees with short tenure (less than five years) from 1997 to 2007. In
contrast, in the U.S., relative job security of employees with long tenure fell considerably from
1996 to 2006. To further explore the relative job security of core employees with five or more
years of tenure to employees with shorter tenure in the two nations, we produced Figures 17-19,
19
following a similar methodology used to create similar figures from our earlier probit analysis of
job separation rates of Japanese employees. Figure 17 confirms that the relative job security of
core employees in Japan to mid-career hires did not fall noticeably from 1997 to 2007, while the
relative job security of such employees in the U.S. declines over the comparable time period
(1996-2006). Note however that the declining relative job security of core employees in the U.S.
appeared to be due to a considerable improvement in job security of employees with short tenure
(less than 5 years). Figures 18 and 19 were drawn for men and women separately, and confirm
that the enduring job security of core employees in Japan and the relative decline in job security
of such workers in the U.S. hold for both men and women.
5. Conclusions
Taking advantage of a recent relaxation of Japanese government’s data release policy, we
have conducted a cross-national analysis of micro data from Japan’s Employment Status Survey
and its U.S. counterpart, Current Population Survey, with particular focus on changes in long-
term employment and job security over the last twenty five years. We have found that in spite of
the prolonged economic stagnation, the ten-year job retention rates of core employees in Japan
were remarkably stable at around 70 percent over the last twenty-five years, and there is little
evidence that Japan’s Great Recession (popularly called “Lost Decade”) had a deleterious effect
on job stability of such core employees. In contrast, notwithstanding the longest economic
expansion in history, the comparable job retention rates for core employees in the U.S. actually
fell from over 50 percent to below 40 percent. The probit estimates of job loss models in the two
nations also point to the resilience of job security of such core employees in Japan, whereas
showing a relative decline in job security of such employees in the U.S. As such, insofar as a

20
significant gap in job stability of core employees between Japan and the U.S. (one of the defining
differences between the Japanese and U.S. labor markets), we find no evidence for convergence
over the last twenty five years.
Though core employees in Japan weathered their Great Recession rather well, we did find
that mid-career hires as opposed to new graduate hires as well as young new entrants
experienced deteriorating job stability and declining job security during Japan’s prolonged
economic stagnation, following the burst of the financial bubble at the end of 1980s.
To further shed light on the resilience of the long-term employment system as applied to
the core segment of the Japanese labor market and the contrasting vulnerability of employment
of the other segments of the Japanese labor market, we have carried out a probit analysis of job
separation rates of Japanese employees over the last twenty five years. First, we have confirmed
that even after controlling for a variety of individual and firm characteristics, core employees
with long tenure are indeed much less likely to separate either voluntarily or involuntarily from
their firms, and that such strong employer-employee attachments for core employees remained
intact in Japan over the last twenty five years, notwithstanding Japan’s recent prolonged
economic stagnation. Second, we have found evidence for a structural change in the Japanese
labor market (as opposed to a compositional change). For men, the age-separation curve with the
predicted separation probabilities on the vertical axis and age on the horizontal axis rotated
clockwise sharply over the last twenty five years, making youth employment relatively more
unstable and older employees relatively more stable. For women, the age-separation curve was
initially an inverse U-shape with a peak at age 25. Over time it flattened and eventually the
inverse U-shape age-separation curve disappeared. In the meantime, predicted separation rates
rose considerably for younger women in their early 20’s. In the end, the distinct gender

21
difference in the age-separation curve dissipated over the last twenty five years, making youth
employment for both men and women relatively less stable.
The historical deterioration of long-term employment and job security in the U.S. has
been reported by Farber (2007a). Farber (2007a), however, concludes that the reasons for such a
historical decline in long-term employment and job security in the U.S. have not been fully
understood. Intensified global competition and rising uncertainty in product markets might have
been necessitating U.S. employers to enhance flexibility by replacing long-term jobs with
temporary jobs (Farber, 2007b).
The observed resilience of Japan’s long-term employment for its core employees during
her Great Recession supports economic theorists who stress the importance of institutional
complementarity. Specifically, the Japanese employment system consists of clusters of practices
that are often distinct from the traditional Anglo-American model of flexible labor market and
hierarchical labor-management relations that are apt to be adversarial. A variety of specific
employment practices have been considered key elements of the Japanese employment system.
The following practices are often said to constitute a coherent set of elements of the Japanese
employment system.
1. the practice of “lifetime employment” (or implicit long-term employment guarantees for
the regular workforce) and the reward system which fosters lifetime employment (e.g.,
seniority wage system in which wage is detached from specific job and seniority plays a
significant role in wage determination).15
15 The term “lifetime” is somewhat of a misnomer since except for executives, Japanese workers
have been typically subject to mandatory retirement that occurs around age 60. A precise definition of the practice of lifetime employment is therefore implicit long-term employment contract that ends at mandatory retirement for the regular workforce. In addition, the practice of “lifetime employment” does not necessarily mean that layoffs never happen in large Japanese firms. It has been documented that Japanese firms, even large ones, did lay off some of their regular employees, following the first oil crisis

22
2. Employee involvement and problem solving activities at the grass roots level intended to
provide workers with opportunities to exert discretionary effort, acquire useful local
knowledge, and share it with their co-workers, and higher-level engineers and managers.
They include Shopfloor Committees (SFCs); and various Small Group Activities, such as
QC circles; Zero Defect; Kaizen; and cross-functional problem solving teams.
3. Incentive schemes, such as employee ownership and profit sharing, which align the
interest between workers and the firm, and hence reward them for their wholehearted
participation in such employee involvement programs.
4. Extensive information sharing mechanisms (often called Joint Labor-Management
Committees, JLMCs) involving cooperative enterprise unions to minimize information
asymmetry and facilitate the alignment of interest between labor and management.
5. Careful screening and extensive training aimed at increasing worker ability to effectively
participate in employee involvement/problem solving activities and information sharing
meetings.16
The Japanese employment system developed over time during the postwar era and was
well-established and deep-rooted in the Japanese society by the end of the high growth period. It
probably contributed significantly to the rise of the Japanese economy, and is often considered a
significant example of a system with powerful institutional complementarity (Aoki, 1990, Koike,
2005, Morita, 2005).
An important consequence of such institutional complementarity is its resilience.
Instinctive and hasty changes even in one element of the Japanese employment system may
cause the whole system to halt due to the intricate complementary interplay between the (see, for example, Koike, 2005, Suruga, 1998, Nakata, 2003, Chuma, 2002).
16 Scholars somewhat differ in the relative importance of each practice (see for example, Koike, 2005, Aoki, 2000, Itoh, 1994, Morita, 2001; 2005, Moriguchi and Ono, 2004 and Rebick, 2005).

23
changing element and the remaining elements of the system. For example, a rushed decision to
break implicit long-term employment contracts and terminate some of their “lifetime
employment” core employees will undermine incentive for the remaining core employees to
continue to invest in firm-specific human capital, and produce and share with their coworkers
and supervisors valuable firm-specific local knowledge. In addition, once the firm reneges on
their implicit long-term employment contracts, its labor market reputation may be damaged
permanent, resulting in a higher cost of future recruitment of high-ability workers.
How did the Japanese economy weather the prolonged economic stagnation without
breaking down its implicit long-term employment contract system? First and perhaps most
importantly, the Japanese employment system has a built-in shock absorber, or a group of
Japanese workers who are not covered by the aforementioned practices of the Japanese
employment system and hence do not enjoy long-term employment, employee participation
(both financial and non-financial), and extensive on-the-job training. Such workers constitute the
secondary segment of the Japanese labor market, and often function as a shock absorber in
economic downturns by being the first to be let go Such secondary segment workers are said to
be paid lower wages, enjoy less generous benefit, less control over their work, and weaker job
security than those primary workers covered by the Japanese employment system (see for
instance Koike, 2005, Rebick, 2005, Kambayashi and Kato, 2012).
In addition to the aforementioned two-tier structure as a built-in shock absorber, the
following two factors might have helped Japanese firms preserve its implicit long-term
employment contracts for the most part during her Great Recession. First, according to OECD
data, the average number of hours worked declined considerably during Japan’s Great Recession
from over 2100 hours per year to below 1800 hours per year. In fact, by 1999, the average
24
number of hours worked for U.S. workers became greater than for Japanese workers. Currently it
is U.S. workers not Japanese workers who probably deserve the “workaholic” label. Japan’s
public policy has been also strongly supportive of hours adjustment (e.g., Japan’s short-time
work take up rate is one of the highest among OECD countries according to a recent study by
Hijzen and Venn, 2011). Second, the real hourly earnings of Japanese workers significant
decelerated when Japan’s Great Recession began and by 1998, the level of real hourly earnings
actually started to fall, and has been falling since then. While the Japanese real hourly earnings
have been falling, the real hourly earnings of U.S. workers have been rising.
Following the financial meltdown in the fall of 2008, the U.S. economy and many other
major advanced market economies have been experiencing their own Great Recessions and it is
plausible that the current global Great Recession may turn out to be almost as long-lasting as
Japan’s Great Recession of the 1990s. On the one hand, our finding of the resilience of the
Japanese employment system during her Great Recession of the 1990s points to the importance
of institutional complementarity and the significant cost of drastic and rapid changes in labor
market institutions. On the other hand, the presence of the two-tier structure of the Japanese
employment system as a built-in shock absorber suggests that the long-term employment effect
of Japan’s Great Recession of the 1990s was the further polarization of the labor market. The
core segment of the labor market weathered the Great Recession rather well, continuing to enjoy
strong job security, while the secondary segment of the labor market experienced significant loss
in job security (mid-career hires and youth).
In sum, for policy makers around the world who are trying to develop effective public
policy responses to their Great Recessions, this paper’s findings point to the importance of
recognizing institutional complementarity and potentially high cost of drastic changes as well as

25
the possibility of heterogeneous long-term employment effects of the Great Recession for
different segments of the labor force.

26
References
Aoki, Masahiko. Information, Corporate Governance, and Institutional Diversity: Competitiveness in Japan, the USA, and the Transitional Economies. Oxford and New York: Oxford University Press, 2000.
____. "Toward an Economic Model of the Japanese Firm." Journal of Economic Literature, 1990, 28(1), pp. 1-27.
Boyer, George R. "Converging Divergences: Worldwide Changes in Employment Systems, by Harry C. Katz and Owen Darbishire: Editor's Introduction [Review Symposium]." Industrial and Labor Relations Review, 2001, 54(3), pp. 681-82.
Chuma, Hiroyuki. "Employment Adjustments in Japanese Firms During the Current Crisis." Industrial Relations, 2002, 41(4), pp. 653-82.
____. "Is Japan's Long-Term Employment System Changing?," T. Tachibanaki and I. Ohashi, Internal Labour Markets, Incentives and Employment. New York, London: St. Martin's Press/Macmillan Press, 1998, 225-68.
Farber, Henry. "Are Lifetime Jobs Disappearing? Job Duration in the United States, 1973-1993," Labor statistics measurement issues. Chicago and London: University of Chicago Press, 1998, 157-203.
____. "Is the Company Man an Anachronism? Trends in Long-Term Employment in the United States, 1973 to 2006," S. Danziger and C. E. Rouse, The Price of Independence: The Economics of Early Adulthood. New York: Russell Sage Foundation, 2007a, 56-83.
____. "Job Loss and the Decline in Job Security in the United States," Princeton University, Department of Economics, Industrial Relations Section., Working Papers: 1041, 2009.
____. "Labor Market Adjustment to Globalization: Long-Term Employment in the United States and Japan," Paper presented by the Trans Pacific Labor Seminar. Santa Barbara, CA, 2007b.
Freeman, Richard B. "Labor Market Institutions around the World," National Bureau of Economic Research, Inc, NBER Working Papers: 13242, 2007.
Genda, Yuji. "Who Really Lost Jobs in Japan? Youth Employment in an Aging Japanese Society," S. Ogura, T. Tachibanaki and D. A. Wise, Labor Markets and Firm Benefit Policies in Japan and the United States. Chicago and London: University of Chicago Press, 2003, 103-33.
Hamada, Koichi; Kashyap, Anil and Weinstein, David eds. Japan’s Bubble, Deflation, and Stagnation. Cambridge, MA: MIT Press, 2011.
Hashimoto, Masanori and Raisian, John. "Employment Tenure and Earnings Profiles in Japan and the United States." American Economic Review, 1985, 75(4), pp. 721-35.
Hijzen, A. and D. Venn "The Role of Short-Time Work Schemes During the 2008-09 Recession," OECD Social, Employment and Migration Working Papers, 2011.
Hoshi, Takeo and Kashyap, Anil K. "Will the U.S. Bank Recapitalization Succeed? Eight Lessons from Japan." Journal of Financial Economics, 2010, 97(3), pp. 398-417.
Ichniowski, Casey and Shaw, Kathryn L. "Insider Econometrics: Empirical Studies of How Management Matters," National Bureau of Economic Research, Inc, NBER Working Papers: 15618, 2009.
Itoh, Hideshi. "Japanese Human Resource Management from the Viewpoint of Incentive Theory," M. Aoki and R. Dore, The Japanese Firm: The Sources of Competitive Strength. Oxford and New York: Oxford University Press, 1994, 233-64.

27
Jacoby, Sanford M.; Nason, Emily M. and Saguchi, Kazuro. "The Role of the Senior Hr Executive in Japan and the United States: Employment Relations, Corporate Governance, and Values." Industrial Relations, 2005, 44(2), pp. 207-41.
Jones, Derek C. and Kato, Takao. "The Productivity Effects of Employee Stock-Ownership Plans and Bonuses: Evidence from Japanese Panel Data." American Economic Review, 1995, 85(3), pp. 391-414.
Kambayashi, Ryo and Kato, Takao. "Good Jobs, Bad Jobs, and the Great Recession: Lessons from Japan," IZA discussion paper (forthcoming), 2012.
____. "The Japanese Employment System after the Bubble Burst: New Evidence," K. Hamada, A. Kashyap and D. Weinstein, Japan’s Bubble, Deflation, and Stagnation Cambridge, MA: MIT Press, 2011, 217-62.
Kato, Takao. "The End of Lifetime Employment in Japan? Evidence from National Surveys and Field Research." Journal of the Japanese and International Economies, 2001, 15(4), pp. 489-514.
____. "The Recent Transformation of Participatory Employment Practices," S. Ogura, T. Tachibanaki and D. Wise, Nber Conference Report Labor Markets and Firm Benefit Policies in Japan and the United States. Chicago: University of Chicago Press, 2003, 39-80.
Kato, Takao and Morishima, Motohiro. "The Productivity Effects of Participatory Employment Practices: Evidence from New Japanese Panel Data." Industrial Relations, 2002, 41(4), pp. 487-520.
Katz, H. C. and Darbishire, O. Converging Divergences: Worldwide Changes in Employment Systems. Ithaca, New York: Cornell University Press, 2000.
Kawaguchi, Daiji and Ueno, Yuko. "Trends of Job Stability in Japan," Paper presented by the Trans Pacific Labor Seminar. Santa Barbara, CA, 2010.
Koike, Kazuo. Shigoto No Keizaigaku (Economics of Work). Tokyo: Toyo Keizai, 2005. Koo, Richard. The Holy Grail of Macroeconomics: Lessons from Japan's Great Recession.
Wiley, 2009. Milgrom, Paul and Roberts, John. "Complementarities and Systems: Understanding Japanese
Economic Organization." Estudios Economicos, 1994, 9(1), pp. 3-42. Moriguchi, Chiaki and Ono, Hiroshi. "Japanese Lifetime Employment: A Century's
Perspective," EIJS Working Paper Series No. 205, 2004. Morita, Hodaka. "Choice of Technology and Labour Market Consequences: An Explanation of
U.S.-Japanese Differences." Economic Journal, 2001, 111(468), pp. 29-50. ____. "Multi-Skilling, Delegation and Continuous Process Improvement: A Comparative
Analysis of Us-Japanese Work Organizations." Economica, 2005, 72(285), pp. 69-93. Nakata, Yoshifumi and Takehiro, Ryoji. "Total Labor Costs and the Employment Adjustment
Behavior of Large Japanese Firms," S. Ogura, T. Tachibanaki and D. A. Wise, Labor Markets and Firm Benefit Policies in Japan and the United States. Chicago and London: NBER Conference Report series; University of Chicago Press, 2003, 135-55.
Neumark, David, ed. On the Job: Is Long-Term Employment a Thing of the Past? New York: Russell Sage Foundation, 2000.
Ohkusa, Yasushi and Ohtake, Fumio. "The Productivity Effects of Information Sharing, Profit Sharing, and Esops." Journal of the Japanese and International Economies, 1997, 11(3), pp. 385-402.

28
Ono, Hiroshi. "Lifetime Employment in Japan: Concepts and Measurements." Journal of the Japanese and International Economies, 2010, 24(1), pp. 1-27.
Ono, Hiroshi and Rebick, Marcus E. "Constraints on the Level and Efficient Use of Labor," M. Blomstrom, J. Corbett, F. Hayashi and A. Kashyap, Structural Impediments to Growth in Japan. Chicago and London: NBER Conference Report series. University of Chicago Press, 2003, 225-57.
Rebick, Marcus. The Japanese Employment System: Adapting to a New Economic Environment. Oxford and New York: Oxford University Press, 2005.
Sako, Mari. "Does Embeddedness Imply Limits to within-Country Diversity?" British Journal of Industrial Relations, 2005, 43(4), pp. 585-92.
Shimizutani, Satoshi and Yokoyama, Izumi. "Has Japan's Long-Term Employment Practice Survived? Developments since the 1990s." Industrial and Labor Relations Review, 2009, 62(3), pp. 313-26.
Suruga, Terukazu. "Employment Adjustment in Japanese Firms: Negative Profits and Dismissals," O. Isao and T. Tachibanaki, Internal Labour Markets, Incentives and Employment,. New York: St. Martin's Press, 1998, 196-221.

29
Table 1 Ten-year Job Retention Rates over the Last twenty-five years: All Employees
Percent of Population
1982 (1981)
10-year job retention rate
1982-1992 (1981-1991)
percent of population
1987
10-year job retention rate
1987-1997
percent of population
1992 (1991)
10-year job retention rate
1992-2002 (1991-2001)
percent of population
1997 (1996)
10-year job retention rate
1997-2007 (1996-2006)
Nation Age Tenure
Core
Japan 30-34 5+ 36.97 74.4 39.13 72.5 40.29 67.3 42.60 70.1 U.S. 30-34 5+ 16.01 53.0 20.66 43.1 18.92 34.5 19.12 37.4 Japan 35-39 5+ 38.44 77.4 39.71 76.9 41.45 71.1 44.33 74.4 U.S. 35-39 5+ 20.15 56.6 24.21 50.5 23.64 36.6 23.99 44.6 Japan 40-44 5+ 40.06 75.7 42.13 74.2 42.83 67.4 46.11 71.6 U.S. 40-44 5+ 23.41 55.2 26.49 48.7 24.64 38.5 26.19 47.4
Mid-career hires
Japan 30-34 0-4 15.47 43.8 16.72 43.2 20.16 41.6 20.35 33.9 U.S. 30-34 0-4 38.15 18.7 36.90 18.8 34.91 14.5 35.92 18.0 Japan 35-39 0-4 14.81 45.0 16.27 42.3 18.58 39.2 18.32 35.0 U.S. 35-39 0-4 31.11 19.2 27.71 20.8 27.22 18.2 28.75 20.6 Japan 40-44 0-4 13.47 47.6 15.04 45.0 17.00 40.4 16.74 37.1 U.S. 40-44 0-4 26.43 24.6 24.07 25.2 22.71 18.9 22.98 25.0
Youth
Japan 20-24 0-4 53.26 36.5 56.08 34.3 60.67 32.1 58.23 29.5 U.S. 20-24 0-4 42.98 13.9 42.92 11.8 37.75 9.0 38.18 8.6 Japan 25-29 0-4 27.40 47.3 30.21 47.0 36.72 44.8 35.54 38.3 U.S. 25-29 0-4 48.57 16.1 48.85 15.3 44.54 12.0 46.05 13.2
Sources: For Japan, we use micro data from the Employment Status Survey, 1982, 1987, 1992, 1997, 2002, and 2007. For the U.S., we use micro data from the Current Population Survey Supplements, 1981, 1987, 1991, 1996, 2001, and 2006. Notes: For the definition of ten-year job retention rates, see text. To focus on the private sector, government employees are excluded.
30
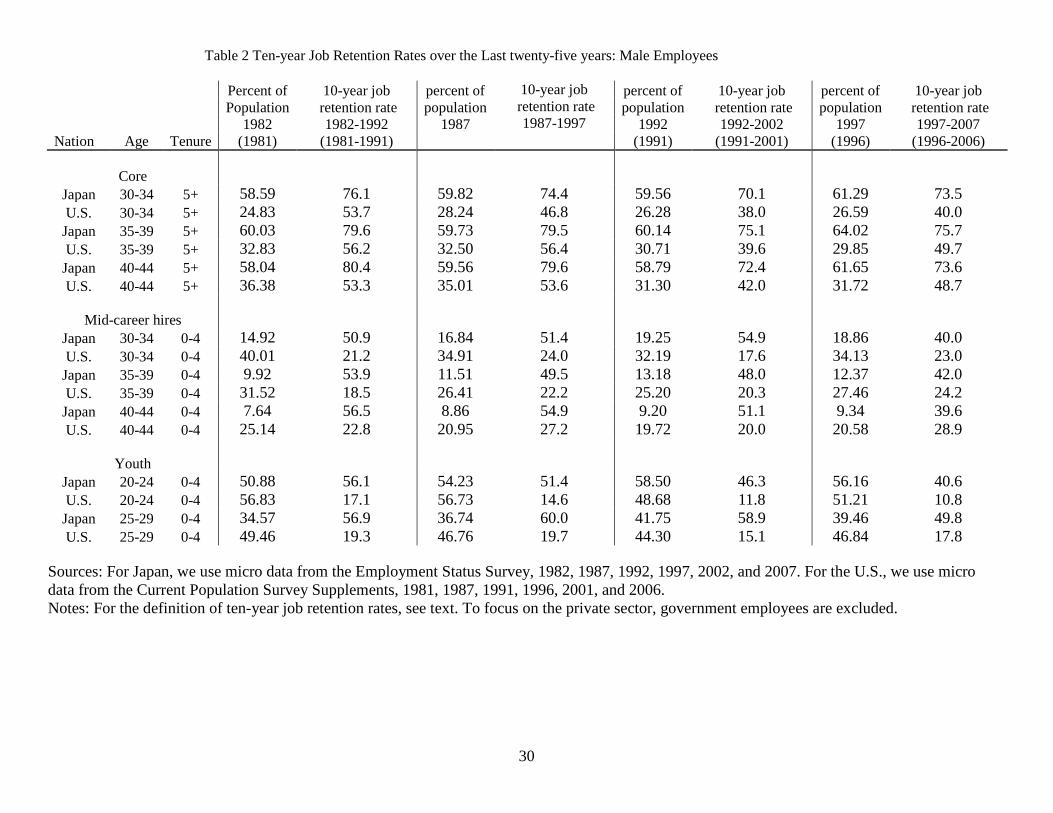
Table 2 Ten-year Job Retention Rates over the Last twenty-five years: Male Employees
Percent of Population
1982 (1981)
10-year job retention rate
1982-1992 (1981-1991)
percent of population
1987
10-year job retention rate
1987-1997
percent of population
1992 (1991)
10-year job retention rate
1992-2002 (1991-2001)
percent of population
1997 (1996)
10-year job retention rate
1997-2007 (1996-2006)
Nation Age Tenure
Core
Japan 30-34 5+ 58.59 76.1 59.82 74.4 59.56 70.1 61.29 73.5 U.S. 30-34 5+ 24.83 53.7 28.24 46.8 26.28 38.0 26.59 40.0 Japan 35-39 5+ 60.03 79.6 59.73 79.5 60.14 75.1 64.02 75.7 U.S. 35-39 5+ 32.83 56.2 32.50 56.4 30.71 39.6 29.85 49.7 Japan 40-44 5+ 58.04 80.4 59.56 79.6 58.79 72.4 61.65 73.6 U.S. 40-44 5+ 36.38 53.3 35.01 53.6 31.30 42.0 31.72 48.7
Mid-career hires
Japan 30-34 0-4 14.92 50.9 16.84 51.4 19.25 54.9 18.86 40.0 U.S. 30-34 0-4 40.01 21.2 34.91 24.0 32.19 17.6 34.13 23.0 Japan 35-39 0-4 9.92 53.9 11.51 49.5 13.18 48.0 12.37 42.0 U.S. 35-39 0-4 31.52 18.5 26.41 22.2 25.20 20.3 27.46 24.2 Japan 40-44 0-4 7.64 56.5 8.86 54.9 9.20 51.1 9.34 39.6 U.S. 40-44 0-4 25.14 22.8 20.95 27.2 19.72 20.0 20.58 28.9
Youth
Japan 20-24 0-4 50.88 56.1 54.23 51.4 58.50 46.3 56.16 40.6 U.S. 20-24 0-4 56.83 17.1 56.73 14.6 48.68 11.8 51.21 10.8 Japan 25-29 0-4 34.57 56.9 36.74 60.0 41.75 58.9 39.46 49.8 U.S. 25-29 0-4 49.46 19.3 46.76 19.7 44.30 15.1 46.84 17.8
Sources: For Japan, we use micro data from the Employment Status Survey, 1982, 1987, 1992, 1997, 2002, and 2007. For the U.S., we use micro data from the Current Population Survey Supplements, 1981, 1987, 1991, 1996, 2001, and 2006. Notes: For the definition of ten-year job retention rates, see text. To focus on the private sector, government employees are excluded.

31
Table 3 Ten-year Job Retention Rates over the Last twenty-five years: Female Employees
Percent of Population
1982 (1981)
10-year job retention rate
1982-1992 (1981-1991)
percent of population
1987
10-year job retention rate
1987-1997
percent of population
1992 (1991)
10-year job retention rate
1992-2002 (1991-2001)
percent of population
1997 (1996)
10-year job retention rate
1997-2007 (1996-2006)
Nation Age Tenure
Core
Japan 30-34 5+ 15.17 68.2 18.17 66.5 20.66 59.8 23.50 61.6 U.S. 30-34 5+ 8.21 52.7 13.62 36.5 11.29 27.0 11.10 31.5 Japan 35-39 5+ 16.83 70.0 19.53 69.3 22.51 60.9 24.30 71.7 U.S. 35-39 5+ 10.61 57.9 17.08 41.8 17.37 32.4 18.05 37.1 Japan 40-44 5+ 22.18 64.7 24.75 62.2 26.77 57.3 30.41 68.3 U.S. 40-44 5+ 13.30 59.1 19.98 42.6 18.95 34.0 21.27 46.0
Mid-career hires
Japan 30-34 0-4 16.02 37.1 16.60 34.8 21.09 29.3 21.89 28.5 U.S. 30-34 0-4 36.51 16.3 38.73 14.6 37.73 11.8 37.85 13.2 Japan 35-39 0-4 19.72 40.5 21.08 38.3 24.04 34.4 24.37 31.3 U.S. 35-39 0-4 30.80 19.8 28.83 19.6 29.01 16.6 30.06 17.4 Japan 40-44 0-4 19.25 44.0 21.21 40.8 24.85 36.2 24.22 36.0 U.S. 40-44 0-4 27.44 26.0 26.45 24.0 25.26 18.1 25.12 22.1
Youth
Japan 20-24 0-4 55.66 18.2 57.98 18.1 62.91 18.7 60.37 18.9 U.S. 20-24 0-4 29.40 7.2 28.68 5.9 26.33 3.3 25.88 4.2 Japan 25-29 0-4 20.19 30.6 23.59 26.3 31.58 26.0 31.52 23.6 U.S. 25-29 0-4 47.79 13.1 51.06 11.1 44.80 8.8 45.21 8.2
Sources: For Japan, we use micro data from the Employment Status Survey, 1982, 1987, 1992, 1997, 2002, and 2007. For the U.S., we use micro data from the Current Population Survey Supplements, 1981, 1987, 1991, 1996, 2001, and 2006. Notes: For the definition of ten-year job retention rates, see text. To focus on the private sector, government employees are excluded.

32
Table 4 Summary Statistics for Probit Analysis of Job Separations in Japan over the Last Twenty-five Years year 1982 1987 1997 2002 2007
Variable Obs Mean Obs Mean Obs Mean Obs Mean Obs Mean separation 252612 0.106 261137 0.121 323642 0.120 279095 0.124 272485 0.137
ten0to4 (base) 252612 0.409 261137 0.402 323642 0.408 279095 0.365 272485 0.397 ten5to9 252612 0.234 261137 0.222 323642 0.234 279095 0.235 272485 0.221
ten10to14 252612 0.144 261137 0.134 323642 0.115 279095 0.144 272485 0.125 ten15+ 252612 0.213 261137 0.242 323642 0.243 279095 0.256 272485 0.256
fixedterm 252612 0.108 261137 0.104 323642 0.088 279095 0.106 272485 0.105 female 252612 0.398 261137 0.415 323642 0.440 279095 0.447 272485 0.472
age 252612 35.030 261137 35.747 323642 36.440 279095 37.655 272485 37.575 juniorhigh (base) 252612 0.309 261137 0.243 323642 0.138 279095 0.114 272485 0.063
seniorhigh 252612 0.520 261137 0.551 323642 0.555 279095 0.538 272485 0.635 Juniorcollege 252612 0.063 261137 0.083 323642 0.145 279095 0.171 272485 0.105
university 252612 0.108 261137 0.123 323642 0.162 279095 0.177 272485 0.197 Sources: the Employment Status Survey, 1982, 1987, 1997, 2002, and 2007. Notes: For variable definitions, please see text.

33
Table 5 Probit Estimates of Job Separations in Japan over the Last Twenty-five Years Dependent Variable: Separation=1 if the employee separated from the firm during the previous year, 0 otherwise
(i) (ii) (iii)
year 1982 1987 1997 Coeff. s.e. M.E. s.e. Coeff. s.e. M.E. s.e. Coeff. s.e. M.E. s.e.
ten0to4 0.149 0.009 *** 0.023 0.001 *** 0.198 0.009 *** 0.036 0.002 *** 0.193 0.008 *** 0.033 0.001 *** ten10to14 -0.134 0.013 *** -0.019 0.002 *** -0.142 0.013 *** -0.023 0.002 *** -0.137 0.012 *** -0.022 0.002 *** ten15+ -0.291 0.014 *** -0.040 0.002 *** -0.248 0.013 *** -0.040 0.002 *** -0.345 0.012 *** -0.052 0.002 *** fixedterm 0.314 0.011 *** 0.056 0.002 *** 0.348 0.010 *** 0.072 0.002 *** 0.420 0.009 *** 0.087 0.002 *** Female 0.447 0.009 *** 0.073 0.002 *** 0.340 0.008 *** 0.062 0.002 *** 0.372 0.008 *** 0.065 0.001 *** Age -0.071 0.003 *** -0.011 0.000 *** -0.061 0.003 *** -0.011 0.000 *** -0.035 0.003 *** -0.006 0.000 *** age2 0.081 0.004 *** 0.012 0.001 *** 0.068 0.004 *** 0.012 0.001 *** 0.025 0.003 *** 0.004 0.001 *** highschool -0.002 0.009
0.000 0.001
-0.032 0.009 *** -0.006 0.002 *** -0.078 0.010 *** -0.013 0.002 ***
juniorcollege 0.066 0.016 *** 0.010 0.003 *** 0.002 0.014
0.000 0.003
-0.089 0.012 *** -0.014 0.002 *** university -0.046 0.016 *** -0.007 0.002 *** -0.118 0.015 *** -0.020 0.002 *** -0.139 0.014 *** -0.022 0.002 *** Obs 252612 261137 323642 obs prob 0.106 0.121 0.120
(iv) (v) year 2002 2007 Coeff. s.e. M.E. s.e. Coeff. s.e. M.E. s.e. ten0to4 0.201 0.008 *** 0.039 0.002 *** 0.400 0.008 *** 0.079 0.002 *** ten10to14 -0.065 0.011 *** -0.012 0.002 *** -0.113 0.012 *** -0.020 0.002 *** ten15+ -0.205 0.011 *** -0.036 0.002 *** -0.340 0.012 *** -0.057 0.002 *** fixedterm 0.275 0.009 *** 0.059 0.002 *** 0.507 0.009 *** 0.119 0.003 *** female 0.326 0.008 *** 0.063 0.002 *** 0.256 0.008 *** 0.048 0.001 *** age -0.035 0.003 *** -0.007 0.000 *** -0.028 0.003 *** -0.005 0.000 *** age2 0.038 0.004 *** 0.007 0.001 *** 0.023 0.004 *** 0.004 0.001 *** highschool -0.111 0.010 *** -0.021 0.002 *** -0.147 0.013 *** -0.028 0.003 *** juniorcollege -0.128 0.013 *** -0.023 0.002 *** -0.150 0.016 *** -0.026 0.003 *** university -0.170 0.014 *** -0.030 0.002 *** -0.175 0.015 *** -0.031 0.003 *** obs 279095 272485 obs prob 0.124 0.137
Sources: the Employment Status Survey, 1982, 1987, 1997, 2002, and 2007. Notes: For variable definitions, please see text. The omitted tenure category is 5-9 years of tenure (t5to9). The omitted educational attainment category is juniorhigh. Firm size, industry, occupation and location (prefecture) are also controlled for. ***significant at the 1 percent level; **significant at the 5 percent level; *significant at the 10 percent level.
34
Table 6 Summary Statistics for Probit Analysis of Job Loss Rates in Japan and the U.S. Sample 1997 ESS 2007 ESS observation mean s.d. min. max. observation mean s.d. min. max. jobloss 206034 0.04 - 0 1 149482 0.04 - 0 1 ten0to4 (base) 206034 0.32 - 0 1 149482 0.27 - 0 1 ten5to9 206034 0.22 - 0 1 149482 0.22 - 0 1 ten10to14 206034 0.13 - 0 1 149482 0.14 - 0 1 ten15+ 206034 0.33 - 0 1 149482 0.36 - 0 1 age 206034 37.01 10.48 20 54 149482 38.14 9.97 20 54 age2/100 206034 14.80 7.77 4 29.16 149482 15.54 7.60 4 29.16 female 206034 0.38 - 0 1 149482 0.39 - 0 1 highorless (base) 206034 0.67 - 0 1 149482 0.68 - 0 1 juniorcollege 206034 0.14 - 0 1 149482 0.09 - 0 1 University 206034 0.19 - 0 1 149482 0.23 - 0 1
Sample 1996 CPS Jan. 2006 CPS Feb. observation mean s.d. min. max. observation mean s.d. min. max. Jobloss 24270 0.06 - 0 1 31070 0.03 - 0 1 ten0to4 (base) 24270 0.54 - 0 1 31070 0.54 - 0 1 ten5to9 24270 0.23 - 0 1 31070 0.20 - 0 1 ten10to14 24270 0.10 - 0 1 31070 0.10 - 0 1 ten15+ 24270 0.14 - 0 1 31070 0.16 - 0 1 Age 24270 36.74 9.07 20 54 31070 37.04 9.80 20 54 age2/100 24270 14.32 6.77 4 29.16 31070 14.68 7.27 4 29.16 Female 24270 0.47 - 0 1 31070 1.49 - 0 1 highorless (base) 24270 0.65 - 0 1 31070 0.58 - 0 1 juniorcollege 24270 0.10 - 0 1 31070 0.12 - 0 1 university 24270 0.25 - 0 1 31070 0.30 - 0 1
Sources: For Japan, we use micro data from the Employment Status Survey, 1997 and 2007. For the U.S., we use micro data from the Current Population Survey Supplements, 1996 and 2006. Notes: For variable definitions, please see text.
35
Table 7 Probit Estimates of the Determinants of Job Loss Rates in Japan and the U.S. Dependent Variable: Jobloss=1 if the employee separated involuntarily from the firm during the previous year, 0 otherwise JPN 1997 ESS 2007ESS Coeff. s.e. M.E. s.e. Coeff. s.e. M.E. s.e.
ten5to9 -0.454 0.014 *** -0.024 0.001 *** -0.356 0.016 *** -0.021 0.001 ***
ten10to14 -0.635 0.019 *** -0.027 0.001 *** -0.457 0.020 *** -0.023 0.001 ***
ten15+ -0.967 0.019 *** -0.051 0.001 *** -0.800 0.019 *** -0.048 0.001 ***
age 0.073 0.005 *** 0.005 0.000 *** 0.076 0.006 *** 0.005 0.000 ***
age2/100 -0.092 0.006 *** -0.006 0.000 *** -0.084 0.007 *** -0.006 0.001 ***
female 0.120 0.013 *** 0.008 0.001 *** 0.036 0.015 ** 0.002 0.001 ** juniorcollege -0.114 0.016 *** -0.007 0.001 *** -0.043 0.022 * -0.003 0.001 *
university -0.268 0.018 *** -0.015 0.001 *** -0.192 0.018 *** -0.012 0.001 ***
sample size 206034 149482 obs. prob. of job loss 0.041 0.037
the U.S. 1996 CPS Jan. 2006 CPS Feb. Coeff. s.e. M.E. s.e. Coeff. s.e. M.E. s.e. ten5to9 -0.337 0.036 *** -0.030 0.003 *** -0.241 0.039 *** -0.014 0.002 *** ten10to14 -0.480 0.057 *** -0.036 0.003 *** -0.402 0.060 *** -0.019 0.002 *** ten15+ -0.467 0.052 *** -0.037 0.003 *** -0.525 0.053 *** -0.025 0.002 *** age -0.021 0.012 * -0.002 0.001 * -0.017 0.012 -0.001 0.001
age2/100 0.023 0.016 0.002 0.002 0.028 0.016 * 0.002 0.001 * female 0.019 0.031 0.002 0.003 -0.044 0.033 -0.003 0.002 juniorcollege -0.030 0.047 -0.003 0.005 -0.044 0.048 -0.003 0.003 university -0.059 0.039 -0.006 0.004 -0.054 0.039 -0.003 0.002 sample size 24270 31070 obs. prob. of job loss 0.058 0.032
Sources: For Japan, we use micro data from the Employment Status Survey, 1997 and 2007. For the U.S., we use micro data from the Current Population Survey Supplements, 1996 and 2006. Notes: For variable definitions, please see text. The omitted tenure category is 0-4 years of tenure (t0to4). The omitted educational attainment category is high school or less. Firm size, industry, occupation and location are also controlled for. ***significant at the 1 percent level; **significant at the 5 percent level; *significant at the 10 percent level.

36
Figure 1 Changes in Ten-year Job Retention Rates in Japan and the U.S. over the Last twenty-five years: All Core Employees (age 30-44 with 5 or more years of tenure)
0.0
10.0
20.0
30.0
40.0
50.0
60.0
70.0
80.0
90.0
tenure 5+ tenure 5+ tenure 5+ tenure 5+ tenure 5+ tenure 5+
age 30-34 age 30-34 age 35-39 age 35-39 age 40-44 age 40-44
Japan US Japan US Japan US
82-92 (81-91)
87-97
92-02 (91-01)
97-07 (96-06)
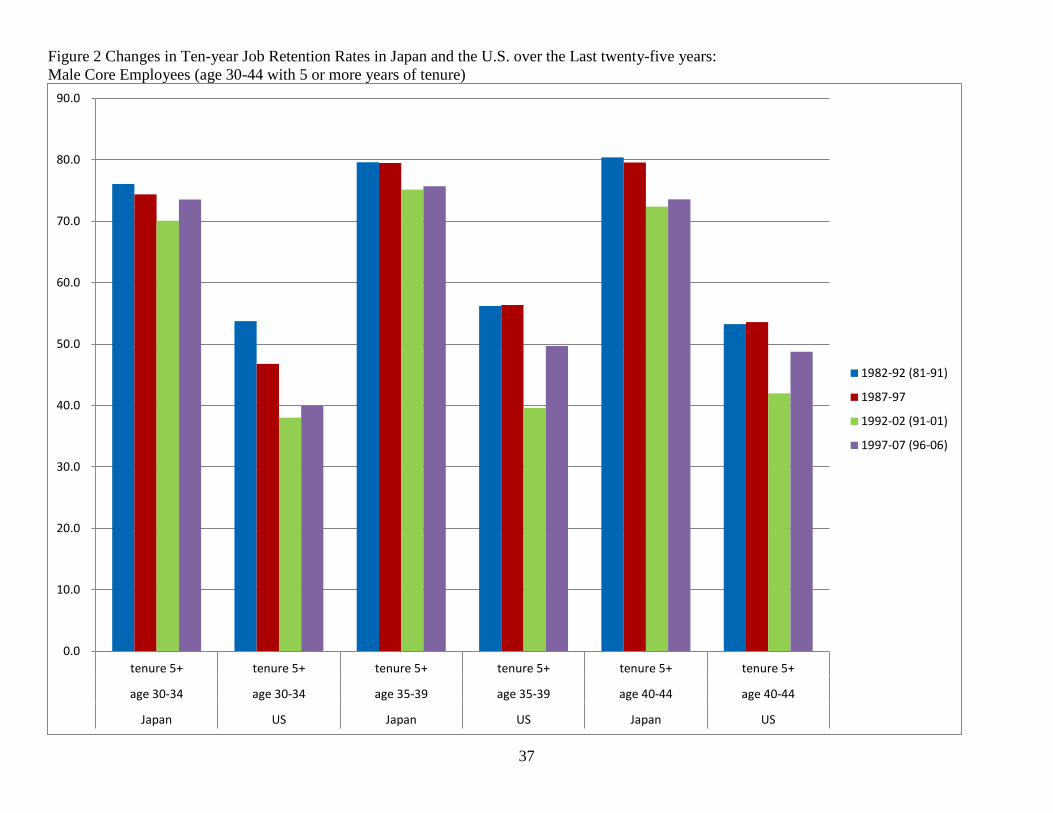
37
Figure 2 Changes in Ten-year Job Retention Rates in Japan and the U.S. over the Last twenty-five years: Male Core Employees (age 30-44 with 5 or more years of tenure)
0.0
10.0
20.0
30.0
40.0
50.0
60.0
70.0
80.0
90.0
tenure 5+ tenure 5+ tenure 5+ tenure 5+ tenure 5+ tenure 5+
age 30-34 age 30-34 age 35-39 age 35-39 age 40-44 age 40-44
Japan US Japan US Japan US
1982-92 (81-91)
1987-97
1992-02 (91-01)
1997-07 (96-06)

38
Figure 3 Changes in Ten-year Job Retention Rates in Japan and the U.S. over the Last twenty-five years: Female Core Employees (age 30-44 with 5 or more years of tenure)
0.0
10.0
20.0
30.0
40.0
50.0
60.0
70.0
80.0
tenure 5+ tenure 5+ tenure 5+ tenure 5+ tenure 5+ tenure 5+
age 30-34 age 30-34 age 35-39 age 35-39 age 40-44 age 40-44
Japan US Japan US Japan US
82-92 (81-91)
87-97
92-02 (91-01)
97-07 (96-06)

39
Figure 4 Changes in Ten-year Job Retention Rates in Japan and the U.S. over the Last twenty-five years: All Mid-career Hires (age 30-44 with less than 5 years of tenure)
0.0
5.0
10.0
15.0
20.0
25.0
30.0
35.0
40.0
45.0
50.0
tenure 0-4 tenure 0-4 tenure 0-4 tenure 0-4 tenure 0-4 tenure 0-4
age 30-34 age 30-34 age 35-39 age 35-39 age 40-44 age 40-44
Japan US Japan US Japan US
82-92 (81-91)
87-97
92-02 (91-01)
97-07 (96-06)

40
Figure 5 Changes in Ten-year Job Retention Rates in Japan and the U.S. over the Last twenty-five years: Male Mid-career Hires (age 30-44 with less than 5 years of tenure)
0.0
10.0
20.0
30.0
40.0
50.0
60.0
tenure 0-4 tenure 0-4 tenure 0-4 tenure 0-4 tenure 0-4 tenure 0-4
age 30-34 age 30-34 age 35-39 age 35-39 age 40-44 age 40-44
Japan US Japan US Japan US
1982-92 (81-91)
1987-97
1992-02 (91-01)
1997-07 (96-06)

41
Figure 6 Changes in Ten-year Job Retention Rates in Japan and the U.S. over the Last twenty-five years: Female Mid-career Hires (age 30-44 with less than 5 years of tenure)
0.0
5.0
10.0
15.0
20.0
25.0
30.0
35.0
40.0
45.0
50.0
tenure 0-4 tenure 0-4 tenure 0-4 tenure 0-4 tenure 0-4 tenure 0-4
age 30-34 age 30-34 age 35-39 age 35-39 age 40-44 age 40-44
Japan US Japan US Japan US
82-92 (81-91)
87-97
92-02 (91-01)
97-07 (96-06)

42
Figure 7 Changes in Ten-year Job Retention Rates in Japan and the U.S. over the Last twenty-five years: All Youth (age 20-29 with less than 5 years of tenure)
0.0
5.0
10.0
15.0
20.0
25.0
30.0
35.0
40.0
45.0
50.0
tenure 0-4 tenure 0-4 tenure 0-4 tenure 0-4
age 20-24 age 20-24 age 25-29 age 25-29
Japan US Japan US
82-92 (81-91)
87-97
92-02 (91-01)
97-07 (96-06)

43
Figure 8 Changes in Ten-year Job Retention Rates in Japan and the U.S. over the Last twenty-five years: Male Youth (age 20-29 with less than 5 years of tenure)
0.0
10.0
20.0
30.0
40.0
50.0
60.0
70.0
tenure 0-4 tenure 0-4 tenure 0-4 tenure 0-4
age 20-24 age 20-24 age 25-29 age 25-29
Japan US Japan US
82-92 (81-91)
87-97
92-02 (91-01)
97-07 (96-06)

44
Figure 9 Changes in Ten-year Job Retention Rates in Japan and the U.S. over the Last twenty-five years: Female Youth (age 20-29 with less than 5 years of tenure)
0.0
5.0
10.0
15.0
20.0
25.0
30.0
35.0
tenure 0-4 tenure 0-4 tenure 0-4 tenure 0-4
age 20-24 age 20-24 age 25-29 age 25-29
Japan US Japan US
82-92 (81-91)
87-97
92-02 (91-01)
97-07 (96-06)

45
Figure 10 Predicted Separation Probabilities and Tenure of Japanese Employees over the Last Twenty Five Years: All Employees
0.00
0.05
0.10
0.15
0.20
0.25
0-4
5-9
10-1
4
15+
tenure
1982
1987
1997
2002
2007
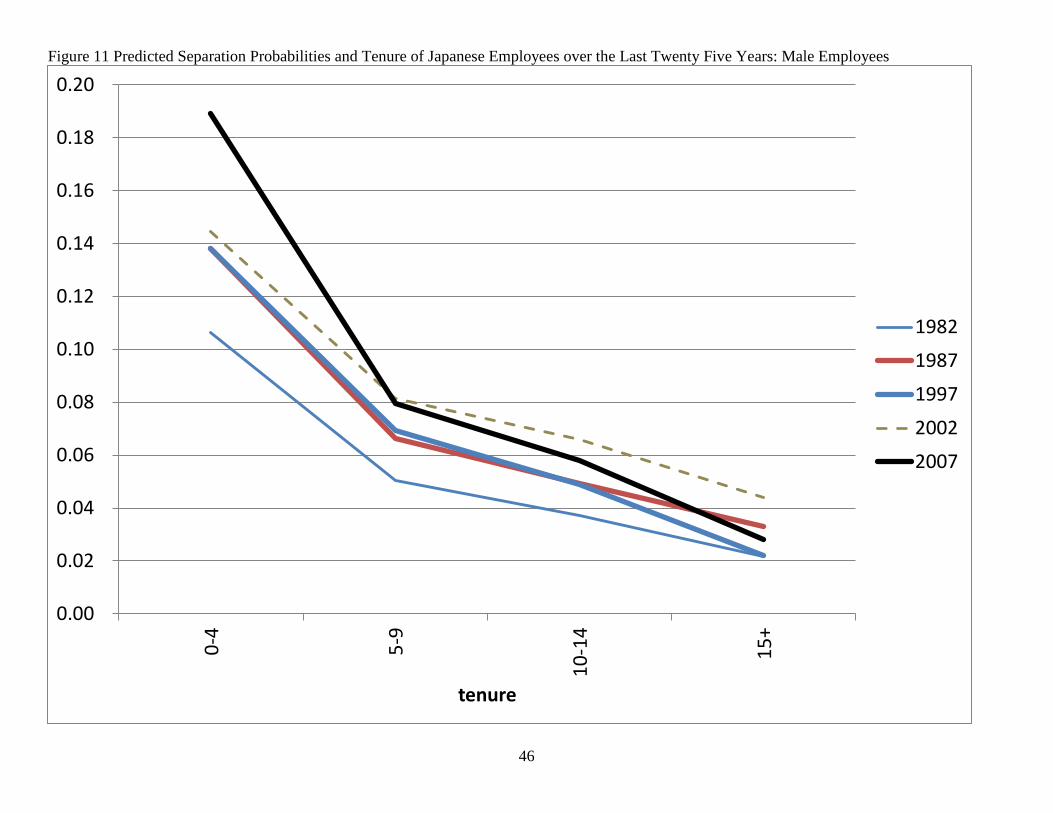
46
Figure 11 Predicted Separation Probabilities and Tenure of Japanese Employees over the Last Twenty Five Years: Male Employees
0.00
0.02
0.04
0.06
0.08
0.10
0.12
0.14
0.16
0.18
0.20
0-4
5-9
10-1
4
15+
tenure
1982
1987
1997
2002
2007
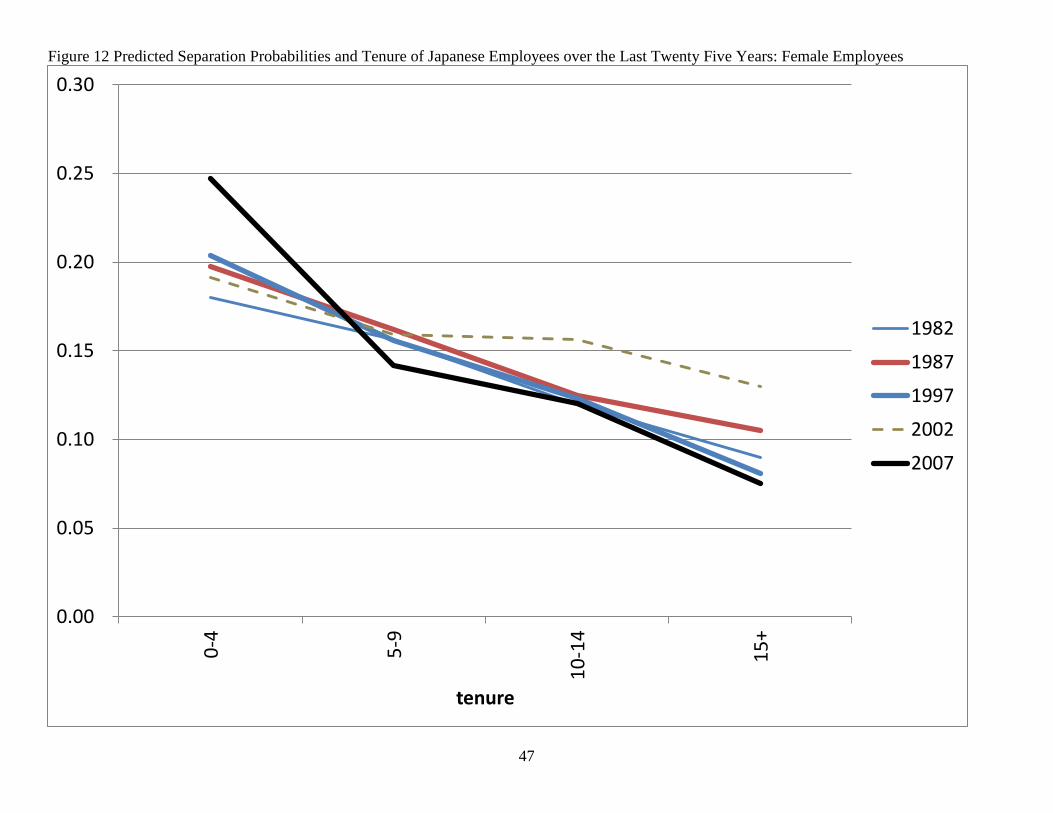
47
Figure 12 Predicted Separation Probabilities and Tenure of Japanese Employees over the Last Twenty Five Years: Female Employees
0.00
0.05
0.10
0.15
0.20
0.25
0.30
0-4
5-9
10-1
4
15+
tenure
1982
1987
1997
2002
2007

48
Figure 13 Predicted Separation Probabilities and Age in Japan over the Last Twenty Five Years: Male Employees
0.00
0.02
0.04
0.06
0.08
0.10
0.12
0.14
0.16
18 20 22 24 26 28 30 32 34 36 38 40 42 44 46 48 50 52 54
age
1982
1987
1997
2002
2007

49
Figure 14 Predicted Separation Probabilities and Age in Japan over the Last Twenty Five Years: Female Employees
0.00
0.05
0.10
0.15
0.20
0.25
0.30
0.35
0.40
18 20 22 24 26 28 30 32 34 36 38 40 42 44 46 48 50 52 54
age
1982
1987
1997
2002
2007
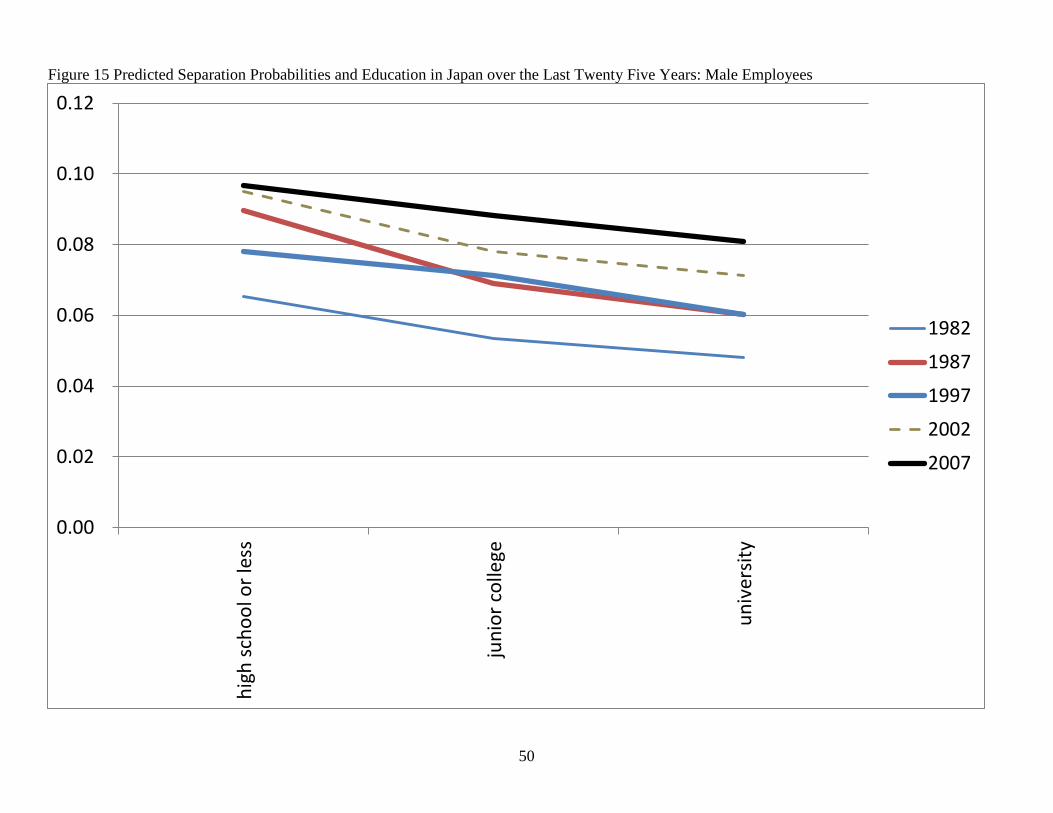
50
Figure 15 Predicted Separation Probabilities and Education in Japan over the Last Twenty Five Years: Male Employees
0.00
0.02
0.04
0.06
0.08
0.10
0.12
high
scho
ol o
r les
s
juni
or c
olle
ge
univ
ersit
y
1982
1987
1997
2002
2007
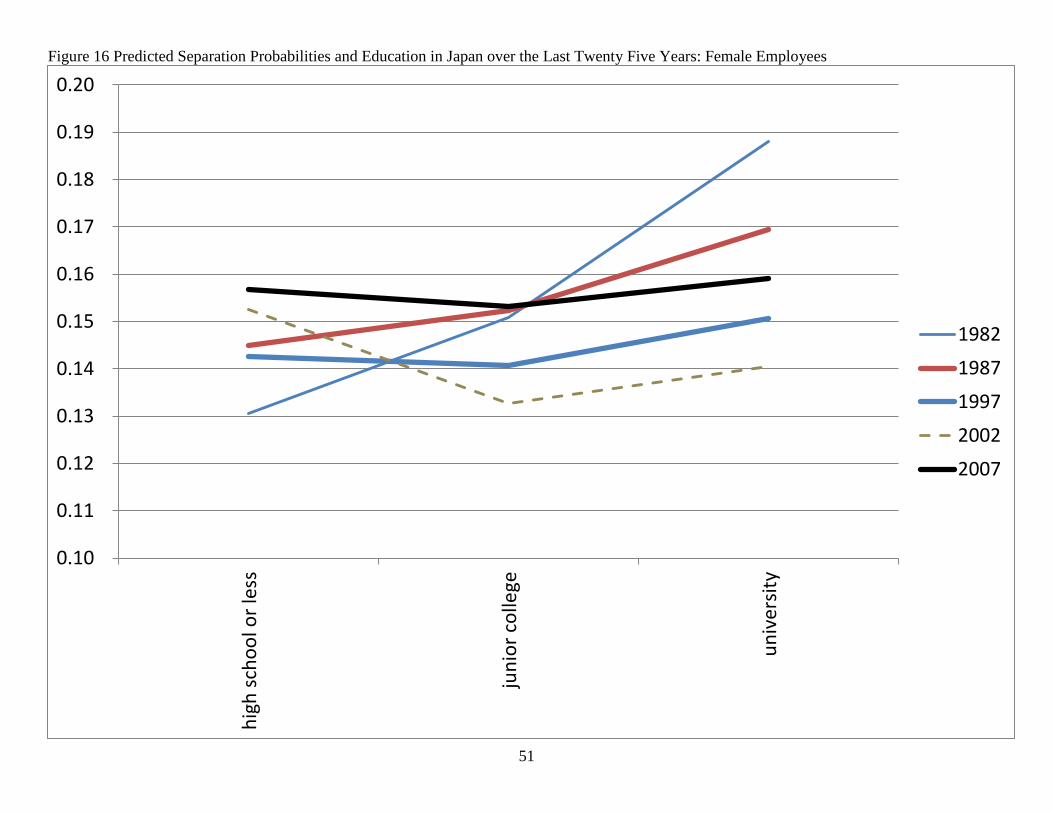
51
Figure 16 Predicted Separation Probabilities and Education in Japan over the Last Twenty Five Years: Female Employees
0.10
0.11
0.12
0.13
0.14
0.15
0.16
0.17
0.18
0.19
0.20
high
scho
ol o
r les
s
juni
or c
olle
ge
univ
ersit
y
1982
1987
1997
2002
2007

52
Figure 17 Predicted Job Loss Rates and Tenure in Japan and the U.S. over 1997(6)-2007(6): All Employees
0.00
0.01
0.02
0.03
0.04
0.05
0.06
0.07
0.08
0.09
0.10
0-4
5-9
10-1
4
15+
tenure
1997 JPN
1996 US
2007 JPN
2006 US

53
Figure 18 Predicted Job Loss Rates and Tenure in Japan and the U.S. over 1997(6)-2007(6): Male Employees
0.00
0.01
0.02
0.03
0.04
0.05
0.06
0.07
0.08
0.09
0.10
0-5
5-10
10-1
5
over
15
tenure
1997 JPN
1996 US
2007 JPN
2006 US

54
Figure 19 Predicted Job Loss Rates and Tenure in Japan and the U.S. over 1997(6)-2007(6): Female Employees
0.00
0.01
0.02
0.03
0.04
0.05
0.06
0.07
0.08
0.09
0.10
0-5
5-10
10-1
5
over
15
tenure
1997 JPN
1996 US
2007 JPN
2006 US