Embed Size (px)
Citation preview
SOPEMI
Trendsin International
Migration
Continuous Reporting System on Migration
ANNUAL REPORT
2001 EDITION
ORGANISATION FOR ECONOMIC CO-OPERATION AND DEVELOPMENT
17
Part I
MAIN TRENDS IN INTERNATIONAL MIGRATION
The analysis of the main trends in internationalmigration is presented in four sections. The first looksat changes in migration movements and in the foreignpopulation of OECD Member countries. The secondsection considers the position of immigrants and for-eigners in the labour market. The following sectionfocuses on two regions, Asia and Central and EasternEurope. Finally, an overview of migration policies isprovided. It reviews policies to regulate and controlflows and the whole range of measures to promotethe integration of immigrants in host countries. It alsodescribes recent moves to enhance co-operationbetween host countries and countries of origin in thespheres of migration and development.
A. MIGRATION AND POPULATION TRENDS
Since the mid-1990s, there has been a gradualupturn in migration flows in most OECD Membercountries. Owing to regional conflicts, but also to therestrictions placed on other immigration channels,the number of asylum seekers and refugees hasrisen substantially, particularly in some Europeancountries. Immigration for employment reasons,permanent but in part icular temporary, alsoincreased sharply in 1999-2000 in response to eco-nomic trends in Member countries and the resultinglabour shortages in certain sectors. Nevertheless,immigration for family reasons continues to predom-inate, especially in the longer-standing countries ofimmigration. Lastly, the persistence of illegal migra-tion, the volume of which is by definition impossibleto determine, indicates clearly the difficulties thathost and origin countries are encountering in theirattempts to control migration flows.
Immigration plays a significant role in theannual population growth of certain OECD countries.They have a high proportion of foreign births in totalbirths, and the foreign or foreign-born population isgrowing and diversifying. The importance of migra-tion inflows is sometimes emphasised in connection
with the ageing of the population. Without denyingtheir potential contribution to reducing demo-graphic imbalances, their impact in this regardshould not be overestimated.
1. Trends in migration movements and changes in the foreign population
Although the 1980s were characterised by anincrease in immigration flows in most OECD coun-tries, a substantial decline in the number of entrieswas perceptible by 1992-93. This downturn contin-ued until 1997-98, after which immigration started torise again, particularly in Europe and Japan.
Over the entire period 1980-99, there was also adiversification of migration movements and anincrease in the range of nationalities involved,although the traditional flows and regional move-ments persisted. The volume of the foreign popula-tion shows a trend similar to that for flows. There is atrend increase in numbers, together with a widerrange of countries of origin and greater heterogene-ity in demographic terms.
a) Upward but contrasting migration trends
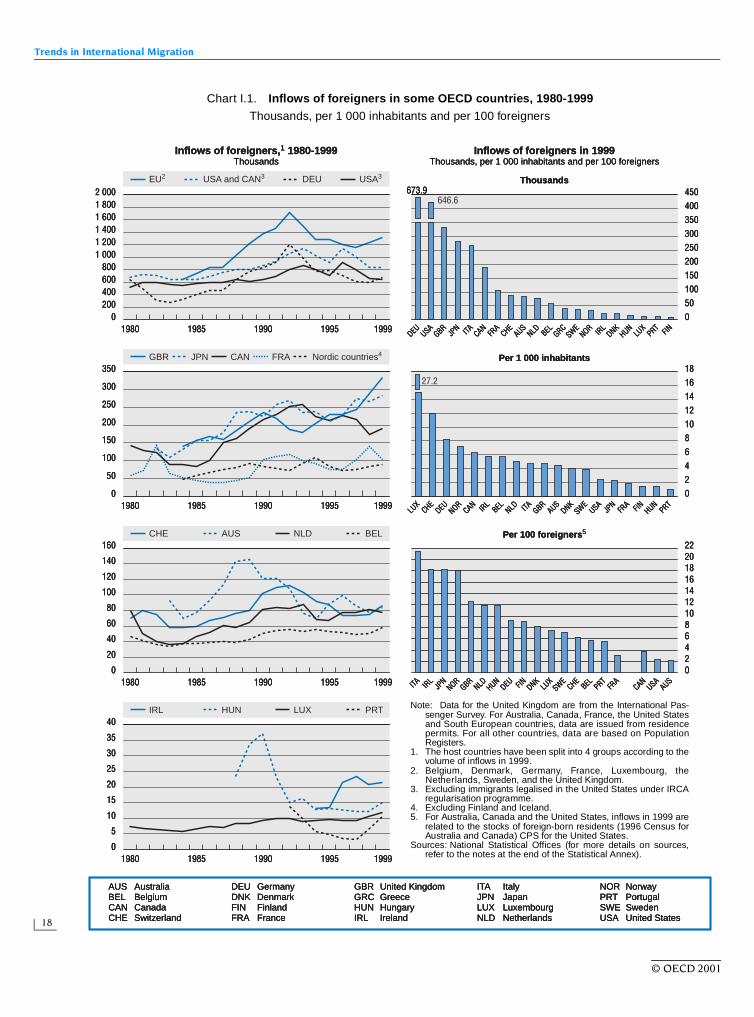
During the 1980s and above all at the beginningof the 1990s, inflows increased in almost all OECDcountries (see Chart I.1). This trend peaked in 1992-93 for the main immigration countries such asCanada, Germany, Japan and the United States,while in others, notably Australia and the UnitedKingdom, the peak had come earlier. Since then, asthe result of restrictions, the flows of legal entrieshave fallen sharply. In 1999 they representedaround three-quarters of the volume of entriesreported for all European Union countries in 1992and for North America in 1993.
The left-hand side of Chart I.1 presents thepost-1980 time-series for foreign migrant inflows.The host countries are divided into four groups in
© OECD 2001
Trends in International Migration
18
Chart I.1. Inflows of foreigners in some OECD countries, 1980-1999Thousands, per 1 000 inhabitants and per 100 foreigners
2 000
1980
1 8001 6001 4001 2001 000
800600400200
0
450400350300250200150100500
1985 1990 1995 1999
1980 1985 1990 1995 1999
1980 1985 1990 1995 1999
1980 1985 1990 1995 1999
350
300
250
200
150
100
50
0
160
140
120
100
80
60
40
20
0
40
35
30
25
20
15
10
5
0
181614121086420
2220181614121086420
DEU USAGBR
JPN ITA CAN
FRA
CHEAUS
NLD BEL GRCSWE
NOR IRL
DNKHUN
LUX
PRT FIN
LUX
CHEDEU NOR
CAN IRL
BEL NLD ITA GBRAUS
DNKSWE
USAJP
NFR
A FIN HUNPRT
ITA IRL
JPN
NORGBR
NLD HUNDEU FIN DNK
LUX
SWECHE
BEL PRTFR
ACAN
USAAUS
673.9646.6
27.2
AUS AustraliaBEL BelgiumCAN CanadaCHE Switzerland
DEU GermanyDNK DenmarkFIN FinlandFRA France
GBR United KingdomGRC GreeceHUN HungaryIRL Ireland
ITA ItalyJPN JapanLUX LuxembourgNLD Netherlands
NOR NorwayPRT PortugalSWE SwedenUSA United States
Inflows of foreigners,1 1980-1999Thousands
Inflows of foreigners in 1999Thousands, per 1 000 inhabitants and per 100 foreigners
ThousandsUSA3USA and CAN3EU2
GBR JPN CAN FRA Nordic countries4
BELNLDAUSCHE
PRTLUXHUNIRL
Per 1 000 inhabitants
Per 100 foreigners5
DEU2 000
1980
1 8001 6001 4001 2001 000
800600400200
0
450400350300250200150100500
1985 1990 1995 1999
1980 1985 1990 1995 1999
1980 1985 1990 1995 1999
1980 1985 1990 1995 1999
350
300
250
200
150
100
50
0
160
140
120
100
80
60
40
20
0
40
35
30
25
20
15
10
5
0
181614121086420
2220181614121086420
DEU USAGBR
JPN ITA CAN
FRA
CHEAUS
NLD BEL GRCSWE
NOR IRL
DNKHUN
LUX
PRT FIN
LUX
CHEDEU NOR
CAN IRL
BEL NLD ITA GBRAUS
DNKSWE
USAJP
NFR
A FIN HUNPRT
ITA IRL
JPN
NORGBR
NLD HUNDEU FIN DNK
LUX
SWECHE
BEL PRTFR
ACAN
USAAUS
673.9646.6
27.2
AUS AustraliaBEL BelgiumCAN CanadaCHE Switzerland
DEU GermanyDNK DenmarkFIN FinlandFRA France
GBR United KingdomGRC GreeceHUN HungaryIRL Ireland
ITA ItalyJPN JapanLUX LuxembourgNLD Netherlands
NOR NorwayPRT PortugalSWE SwedenUSA United States
Inflows of foreigners,1 1980-1999Thousands
Inflows of foreigners in 1999Thousands, per 1 000 inhabitants and per 100 foreigners
ThousandsUSA3USA and CAN3EU2
GBR JPN CAN FRA Nordic countries4
BELNLDAUSCHE
PRTLUXHUNIRL
Per 1 000 inhabitants
Per 100 foreigners5
DEU
Note: Data for the United Kingdom are from the International Pas-senger Survey. For Australia, Canada, France, the United Statesand South European countries, data are issued from residencepermits. For all other countries, data are based on PopulationRegisters.
1. The host countries have been split into 4 groups according to thevolume of inflows in 1999.
2. Belgium, Denmark, Germany, France, Luxembourg, theNetherlands, Sweden, and the United Kingdom.
3. Excluding immigrants legalised in the United States under IRCAregularisation programme.
4. Excluding Finland and Iceland.5. For Australia, Canada and the United States, inflows in 1999 are
related to the stocks of foreign-born residents (1996 Census forAustralia and Canada) CPS for the United States.
Sources: National Statistical Offices (for more details on sources,refer to the notes at the end of the Statistical Annex).
© OECD 2001
Main Trends in International Migration
19
decreasing order of the volume of their 1999 inflows.The right-hand side of this chart shows the volumeof 1999 inflows in absolute terms, and as a propor-tion of the total population and the stock of foreign-ers in each country. The trend reversal mentioned inprevious editions of Trends in International Migrationcontinued in more marked fashion in 1999. In theEuropean Union and Japan total inflows rose by over6% between 1998 and 1999, whereas in North Americathe rise was more modest, around 0.3%. There are anumber of exceptions, however, such as the UnitedStates or a few countries in Europe where immigra-tion flows remained steady, or fell back slightly.Other countries report a very marked increase, wellabove the average trend.
OECD countries can be placed in three groupson the basis of their recent migration trends. First isa group of countries where inflows held steady orshowed a modest fall between 1998 and 1999, nota-bly the Netherlands, Finland and Sweden, all coun-tries where immigration is relatively stable. Franceshowed a marked decline in inflows, of around 24%,though this is accounted for by a technical adjust-ment following the documentation process in 1997-98.In the United States permanent immigration fellfor the third consecutive year, though at a much
more modest rate. The decline can be partly attrib-uted to the increase in the backlog of persons wait-ing to change their status from temporary “non-immigrant” (or illegal) to permanent (1998: 809 000;1999: 951 000). The decline in permanent inflows isaccompanied, however, by a marked increase in thenumber of temporary visas issued, in particular toskilled workers (see below).
The second group is made up of countries whereimmigration flows are moving upwards, in contrast tothe trend over the preceding period. Australia,Canada, Germany and Japan come into this category.For the Asian countries, the change marks a return tothe trends which had prevailed prior to the financialcrisis of 1997. In Korea the increase has gone hand inhand with the resumption of growth and improvingconditions in the labour market, while in Japan thetrend seems largely attributable to entries of foreignstudents. In the cases of Canada and Germany, thetrend reversal follows a steady fall in immigrationsince the beginning of the 1990s. Switzerland’s situa-tion is a similar one.
The last group of countries display a spectacu-lar and sustained rise in immigration. That is partic-ularly so in the United Kingdom, where following a
Box I.1. Migration statistics: definitions and comparability*
International migration statistics are scattered, of varying degrees of reliability, and subject to problems ofcomparability. These difficulties largely stem from the diversity of migration systems and legislation on national-ity and naturalisation, which reflect the individual history and circumstances of each country. For example, in set-tlement countries (Australia, Canada, New Zealand and the United States) immigrants are classified by theirplace of birth (“foreign-born”), while in the other OECD Member countries the criterion of nationality is applied(“foreigners”). Some international organisations, in particular the UN, have recommended adopting a commondefinition of the concept of international migrant, but implementing these recommendations is fraught withnumerous difficulties.
The main sources of information on migration vary across countries, which poses difficulties for the compara-bility of available data. Some countries have population registers (notably northern European countries), whileothers base their statistics on records covering residents and work permits issued to foreign nationals. There arealso data from censuses and from surveys on the various characteristics of the population. In some cases, othersources may be used, for example specific surveys on migrants, border-crossing records, disembarkation cards,studies on staff mobility in multinational enterprises, etc.
Despite these difficulties, this report and more generally all OECD activities in the field of internationalmigration are aimed precisely at improving the availability, comparability and reliability of data. These activitiesare based largely on a network of national correspondents in thirty countries (see the list of correspondents inthe annex) and seek to enhance analysis and understanding of migration issues in the light of the socio-economicchallenges facing OECD Member countries.
* For further details on migration statistics, see the Statistical Annex.
© OECD 2001
Trends in International Migration
20
rise of nearly 19% between 1997 and 1998 immigra-tion flows rose by around 14% in 1999. It is also thecase of Norway which, for the second consecutiveyear, showed a rise in inflows of over 20%. Yet therise in immigration was most sustained in Portugal,and above all in Italy. The latter country stands out,with inflows growing by some 140% between 1998and 1999. Although the figure needs to be treatedwith caution, given that it includes recently docu-mented persons who in fact had been in the countryfor some time, it does reflect a spectacular rise inimmigration there. It should be noted that Belgiumand Luxembourg also report a substantial increasein entries of immigrants for the second consecutiveyear.
Recent migration trends have brought littlechange to the ranking of the main immigration coun-tries, though some differences have widenedslightly (see the right-hand part of Chart I.1). Forexample, in 1999 the United Kingdom receivedsome 50 000 persons more than Japan, and 140 000more than Canada (1998: 25 000 and 115 000 more,respectively). However, Germany (674 000) and theUnited States (647 000) continued to be the two mainimmigration countries. For France, the Netherlands,Australia and Switzerland, the number of entriesranged between 105 000 and 78 000. Italy is the onlynew entrant in this ranking, coming between Canadaand Japan with 268 000 “new” entries in 1999.
If these legal entry flows are compared to thetotal foreign or foreign-born population at thebeginning of the year, the ranking changes some-what. Italy ranks first, ahead of Ireland, Japan andNorway with ratios of between 21 and 18%, followedby the United Kingdom, the Netherlands andHungary (around 12%), and Germany (9%).
It is particularly hard to predict whether thesetrends will continue, given that since the beginningof 2001 economic activity has experienced cyclicalshocks of varying scales. The data available for 2000,however, confirm the rise reported in 1999. In South-ern Europe it can be expected that Italy, Spain andPortugal, on the basis of demographic trends andlabour requirements, will experience steady migra-tion pressure over coming years. In the mediumterm, settlement by recent waves of migrants maygenerate further inflows of immigrants for family rea-sons in all three countries, and probably in Greecetoo, thereby making them more significant immigra-tion countries. At the same time the main immigra-tion countries, such as Australia, Canada andGermany, are increasingly openly adopting policies
aimed at attracting new migrants in order to meetlabour market needs and/or offset the effects of theageing of their populations.
Nevertheless, controlling migration flowsremains a priority common to all OECD countries.Special emphasis is placed on curbing illegal immi-gration and the growing number of asylum seekers.On the whole, the trends of migration flows, classi-fied by the main categories, have been marked overthe last two years by the continuing preponderanceof family-linked immigration, greater numbers ofasylum seekers and an increase in employment-related migration.
b) The continuing predominance of family-linked migration...
Previous editions of Trends in International Migra-tion have pointed out that since the beginning ofthe 1990s the changes in the volumes of immigrationhave been accompanied by changes in their break-down by categoriesIn particular, family-linked immi-gration (accompanying families and family reunion)has increased in Australia, France, Sweden and theUnited States, while employment-related immigra-tion has risen in Canada and the United Kingdom.Recently, however, the salient features have beenthe rise in worker migration, temporary workers inparticular, and to a lesser extent the upturn in asy-lum requests.
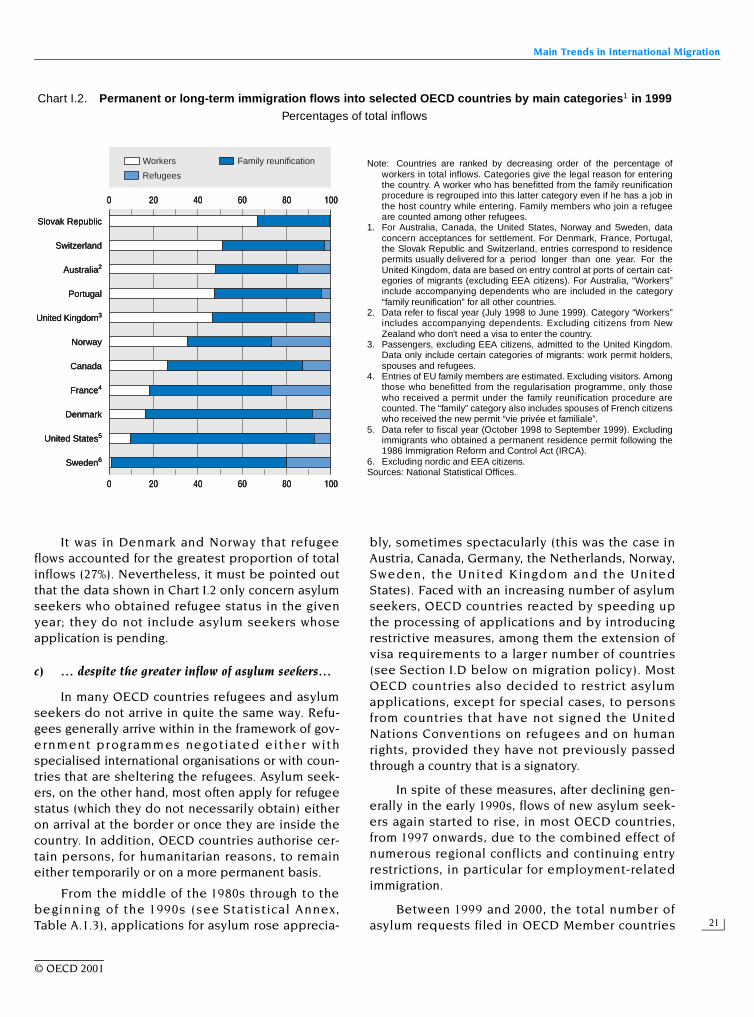
Although it varied considerably across coun-tries, the family component predominated in manyOECD countries in 1999, especially in Canada,France and the United States (see Chart I.2). Theproportion taken by this category is continuing torise in some countries where the other official chan-nels of immigration still remain limited. In France,family-linked immigration represented 75% ofinflows in 1999, the highest level ever and anincrease of nearly 23% over 1995. In the Nordic coun-tries this component of migration is also increasinglysignificant, partly due to the fall in refugee inflows.
During the same year, amongst the selectedcountries, work-related migration accounted for thehighest percentage of total entries in the SlovakRepublic, Switzerland, Australia and Portugal. Thiscomponent is likely to have assumed greater impor-tance in 2000, according to the initial data to hand.In addition, it should be said that family memberswho obtain permanent resident status are oftengranted the right to work.
© OECD 2001
Main Trends in International Migration
21
It was in Denmark and Norway that refugeeflows accounted for the greatest proportion of totalinflows (27%). Nevertheless, it must be pointed outthat the data shown in Chart I.2 only concern asylumseekers who obtained refugee status in the givenyear; they do not include asylum seekers whoseapplication is pending.
c) … despite the greater inflow of asylum seekers…
In many OECD countries refugees and asylumseekers do not arrive in quite the same way. Refu-gees generally arrive within in the framework of gov-ernment programmes negotiated either withspecialised international organisations or with coun-tries that are sheltering the refugees. Asylum seek-ers, on the other hand, most often apply for refugeestatus (which they do not necessarily obtain) eitheron arrival at the border or once they are inside thecountry. In addition, OECD countries authorise cer-tain persons, for humanitarian reasons, to remaineither temporarily or on a more permanent basis.
From the middle of the 1980s through to thebeginning of the 1990s (see Statistical Annex,Table A.1.3), applications for asylum rose apprecia-
bly, sometimes spectacularly (this was the case inAustria, Canada, Germany, the Netherlands, Norway,Sweden, the United Kingdom and the UnitedStates). Faced with an increasing number of asylumseekers, OECD countries reacted by speeding upthe processing of applications and by introducingrestrictive measures, among them the extension ofvisa requirements to a larger number of countries(see Section I.D below on migration policy). MostOECD countries also decided to restrict asylumapplications, except for special cases, to personsfrom countries that have not signed the UnitedNations Conventions on refugees and on humanrights, provided they have not previously passedthrough a country that is a signatory.
In spite of these measures, after declining gen-erally in the early 1990s, flows of new asylum seek-ers again started to rise, in most OECD countries,from 1997 onwards, due to the combined effect ofnumerous regional conflicts and continuing entryrestrictions, in particular for employment-relatedimmigration.
Between 1999 and 2000, the total number ofasylum requests filed in OECD Member countries
Chart I.2. Permanent or long-term immigration flows into selected OECD countries by main categories1 in 1999Percentages of total inflows
0 20 40 60 80 100
0 20 40 60 80 100
Workers
Slovak Republic
Switzerland
Australia2
Portugal
United Kingdom3
Norway
Canada
France4
Denmark
United States5
Sweden6
Family reunification
Refugees
0 20 40 60 80 100
0 20 40 60 80 100
Workers
Slovak Republic
Switzerland
Australia2
Portugal
United Kingdom3
Norway
Canada
France4
Denmark
United States5
Sweden6
Family reunification
Refugees
0 20 40 60 80 100
0 20 40 60 80 100
Workers
Slovak Republic
Switzerland
Australia2
Portugal
United Kingdom3
Norway
Canada
France4
Denmark
United States5
Sweden6
Family reunification
RefugeesNote: Countries are ranked by decreasing order of the percentage of
workers in total inflows. Categories give the legal reason for enteringthe country. A worker who has benefitted from the family reunificationprocedure is regrouped into this latter category even if he has a job inthe host country while entering. Family members who join a refugeeare counted among other refugees.
1. For Australia, Canada, the United States, Norway and Sweden, dataconcern acceptances for settlement. For Denmark, France, Portugal,the Slovak Republic and Switzerland, entries correspond to residencepermits usually delivered for a period longer than one year. For theUnited Kingdom, data are based on entry control at ports of certain cat-egories of migrants (excluding EEA citizens). For Australia, “Workers”include accompanying dependents who are included in the category“family reunification” for all other countries.
2. Data refer to fiscal year (July 1998 to June 1999). Category “Workers”includes accompanying dependents. Excluding citizens from NewZealand who don't need a visa to enter the country.
3. Passengers, excluding EEA citizens, admitted to the United Kingdom.Data only include certain categories of migrants: work permit holders,spouses and refugees.
4. Entries of EU family members are estimated. Excluding visitors. Amongthose who benefitted from the regularisation programme, only thosewho received a permit under the family reunification procedure arecounted. The “family” category also includes spouses of French citizenswho received the new permit “vie privée et familiale”.
5. Data refer to fiscal year (October 1998 to September 1999). Excludingimmigrants who obtained a permanent residence permit following the1986 Immigration Reform and Control Act (IRCA).
6. Excluding nordic and EEA citizens.Sources: National Statistical Offices.
© OECD 2001
Trends in International Migration
22
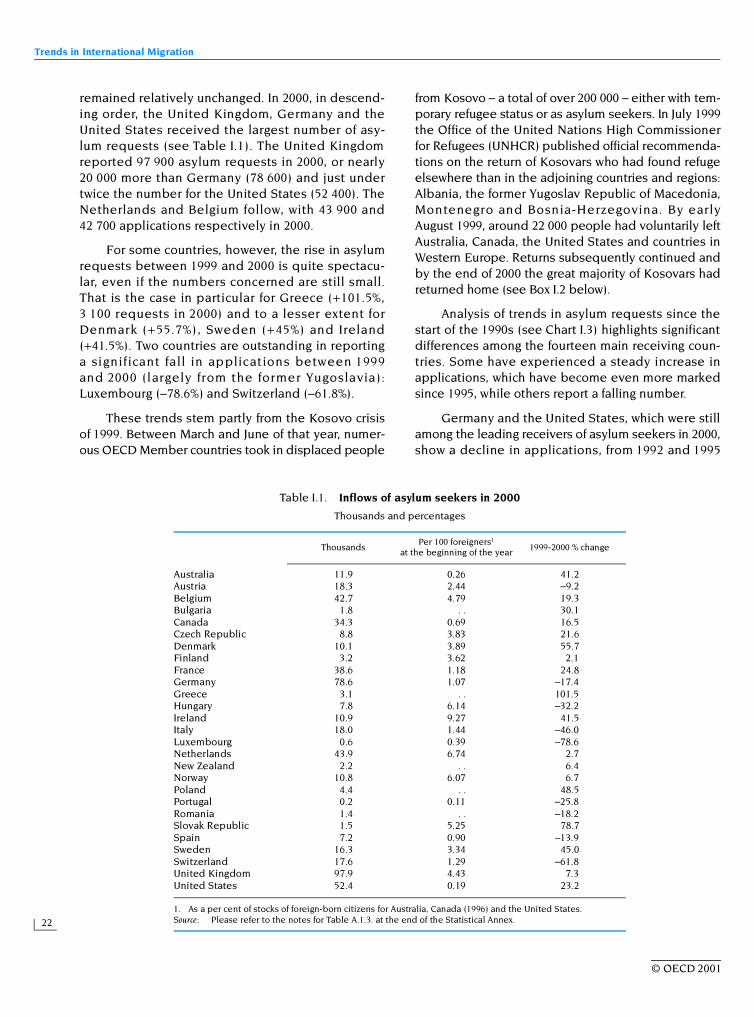
remained relatively unchanged. In 2000, in descend-ing order, the United Kingdom, Germany and theUnited States received the largest number of asy-lum requests (see Table I.1). The United Kingdomreported 97 900 asylum requests in 2000, or nearly20 000 more than Germany (78 600) and just undertwice the number for the United States (52 400). TheNetherlands and Belgium follow, with 43 900 and42 700 applications respectively in 2000.
For some countries, however, the rise in asylumrequests between 1999 and 2000 is quite spectacu-lar, even if the numbers concerned are still small.That is the case in particular for Greece (+101.5%,3 100 requests in 2000) and to a lesser extent forDenmark (+55.7%), Sweden (+45%) and Ireland(+41.5%). Two countries are outstanding in reportinga significant fall in applications between 1999and 2000 (largely from the former Yugoslavia):Luxembourg (–78.6%) and Switzerland (–61.8%).
These trends stem partly from the Kosovo crisisof 1999. Between March and June of that year, numer-ous OECD Member countries took in displaced people
from Kosovo – a total of over 200 000 – either with tem-porary refugee status or as asylum seekers. In July 1999the Office of the United Nations High Commissionerfor Refugees (UNHCR) published official recommenda-tions on the return of Kosovars who had found refugeelsewhere than in the adjoining countries and regions:Albania, the former Yugoslav Republic of Macedonia,Montenegro and Bosnia-Herzegovina. By earlyAugust 1999, around 22 000 people had voluntarily leftAustralia, Canada, the United States and countries inWestern Europe. Returns subsequently continued andby the end of 2000 the great majority of Kosovars hadreturned home (see Box I.2 below).
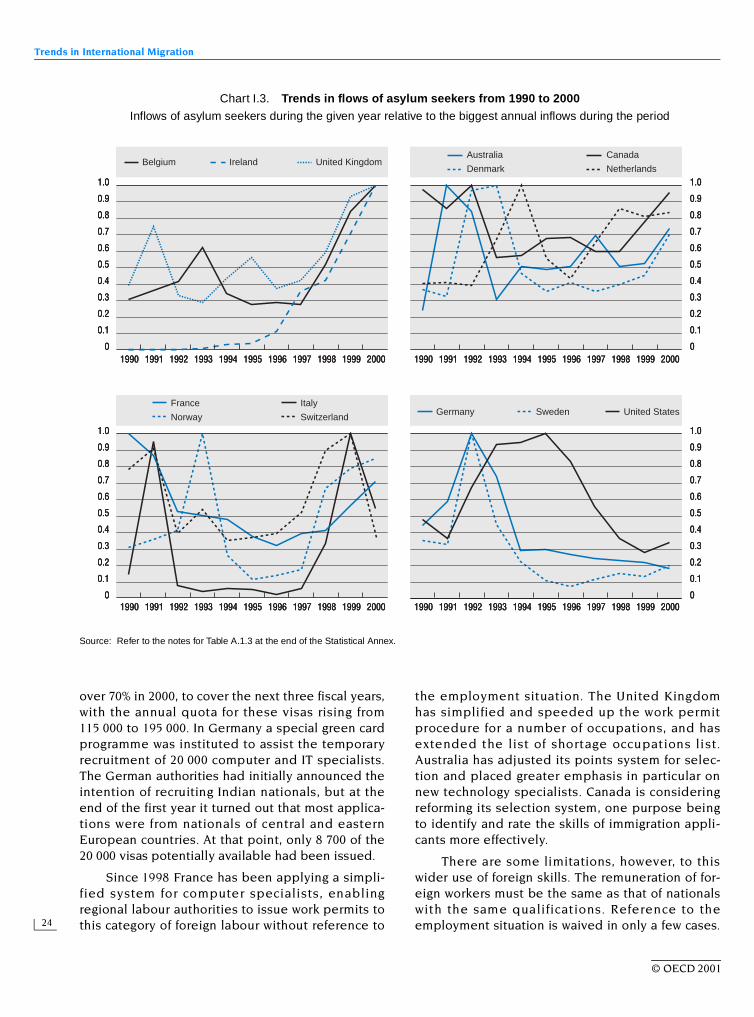
Analysis of trends in asylum requests since thestart of the 1990s (see Chart I.3) highlights significantdifferences among the fourteen main receiving coun-tries. Some have experienced a steady increase inapplications, which have become even more markedsince 1995, while others report a falling number.
Germany and the United States, which were stillamong the leading receivers of asylum seekers in 2000,show a decline in applications, from 1992 and 1995
Table I.1. Inflows of asylum seekers in 2000
Thousands and percentages
1. As a per cent of stocks of foreign-born citizens for Australia, Canada (1996) and the United States.Source: Please refer to the notes for Table A.1.3. at the end of the Statistical Annex.
ThousandsPer 100 foreigners1
at the beginning of the year1999-2000 % change
Australia 11.9 0.26 41.2Austria 18.3 2.44 –9.2Belgium 42.7 4.79 19.3Bulgaria 1.8 . . 30.1Canada 34.3 0.69 16.5Czech Republic 8.8 3.83 21.6Denmark 10.1 3.89 55.7Finland 3.2 3.62 2.1France 38.6 1.18 24.8Germany 78.6 1.07 –17.4Greece 3.1 . . 101.5Hungary 7.8 6.14 –32.2Ireland 10.9 9.27 41.5Italy 18.0 1.44 –46.0Luxembourg 0.6 0.39 –78.6Netherlands 43.9 6.74 2.7New Zealand 2.2 . . 6.4Norway 10.8 6.07 6.7Poland 4.4 . . 48.5Portugal 0.2 0.11 –25.8Romania 1.4 . . –18.2Slovak Republic 1.5 5.25 78.7Spain 7.2 0.90 –13.9Sweden 16.3 3.34 45.0Switzerland 17.6 1.29 –61.8United Kingdom 97.9 4.43 7.3United States 52.4 0.19 23.2
© OECD 2001
Main Trends in International Migration
23
onwards respectively. Other countries, including Italy,Norway, Finland, France and Switzerland, report twopeaks over the period, with the second in 1999 cor-responding to the Kosovo crisis. A third group,made up of Australia, Canada, Denmark and theNetherlands, is exceptional in that the peak in theearly 1990s, after a sharp downwards adjustment,was followed by a trend upswing in flows. A finalgroup consisting of Belgium, Ireland and the UnitedKingdom experienced a steady acceleration in asy-lum applications over the whole period.
Last ly, i f inf lows of asy lum se eke rs a reexpressed as a proportion of the total foreign popu-lation (see Table I.1), Ireland, the Netherlands,Hungary and Norway rank high with over 6%, fol-lowed by the United Kingdom and Belgium whereasylum applicants account for between 4 and 5% ofthe total foreign population. In the United Statesthere were only 2 new asylum seekers per thousandof the foreign-born population in 2000.
d) … and the growth in employment-related immigration
One of the salient features of recent years hasbeen the rise in migration for employment pur-poses, both permanent and more particularly tem-porary. Between 1999 and 2000 this trend continued
and was in some cases accentuated. But it may bereversed in 2001 if the prospects of an economicslowdown in the United States materialise and ifsuch a slowdown spreads rapidly, as some fear, tothe other OECD Member countries.
The observed increase in worker migration isthe outcome of a combination of factors relating, onthe one hand, to the strong period of expansion atthe end of the 1990s and, on the other hand, to thedevelopment of the information technology sectorwhere some countries have experienced shortagesof skilled and highly skilled labour.
According to some estimates, there is a shortfallof some 850 000 IT technicians in the United Statesand nearly 2 million in Europe. Against this back-ground, countries are competing more keenly toattract the human resources that they lack and tokeep those likely to emigrate. Many countries havethus adjusted their rules in order to assist the admis-sion of skilled foreign workers (see Appendix at theend of Part I). Although these measures particularlyconcern new technology specialists, they also applyto other categories of skilled workers, more specifi-cally doctors, nurses and nursing assistants.
That is particularly the case in the United Stateswhere the quota for H1B visas, issued only to pro-fessionals and skilled workers, was increased by
Box I.2. The Kosovar refugees
In 1999 the Kosovo crisis resulted in substantial population movements, chiefly to the adjoining countries andregions but also to some more distant OECD Member countries. These movements compounded the effects of earliercrises in the Balkans which had greatly contributed to the increase in asylum applications and inflows of refugeesunder the Geneva Convention or with temporary protection status, in particular into OECD countries in Europe.
Several hundred thousand people were received on this basis, chiefly in Austria, Germany, Italy, Switzerland,the Nordic countries, the United States, Canada and Australia. UNHCR estimated that in all 841 000 Kosovars hadreturned by June 2000, chiefly from the adjoining areas. While voluntary return from Western Europe was gener-ally promoted by programmes of assistance for returnees, as from the first quarter of 2000 some countriesadopted more coercive measures. Switzerland, which had taken around 50 000 Kosovar refugees with temporarystatus, promoted the voluntary return of around 38 000 through substantial financial support and logistical assis-tance. All persons whose last domicile had been in Kosovo (with the exception of people from the Rom ethnicminority, and Serbs) were required to leave the country by 31 May 2000, or face expulsion.
The Nordic countries were also very active during the Kosovo crisis. Denmark took in nearly 3 000 refugeesand Norway 6 000 (along with Sweden – 4 000 and Finland – 1 000). By the end of 2000, around 2 800 Kosovars hadleft Denmark and 4 600 had left Norway. Of those who left the latter country, a little over 500 subsequentlyreturned. In all, 95% of the 4 000 Kosovar refugees admitted to Australia returned home. For the United Statesand Canada, which had taken in 14 000 and 8 000 Kosovars respectively in 1999, the rates of return are markedlylower since it is estimated that around 75% of them remain in the host countries.
Germany took in over around 150 000 Kosovars and Austria and Italy between 5 000 and 10 000 each. In theabsence of detailed information, the rate of return from these three countries cannot be determined at present.
© OECD 2001
Trends in International Migration
24
over 70% in 2000, to cover the next three fiscal years,with the annual quota for these visas rising from115 000 to 195 000. In Germany a special green cardprogramme was instituted to assist the temporaryrecruitment of 20 000 computer and IT specialists.The German authorities had initially announced theintention of recruiting Indian nationals, but at theend of the first year it turned out that most applica-tions were from nationals of central and easternEuropean countries. At that point, only 8 700 of the20 000 visas potentially available had been issued.
Since 1998 France has been applying a simpli-fied system for computer specialists, enablingregional labour authorities to issue work permits tothis category of foreign labour without reference to
the employment situation. The United Kingdomhas simplified and speeded up the work permitprocedure for a number of occupations, and hasextended the list of shortage occupations list.Australia has adjusted its points system for selec-tion and placed greater emphasis in particular onnew technology specialists. Canada is consideringreforming its selection system, one purpose beingto identify and rate the skills of immigration appli-cants more effectively.
There are some limitations, however, to thiswider use of foreign skills. The remuneration of for-eign workers must be the same as that of nationalswith the same qualifications. Reference to theemployment situation is waived in only a few cases.
Chart I.3. Trends in flows of asylum seekers from 1990 to 2000Inflows of asylum seekers during the given year relative to the biggest annual inflows during the period
Source: Refer to the notes for Table A.1.3 at the end of the Statistical Annex.
1.0
0.9
0.8
0.7
0.4
0.3
0.2
0
1990 1991 1992 1993 1994 1995 1996 1997 1998 1999 2000
1990 1991 1992 1993 1994 1995 1996 1997 1998 1999 2000
1990 1991 1992 1993 1994 1995 1996 1997 1998 1999 2000
1990 1991 1992 1993 1994 1995 1996 1997 1998 1999 2000
0.6
0.5
0.1
0
1.0
0.9
0.8
0.7
0.4
0.3
0.2
0.6
0.5
0.1
1.0
0.9
0.8
0.7
0.4
0.3
0.2
0
0.6
0.5
0.1
0
1.0
0.9
0.8
0.7
0.4
0.3
0.2
0.6
0.5
0.1
Belgium Ireland United Kingdom
France Italy
Norway Switzerland
Australia Canada
Denmark Netherlands
Germany Sweden United States
1.0
0.9
0.8
0.7
0.4
0.3
0.2
0
1990 1991 1992 1993 1994 1995 1996 1997 1998 1999 2000
1990 1991 1992 1993 1994 1995 1996 1997 1998 1999 2000
1990 1991 1992 1993 1994 1995 1996 1997 1998 1999 2000
1990 1991 1992 1993 1994 1995 1996 1997 1998 1999 2000
0.6
0.5
0.1
0
1.0
0.9
0.8
0.7
0.4
0.3
0.2
0.6
0.5
0.1
1.0
0.9
0.8
0.7
0.4
0.3
0.2
0
0.6
0.5
0.1
0
1.0
0.9
0.8
0.7
0.4
0.3
0.2
0.6
0.5
0.1
Belgium Ireland United Kingdom
France Italy
Norway Switzerland
Australia Canada
Denmark Netherlands
Germany Sweden United States
© OECD 2001
Main Trends in International Migration
25
There are minimum salary thresholds to be com-plied with, as in France and Germany for instance.Reforms to the education and training systems arealso under discussion in a number of OECD coun-tries affected by labour shortages in the new tech-nology sectors. Measures being set in train aredesigned to increase the supply of resident labourwith skills in this field over the medium term.
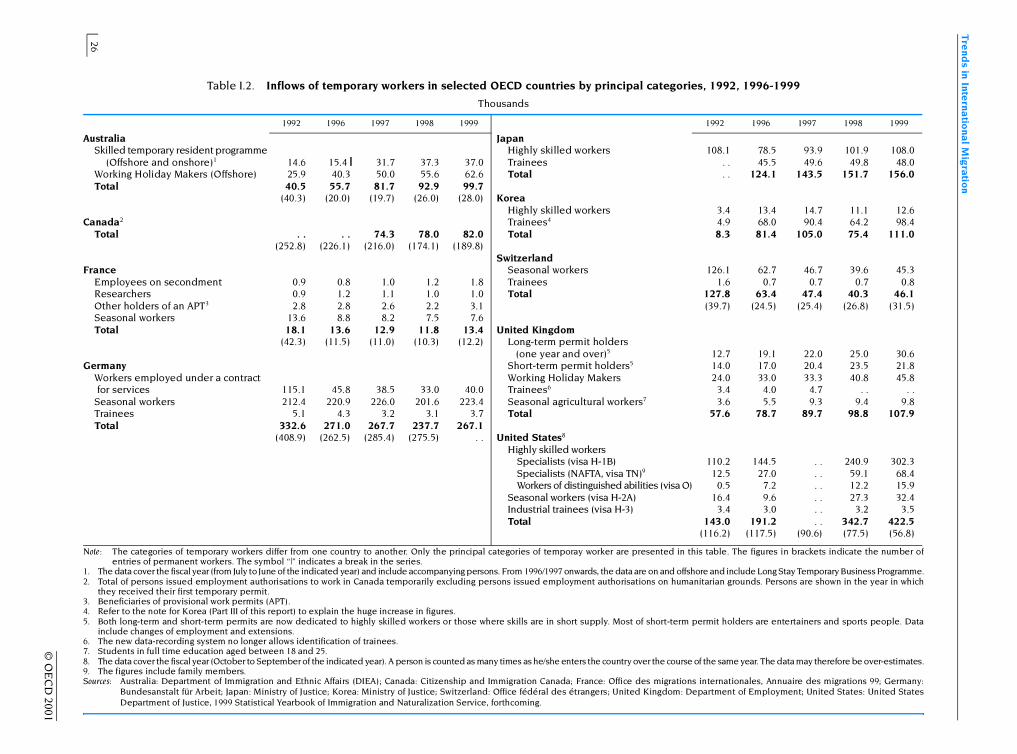
The rise in employment-related migration doesnot concern skilled workers alone and some OECDMember countries make extensive use of unskilledforeign labour, chiefly in agriculture, building andconstruction, and domestic services. That is the casein particular in Italy, Spain, Portugal, Greece and theUnited States. In certain countries, a substantial pro-portion of these foreign workers are illegals. Visasfor seasonal workers are also common and on theincrease in some Member countries, includingGermany (223 400 seasonal workers hired in 1999),Switzerland and the United States (46 100 and32 400 respectively. Lastly, Japan and Korea issue alarge number of temporary work visas to trainees,generally employed in industry and Australia andthe United Kingdom an increasing number of Work-ing Holiday Makers permits.
In fact, all categories of temporary employmentmigration rose between 1998 and 1999 (see Table I.2).Overall, the United States, where permanent admis-sions continue to fall, shows the sharpest increase intemporary employment visas. The rises are also sig-nificant in Australia and the United Kingdom.
e) Migration: a multi-faceted panorama
Along with the traditional triptych of familyimmigration, refugees and asylum seekers andemployment-related movements, whose maintrends were presented above, some more specificforms of mobility are developing. Aside from touristvisits, which do not constitute migration in theproper sense, and the seasonal and cross-bordermovements mentioned earlier, reference may bemade to transfers of staff within multinational firms,the temporary movements of skilled workers to pro-vide services, and the mobility of students, andretired persons electing to live abroad.
Student mobility is discussed in the specialsection in this report (see Part II). It is tending toincrease with the expansion of trade and is part ofthe globalisation process. Partly it is occuringbecause knowledge of languages is increasingly anessential for posts of responsibility and skilled jobs;
in addition, cultural experience acquired abroad isfrequently viewed as an additional advantage byemployers. What is more, higher education coursessuch as MBAs are more and more openly promotedon the world market and colleges and universitiesseek to attract a larger number of foreign studentsin order to bring in funds and raise their profile.Governments themselves sometimes foster theadmission of foreign students, in particular viascholarships and grants. Apart from the direct finan-cial benefit that enrolment fees bring to places ofhigher education, foreign students constitute apotential reserve of highly skilled labour that isfamiliar with the rules and practices prevailing in thehost country. A number of countries, includingSwitzerland, Germany and Australia, have recentlyrelaxed the rules for foreign students applying fordifferent visas in order to enter the labour market atthe end of their courses.
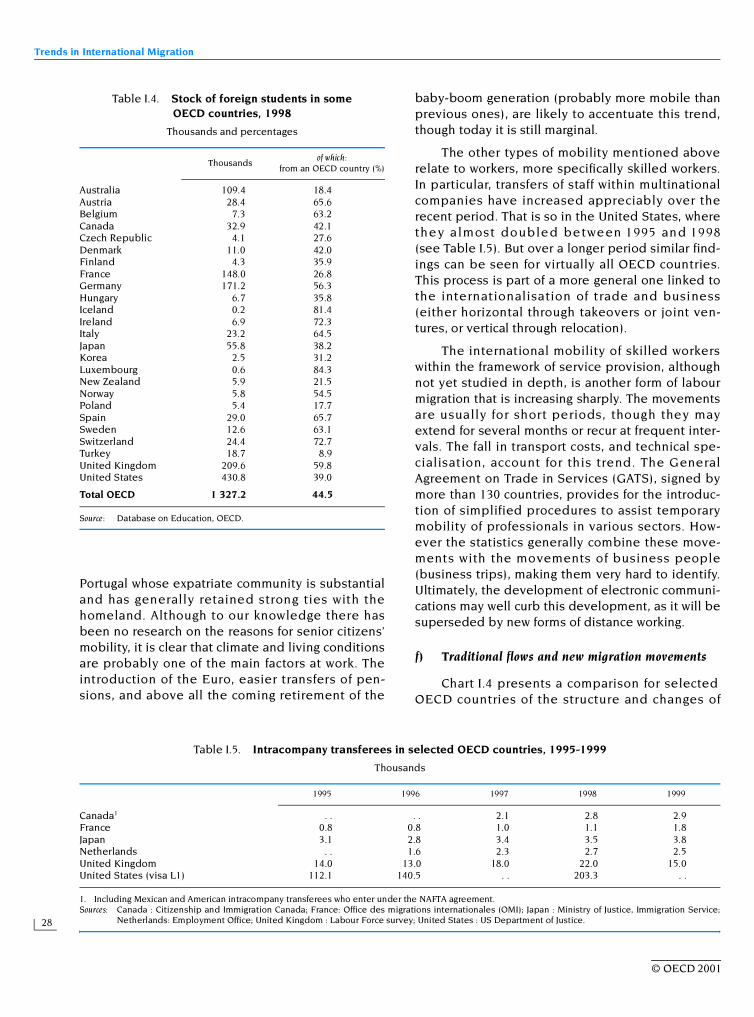
Numbers of foreign students are very high insome OECD Member countries. That is the case inthe United States in particular, but in the UnitedKingdom and Germany too: they had 430 000, 210 000and 171 000 foreign students respectively in 1998,tajubg all courses and levels together (see Table I.4).France and Australia each had over 100 000 foreignstudents as well. The proportion of OECD nationals,however, varies substantially from one country toanother (18% in Australia and 27% in France, asagainst 60% in the United Kingdom and 73% inSwitzerland). These disparities are partly due to thegeographical position of the host countries and theirhistory of migration, but also to strategies to attractforeign students (grants and scholarships, possibilityof entering the labour market, etc.) and some special-isation in particular sectors of education.
In North America the mobility of retired peoplehas been a long-standing feature, and in regionssuch as Florida the elderly are heavily over-represented. This trend is much less advanced inEurope, though it is on the increase and the mobil-ity of retired people is increasingly assuming aninternational dimension. For example it is estimatedthat, of the nearly 6 million European citizens resi-dent in an EU country other than their own, around900 000 are over age 60. A very high proportion ofthese are French (250 000), British (200 000), German(180 000) or Belgian (100 000). The majority of themsettle in Spain, Portugal, Greece or, to a lesserdegree, France. This development would be evenmore pronounced if we are able to include citizensreturning to their home country, in particular for
© OECD 2001
Tre
nds in Inte
rnatio
nal M
igration
26
© O
EC
D 2001
, 1996-1999
he figures in brackets indicate the number of
clude Long Stay Temporary Business Programme.ounds. Persons are shown in the year in which
ders are entertainers and sports people. Data
e year. The data may therefore be over-estimates.
onales, Annuaire des migrations 99; Germany: of Employment; United States: United States
1996 1997 1998 1999
78.5 93.9 101.9 108.045.5 49.6 49.8 48.0
124.1 143.5 151.7 156.0
13.4 14.7 11.1 12.668.0 90.4 64.2 98.481.4 105.0 75.4 111.0
62.7 46.7 39.6 45.30.7 0.7 0.7 0.8
63.4 47.4 40.3 46.1(24.5) (25.4) (26.8) (31.5)
19.1 22.0 25.0 30.617.0 20.4 23.5 21.833.0 33.3 40.8 45.84.0 4.7 . . . .5.5 9.3 9.4 9.8
78.7 89.7 98.8 107.9
144.5 . . 240.9 302.327.0 . . 59.1 68.47.2 . . 12.2 15.99.6 . . 27.3 32.43.0 . . 3.2 3.5
191.2 . . 342.7 422.5(117.5) (90.6) (77.5) (56.8)
Table I.2. Inflows of temporary workers in selected OECD countries by principal categories, 1992
Thousands
Note: The categories of temporary workers differ from one country to another. Only the principal categories of temporay worker are presented in this table. Tentries of permanent workers. The symbol “|” indicates a break in the series.
1. The data cover the fiscal year (from July to June of the indicated year) and include accompanying persons. From 1996/1997 onwards, the data are on and offshore and in2. Total of persons issued employment authorisations to work in Canada temporarily excluding persons issued employment authorisations on humanitarian gr
they received their first temporary permit.3. Beneficiaries of provisional work permits (APT).4. Refer to the note for Korea (Part III of this report) to explain the huge increase in figures.5. Both long-term and short-term permits are now dedicated to highly skilled workers or those where skills are in short supply. Most of short-term permit hol
include changes of employment and extensions.6. The new data-recording system no longer allows identification of trainees.7. Students in full time education aged between 18 and 25.8. The data cover the fiscal year (October to September of the indicated year). A person is counted as many times as he/she enters the country over the course of the sam9. The figures include family members.Sources: Australia: Department of Immigration and Ethnic Affairs (DIEA); Canada: Citizenship and Immigration Canada; France: Office des migrations internati
Bundesanstalt für Arbeit; Japan: Ministry of Justice; Korea: Ministry of Justice; Switzerland: Office fédéral des étrangers; United Kingdom: DepartmentDepartment of Justice, 1999 Statistical Yearbook of Immigration and Naturalization Service, forthcoming.
1992 1996 1997 1998 1999 1992
Australia JapanSkilled temporary resident programme Highly skilled workers 108.1
(Offshore and onshore)1 14.6 15.4 | 31.7 37.3 37.0 Trainees . .Working Holiday Makers (Offshore) 25.9 40.3 50.0 55.6 62.6 Total . .Total 40.5 55.7 81.7 92.9 99.7
(40.3) (20.0) (19.7) (26.0) (28.0) KoreaHighly skilled workers 3.4
Canada2 Trainees4 4.9Total . . . . 74.3 78.0 82.0 Total 8.3
(252.8) (226.1) (216.0) (174.1) (189.8)Switzerland
France Seasonal workers 126.1Employees on secondment 0.9 0.8 1.0 1.2 1.8 Trainees 1.6Researchers 0.9 1.2 1.1 1.0 1.0 Total 127.8Other holders of an APT3 2.8 2.8 2.6 2.2 3.1 (39.7)Seasonal workers 13.6 8.8 8.2 7.5 7.6Total 18.1 13.6 12.9 11.8 13.4 United Kingdom
(42.3) (11.5) (11.0) (10.3) (12.2) Long-term permit holders(one year and over)5 12.7
Germany Short-term permit holders5 14.0Workers employed under a contract Working Holiday Makers 24.0 for services 115.1 45.8 38.5 33.0 40.0 Trainees6 3.4Seasonal workers 212.4 220.9 226.0 201.6 223.4 Seasonal agricultural workers7 3.6Trainees 5.1 4.3 3.2 3.1 3.7 Total 57.6Total 332.6 271.0 267.7 237.7 267.1
(408.9) (262.5) (285.4) (275.5) . . United States8
Highly skilled workersSpecialists (visa H-1B) 110.2Specialists (NAFTA, visa TN)9 12.5Workers of distinguished abilities (visa O) 0.5
Seasonal workers (visa H-2A) 16.4Industrial trainees (visa H-3) 3.4Total 143.0
(116.2)
Main Trends in International Migration
27
Box I.3. More women in all forms of migration
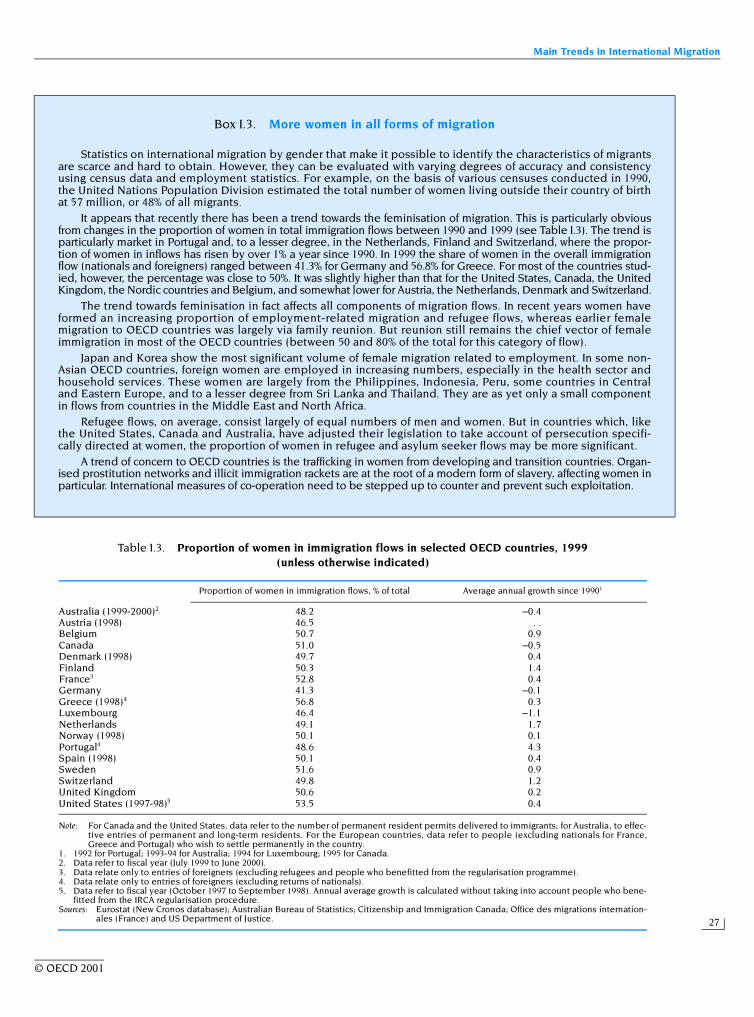
Statistics on international migration by gender that make it possible to identify the characteristics of migrantsare scarce and hard to obtain. However, they can be evaluated with varying degrees of accuracy and consistencyusing census data and employment statistics. For example, on the basis of various censuses conducted in 1990,the United Nations Population Division estimated the total number of women living outside their country of birthat 57 million, or 48% of all migrants.
It appears that recently there has been a trend towards the feminisation of migration. This is particularly obviousfrom changes in the proportion of women in total immigration flows between 1990 and 1999 (see Table I.3). The trend isparticularly market in Portugal and, to a lesser degree, in the Netherlands, Finland and Switzerland, where the propor-tion of women in inflows has risen by over 1% a year since 1990. In 1999 the share of women in the overall immigrationflow (nationals and foreigners) ranged between 41.3% for Germany and 56.8% for Greece. For most of the countries stud-ied, however, the percentage was close to 50%. It was slightly higher than that for the United States, Canada, the UnitedKingdom, the Nordic countries and Belgium, and somewhat lower for Austria, the Netherlands, Denmark and Switzerland.
The trend towards feminisation in fact affects all components of migration flows. In recent years women haveformed an increasing proportion of employment-related migration and refugee flows, whereas earlier femalemigration to OECD countries was largely via family reunion. But reunion still remains the chief vector of femaleimmigration in most of the OECD countries (between 50 and 80% of the total for this category of flow).
Japan and Korea show the most significant volume of female migration related to employment. In some non-Asian OECD countries, foreign women are employed in increasing numbers, especially in the health sector andhousehold services. These women are largely from the Philippines, Indonesia, Peru, some countries in Centraland Eastern Europe, and to a lesser degree from Sri Lanka and Thailand. They are as yet only a small componentin flows from countries in the Middle East and North Africa.
Refugee flows, on average, consist largely of equal numbers of men and women. But in countries which, likethe United States, Canada and Australia, have adjusted their legislation to take account of persecution specifi-cally directed at women, the proportion of women in refugee and asylum seeker flows may be more significant.
A trend of concern to OECD countries is the trafficking in women from developing and transition countries. Organ-ised prostitution networks and illicit immigration rackets are at the root of a modern form of slavery, affecting women inparticular. International measures of co-operation need to be stepped up to counter and prevent such exploitation.
Table I.3. Proportion of women in immigration flows in selected OECD countries, 1999 (unless otherwise indicated)
Note: For Canada and the United States, data refer to the number of permanent resident permits delivered to immigrants; for Australia, to effec-tive entries of permanent and long-term residents. For the European countries, data refer to people (excluding nationals for France,Greece and Portugal) who wish to settle permanently in the country.
1. 1992 for Portugal; 1993-94 for Australia; 1994 for Luxembourg; 1995 for Canada.2. Data refer to fiscal year (July 1999 to June 2000).3. Data relate only to entries of foreigners (excluding refugees and people who benefitted from the regularisation programme).4. Data relate only to entries of foreigners (excluding returns of nationals).5. Data refer to fiscal year (October 1997 to September 1998). Annual average growth is calculated without taking into account people who bene-
fitted from the IRCA regularisation procedure.Sources: Eurostat (New Cronos database); Australian Bureau of Statistics; Citizenship and Immigration Canada; Office des migrations internation-
ales (France) and US Department of Justice.
Proportion of women in immigration flows, % of total Average annual growth since 19901
Australia (1999-2000)2 48.2 –0.4Austria (1998) 46.5 . .Belgium 50.7 0.9Canada 51.0 –0.5Denmark (1998) 49.7 0.4Finland 50.3 1.4France3 52.8 0.4Germany 41.3 –0.1Greece (1998)4 56.8 0.3Luxembourg 46.4 –1.1Netherlands 49.1 1.7Norway (1998) 50.1 0.1Portugal4 48.6 4.3Spain (1998) 50.1 0.4Sweden 51.6 0.9Switzerland 49.8 1.2United Kingdom 50.6 0.2United States (1997-98)5 53.5 0.4
© OECD 2001
Trends in International Migration
28
Portugal whose expatriate community is substantialand has generally retained strong ties with thehomeland. Although to our knowledge there hasbeen no research on the reasons for senior citizens’mobility, it is clear that climate and living conditionsare probably one of the main factors at work. Theintroduction of the Euro, easier transfers of pen-sions, and above all the coming retirement of the
baby-boom generation (probably more mobile thanprevious ones), are likely to accentuate this trend,though today it is still marginal.
The other types of mobility mentioned aboverelate to workers, more specifically skilled workers.In particular, transfers of staff within multinationalcompanies have increased appreciably over therecent period. That is so in the United States, wherethey a lmost doubled between 1995 and 1998(see Table I.5). But over a longer period similar find-ings can be seen for virtually all OECD countries.This process is part of a more general one linked tothe internationalisation of trade and business(either horizontal through takeovers or joint ven-tures, or vertical through relocation).
The international mobility of skilled workerswithin the framework of service provision, althoughnot yet studied in depth, is another form of labourmigration that is increasing sharply. The movementsare usually for short periods, though they mayextend for several months or recur at frequent inter-vals. The fall in transport costs, and technical spe-cialisation, account for this trend. The GeneralAgreement on Trade in Services (GATS), signed bymore than 130 countries, provides for the introduc-tion of simplified procedures to assist temporarymobility of professionals in various sectors. How-ever the statistics generally combine these move-ments with the movements of business people(business trips), making them very hard to identify.Ultimately, the development of electronic communi-cations may well curb this development, as it will besuperseded by new forms of distance working.
f) Traditional flows and new migration movements
Chart I.4 presents a comparison for selectedOECD countries of the structure and changes of
Table I.4. Stock of foreign students in some OECD countries, 1998
Thousands and percentages
Source: Database on Education, OECD.
Thousandsof which:
from an OECD country (%)
Australia 109.4 18.4Austria 28.4 65.6Belgium 7.3 63.2Canada 32.9 42.1Czech Republic 4.1 27.6Denmark 11.0 42.0Finland 4.3 35.9France 148.0 26.8Germany 171.2 56.3Hungary 6.7 35.8Iceland 0.2 81.4Ireland 6.9 72.3Italy 23.2 64.5Japan 55.8 38.2Korea 2.5 31.2Luxembourg 0.6 84.3New Zealand 5.9 21.5Norway 5.8 54.5Poland 5.4 17.7Spain 29.0 65.7Sweden 12.6 63.1Switzerland 24.4 72.7Turkey 18.7 8.9United Kingdom 209.6 59.8United States 430.8 39.0
Total OECD 1 327.2 44.5
Table I.5. Intracompany transferees in selected OECD countries, 1995-1999
Thousands
1. Including Mexican and American intracompany transferees who enter under the NAFTA agreement.Sources: Canada : Citizenship and Immigration Canada; France: Office des migrations internationales (OMI); Japan : Ministry of Justice, Immigration Service;
Netherlands: Employment Office; United Kingdom : Labour Force survey; United States : US Department of Justice.
1995 1996 1997 1998 1999
Canada1 . . . . 2.1 2.8 2.9France 0.8 0.8 1.0 1.1 1.8Japan 3.1 2.8 3.4 3.5 3.8Netherlands . . 1.6 2.3 2.7 2.5United Kingdom 14.0 13.0 18.0 22.0 15.0United States (visa L1) 112.1 140.5 . . 203.3 . .
© OECD 2001
Main Trends in International Migration
29
Chart I.4. Change in inflows of migrants by country of origin to selected OECD countries, 1990-1998 and 19991999 top ten countries of origin as a per cent of total inflows1
201510502015105020151050
201510502015105020151050
201510502015105020151050
201510502015105020151050
201510502015105020151050
201510502015105020151050
47.4 (90-98)39.9 (99)
Belgium Canada Denmark
Italy Netherlands Norway
France4 Germany Hungary
19993
France (7.9)
Netherlands (6.2)
Morocco (4.9)
Fed. Rep. of Yug. (4.8)
Germany (3.1)
United Kingdom (3)
United States (2.9)
Italy (2.6)
Bosnia Herzegovina (2.2)
Turkey (2.1)
China (29.1)
India (17.4)
Pakistan (9.3)
Philippines (9.2)
Korea (7.2)
Iran (5.9)
United States (5.5)
Chinese Taipei (5.5)
Sri Lanka (4.7)
United Kingdom (4.5)
Iraq (2.3)
Somalia (1.2)
Germany (1.2)
Turkey (1.2)
Norway (1.1)
Sweden (1)
United Kingdom (1)
Iceland (0.7)
Former Yug. (0.6)
United States (0.6)
Morocco (14.1)
Algeria (11.4)
Turkey (5.7)
Tunisia (4)
United States (2.7)
China (1.7)
Dem. Rep. of Congo (1.5)
Japan (1.4)
Haiti (1.4)
Fed. Rep. of Yug. (1.4)
Fed. Rep. of Yug. (87.8)
Poland (72.2)
Turkey (47.1)
Italy (34.9)
Russian Fed. (27.8)
Romania (18.8)
Greece (17.6)
United States (16.8)
Ukraine (15.3)
France (15.3)
Romania (6)
Former Yug. (1.7)
Ukraine (1.6)
China (1)
Germany (0.7)
Russian Fed. (0.4)
Slovak Rep. (0.3)
Vietnam (0.3)
Israel (0.2)
United Kingdom (0.1)
Albania (37.2)
Morocco (24.9)
Fed. Rep. of Yug. (24.5)
Romania (20.9)
China (11)
Former CSFR (7.6)
Senegal (7.4)
Poland (6.7)
Egypt (6.1)
Tunisia (5.8)
United Kingdom (5)
Germany (4.5)
Morocco (4.4)
Turkey (4.2)
United States (3.3)
France (2)
Belgium (2)
Surinam (1.8)
Italy (1.5)
Japan (1.3)
Former Yug. (6.5)5
Sweden (4.5)
Iraq (2.1)
Denmark (1.8)
Somalia (1.2)
Germany (1.1)
United Kingdom (1)
Russian Fed. (0.8)
United States (0.7)
Iran (0.7)
1990-1998 annual average2
201510502015105020151050
201510502015105020151050
201510502015105020151050
201510502015105020151050
201510502015105020151050
201510502015105020151050
47.4 (90-98)39.9 (99)
Belgium Canada Denmark
Italy Netherlands Norway
France4 Germany Hungary
19993
France (7.9)
Netherlands (6.2)
Morocco (4.9)
Fed. Rep. of Yug. (4.8)
Germany (3.1)
United Kingdom (3)
United States (2.9)
Italy (2.6)
Bosnia Herzegovina (2.2)
Turkey (2.1)
China (29.1)
India (17.4)
Pakistan (9.3)
Philippines (9.2)
Korea (7.2)
Iran (5.9)
United States (5.5)
Chinese Taipei (5.5)
Sri Lanka (4.7)
United Kingdom (4.5)
Iraq (2.3)
Somalia (1.2)
Germany (1.2)
Turkey (1.2)
Norway (1.1)
Sweden (1)
United Kingdom (1)
Iceland (0.7)
Former Yug. (0.6)
United States (0.6)
Morocco (14.1)
Algeria (11.4)
Turkey (5.7)
Tunisia (4)
United States (2.7)
China (1.7)
Dem. Rep. of Congo (1.5)
Japan (1.4)
Haiti (1.4)
Fed. Rep. of Yug. (1.4)
Fed. Rep. of Yug. (87.8)
Poland (72.2)
Turkey (47.1)
Italy (34.9)
Russian Fed. (27.8)
Romania (18.8)
Greece (17.6)
United States (16.8)
Ukraine (15.3)
France (15.3)
Romania (6)
Former Yug. (1.7)
Ukraine (1.6)
China (1)
Germany (0.7)
Russian Fed. (0.4)
Slovak Rep. (0.3)
Vietnam (0.3)
Israel (0.2)
United Kingdom (0.1)
Albania (37.2)
Morocco (24.9)
Fed. Rep. of Yug. (24.5)
Romania (20.9)
China (11)
Former CSFR (7.6)
Senegal (7.4)
Poland (6.7)
Egypt (6.1)
Tunisia (5.8)
United Kingdom (5)
Germany (4.5)
Morocco (4.4)
Turkey (4.2)
United States (3.3)
France (2)
Belgium (2)
Surinam (1.8)
Italy (1.5)
Japan (1.3)
Former Yug. (6.5)5
Sweden (4.5)
Iraq (2.1)
Denmark (1.8)
Somalia (1.2)
Germany (1.1)
United Kingdom (1)
Russian Fed. (0.8)
United States (0.7)
Iran (0.7)
1990-1998 annual average2
© OECD 2001
Trends in International Migration
30
Chart I.4. Change in inflows of migrants by country of origin to selected OECD countries, 1990-1998 and 1999 (cont.)
1999 top ten countries of origin as a per cent of total inflows1
Note: The top 10 source countries are presented by decreasing order. Data for Australia, Canada and the United States refer to inflows of permanent settlers bycountry of birth, for France, Italy and Portugal to issues of certain types of permits. For the United Kingdom, the data are based on entry control at ports ofcertain categories of migrants. For all other countries, figures are from Population registers or Registers of foreigners. The figures for the Netherlands,Norway and especially Germany include substantial numbers of asylum seekers.
1. The figures in brackets are inflows in thousands in 1999.2. Annual average flows for the period 1990-1998 except for Australia (1990-1999), Denmark and the United States (1990-1997), Finland, Portugal and the
United Kingdom (1992-1998).3. 1998 for Denmark and the United States; 2000 for Australia.4. Data do not include EU citizens.5. Excluding Bosnia Herzegovina from 1993 onwards.6. Passengers, excluding European Economic Area nationals, admitted to the United Kingdom. Data only include certain categories of migrants: work permit
holders, spouses and refugees (excluding residents returning on limiting leave or who previously settled).Source: National Statistical Offices. For more details on sources, refer to the introduction to the Statistical Annex.
25151050 20
25151050 20
20151050
20151050
20151050
20151050
20151050
20151050
25151050 20
25151050 20
25151050 20
25151050 20
30201050 2515
30201050 2515
30201050 2515
30201050 2515
30201050 2515
30201050 2515
Australia Finland Portugal
199931990-1998 annual average2
Luxembourg
Russian Fed. (2.2)
Sweden (0.7)
Estonia (0.6)
Fed. Rep. of Yug. (0.4)
Iraq (0.3)
Iran (0.3)
United States (0.2)
United Kingdom (0.2)
Germany (0.2)
China (0.2)
France (2.2)
Portugal (2.1)
Belgium (1.3)
Germany (0.7)
United States (0.2)
Netherlands (0.2)
Spain (0.1)
Italy (0.1)
United States
Mexico (131.6)
China (36.9)
India (36.5)
Philippines (34.5)
Dominic. Rep. (20.4)
Vietnam (17.6)
Cuba (17.4)
Jamaica (15.1)
El Salvador (14.6)
Korea (14.3)
Brazil (1.2)
Spain (1)
Guinea-Bissau (1)
Cape Verde (1)
Angola (0.9)
Germany (0.8)
United Kingdom (0.7)
France (0.7)
Italy (0.4)
Netherlands (0.4)
Iraq (5.5)
Finland (3.4)
Norway (2)
Denmark (1.3)
Former Yug. (1.2)
Germany (1.1)
United Kingdom (1)
Iran (1)
United States (1)
Russian Fed. (1)
Japan
New Zealand (21.9)
United Kingdom (9.2)
China (6.8)
South Africa (5.7)
India (4.6)
Philippines (3.2)
Fed. Rep. of Yug. (2.2)
Fiji (1.9)
Chinese Taipei (1.7)
Vietnam (1.5)
China (59.1)
Philippines (57.3)
Brazil (26.1)
United States (24.7)
Korea (23.1)
United Kingdom (7)
Thailand (6.4)
Chinese Taipei (4.4)
Canada (4.2)
Germany (3.4)
Switzerland
Former Yug. (12.6)
Germany (11)
France (6.2)
Italy (6)
Portugal (5)
United Kingdom (3.4)
United States (3.2)
Turkey (3)
Spain (1.6)
Austria (1.5)
Sweden
United States (44.8)
Australia (33.4)
South Africa (24.1)
India (19.6)
New Zealand (15.8)
Canada (10.8)
Japan (10.7)
Pakistan (8.9)
Philippines (8.1)
Poland (5.7)
United Kingdom6
25151050 20
25151050 20
20151050
20151050
20151050
20151050
20151050
20151050
25151050 20
25151050 20
25151050 20
25151050 20
30201050 2515
30201050 2515
30201050 2515
30201050 2515
30201050 2515
30201050 2515
Australia Finland Portugal
199931990-1998 annual average2
Luxembourg
Russian Fed. (2.2)
Sweden (0.7)
Estonia (0.6)
Fed. Rep. of Yug. (0.4)
Iraq (0.3)
Iran (0.3)
United States (0.2)
United Kingdom (0.2)
Germany (0.2)
China (0.2)
France (2.2)
Portugal (2.1)
Belgium (1.3)
Germany (0.7)
United States (0.2)
Netherlands (0.2)
Spain (0.1)
Italy (0.1)
United States
Mexico (131.6)
China (36.9)
India (36.5)
Philippines (34.5)
Dominic. Rep. (20.4)
Vietnam (17.6)
Cuba (17.4)
Jamaica (15.1)
El Salvador (14.6)
Korea (14.3)
Brazil (1.2)
Spain (1)
Guinea-Bissau (1)
Cape Verde (1)
Angola (0.9)
Germany (0.8)
United Kingdom (0.7)
France (0.7)
Italy (0.4)
Netherlands (0.4)
Iraq (5.5)
Finland (3.4)
Norway (2)
Denmark (1.3)
Former Yug. (1.2)
Germany (1.1)
United Kingdom (1)
Iran (1)
United States (1)
Russian Fed. (1)
Japan
New Zealand (21.9)
United Kingdom (9.2)
China (6.8)
South Africa (5.7)
India (4.6)
Philippines (3.2)
Fed. Rep. of Yug. (2.2)
Fiji (1.9)
Chinese Taipei (1.7)
Vietnam (1.5)
China (59.1)
Philippines (57.3)
Brazil (26.1)
United States (24.7)
Korea (23.1)
United Kingdom (7)
Thailand (6.4)
Chinese Taipei (4.4)
Canada (4.2)
Germany (3.4)
Switzerland
Former Yug. (12.6)
Germany (11)
France (6.2)
Italy (6)
Portugal (5)
United Kingdom (3.4)
United States (3.2)
Turkey (3)
Spain (1.6)
Austria (1.5)
Sweden
United States (44.8)
Australia (33.4)
South Africa (24.1)
India (19.6)
New Zealand (15.8)
Canada (10.8)
Japan (10.7)
Pakistan (8.9)
Philippines (8.1)
Poland (5.7)
United Kingdom6
© OECD 2001
Main Trends in International Migration
31
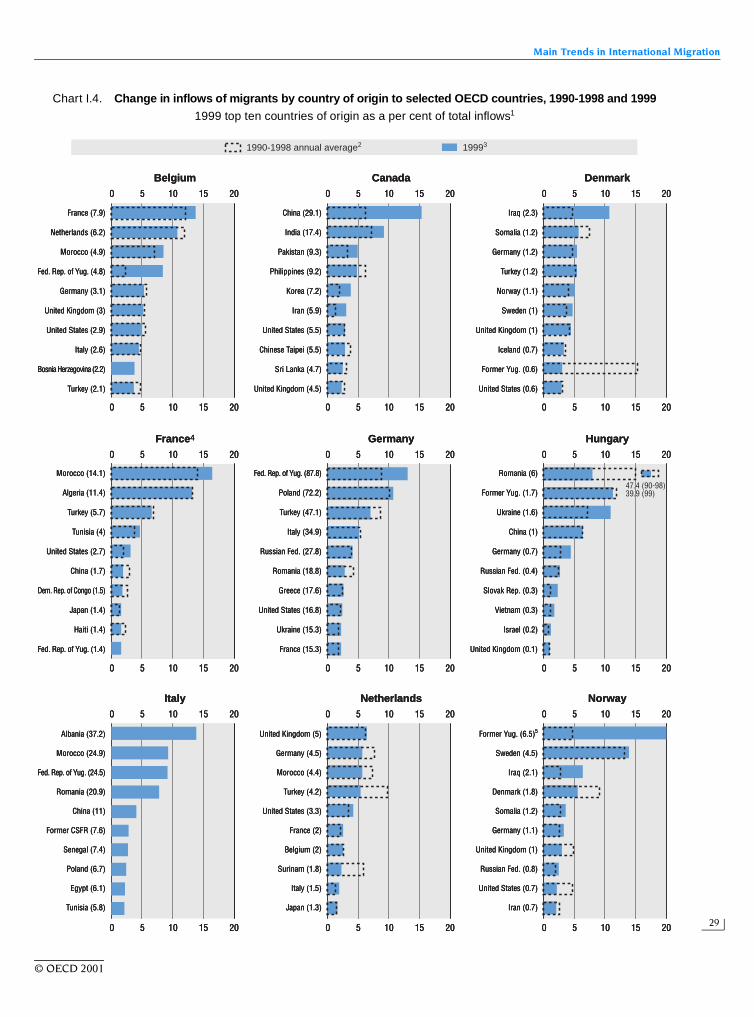
inflows from the principal countries of origin. Threedistinctive trends can be observed in 1999. The firstis the predominance of one or two origin countries.They are often neighbouring countries (New Zealandfor Australia, France and the Netherlands for Belgium,Mexico for the United States, Russia for Finland,Romania for Hungary, Albania for Italy, China and thePhilippines for Japan, and Sweden for Norway). Theymay also be countries from which large numbers ofrefugees have come (Iraq in the case of Sweden andDenmark, and the former Yugoslavia for Germany,Switzerland and Norway). In 1999, the five main send-ing countries accounted for more than 60% of all flowsin Hungary and Japan, but less than one-third inDenmark and the Netherlands.
In the case of Germany, Finland, Italy andHungary, and to a lesser extent Switzerland andNorway, East-West flows account for the greater part ofthe total flows, with nationals of the former Yugoslavia(including large numbers of Kosovars in 1999,see above) and Poland in Germany, Romanians inHungary, Albanians in Italy and nationals of theformer Soviet Union in Finland. Elsewhere, as inAustralia, Canada, Japan and the United States, thelong-standing predominance of migration flows fromAsian countries is also worthy of note.
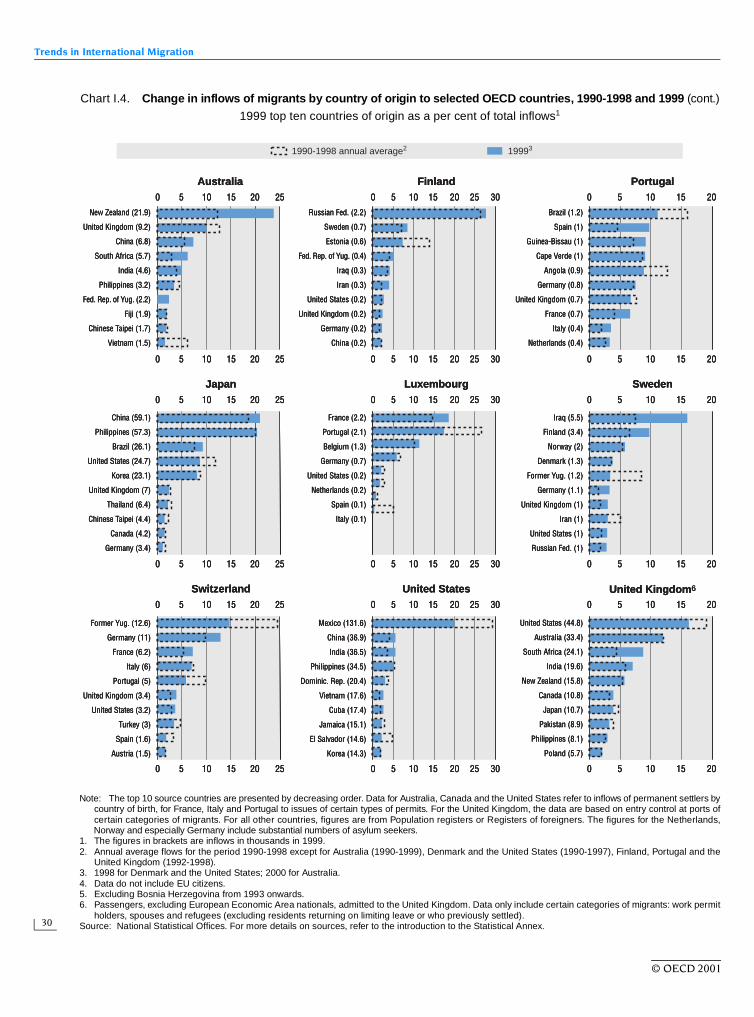
The second trend concerns the diversity of situ-ations across OECD countries as regards the main ori-gin countries of immigrants. French and Portugueseform by far the largest groups in Luxembourg,nationals of the Maghreb countries in France,Mexicans in the United States, nationals of theformer Yugoslavia in Switzerland, those of theUnited States in the United Kingdom and NewZealanders in Australia. However, in the ranking ofthe top ten origin countries, some nationalities arepresent in a large number of the host countries con-sidered, such as – in descending order – nationals ofthe United States (found in the classification of mainentries by nationality in 13 of the 17 host countries),the United Kingdom (12), Germany (11), the formerYugoslavia (11) and China (8).
The third distinctive characteristic concerns thepersistence of traditional flows and the continuinggrowth of recently emerging flows. Chart I.4 showsaverage inflows over the 1990s (dotted) togetherwith those for the last available year (shaded), mak-ing it possible to compare these two trends. For agiven host country, when an unshaded area isshown, this indicates that the share attributed tothis origin countries in overall flows is lower for thelast available year than it was on average during the
decade. For example, while Brazil continues to bethe leading source of immigration to Portugal, theproportion of Brazilians in overall flows has fallen bynearly 30%. A similar trend is observed for Vietnam-ese and British nationals in Australia, Estonians inFinland, nationals of Surinam and Turks in theNetherlands, United States citizens in Japan and theUnited Kingdom, Portuguese in Switzerland andMexicans in the United States.
Leaving aside nationals of the former Yugoslavia,the nationality breakdown of immigration has beenrelatively stable in Belgium, France, Finland, Japanand Luxembourg. But other countries, includingAustralia, Canada and Portugal, report substantialchanges in the make-up of immigrants.
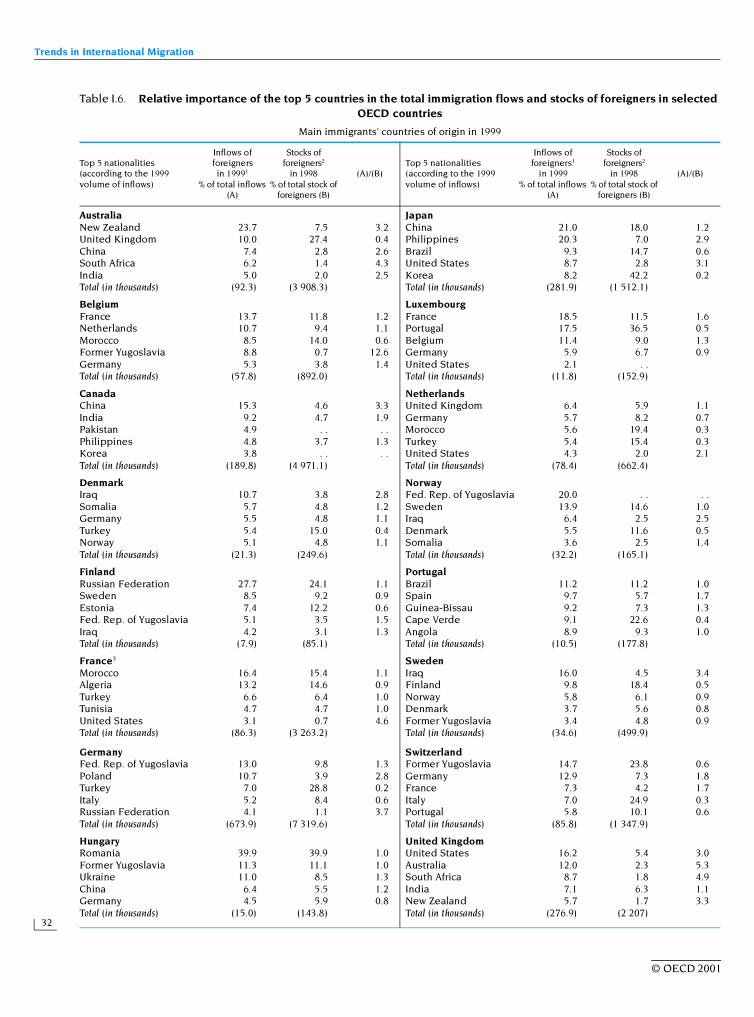
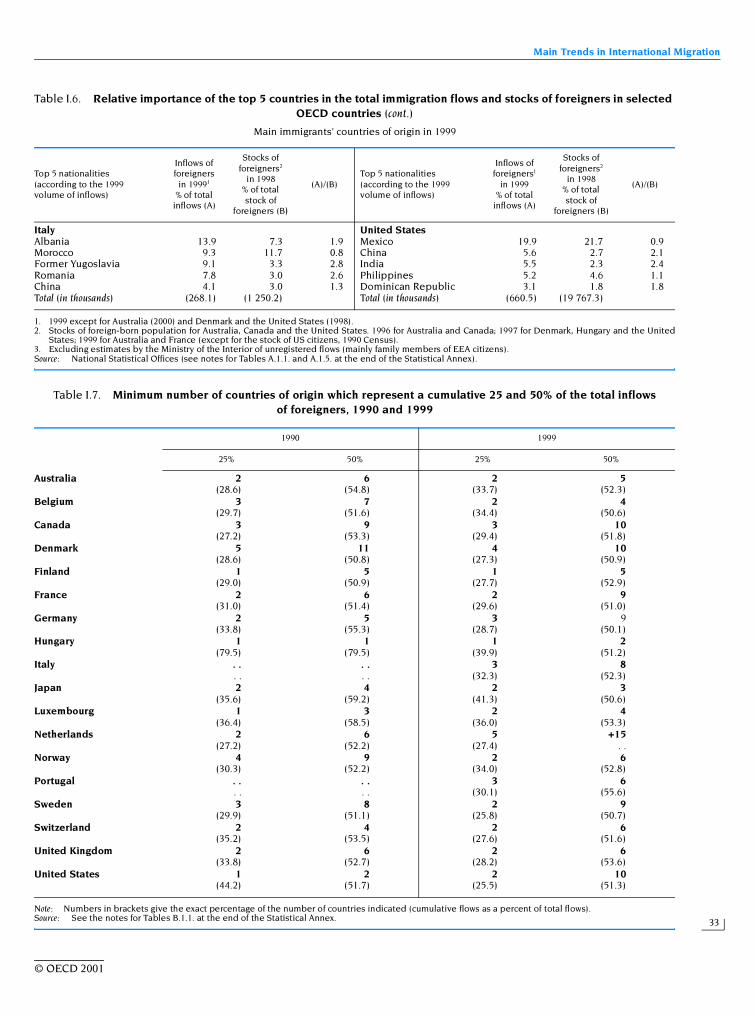
Table I.6 illustrates the emergence of newmigration flows. A specific indicator has been con-structed for this purpose. It is calculated by divid-ing, for each host country considered, the five mainsending countries’ share in total inflows of 1999 bytheir share of the total of foreigners or foreign-born.Thus, a value of 1 for a given sending country meansthat its share in inflows is the same as its share inthe number of foreigners as a whole. This is the casefor nationals of the Federal Republic of Yugoslaviain Germany and for nationals of Brazil in Portugal. Ifthe value is greater than 1, this can be due either toimmigrants from an emerging source country, or toprevious waves of immigration which though persis-tent have had little impact on the total number offoreigners from this country. In the case of Australiaand the United Kingdom, for example, the indicatoris especially high for South African nationals sincetheir share of inflows is over four times their share inthe total number of foreigners. The presence of NewZealanders in Australia and Swedes in Norway is notthe result of a recent wave of immigration but proba-bly indicates sizeable new inflows accompanied bylarger outflows, and thus the indicator in the rangeof 3 in these two cases corresponds to an old waveof migration that has a significant to-and-fro compo-nent or a high turnover. It seems that the same rea-soning can be applied to the case of Poles inGermany, for whom the indicator is 2.8.
Four countries of origin stand out and illustratethe emergence of new migration routes into OECDcountries. They are China, India, Iraq and the UnitedStates. In the flows of immigrants to the Nordiccountries (chiefly Denmark, Norway and Sweden)Iraq systematically figures with an indicator of over 2,meaning that its nationals are represented at leasttwice as much in immigration flows as in the total of
© OECD 2001
Trends in International Migration
32
Table I.6. Relative importance of the top 5 countries in the total immigration flows and stocks of foreigners in selected OECD countries
Main immigrants’ countries of origin in 1999
Top 5 nationalities (according to the 1999 volume of inflows)
Inflows of foreigners in 19991
% of total inflows (A)
Stocks of foreigners2
in 1998% of total stock of
foreigners (B)
(A)/(B)Top 5 nationalities (according to the 1999 volume of inflows)
Inflows of foreigners1
in 1999% of total inflows
(A)
Stocks of foreigners2
in 1998% of total stock of
foreigners (B)
(A)/(B)
Australia JapanNew Zealand 23.7 7.5 3.2 China 21.0 18.0 1.2United Kingdom 10.0 27.4 0.4 Philippines 20.3 7.0 2.9China 7.4 2.8 2.6 Brazil 9.3 14.7 0.6South Africa 6.2 1.4 4.3 United States 8.7 2.8 3.1India 5.0 2.0 2.5 Korea 8.2 42.2 0.2Total (in thousands) (92.3) (3 908.3) Total (in thousands) (281.9) (1 512.1)
Belgium LuxembourgFrance 13.7 11.8 1.2 France 18.5 11.5 1.6Netherlands 10.7 9.4 1.1 Portugal 17.5 36.5 0.5Morocco 8.5 14.0 0.6 Belgium 11.4 9.0 1.3Former Yugoslavia 8.8 0.7 12.6 Germany 5.9 6.7 0.9Germany 5.3 3.8 1.4 United States 2.1 . .Total (in thousands) (57.8) (892.0) Total (in thousands) (11.8) (152.9)
Canada NetherlandsChina 15.3 4.6 3.3 United Kingdom 6.4 5.9 1.1India 9.2 4.7 1.9 Germany 5.7 8.2 0.7Pakistan 4.9 . . . . Morocco 5.6 19.4 0.3Philippines 4.8 3.7 1.3 Turkey 5.4 15.4 0.3Korea 3.8 . . . . United States 4.3 2.0 2.1Total (in thousands) (189.8) (4 971.1) Total (in thousands) (78.4) (662.4)
Denmark NorwayIraq 10.7 3.8 2.8 Fed. Rep. of Yugoslavia 20.0 . . . .Somalia 5.7 4.8 1.2 Sweden 13.9 14.6 1.0Germany 5.5 4.8 1.1 Iraq 6.4 2.5 2.5Turkey 5.4 15.0 0.4 Denmark 5.5 11.6 0.5Norway 5.1 4.8 1.1 Somalia 3.6 2.5 1.4Total (in thousands) (21.3) (249.6) Total (in thousands) (32.2) (165.1)
Finland PortugalRussian Federation 27.7 24.1 1.1 Brazil 11.2 11.2 1.0Sweden 8.5 9.2 0.9 Spain 9.7 5.7 1.7Estonia 7.4 12.2 0.6 Guinea-Bissau 9.2 7.3 1.3Fed. Rep. of Yugoslavia 5.1 3.5 1.5 Cape Verde 9.1 22.6 0.4Iraq 4.2 3.1 1.3 Angola 8.9 9.3 1.0Total (in thousands) (7.9) (85.1) Total (in thousands) (10.5) (177.8)
France3 SwedenMorocco 16.4 15.4 1.1 Iraq 16.0 4.5 3.4Algeria 13.2 14.6 0.9 Finland 9.8 18.4 0.5Turkey 6.6 6.4 1.0 Norway 5.8 6.1 0.9Tunisia 4.7 4.7 1.0 Denmark 3.7 5.6 0.8United States 3.1 0.7 4.6 Former Yugoslavia 3.4 4.8 0.9Total (in thousands) (86.3) (3 263.2) Total (in thousands) (34.6) (499.9)
Germany SwitzerlandFed. Rep. of Yugoslavia 13.0 9.8 1.3 Former Yugoslavia 14.7 23.8 0.6Poland 10.7 3.9 2.8 Germany 12.9 7.3 1.8Turkey 7.0 28.8 0.2 France 7.3 4.2 1.7Italy 5.2 8.4 0.6 Italy 7.0 24.9 0.3Russian Federation 4.1 1.1 3.7 Portugal 5.8 10.1 0.6Total (in thousands) (673.9) (7 319.6) Total (in thousands) (85.8) (1 347.9)
Hungary United KingdomRomania 39.9 39.9 1.0 United States 16.2 5.4 3.0Former Yugoslavia 11.3 11.1 1.0 Australia 12.0 2.3 5.3Ukraine 11.0 8.5 1.3 South Africa 8.7 1.8 4.9China 6.4 5.5 1.2 India 7.1 6.3 1.1Germany 4.5 5.9 0.8 New Zealand 5.7 1.7 3.3Total (in thousands) (15.0) (143.8) Total (in thousands) (276.9) (2 207)
© OECD 2001
Main Trends in International Migration
33
Table I.6. Relative importance of the top 5 countries in the total immigration flows and stocks of foreigners in selected OECD countries (cont.)
Main immigrants’ countries of origin in 1999
1. 1999 except for Australia (2000) and Denmark and the United States (1998).2. Stocks of foreign-born population for Australia, Canada and the United States. 1996 for Australia and Canada; 1997 for Denmark, Hungary and the United
States; 1999 for Australia and France (except for the stock of US citizens, 1990 Census).3. Excluding estimates by the Ministry of the Interior of unregistered flows (mainly family members of EEA citizens).Source: National Statistical Offices (see notes for Tables A.1.1. and A.1.5. at the end of the Statistical Annex).
Top 5 nationalities (according to the 1999 volume of inflows)
Inflows of foreigners
in 19991
% of total inflows (A)
Stocks of foreigners2
in 1998% of total stock of
foreigners (B)
(A)/(B)Top 5 nationalities (according to the 1999 volume of inflows)
Inflows of foreigners1
in 1999% of total
inflows (A)
Stocks of foreigners2
in 1998% of total stock of
foreigners (B)
(A)/(B)
Italy United StatesAlbania 13.9 7.3 1.9 Mexico 19.9 21.7 0.9Morocco 9.3 11.7 0.8 China 5.6 2.7 2.1Former Yugoslavia 9.1 3.3 2.8 India 5.5 2.3 2.4Romania 7.8 3.0 2.6 Philippines 5.2 4.6 1.1China 4.1 3.0 1.3 Dominican Republic 3.1 1.8 1.8Total (in thousands) (268.1) (1 250.2) Total (in thousands) (660.5) (19 767.3)
Table I.7. Minimum number of countries of origin which represent a cumulative 25 and 50% of the total inflows of foreigners, 1990 and 1999
Note: Numbers in brackets give the exact percentage of the number of countries indicated (cumulative flows as a percent of total flows).Source: See the notes for Tables B.1.1. at the end of the Statistical Annex.
1990 1999
25% 50% 25% 50%
Australia 2 6 2 5(28.6) (54.8) (33.7) (52.3)
Belgium 3 7 2 4(29.7) (51.6) (34.4) (50.6)
Canada 3 9 3 10(27.2) (53.3) (29.4) (51.8)
Denmark 5 11 4 10(28.6) (50.8) (27.3) (50.9)
Finland 1 5 1 5(29.0) (50.9) (27.7) (52.9)
France 2 6 2 9(31.0) (51.4) (29.6) (51.0)
Germany 2 5 3 9(33.8) (55.3) (28.7) (50.1)
Hungary 1 1 1 2(79.5) (79.5) (39.9) (51.2)
Italy . . . . 3 8. . . . (32.3) (52.3)
Japan 2 4 2 3(35.6) (59.2) (41.3) (50.6)
Luxembourg 1 3 2 4(36.4) (58.5) (36.0) (53.3)
Netherlands 2 6 5 +15(27.2) (52.2) (27.4) . .
Norway 4 9 2 6(30.3) (52.2) (34.0) (52.8)
Portugal . . . . 3 6. . . . (30.1) (55.6)
Sweden 3 8 2 9(29.9) (51.1) (25.8) (50.7)
Switzerland 2 4 2 6(35.2) (53.5) (27.6) (51.6)
United Kingdom 2 6 2 6(33.8) (52.7) (28.2) (53.6)
United States 1 2 2 10(44.2) (51.7) (25.5) (51.3)
© OECD 2001
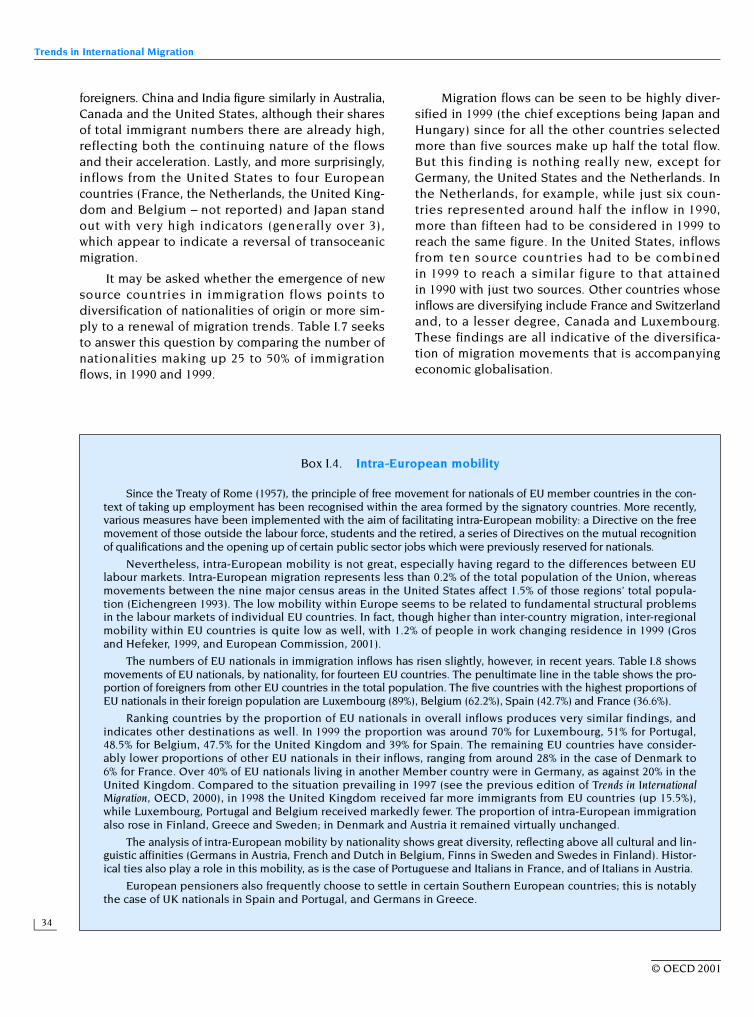
Trends in International Migration
34
foreigners. China and India figure similarly in Australia,Canada and the United States, although their sharesof total immigrant numbers there are already high,reflecting both the continuing nature of the flowsand their acceleration. Lastly, and more surprisingly,inflows from the United States to four Europeancountries (France, the Netherlands, the United King-dom and Belgium – not reported) and Japan standout with very high indicators (generally over 3),which appear to indicate a reversal of transoceanicmigration.
It may be asked whether the emergence of newsource countries in immigration flows points todiversification of nationalities of origin or more sim-ply to a renewal of migration trends. Table I.7 seeksto answer this question by comparing the number ofnationalities making up 25 to 50% of immigrationflows, in 1990 and 1999.
Migration flows can be seen to be highly diver-sified in 1999 (the chief exceptions being Japan andHungary) since for all the other countries selectedmore than five sources make up half the total flow.But this finding is nothing really new, except forGermany, the United States and the Netherlands. Inthe Netherlands, for example, while just six coun-tries represented around half the inflow in 1990,more than fifteen had to be considered in 1999 toreach the same figure. In the United States, inflowsfrom ten source countries had to be combinedin 1999 to reach a similar figure to that attainedin 1990 with just two sources. Other countries whoseinflows are diversifying include France and Switzerlandand, to a lesser degree, Canada and Luxembourg.These findings are all indicative of the diversifica-tion of migration movements that is accompanyingeconomic globalisation.
Box I.4. Intra-European mobility
Since the Treaty of Rome (1957), the principle of free movement for nationals of EU member countries in the con-text of taking up employment has been recognised within the area formed by the signatory countries. More recently,various measures have been implemented with the aim of facilitating intra-European mobility: a Directive on the freemovement of those outside the labour force, students and the retired, a series of Directives on the mutual recognitionof qualifications and the opening up of certain public sector jobs which were previously reserved for nationals.
Nevertheless, intra-European mobility is not great, especially having regard to the differences between EUlabour markets. Intra-European migration represents less than 0.2% of the total population of the Union, whereasmovements between the nine major census areas in the United States affect 1.5% of those regions’ total popula-tion (Eichengreen 1993). The low mobility within Europe seems to be related to fundamental structural problemsin the labour markets of individual EU countries. In fact, though higher than inter-country migration, inter-regionalmobility within EU countries is quite low as well, with 1.2% of people in work changing residence in 1999 (Grosand Hefeker, 1999, and European Commission, 2001).
The numbers of EU nationals in immigration inflows has risen slightly, however, in recent years. Table I.8 showsmovements of EU nationals, by nationality, for fourteen EU countries. The penultimate line in the table shows the pro-portion of foreigners from other EU countries in the total population. The five countries with the highest proportions ofEU nationals in their foreign population are Luxembourg (89%), Belgium (62.2%), Spain (42.7%) and France (36.6%).
Ranking countries by the proportion of EU nationals in overall inflows produces very similar findings, andindicates other destinations as well. In 1999 the proportion was around 70% for Luxembourg, 51% for Portugal,48.5% for Belgium, 47.5% for the United Kingdom and 39% for Spain. The remaining EU countries have consider-ably lower proportions of other EU nationals in their inflows, ranging from around 28% in the case of Denmark to6% for France. Over 40% of EU nationals living in another Member country were in Germany, as against 20% in theUnited Kingdom. Compared to the situation prevailing in 1997 (see the previous edition of Trends in InternationalMigration, OECD, 2000), in 1998 the United Kingdom received far more immigrants from EU countries (up 15.5%),while Luxembourg, Portugal and Belgium received markedly fewer. The proportion of intra-European immigrationalso rose in Finland, Greece and Sweden; in Denmark and Austria it remained virtually unchanged.
The analysis of intra-European mobility by nationality shows great diversity, reflecting above all cultural and lin-guistic affinities (Germans in Austria, French and Dutch in Belgium, Finns in Sweden and Swedes in Finland). Histor-ical ties also play a role in this mobility, as is the case of Portuguese and Italians in France, and of Italians in Austria.
European pensioners also frequently choose to settle in certain Southern European countries; this is notablythe case of UK nationals in Spain and Portugal, and Germans in Greece.
© OECD 2001
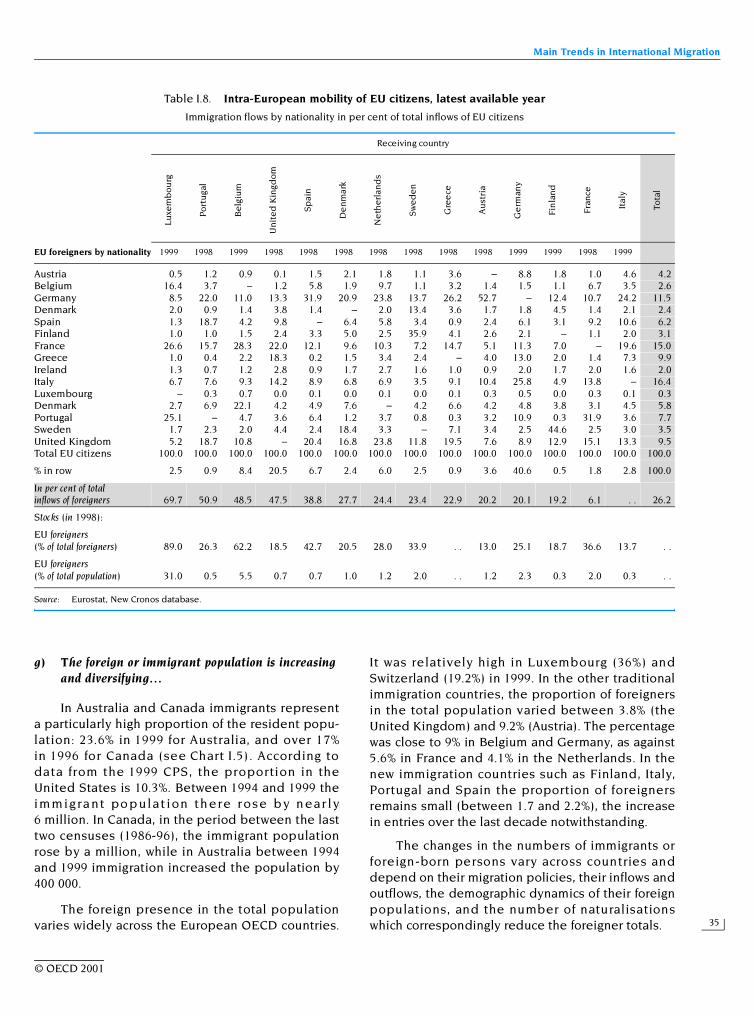
Main Trends in International Migration
35
g) The foreign or immigrant population is increasing and diversifying…
In Australia and Canada immigrants representa particularly high proportion of the resident popu-lation: 23.6% in 1999 for Australia, and over 17%in 1996 for Canada (see Chart I.5). According todata from the 1999 CPS, the proportion in theUnited States is 10.3%. Between 1994 and 1999 theimmigra nt po pulat ion th ere r ose by n ear ly6 million. In Canada, in the period between the lasttwo censuses (1986-96), the immigrant populationrose by a million, while in Australia between 1994and 1999 immigration increased the population by400 000.
The foreign presence in the total populationvaries widely across the European OECD countries.
It was relatively high in Luxembourg (36%) andSwitzerland (19.2%) in 1999. In the other traditionalimmigration countries, the proportion of foreignersin the total population varied between 3.8% (theUnited Kingdom) and 9.2% (Austria). The percentagewas close to 9% in Belgium and Germany, as against5.6% in France and 4.1% in the Netherlands. In thenew immigration countries such as Finland, Italy,Portugal and Spain the proportion of foreignersremains small (between 1.7 and 2.2%), the increasein entries over the last decade notwithstanding.
The changes in the numbers of immigrants orforeign-born persons vary across countries anddepend on their migration policies, their inflows andoutflows, the demographic dynamics of their foreignpopulations, and the number of naturalisationswhich correspondingly reduce the foreigner totals.
Table I.8. Intra-European mobility of EU citizens, latest available year
Immigration flows by nationality in per cent of total inflows of EU citizens
Source: Eurostat, New Cronos database.
Receiving country
Lu
xem
bo
urg
Po
rtu
gal
Be
lgiu
m
Un
ite
d K
ingd
om
Sp
ain
De
nm
ark
Ne
the
rlan
ds
Sw
ed
en
Gre
ece
Au
stri
a
Ge
rman
y
Fin
lan
d
Fra
nce
Ital
y
Tota
l
EU foreigners by nationality 1999 1998 1999 1998 1998 1998 1998 1998 1998 1998 1999 1999 1998 1999
Austria 0.5 1.2 0.9 0.1 1.5 2.1 1.8 1.1 3.6 – 8.8 1.8 1.0 4.6 4.2Belgium 16.4 3.7 – 1.2 5.8 1.9 9.7 1.1 3.2 1.4 1.5 1.1 6.7 3.5 2.6Germany 8.5 22.0 11.0 13.3 31.9 20.9 23.8 13.7 26.2 52.7 – 12.4 10.7 24.2 11.5Denmark 2.0 0.9 1.4 3.8 1.4 – 2.0 13.4 3.6 1.7 1.8 4.5 1.4 2.1 2.4Spain 1.3 18.7 4.2 9.8 – 6.4 5.8 3.4 0.9 2.4 6.1 3.1 9.2 10.6 6.2Finland 1.0 1.0 1.5 2.4 3.3 5.0 2.5 35.9 4.1 2.6 2.1 – 1.1 2.0 3.1France 26.6 15.7 28.3 22.0 12.1 9.6 10.3 7.2 14.7 5.1 11.3 7.0 – 19.6 15.0Greece 1.0 0.4 2.2 18.3 0.2 1.5 3.4 2.4 – 4.0 13.0 2.0 1.4 7.3 9.9Ireland 1.3 0.7 1.2 2.8 0.9 1.7 2.7 1.6 1.0 0.9 2.0 1.7 2.0 1.6 2.0Italy 6.7 7.6 9.3 14.2 8.9 6.8 6.9 3.5 9.1 10.4 25.8 4.9 13.8 – 16.4Luxembourg – 0.3 0.7 0.0 0.1 0.0 0.1 0.0 0.1 0.3 0.5 0.0 0.3 0.1 0.3Denmark 2.7 6.9 22.1 4.2 4.9 7.6 – 4.2 6.6 4.2 4.8 3.8 3.1 4.5 5.8Portugal 25.1 – 4.7 3.6 6.4 1.2 3.7 0.8 0.3 3.2 10.9 0.3 31.9 3.6 7.7Sweden 1.7 2.3 2.0 4.4 2.4 18.4 3.3 – 7.1 3.4 2.5 44.6 2.5 3.0 3.5United Kingdom 5.2 18.7 10.8 – 20.4 16.8 23.8 11.8 19.5 7.6 8.9 12.9 15.1 13.3 9.5Total EU citizens 100.0 100.0 100.0 100.0 100.0 100.0 100.0 100.0 100.0 100.0 100.0 100.0 100.0 100.0 100.0
% in row 2.5 0.9 8.4 20.5 6.7 2.4 6.0 2.5 0.9 3.6 40.6 0.5 1.8 2.8 100.0
In per cent of total inflows of foreigners 69.7 50.9 48.5 47.5 38.8 27.7 24.4 23.4 22.9 20.2 20.1 19.2 6.1 . . 26.2
Stocks (in 1998):
EU foreigners (% of total foreigners) 89.0 26.3 62.2 18.5 42.7 20.5 28.0 33.9 . . 13.0 25.1 18.7 36.6 13.7 . .
EU foreigners (% of total population) 31.0 0.5 5.5 0.7 0.7 1.0 1.2 2.0 . . 1.2 2.3 0.3 2.0 0.3 . .
© OECD 2001
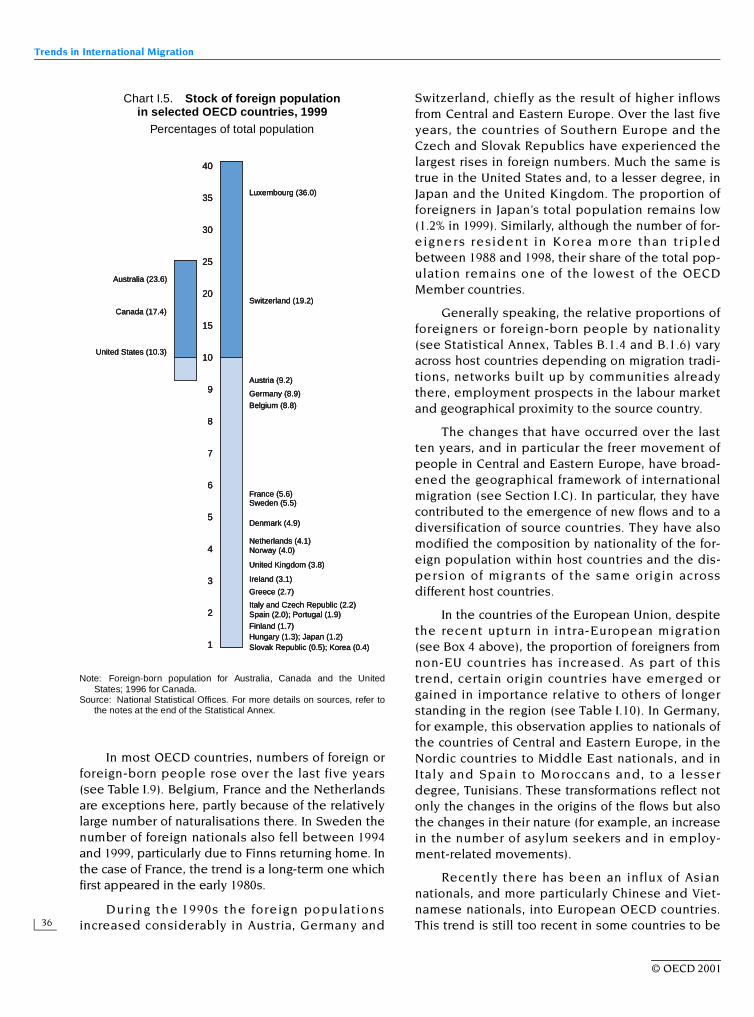
Trends in International Migration
36
In most OECD countries, numbers of foreign orforeign-born people rose over the last five years(see Table I.9). Belgium, France and the Netherlandsare exceptions here, partly because of the relativelylarge number of naturalisations there. In Sweden thenumber of foreign nationals also fell between 1994and 1999, particularly due to Finns returning home. Inthe case of France, the trend is a long-term one whichfirst appeared in the early 1980s.
During the 1990s the foreign populationsincreased considerably in Austria, Germany and
Switzerland, chiefly as the result of higher inflowsfrom Central and Eastern Europe. Over the last fiveyears, the countries of Southern Europe and theCzech and Slovak Republics have experienced thelargest rises in foreign numbers. Much the same istrue in the United States and, to a lesser degree, inJapan and the United Kingdom. The proportion offoreigners in Japan’s total population remains low(1.2% in 1999). Similarly, although the number of for-eigners resident in Korea more than tr ipledbetween 1988 and 1998, their share of the total pop-ulation remains one of the lowest of the OECDMember countries.
Generally speaking, the relative proportions offoreigners or foreign-born people by nationality(see Statistical Annex, Tables B.1.4 and B.1.6) varyacross host countries depending on migration tradi-tions, networks built up by communities alreadythere, employment prospects in the labour marketand geographical proximity to the source country.
The changes that have occurred over the lastten years, and in particular the freer movement ofpeople in Central and Eastern Europe, have broad-ened the geographical framework of internationalmigration (see Section I.C). In particular, they havecontributed to the emergence of new flows and to adiversification of source countries. They have alsomodified the composition by nationality of the for-eign population within host countries and the dis-persion of migrants of the same origin acrossdifferent host countries.
In the countries of the European Union, despitethe recent upturn in intra-European migration(see Box 4 above), the proportion of foreigners fromnon-EU countries has increased. As part of thistrend, certain origin countries have emerged orgained in importance relative to others of longerstanding in the region (see Table I.10). In Germany,for example, this observation applies to nationals ofthe countries of Central and Eastern Europe, in theNordic countries to Middle East nationals, and inItaly and Spain to Moroccans and, to a lesserdegree, Tunisians. These transformations reflect notonly the changes in the origins of the flows but alsothe changes in their nature (for example, an increasein the number of asylum seekers and in employ-ment-related movements).
Recently there has been an influx of Asiannationals, and more particularly Chinese and Viet-namese nationals, into European OECD countries.This trend is still too recent in some countries to be
Chart I.5. Stock of foreign population in selected OECD countries, 1999
Percentages of total population
Note: Foreign-born population for Australia, Canada and the UnitedStates; 1996 for Canada.
Source: National Statistical Offices. For more details on sources, refer tothe notes at the end of the Statistical Annex.
40
35
30
25
20
15
10
9
8
7
6
5
4
3
2
1
United States (10.3)
Belgium (8.8)
Germany (8.9)
Austria (9.2)
Switzerland (19.2)
Luxembourg (36.0)
Canada (17.4)
Australia (23.6)
Slovak Republic (0.5); Korea (0.4)Hungary (1.3); Japan (1.2)Finland (1.7)
Spain (2.0); Portugal (1.9)Italy and Czech Republic (2.2)
Greece (2.7)
Ireland (3.1)
United Kingdom (3.8)
Norway (4.0)
Denmark (4.9)
Netherlands (4.1)
Sweden (5.5)France (5.6)
© OECD 2001
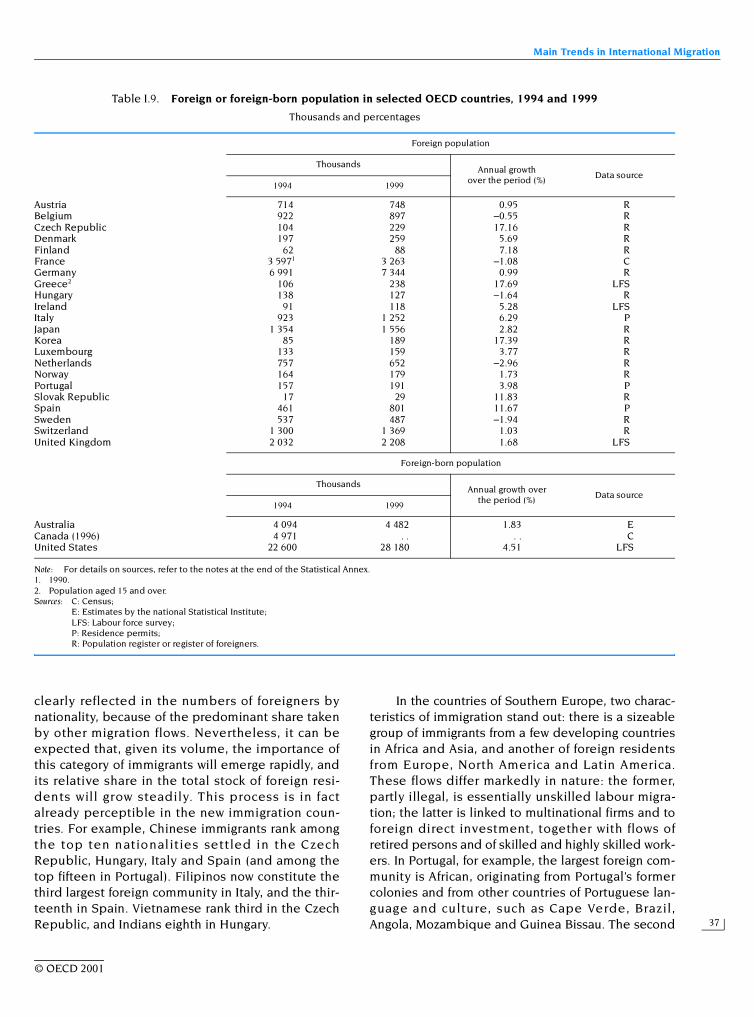
Main Trends in International Migration
37
clearly reflected in the numbers of foreigners bynationality, because of the predominant share takenby other migration flows. Nevertheless, it can beexpected that, given its volume, the importance ofthis category of immigrants will emerge rapidly, andits relative share in the total stock of foreign resi-dents will grow steadily. This process is in factalready perceptible in the new immigration coun-tries. For example, Chinese immigrants rank amongthe top ten nationalities settled in the CzechRepublic, Hungary, Italy and Spain (and among thetop fifteen in Portugal). Filipinos now constitute thethird largest foreign community in Italy, and the thir-teenth in Spain. Vietnamese rank third in the CzechRepublic, and Indians eighth in Hungary.
In the countries of Southern Europe, two charac-teristics of immigration stand out: there is a sizeablegroup of immigrants from a few developing countriesin Africa and Asia, and another of foreign residentsfrom Europe, North America and Latin America.These flows differ markedly in nature: the former,partly illegal, is essentially unskilled labour migra-tion; the latter is linked to multinational firms and toforeign direct investment, together with flows ofretired persons and of skilled and highly skilled work-ers. In Portugal, for example, the largest foreign com-munity is African, originating from Portugal’s formercolonies and from other countries of Portuguese lan-guage and culture, such as Cape Verde, Brazil,Angola, Mozambique and Guinea Bissau. The second
Table I.9. Foreign or foreign-born population in selected OECD countries, 1994 and 1999
Thousands and percentages
Note: For details on sources, refer to the notes at the end of the Statistical Annex.1. 1990.2. Population aged 15 and over.Sources: C: Census;
E: Estimates by the national Statistical Institute; LFS: Labour force survey; P: Residence permits; R: Population register or register of foreigners.
Foreign population
ThousandsAnnual growth
over the period (%)Data source
1994 1999
Austria 714 748 0.95 RBelgium 922 897 –0.55 RCzech Republic 104 229 17.16 RDenmark 197 259 5.69 RFinland 62 88 7.18 RFrance 3 5971 3 263 –1.08 CGermany 6 991 7 344 0.99 RGreece2 106 238 17.69 LFSHungary 138 127 –1.64 RIreland 91 118 5.28 LFSItaly 923 1 252 6.29 PJapan 1 354 1 556 2.82 RKorea 85 189 17.39 RLuxembourg 133 159 3.77 RNetherlands 757 652 –2.96 RNorway 164 179 1.73 RPortugal 157 191 3.98 PSlovak Republic 17 29 11.83 RSpain 461 801 11.67 PSweden 537 487 –1.94 RSwitzerland 1 300 1 369 1.03 RUnited Kingdom 2 032 2 208 1.68 LFS
Foreign-born population
Thousands Annual growth over
the period (%)Data source
1994 1999
Australia 4 094 4 482 1.83 ECanada (1996) 4 971 . . . . CUnited States 22 600 28 180 4.51 LFS
© OECD 2001
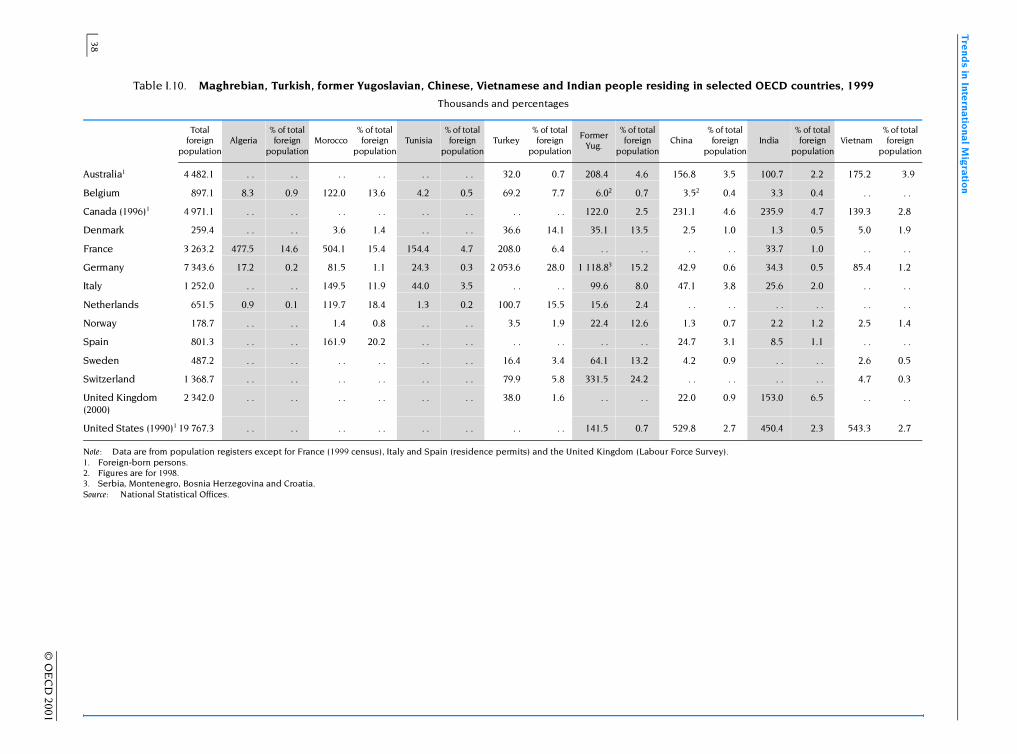
Tre
nds in Inte
rnatio
nal M
igration
38
© O
EC
D 2001
ted OECD countries, 1999
tal n ion
India% of total foreign
populationVietnam
% of total foreign
population
100.7 2.2 175.2 3.9
3.3 0.4 . . . .
235.9 4.7 139.3 2.8
1.3 0.5 5.0 1.9
. 33.7 1.0 . . . .
34.3 0.5 85.4 1.2
25.6 2.0 . . . .
. . . . . . . . .
2.2 1.2 2.5 1.4
8.5 1.1 . . . .
. . . . 2.6 0.5
. . . . . 4.7 0.3
153.0 6.5 . . . .
450.4 2.3 543.3 2.7
Table I.10. Maghrebian, Turkish, former Yugoslavian, Chinese, Vietnamese and Indian people residing in selec
Thousands and percentages
Note: Data are from population registers except for France (1999 census), Italy and Spain (residence permits) and the United Kingdom (Labour Force Survey).1. Foreign-born persons.2. Figures are for 1998.3. Serbia, Montenegro, Bosnia Herzegovina and Croatia.Source: National Statistical Offices.
Total foreign
populationAlgeria
% of total foreign
populationMorocco
% of total foreign
populationTunisia
% of total foreign
populationTurkey
% of total foreign
population
Former Yug.
% of total foreign
populationChina
% of toforeig
populat
Australia1 4 482.1 . . . . . . . . . . . . 32.0 0.7 208.4 4.6 156.8 3.5
Belgium 897.1 8.3 0.9 122.0 13.6 4.2 0.5 69.2 7.7 6.02 0.7 3.52 0.4
Canada (1996)1 4 971.1 . . . . . . . . . . . . . . . . 122.0 2.5 231.1 4.6
Denmark 259.4 . . . . 3.6 1.4 . . . . 36.6 14.1 35.1 13.5 2.5 1.0
France 3 263.2 477.5 14.6 504.1 15.4 154.4 4.7 208.0 6.4 . . . . . . .
Germany 7 343.6 17.2 0.2 81.5 1.1 24.3 0.3 2 053.6 28.0 1 118.83 15.2 42.9 0.6
Italy 1 252.0 . . . . 149.5 11.9 44.0 3.5 . . . . 99.6 8.0 47.1 3.8
Netherlands 651.5 0.9 0.1 119.7 18.4 1.3 0.2 100.7 15.5 15.6 2.4 . . .
Norway 178.7 . . . . 1.4 0.8 . . . . 3.5 1.9 22.4 12.6 1.3 0.7
Spain 801.3 . . . . 161.9 20.2 . . . . . . . . . . . . 24.7 3.1
Sweden 487.2 . . . . . . . . . . . . 16.4 3.4 64.1 13.2 4.2 0.9
Switzerland 1 368.7 . . . . . . . . . . . . 79.9 5.8 331.5 24.2 . . .
United Kingdom (2000)
2 342.0 . . . . . . . . . . . . 38.0 1.6 . . . . 22.0 0.9
United States (1990)1 19 767.3 . . . . . . . . . . . . . . . . 141.5 0.7 529.8 2.7
Main Trends in International Migration
39
largest group is made up of European Union (France,Germany and Spain) and United States nationals.
Among the European countries of the OECD(see Box I.4 above, and Table I.8), the highest per-centages of nationals of the fifteen-Member Euro-pean Unionwere to be found in 1998 or 1999 – indecreasing order of importance – in Luxembourg,Belgium and Spain (statistics are not available for Ire-land, though it too hosts a large number of EU nation-als). At the opposite end of the scale, Austria wasamong the countries with the lowest proportion offoreign residents from other EU members in its totalforeign population and in its foreign labour force.
In Australia, Canada and the United States theproportion of European residents has declined infavour of immigrants from the developing countries(see Statistical Annex, Table B.1.4). In the UnitedStates the stock of European residents has heldsteady while that of immigrants from Asia and fromt h e A m e r i c a n co n t i n e n t h a s i n c r e a se d.Between 1980 and 1990 the numbers of Mexican,Vietnamese and Chinese nationals almost doubled;those from India and the Dominican Republic morethan doubled. Between 1990 and 2000 these trendscontinued, in fact at a faster pace. The 2000 censusrecorded nearly 9 million Mexicans and around8.5 million Asian nationals, but only 4.8 million peo-ple born in Europe. Numbers from Africa, althoughsmaller, are increasing among the immigrant popula-tion (800 000 in 2000). To some extent, these trendsreflect demographics worldwide.
With the North American Free Trade Agreement(NAFTA), whose provisions enhance mobility forbusiness people and skilled workers between theUnited States and Canada, inflows of Canadians tothe United States are again rising and in 2000returned to the levels found in 1980.
In Canada the number of Europeans (notablyfrom Germany, Italy, the Netherlands and the UnitedKingdom) fell slightly between 1986 and 1996, whilethe immigrant population of Asian provenance dou-bled. The same trend has been observed in Australia,with conspicuous growth in immigration flows fromAsia, New Zealand and Africa, while those of Europeanprovenance remained stable.
The foreigners and foreign-born persons resi-dent in OECD countries include nationals of Mem-ber countries. Although analysis rarely singles themout, their number is relatively high. For example,73% of the people from the ten main immigrantgroups present in the United States in 1998 (and
66% of those in Canada in 1996) were from OECDMember countries. In 1999, in Germany and theUnited Kingdom, the figure was also very high,being 77% in the former and over 65% in the latter.The proportion of foreign nationals coming fromOECD Member countries was close to 50% in Franceand in Japan, given the size of the communitiescoming from Southern Europe in the former andfrom Korea in the latter.
The recent accession of further countries to theOECD (the Slovak Republic in 2000, Hungary, Polandand Korea in 1996, the Czech Republic in 1995 andMexico in 1994) has helped to accentuate this trend.In 1999, Turks topped the ranking by nationality offoreigners resident in European OECD countries.Italians and Portuguese were third and fourthrespectively, after nationals of the former Yugosla-via. Mexicans and Koreans make up the leading for-eign communities in the United States and Japanrespectively.
Demographic characteristics of the foreign or foreign-born population
The demographic structure of the foreign or for-eign-born population differs from that of nationals inits age and gender composition. But specific fea-tures vary considerably across countries and in factdepend on the nature of migration flows, in particu-lar the size of the family component, and on thedates of migration waves and the features of themain groups of migrants themselves.
In some of the major immigration countries inEurope, such as France, but also Belgium andSwitzerland, and to a lesser extend Sweden and theNetherlands, the age structure for foreigners is rela-tively close to that for nationals and the sole distinc-tion is that foreigners are under-represented in the65 and over age groups (see Chart I.6). Long-standingmigration and the fact that immigrants have tendedto settle permanently in these countries partlyexplain this finding. Under-representation in thehigher age groups, moreover, may be due to thenumbers of naturalisations.
In Austria and Germany the recent waves ofmigration, following the opening up of EasternEurope (see Section I.C), have injected a youngerelement into the age structure of the foreign popula-tion, at a time when low fertility rates give the agepyramids for nationals there the typical aspect of anageing population.
© OECD 2001
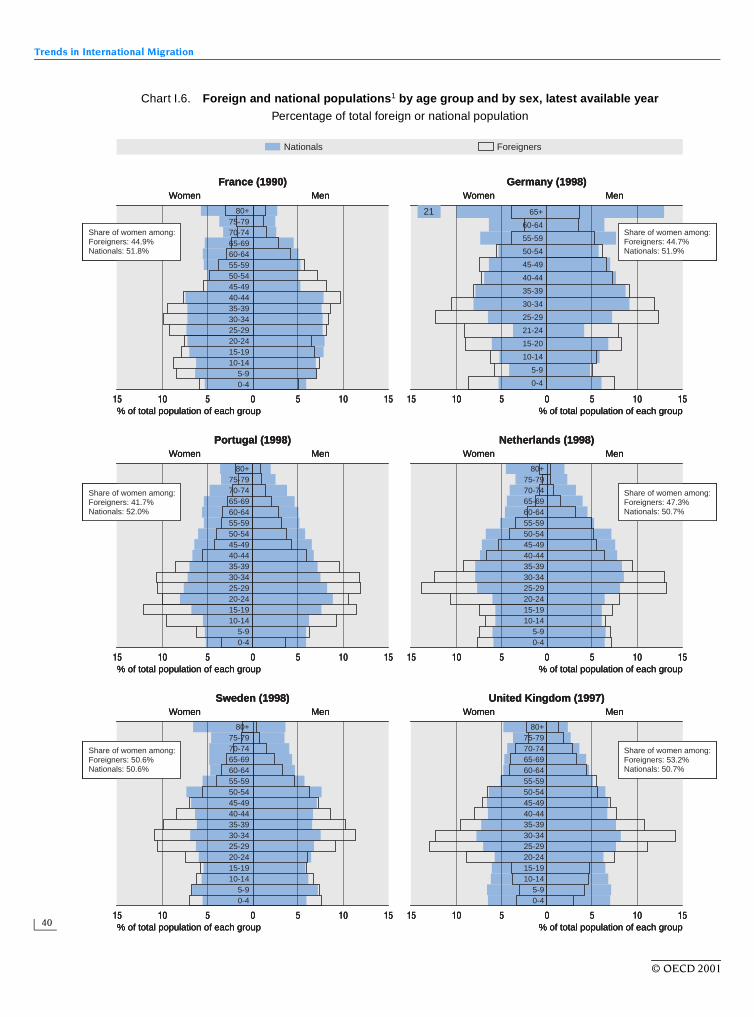
Trends in International Migration
40
Chart I.6. Foreign and national populations1 by age group and by sex, latest available yearPercentage of total foreign or national population
15 10 5 0 5 10 15 15 10 5 0 5 10 15
15 10 5 0 5 10 1515 10 5 0 5 10 15
15 10 5 0 5 10 1515 10 5 0 5 10 15
2180+75-7970-7465-6960-6455-5950-5445-4940-4435-3930-3425-2920-2415-1910-14
5-90-4
65+
60-64
55-59
50-54
45-49
40-44
35-39
30-34
25-29
21-24
15-20
10-14
5-9
0-4
80+75-7970-7465-6960-6455-5950-5445-4940-4435-3930-3425-2920-2415-1910-14
5-90-4
80+75-7970-7465-6960-6455-5950-5445-4940-4435-3930-3425-2920-2415-1910-14
5-90-4
80+75-7970-7465-6960-6455-5950-5445-4940-4435-3930-3425-2920-2415-1910-14
5-90-4
80+75-7970-7465-6960-6455-5950-5445-4940-4435-3930-3425-2920-2415-1910-14
5-90-4
Nationals Foreigners
Share of women among:Foreigners: 44.9%Nationals: 51.8%
France (1990)Women Men
% of total population of each group
Germany (1998)Women Men
% of total population of each group
Netherlands (1998)Women Men
% of total population of each group
Portugal (1998)Women Men
% of total population of each group
United Kingdom (1997)Women Men
% of total population of each group
Sweden (1998)Women Men
% of total population of each group
Share of women among:Foreigners: 44.7%Nationals: 51.9%
Share of women among:Foreigners: 41.7%Nationals: 52.0%
Share of women among:Foreigners: 47.3%Nationals: 50.7%
Share of women among:Foreigners: 50.6%Nationals: 50.6%
Share of women among:Foreigners: 53.2%Nationals: 50.7%
© OECD 2001
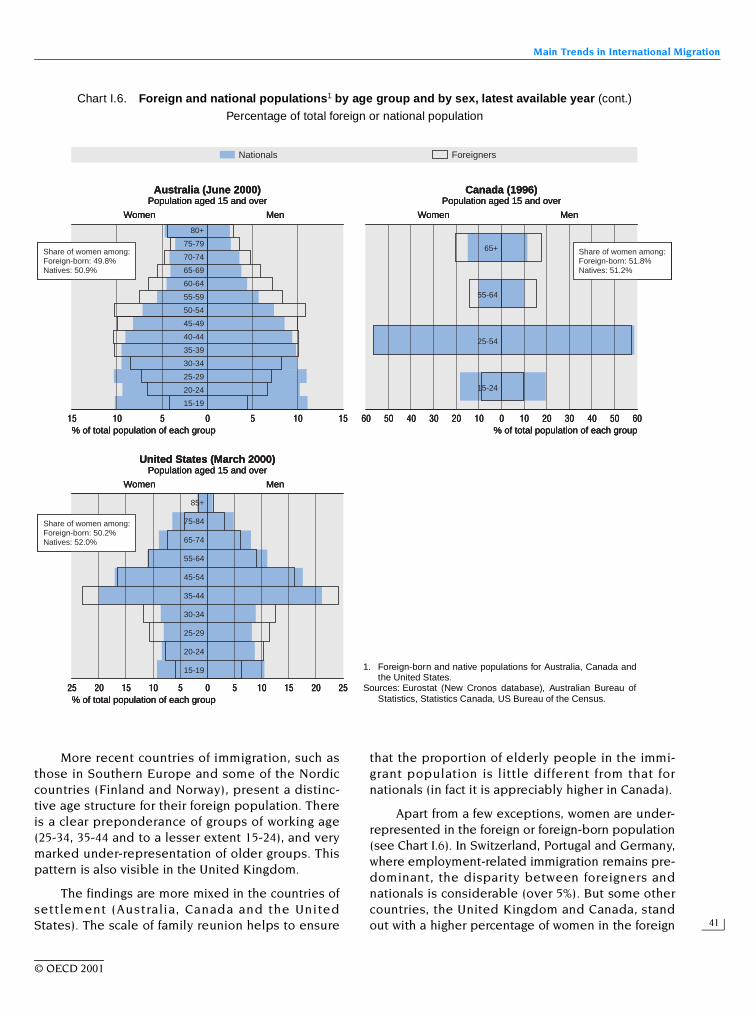
Main Trends in International Migration
41
More recent countries of immigration, such asthose in Southern Europe and some of the Nordiccountries (Finland and Norway), present a distinc-tive age structure for their foreign population. Thereis a clear preponderance of groups of working age(25-34, 35-44 and to a lesser extent 15-24), and verymarked under-representation of older groups. Thispattern is also visible in the United Kingdom.
The findings are more mixed in the countries ofsettlement (Australia, Canada and the UnitedStates). The scale of family reunion helps to ensure
that the proportion of elderly people in the immi-grant population is little different from that fornationals (in fact it is appreciably higher in Canada).
Apart from a few exceptions, women are under-represented in the foreign or foreign-born population(see Chart I.6). In Switzerland, Portugal and Germany,where employment-related immigration remains pre-dominant, the disparity between foreigners andnationals is considerable (over 5%). But some othercountries, the United Kingdom and Canada, standout with a higher percentage of women in the foreign
Chart I.6. Foreign and national populations1 by age group and by sex, latest available year (cont.)
Percentage of total foreign or national population
15 10 5 0 5 10 15 60 40 20 0 20 40 60
25 10 5 0 5 20 25
80+
75-79
70-74
65-69
60-64
55-59
50-54
45-49
40-44
35-39
30-34
25-29
20-24
15-19
65+
55-64
25-54
15-24
85+
75-84
65-74
55-64
45-54
35-44
30-34
25-29
20-24
15-19
50 30 10 10 30 50
1520 10 15
Nationals Foreigners
Share of women among:Foreign-born: 49.8%Natives: 50.9%
Australia (June 2000)Population aged 15 and over
Women Men
% of total population of each group
Canada (1996)Population aged 15 and over
Women Men
% of total population of each group
United States (March 2000)Population aged 15 and over
Women Men
% of total population of each group
Share of women among:Foreign-born: 51.8%Natives: 51.2%
Share of women among:Foreign-born: 50.2%Natives: 52.0%
1. Foreign-born and native populations for Australia, Canada andthe United States.
Sources: Eurostat (New Cronos database), Australian Bureau ofStatistics, Statistics Canada, US Bureau of the Census.
© OECD 2001
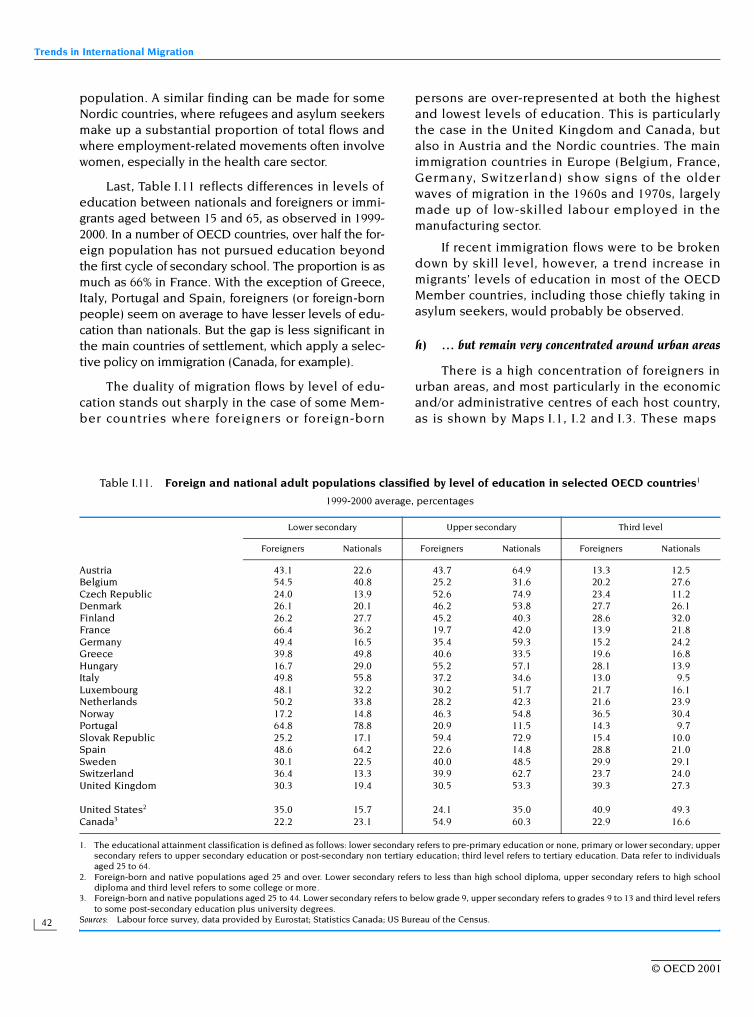
Trends in International Migration
42
population. A similar finding can be made for someNordic countries, where refugees and asylum seekersmake up a substantial proportion of total flows andwhere employment-related movements often involvewomen, especially in the health care sector.
Last, Table I.11 reflects differences in levels ofeducation between nationals and foreigners or immi-grants aged between 15 and 65, as observed in 1999-2000. In a number of OECD countries, over half the for-eign population has not pursued education beyondthe first cycle of secondary school. The proportion is asmuch as 66% in France. With the exception of Greece,Italy, Portugal and Spain, foreigners (or foreign-bornpeople) seem on average to have lesser levels of edu-cation than nationals. But the gap is less significant inthe main countries of settlement, which apply a selec-tive policy on immigration (Canada, for example).
The duality of migration flows by level of edu-cation stands out sharply in the case of some Mem-ber countries where foreigners or foreign-born
persons are over-represented at both the highestand lowest levels of education. This is particularlythe case in the United Kingdom and Canada, butalso in Austria and the Nordic countries. The mainimmigration countries in Europe (Belgium, France,Germany, Switzerland) show signs of the olderwaves of migration in the 1960s and 1970s, largelymade up of low-skilled labour employed in themanufacturing sector.
If recent immigration flows were to be brokendown by skill level, however, a trend increase inmigrants’ levels of education in most of the OECDMember countries, including those chiefly taking inasylum seekers, would probably be observed.
h) … but remain very concentrated around urban areas
There is a high concentration of foreigners inurban areas, and most particularly in the economicand/or administrative centres of each host country,as is shown by Maps I.1, I.2 and I.3. These maps
Table I.11. Foreign and national adult populations classified by level of education in selected OECD countries1
1999-2000 average, percentages
1. The educational attainment classification is defined as follows: lower secondary refers to pre-primary education or none, primary or lower secondary; uppersecondary refers to upper secondary education or post-secondary non tertiary education; third level refers to tertiary education. Data refer to individualsaged 25 to 64.
2. Foreign-born and native populations aged 25 and over. Lower secondary refers to less than high school diploma, upper secondary refers to high schooldiploma and third level refers to some college or more.
3. Foreign-born and native populations aged 25 to 44. Lower secondary refers to below grade 9, upper secondary refers to grades 9 to 13 and third level refersto some post-secondary education plus university degrees.
Sources: Labour force survey, data provided by Eurostat; Statistics Canada; US Bureau of the Census.
Lower secondary Upper secondary Third level
Foreigners Nationals Foreigners Nationals Foreigners Nationals
Austria 43.1 22.6 43.7 64.9 13.3 12.5Belgium 54.5 40.8 25.2 31.6 20.2 27.6Czech Republic 24.0 13.9 52.6 74.9 23.4 11.2Denmark 26.1 20.1 46.2 53.8 27.7 26.1Finland 26.2 27.7 45.2 40.3 28.6 32.0France 66.4 36.2 19.7 42.0 13.9 21.8Germany 49.4 16.5 35.4 59.3 15.2 24.2Greece 39.8 49.8 40.6 33.5 19.6 16.8Hungary 16.7 29.0 55.2 57.1 28.1 13.9Italy 49.8 55.8 37.2 34.6 13.0 9.5Luxembourg 48.1 32.2 30.2 51.7 21.7 16.1Netherlands 50.2 33.8 28.2 42.3 21.6 23.9Norway 17.2 14.8 46.3 54.8 36.5 30.4Portugal 64.8 78.8 20.9 11.5 14.3 9.7Slovak Republic 25.2 17.1 59.4 72.9 15.4 10.0Spain 48.6 64.2 22.6 14.8 28.8 21.0Sweden 30.1 22.5 40.0 48.5 29.9 29.1Switzerland 36.4 13.3 39.9 62.7 23.7 24.0United Kingdom 30.3 19.4 30.5 53.3 39.3 27.3
United States2 35.0 15.7 24.1 35.0 40.9 49.3Canada3 22.2 23.1 54.9 60.3 22.9 16.6
© OECD 2001
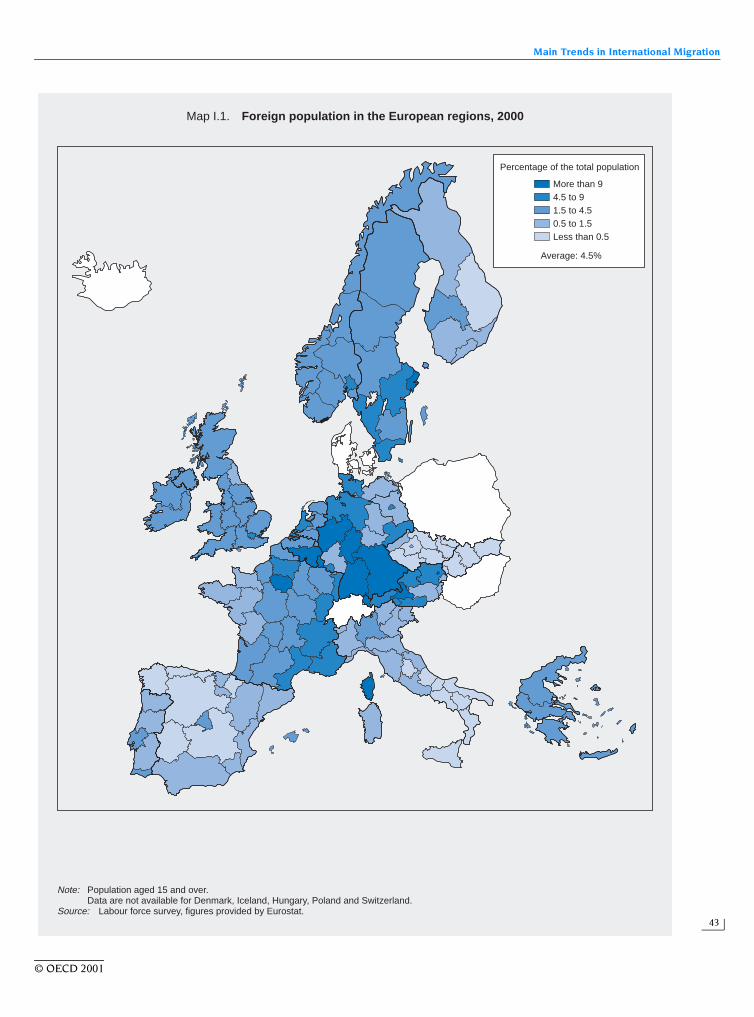
Main Trends in International Migration
43
Map I.1. Foreign population in the European regions, 2000
Note: Population aged 15 and over.Data are not available for Denmark, Iceland, Hungary, Poland and Switzerland.
Source: Labour force survey, figures provided by Eurostat.
More than 9
Percentage of the total population
4.5 to 91.5 to 4.50.5 to 1.5Less than 0.5
Average: 4.5%
© OECD 2001
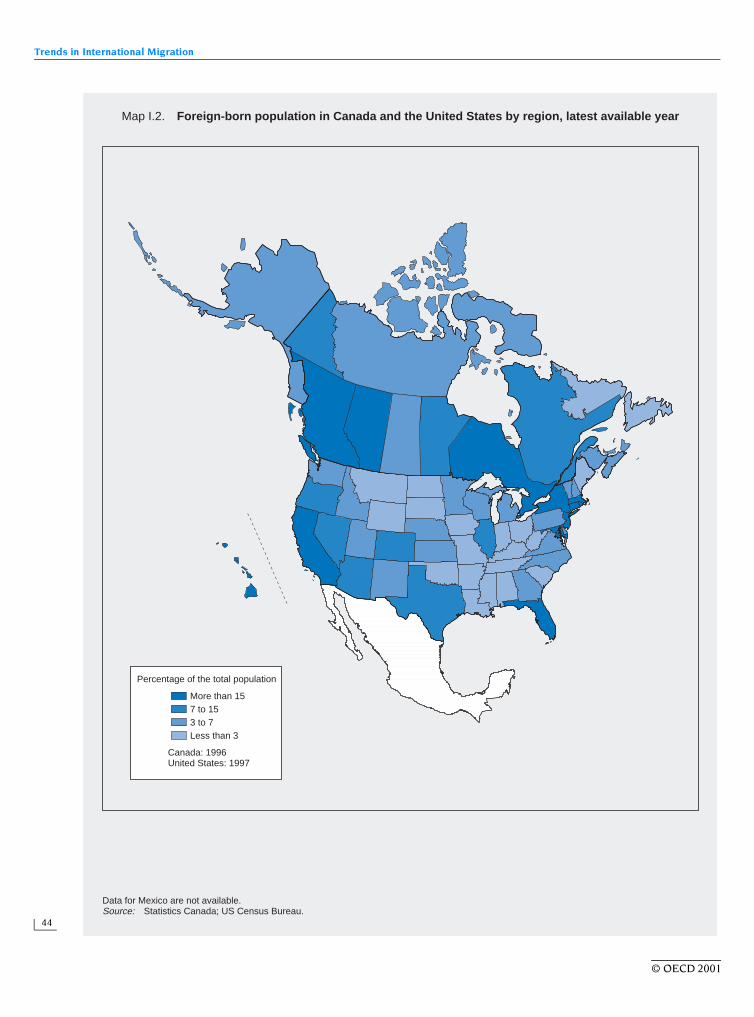
Trends in International Migration
44
Map I.2. Foreign-born population in Canada and the United States by region, latest available year
Data for Mexico are not available.Source: Statistics Canada; US Census Bureau.
More than 15
Percentage of the total population
7 to 153 to 7Less than 3
Canada: 1996United States: 1997
Map I.2. Foreign-born population in Canada and the United States by region, latest available year
Data for Mexico are not available.Source: Statistics Canada; US Census Bureau.
More than 15
Percentage of the total population
7 to 153 to 7Less than 3
Canada: 1996United States: 1997
Map I.2. Foreign-born population in Canada and the United States by region, latest available year
Data for Mexico are not available.Source: Statistics Canada; US Census Bureau.
More than 15
Percentage of the total population
7 to 153 to 7Less than 3
Canada: 1996United States: 1997
© OECD 2001
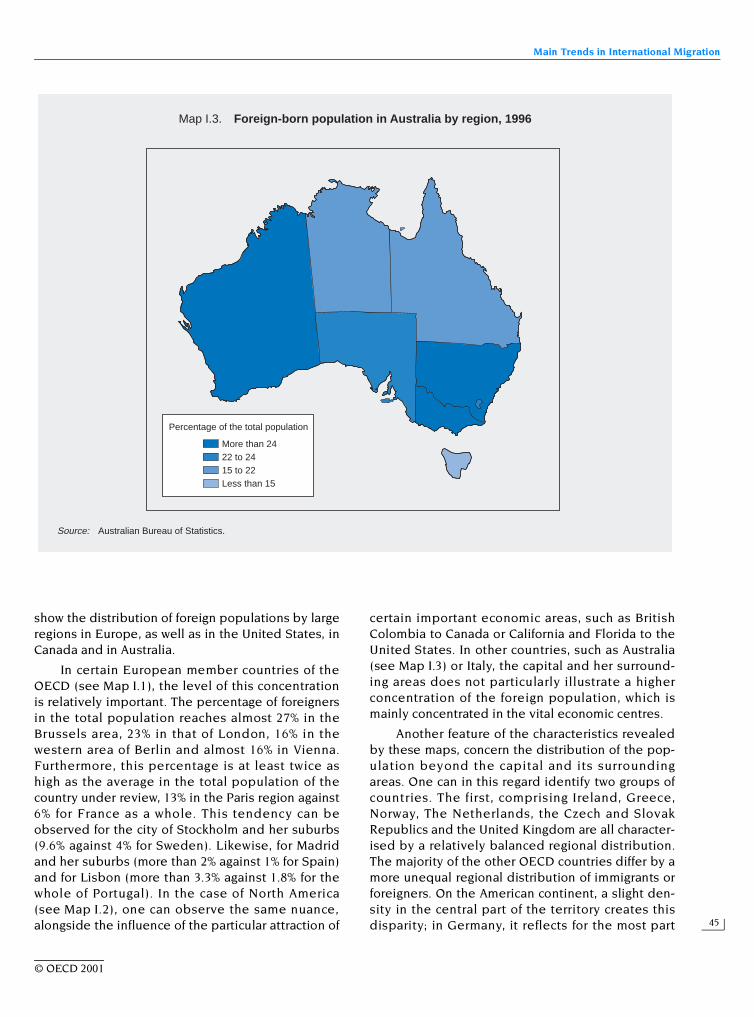
Main Trends in International Migration
45
show the distribution of foreign populations by largeregions in Europe, as well as in the United States, inCanada and in Australia.
In certain European member countries of theOECD (see Map I.1), the level of this concentrationis relatively important. The percentage of foreignersin the total population reaches almost 27% in theBrussels area, 23% in that of London, 16% in thewestern area of Berlin and almost 16% in Vienna.Furthermore, this percentage is at least twice ashigh as the average in the total population of thecountry under review, 13% in the Paris region against6% for France as a whole. This tendency can beobserved for the city of Stockholm and her suburbs(9.6% against 4% for Sweden). Likewise, for Madridand her suburbs (more than 2% against 1% for Spain)and for Lisbon (more than 3.3% against 1.8% for thewhole of Portugal). In the case of North America(see Map I.2), one can observe the same nuance,alongside the influence of the particular attraction of
certain important economic areas, such as BritishColombia to Canada or California and Florida to theUnited States. In other countries, such as Australia(see Map I.3) or Italy, the capital and her surround-ing areas does not particularly illustrate a higherconcentration of the foreign population, which ismainly concentrated in the vital economic centres.
Another feature of the characteristics revealedby these maps, concern the distribution of the pop-ulation beyond the capital and its surroundingareas. One can in this regard identify two groups ofcountries. The first, comprising Ireland, Greece,Norway, The Netherlands, the Czech and SlovakRepublics and the United Kingdom are all character-ised by a relatively balanced regional distribution.The majority of the other OECD countries differ by amore unequal regional distribution of immigrants orforeigners. On the American continent, a slight den-sity in the central part of the territory creates thisdisparity; in Germany, it reflects for the most part
Map I.3. Foreign-born population in Australia by region, 1996
Source: Australian Bureau of Statistics.
More than 24
Percentage of the total population
22 to 2415 to 22Less than 15
Map I.3. Foreign-born population in Australia by region, 1996
Source: Australian Bureau of Statistics.
More than 24
Percentage of the total population
22 to 2415 to 22Less than 15
Map I.3. Foreign-born population in Australia by region, 1996
Source: Australian Bureau of Statistics.
More than 24
Percentage of the total population
22 to 2415 to 22Less than 15
© OECD 2001
Trends in International Migration
46
the dichotomy between east and west, while in Italyit is entirely superposed in the principal geographi-cal production areas.
Economic conditions and local manpowerneeds are certainly among the principal determi-nants in the choice of location of migrants. At thesame time family and community links as well as thegeographical proximity of the country of origin,could be considered significant influential factors.This would permit in part an explanation, in the caseof the United States, the concentration of Asiansfrom the Hawaiian archipelago, the Mexicans inCalifornia and Texas and the Cubans in Florida. Thesame applies to Canada, for the Asians in BritishColombia and the French in Quebec, as it does forFrance, for the North Africans in Corsica and in theregion of the South of France, or in the area ofAndalusia in Spain.
The high concentration of immigrant populationin certain areas poses particular difficulties in termsof the accessibility of public services, the availabilityof housing and more generally the social integrationof new arrivals. In order to even out these problems,certain countries, having received numerous requestsfrom political asylum seekers, have put in place mea-sures with the intention of favouring, more or lesscompulsorily, the dispersal of the latter throughoutthe territory ( e.g. Germany, the United Kingdom andSweden). Nevertheless, policies such as these have alimited impact, essentially because they only con-cern a section of new arrivals and have no impact onthe foreign population already installed.
In th is perspect ive , th e case o f Canadadeserves to be mentioned. The majority of prov-inces have negotiated with the Federal State thepossibility of managing migrant flows which directlyconcerns them and even in certain cases to deter-mine clear individual elements of migration policies(criteria of admission, or quota, if any, etc.). Oncethey are installed, migrants would be permitted tomove about as they please on the territory. In thelong term, including the case of Canada, only activepolicies of regional development could significantlyinfluence the locating of foreigners or immigrantsand, even more generally, the local population.
2. Immigration and population growth in OECD countries
Migration plays a significant role in the annualpopulation growth of many OECD countries. First ofall, the presence of a foreign or foreign-born popula-
tion contributes to the natural increase in the popu-lation (excess of births over deaths). The higher thefertility of foreign women relative to that of nativewomen, the more significant this contribution is.Secondly, when net migration is positive, the popu-lation of the host country grows by the sameamount.
In the following section the contribution ofmigration is examined from the perspective of itsimpact on total population growth in OECD coun-tries. The demographic characteristics of the foreignor foreign-born population are then described. Par-ticular attention is then given to births to foreignersand to persons of foreign origin and to the relation-ship between population ageing and migration.
a) Growth in the total and foreign populations
In order to explain the respective contributionsof net migration and the rate of natural increase tototal population growth in OECD countries, the evo-lution of these components over the past threedecades in the principal OECD geographic regionswill be examined and a description of the currentsituation in Member countries will be presented.
Chart I.7 covers the period 1960-99. It shows therelative contributions of net migration (nationalsand foreigners) and of natural increase (excess ofbirths over deaths) to the total population growth ofthe countries of the European Union and otherMember countries of the OECD. This comparativeanalysis illustrates the general trend of a slowdownin demographic growth. However, this trend is moreor less marked across countries. For example,Australia and the United States, which had a veryhigh rate of natural increase in 1960, experiencedmarked declines thereafter before stabilising in themid-1970s at a relatively high rate, and then settlingat five per thousand at the end of the period. Japan,Poland and Spain, which also initially enjoyed rapiddemographic growth, underwent a considerableadjustment in their birth rates, with their naturalincrease rate approaching nil in the second half ofthe 1990s. In Germany and Sweden the naturalincrease in the population was very low at the endof the period, but the transition was less sudden (fora detailed presentation of the situation of most ofthese countries, see the 1999 edition of Trends inInternational Migration).
In the countries of the European Union, at thebeginning of the 1960s, the relative share of naturalincrease in total population growth was larger than
© OECD 2001
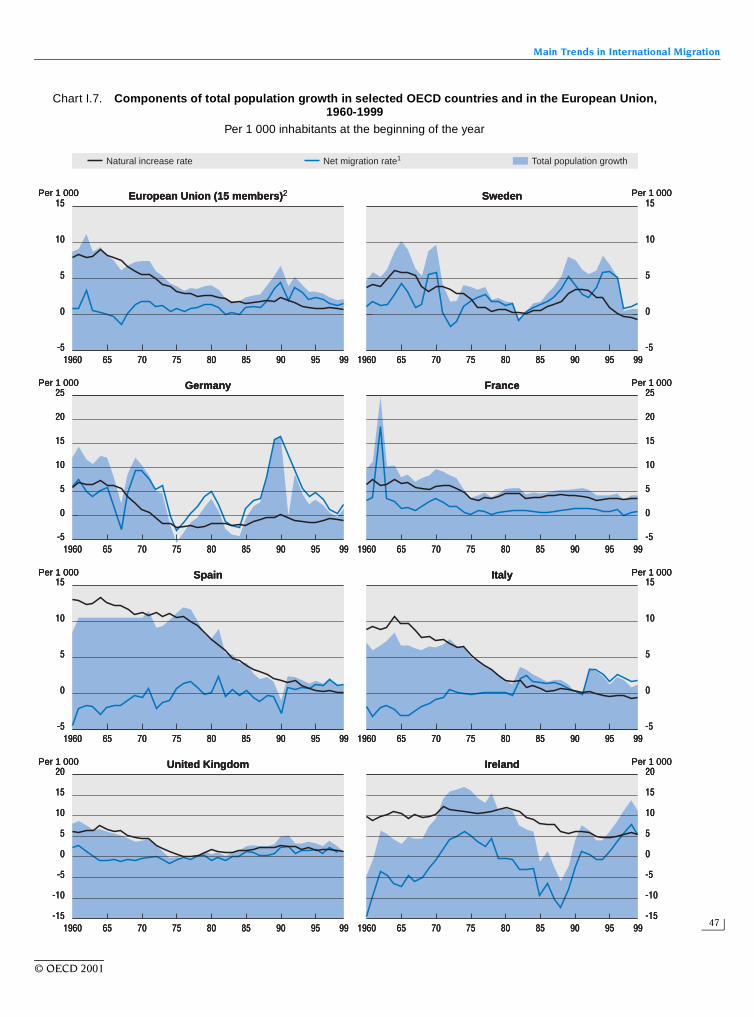
Main Trends in International Migration
47
Chart I.7. Components of total population growth in selected OECD countries and in the European Union, 1960-1999
Per 1 000 inhabitants at the beginning of the year
15
10
5
0
-5
15
10
5
0
-5
25
20
15
10
5
0
-5
25
20
15
10
5
0
-5
15
10
5
0
-5
15
10
5
0
-5
20
15
10
5
0
-5
-10
-15
20
15
10
5
0
-5
-10
-151960 65 70 75 80 85 90 95 99 1960 65 70 75 80 85 90 95 99
1960 65 70 75 80 85 90 95 99 1960 65 70 75 80 85 90 95 99
1960 65 70 75 80 85 90 95 99 1960 65 70 75 80 85 90 95 99
1960 65 70 75 80 85 90 95 99 1960 65 70 75 80 85 90 95 99
European Union (15 members)2Per 1 000
Natural increase rate Net migration rate1 Total population growth
Sweden
Germany France
Spain Italy
United Kingdom Ireland
Per 1 000
Per 1 000 Per 1 000
Per 1 000 Per 1 000
Per 1 000 Per 1 000
15
10
5
0
-5
15
10
5
0
-5
25
20
15
10
5
0
-5
25
20
15
10
5
0
-5
15
10
5
0
-5
15
10
5
0
-5
20
15
10
5
0
-5
-10
-15
20
15
10
5
0
-5
-10
-151960 65 70 75 80 85 90 95 99 1960 65 70 75 80 85 90 95 99
1960 65 70 75 80 85 90 95 99 1960 65 70 75 80 85 90 95 99
1960 65 70 75 80 85 90 95 99 1960 65 70 75 80 85 90 95 99
1960 65 70 75 80 85 90 95 99 1960 65 70 75 80 85 90 95 99
European Union (15 members)2Per 1 000
Natural increase rate Net migration rate1 Total population growth
Sweden
Germany France
Spain Italy
United Kingdom Ireland
Per 1 000
Per 1 000 Per 1 000
Per 1 000 Per 1 000
Per 1 000 Per 1 000
© OECD 2001
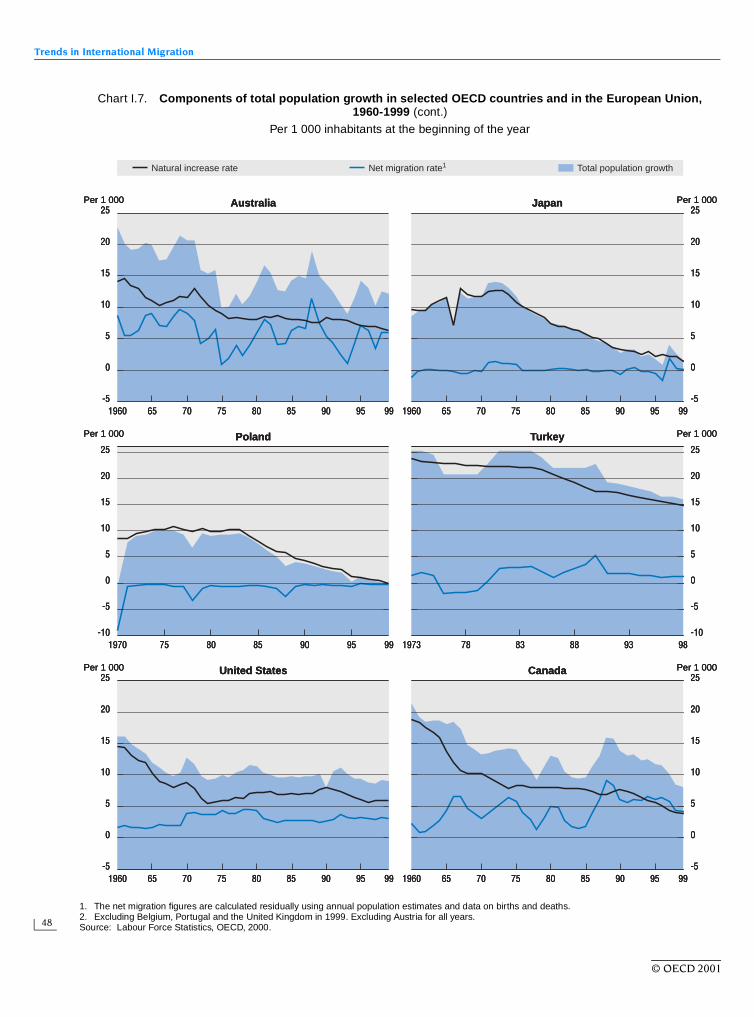
Trends in International Migration
48
Chart I.7. Components of total population growth in selected OECD countries and in the European Union, 1960-1999 (cont.)
Per 1 000 inhabitants at the beginning of the year
1. The net migration figures are calculated residually using annual population estimates and data on births and deaths.2. Excluding Belgium, Portugal and the United Kingdom in 1999. Excluding Austria for all years.Source: Labour Force Statistics, OECD, 2000.
1960
25
20
15
10
5
0
-5
25
20
15
10
5
0
-5
25
20
15
10
5
0
-5
25
20
15
10
5
0
-5
-10
25
20
15
10
5
0
-5
-10
25
20
15
10
5
0
-5
65 70 75 80 85 90 95 99
1970 75 80 85 90 95 99
1960 65 70 75 80 85 90 95 99 1960 65 70 75 80 85 90 95 99
1973 78 83 88 93 98
1960 65 70 75 80 85 90 95 99
Net migration rate1Natural increase rate Total population growth
AustraliaPer 1 000 Per 1 000Japan
Poland Turkey
United States CanadaPer 1 000 Per 1 000
Per 1 000 Per 1 000
© OECD 2001
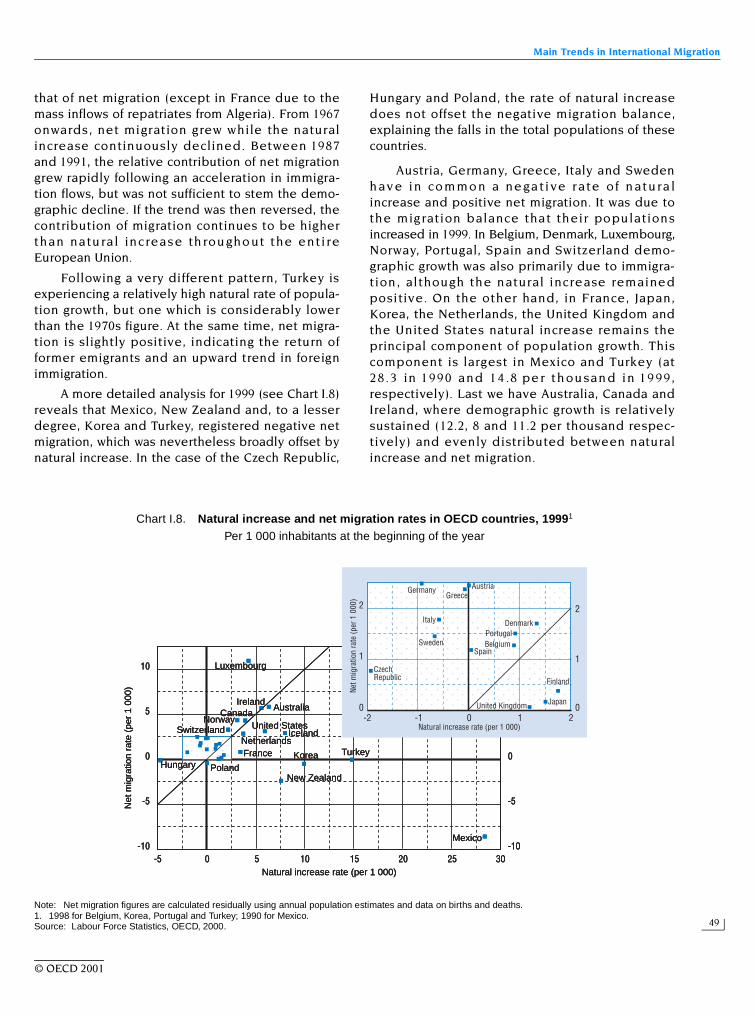
Main Trends in International Migration
49
that of net migration (except in France due to themass inflows of repatriates from Algeria). From 1967onwards, net migration grew while the naturalincrease continuously declined. Between 1987and 1991, the relative contribution of net migrationgrew rapidly following an acceleration in immigra-tion flows, but was not sufficient to stem the demo-graphic decline. If the trend was then reversed, thecontribution of migration continues to be higherthan natu ra l inc rease th rou gho ut the enti reEuropean Union.
Following a very different pattern, Turkey isexperiencing a relatively high natural rate of popula-tion growth, but one which is considerably lowerthan the 1970s figure. At the same time, net migra-tion is slightly positive, indicating the return offormer emigrants and an upward trend in foreignimmigration.
A more detailed analysis for 1999 (see Chart I.8)reveals that Mexico, New Zealand and, to a lesserdegree, Korea and Turkey, registered negative netmigration, which was nevertheless broadly offset bynatural increase. In the case of the Czech Republic,
Hungary and Poland, the rate of natural increasedoes not offset the negative migration balance,explaining the falls in the total populations of thesecountries.
Austria, Germany, Greece, Italy and Swedenh av e in co mmo n a ne ga t ive r ate of n atu ra lincrease and positive net migration. It was due tothe migration balance that their populationsincreased in 1999. In Belgium, Denmark, Luxembourg,Norway, Portugal, Spain and Switzerland demo-graphic growth was also primarily due to immigra-tion, although the natural increase remainedpositive. On the other hand, in France, Japan,Korea, the Netherlands, the United Kingdom andthe United States natural increase remains theprincipal component of population growth. Thiscomponent is largest in Mexico and Turkey (at28 .3 in 1990 and 14 .8 pe r th ou san d in 19 99,respectively). Last we have Australia, Canada andIreland, where demographic growth is relativelysustained (12.2, 8 and 11.2 per thousand respec-tively) and evenly distributed between naturalincrease and net migration.
Chart I.8. Natural increase and net migration rates in OECD countries, 19991
Per 1 000 inhabitants at the beginning of the year
Note: Net migration figures are calculated residually using annual population estimates and data on births and deaths.1. 1998 for Belgium, Korea, Portugal and Turkey; 1990 for Mexico.Source: Labour Force Statistics, OECD, 2000.
-2 -1 0 1 2
2
1
0
2
1
0
0 5 10 15 20 25 30
0
-5
-10
10
5
0
-5
-10-5
Net
mig
ratio
n ra
te (
per
1 00
0)
Natural increase rate (per 1 000)
Mexico
Natural increase rate (per 1 000)
Net m
igra
tion
rate
(per
1 0
00) Greece
Denmark
Austria
Portugal
Spain
Finland
Sweden
United Kingdom
Belgium
Italy
Japan
Germany
CzechRepublic
Luxembourg
Canada
New Zealand
Australia
United StatesNorway
PolandHungaryFrance
Ireland
Iceland
TurkeyKorea
NetherlandsSwitzerland
© OECD 2001
Trends in International Migration
50
This analysis points to the conclusion that overa long period (be it by region or by country, 1960-99)or by cross-section (by country, in 1999), naturalincrease is more important than net migration intotal population growth in many OECD countries.The trend is all the more marked in those countrieswhere fertility rates are low (Austria, Germany,Greece and Italy). In settlement countries, such asAustralia, Canada and the United States, which con-tinue to receive substantial numbers of new immi-grants each year, the predominance of family-linkedimmigration in total inflows and the younger agestructure of the new arrivals exert a marked effect,over the medium and long term, on the natural rateof increase in the population. At the same time, insome countries such as Mexico and Turkey whereemigration is substantial, natural increase still playsa decisive role in population growth. The same istrue in the United States and in a few countrieswhere the birth rate has fallen less, France and theNetherlands for example. In both these countriesthe long-term settlement of immigrants and mem-bers of their families has helped, by means of for-eign births, to enhance the contribution of naturalincrease.
b) Foreign births: a brake on demographic ageing
In a number of European OECD countries,births to foreign nationals and to persons of foreignorigin account for a sizeable percentage of totalbirths (see Box I.5 for the measurement of thesebirths), often greater than the proportion of foreign-ers in the total population. Foreign births contribute
to the natural increase in the population and cantherefore act as a brake on demographic ageing.This is not an inevitable result, however, and itdepends essentially on a continuing succession ofmigration waves. A prolonged halt to new immigra-tion could eventually lead to a marked reduction inthese beneficial effects insofar as the fertility rate offoreign women tends to converge with that ofnationals.
The share of foreign births is, in some OECDMember countries, high (see Chart I.9). This was thecase, for example, in Luxembourg (48.5%) andSwitzerland (22.9%) in 1999. However, in the UnitedKingdom (England and Wales only), Germany andFrance, foreign births accounted for between 10 and13% of all births. Nevertheless, Italy, Finland andespecially Japan and Hungary all have significantlylower levels, which can be explained, inter alia, bythe relatively small share of foreigners in their totalpopulation.
It was in Portugal, the United Kingdom (Englandand Wales only), Italy and France that the propor-tion of foreign births in all births as compared withthe proportion of foreigners in the total populationwas greatest in 1999 (over 1.5). It is particularly low(under 1), on the other hand, in Japan where immi-gration is above all temporary and in Belgium whereEuropeans represent a substantial proportion ofnon-naturalised immigrants.
A number of explanations can be put forward toaccount for the variations observed over the pasttwo decades, the relative importance of whichdepends on the country concerned: higher or lower
Box I.5. Measuring foreign births
It is difficult to obtain comparable data on foreign births as the term “foreign” may apply to the child or to theparents. If it applies to the parents, the number of foreign births will vary according to whether the criterionadopted is the nationality of both parents, of the mother or of the father.
Generally, since fertility is studied in relation to women, the nationality of reference chosen is that of themother. In Belgium, Germany, Luxembourg, the Netherlands and Switzerland foreign births are those of childrenpossessing foreign nationality. In France and Sweden, for example, foreign births are those to female foreignnationals, in Japan those where both parents are foreign nationals, and in England and Wales they are those tomothers born outside the United Kingdom.
Data based solely on births to foreign mothers do not adequately reflect the contribution to total births linkedto the presence of the foreign population or that of foreign origin. Moreover, in general, the degree to which the leg-islation on naturalisations is more or less liberal can either speed up or slow down the process of absorption of for-eigners into the national population and thereby reduce or increase the number of foreign births.
© OECD 2001
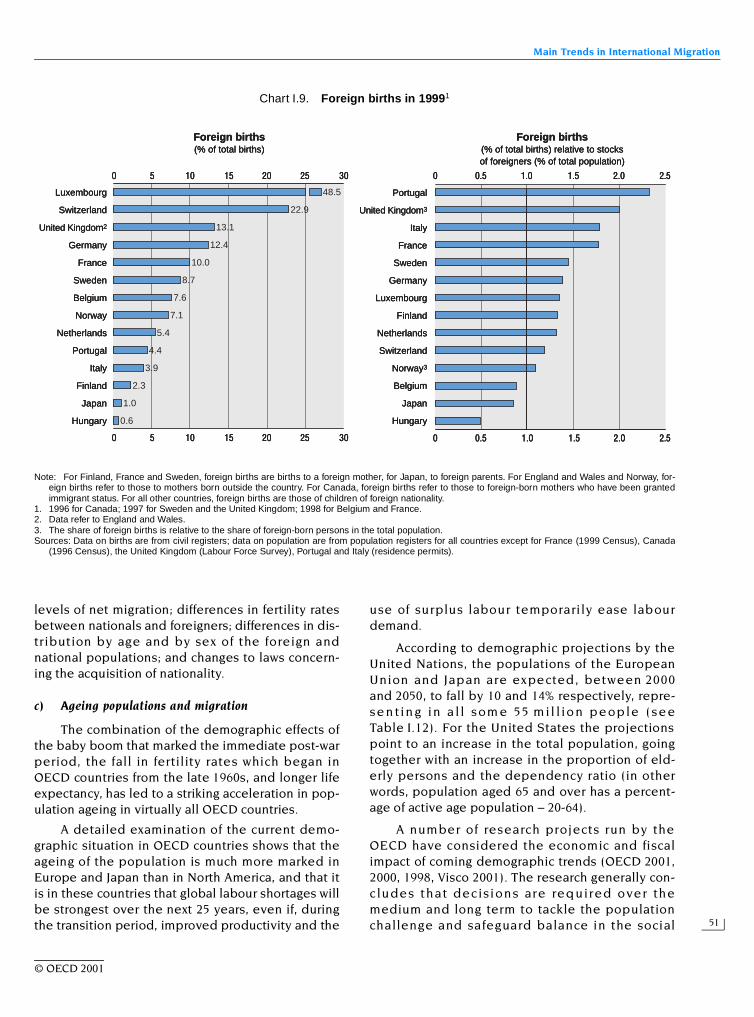
Main Trends in International Migration
51
levels of net migration; differences in fertility ratesbetween nationals and foreigners; differences in dis-tribution by age and by sex of the foreign andnational populations; and changes to laws concern-ing the acquisition of nationality.
c) Ageing populations and migration
The combination of the demographic effects ofthe baby boom that marked the immediate post-warperiod, the fall in fertility rates which began inOECD countries from the late 1960s, and longer lifeexpectancy, has led to a striking acceleration in pop-ulation ageing in virtually all OECD countries.
A detailed examination of the current demo-graphic situation in OECD countries shows that theageing of the population is much more marked inEurope and Japan than in North America, and that itis in these countries that global labour shortages willbe strongest over the next 25 years, even if, duringthe transition period, improved productivity and the
use of surplus labour temporarily ease labourdemand.
According to demographic projections by theUnited Nations, the populations of the EuropeanUnion and Japan are expected, between 2000and 2050, to fall by 10 and 14% respectively, repre-se n t in g in a l l som e 55 mi l l io n pe ople (se eTable I.12). For the United States the projectionspoint to an increase in the total population, goingtogether with an increase in the proportion of eld-erly persons and the dependency ratio (in otherwords, population aged 65 and over has a percent-age of active age population – 20-64).
A number of research projects run by theOECD have considered the economic and fiscalimpact of coming demographic trends (OECD 2001,2000, 1998, Visco 2001). The research generally con-c ludes that dec isions are required over themedium and long term to tackle the populationchallenge and safeguard balance in the social
Chart I.9. Foreign births in 19991
Note: For Finland, France and Sweden, foreign births are births to a foreign mother, for Japan, to foreign parents. For England and Wales and Norway, for-eign births refer to those to mothers born outside the country. For Canada, foreign births refer to those to foreign-born mothers who have been grantedimmigrant status. For all other countries, foreign births are those of children of foreign nationality.
1. 1996 for Canada; 1997 for Sweden and the United Kingdom; 1998 for Belgium and France.2. Data refer to England and Wales. 3. The share of foreign births is relative to the share of foreign-born persons in the total population.Sources: Data on births are from civil registers; data on population are from population registers for all countries except for France (1999 Census), Canada
(1996 Census), the United Kingdom (Labour Force Survey), Portugal and Italy (residence permits).
0 5 10 15 20 25 30 0 0.5 1.0 1.5 2.0 2.5
0 0.5 1.0 1.5 2.0 2.50 5 10 15 20 25 30
48.5
22.9
13.1
12.4
10.0
8.7
7.6
7.1
5.4
4.4
3.9
2.3
1.0
0.6
Foreign births(% of total births)
Foreign births(% of total births) relative to stocksof foreigners (% of total population)
United Kingdom3
Portugal
Italy
France
Sweden
Germany
Luxembourg
Finland
Netherlands
Switzerland
Norway3
Belgium
Japan
Hungary
United Kingdom2
Luxembourg
Switzerland
Germany
France
Sweden
Belgium
Norway
Netherlands
Portugal
Italy
Finland
Japan
Hungary
© OECD 2001
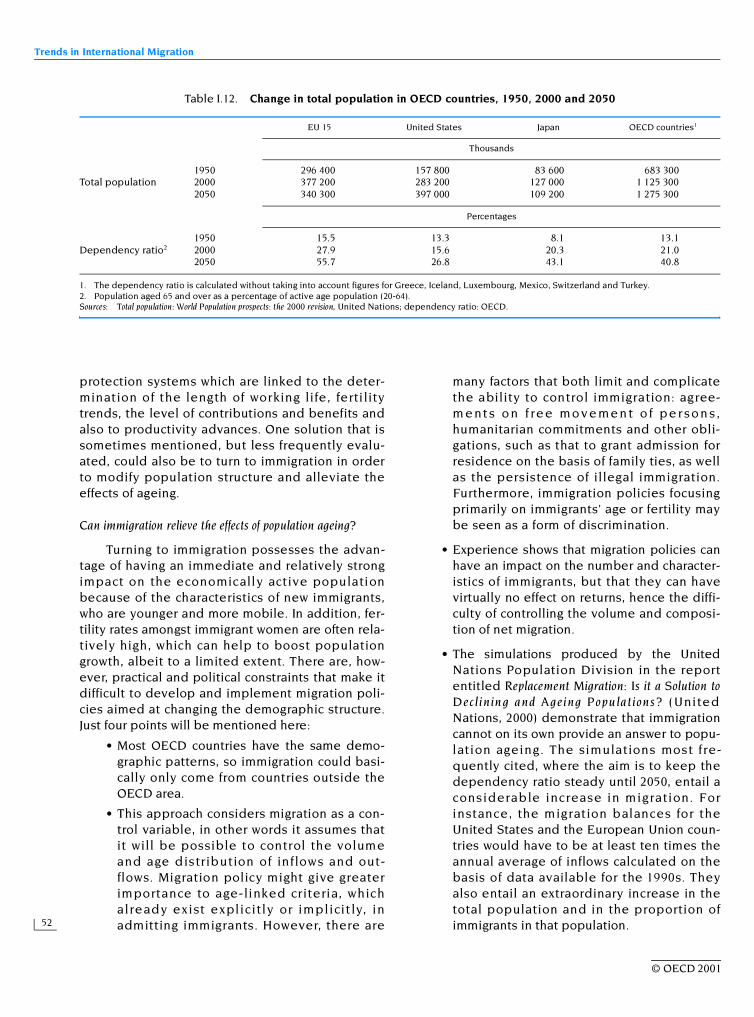
Trends in International Migration
52
protection systems which are linked to the deter-mination of the length of working life, fertilitytrends, the level of contributions and benefits andalso to productivity advances. One solution that issometimes mentioned, but less frequently evalu-ated, could also be to turn to immigration in orderto modify population structure and alleviate theeffects of ageing.
Can immigration relieve the effects of population ageing?
Turning to immigration possesses the advan-tage of having an immediate and relatively strongimpact on the economically active populationbecause of the characteristics of new immigrants,who are younger and more mobile. In addition, fer-tility rates amongst immigrant women are often rela-tively high, which can help to boost populationgrowth, albeit to a limited extent. There are, how-ever, practical and political constraints that make itdifficult to develop and implement migration poli-cies aimed at changing the demographic structure.Just four points will be mentioned here:
• Most OECD countries have the same demo-graphic patterns, so immigration could basi-cally only come from countries outside theOECD area.
• This approach considers migration as a con-trol variable, in other words it assumes thatit will be possible to control the volumeand age distribution of inflows and out-flows. Migration policy might give greaterimportance to age-linked criteria, whichalready exist explicitly or implicit ly, inadmitting immigrants. However, there are
many factors that both limit and complicatethe ability to control immigration: agree-m e nt s o n f re e mo v e me n t o f pe r so n s ,humanitarian commitments and other obli-gations, such as that to grant admission forresidence on the basis of family ties, as wellas the persistence of illegal immigration.Furthermore, immigration policies focusingprimarily on immigrants’ age or fertility maybe seen as a form of discrimination.
• Experience shows that migration policies canhave an impact on the number and character-istics of immigrants, but that they can havevirtually no effect on returns, hence the diffi-culty of controlling the volume and composi-tion of net migration.
• The simulations produced by the UnitedNations Population Division in the reportentitled Replacement Migration: Is it a Solution toDecl ining and Ageing Popu lat ions? (UnitedNations, 2000) demonstrate that immigrationcannot on its own provide an answer to popu-lation ageing. The simulations most fre-quently cited, where the aim is to keep thedependency ratio steady until 2050, entail aconsiderable increase in migration. Forinstance, the migration balances for theUnited States and the European Union coun-tries would have to be at least ten times theannual average of inflows calculated on thebasis of data available for the 1990s. Theyalso entail an extraordinary increase in thetotal population and in the proportion ofimmigrants in that population.
Table I.12. Change in total population in OECD countries, 1950, 2000 and 2050
1. The dependency ratio is calculated without taking into account figures for Greece, Iceland, Luxembourg, Mexico, Switzerland and Turkey.2. Population aged 65 and over as a percentage of active age population (20-64).Sources: Total population: World Population prospects: the 2000 revision, United Nations; dependency ratio: OECD.
EU 15 United States Japan OECD countries1
Thousands
1950 296 400 157 800 83 600 683 300Total population 2000 377 200 283 200 127 000 1 125 300
2050 340 300 397 000 109 200 1 275 300
Percentages
1950 15.5 13.3 8.1 13.1Dependency ratio2 2000 27.9 15.6 20.3 21.0
2050 55.7 26.8 43.1 40.8
© OECD 2001
Main Trends in International Migration
53
So should the idea of using immigration to alleviate the imbalance in the age structure be rejected?
There can be no doubt that immigration canhelp to prevent a decrease in population for a lim-ited time, although it can only be expected to havea marginal impact on the anticipated imbalance inthe age structure. To achieve a more significantimpact, migration policy would have to be adjustedsignificantly so as to contribute, inter alia, to theobjective of labour market adjustment and a morebalanced age structure.
Even if a desire for change clearly exists (as hasbeen perceptible recently in Germany, and perhapswithin the European Union as well), immigrationpolicy is often politically sensitive. In many coun-tries there is usually some flexibility within existinglegislation that allows variations in the volume andcomposition of immigration intakes as well as choicein the distribution of resources across the range ofactivities related to migration policy (control offlows, selective recruitment and integration). Somecountries already have a comprehensive andco-ordinated approach towards immigration (nota-bly Australia and Canada) including age-relatedselection criteria for some categories of immigrant.Other countries do not use age-linked criteriaexplicitly, but their migration system and the way itis implemented affects the age distribution ofinflows. This is the case with the preference systemin the United States. It is also the case in Europe, inparticular, via the regularisation programmes thatprimar ily benefit only economically active immi-grants. Lastly, other countries, if they decided toshift to a permanent immigration policy, may findthat new immigration programmes and a change inapproach to immigration policy would be required.
One of the questions still unresolved, how-ever, is the scope for shaping a migration policythat will reconcile the long-term demographicobjective and the need to safeguard labour marketequilibrium over the short and medium term.While this raises relatively few problems against abackdrop of economic expansion, it is far moreproblematic in a period of recession. In addition,such migration policy should be openly based onconvergent strategic interests between countriesaffected by demographic decline and those experi-encing population growth. Such policies are avail-able, but the motivation for putting them intopractice is as yet insufficient.
B. IMMIGRANTS AND THE LABOUR MARKET
In general, trends in the foreign labour forceand its labour market characteristics (participation,sectoral distribution, unemployment) are not onlythe result of the profile of new migration flows, butalso of the economic and institutional changes thathave taken place during the period under consider-ation. In particular, changes in the conditionsrequired to obtain naturalisation and the demo-graphic contribution of new generations of foreignersentering the labour market can have a considerableimpact on the size of the foreign labour force. Simi-larly, the history of immigration and changes in thecharacteristics of the production system and the leg-islation on the status of immigrants and their labourmarket access all affect the trend of the participationrate and the sectoral distribution of jobs.
The upturn in economic activity in the OECDarea has had a major impact on employment inMember countries in recent years, particularly in theEU countries and Korea. For example, between 1999and 2000 the overall unemployment rate fell byfour-tenths of a point (and by nine-tenths of a pointfor the European Union). Over the same period totalemployment rose by 1.3% in the United States andby 2% in the European Union, falling by 0.2% inJapan. According to OECD forecasts (OECD, 2001a),these trends should continue in 2001 and 2002, butat a more moderate pace.
1. Foreigners’ contribution to the labour force is increasing
Over the last five years, the proportion of for-eigners or the foreign-born in the total labour forcehas increased significantly in a number of OECDcountries, notably in Southern Europe, Luxembourgand the United States (see Table I.13). By contrast,the proportion declined slightly in France, Germanyand the Netherlands between 1994 and 1999.
Classified by the size of the foreign or foreign-born share of total employment, three groups ofcountries could be distinguished in 1999: a first groupmade up (in descending order) of Luxembourg,Australia, Canada and Switzerland, with shares ofbetween 57 and 18%; a second group, made up of theUnited States, Austria, Germany, Belgium and Francewhere the shares were at an intermediate level,between about 12 and 6%; and a third group made upof the United Kingdom, Ireland, the Netherlands andthe Nordic and Southern European countries with theforeign shares of total employment at less than 5%.
© OECD 2001
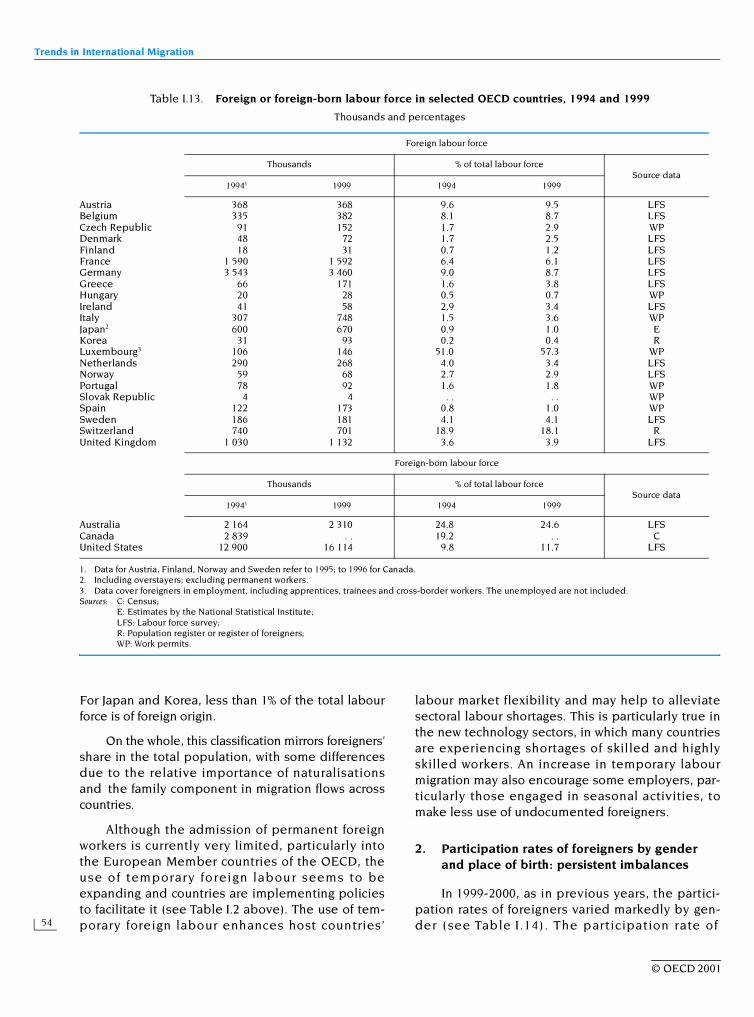
Trends in International Migration
54
For Japan and Korea, less than 1% of the total labourforce is of foreign origin.
On the whole, this classification mirrors foreigners’share in the total population, with some differencesdue to the relative importance of naturalisationsand the family component in migration flows acrosscountries.
Although the admission of permanent foreignworkers is currently very limited, particularly intothe European Member countries of the OECD, theuse of temporary foreign labour seems to beexpanding and countries are implementing policiesto facilitate it (see Table I.2 above). The use of tem-porary foreign labour enhances host countries’
labour market flexibility and may help to alleviatesectoral labour shortages. This is particularly true inthe new technology sectors, in which many countriesare experiencing shortages of skilled and highlyskilled workers. An increase in temporary labourmigration may also encourage some employers, par-ticularly those engaged in seasonal activities, tomake less use of undocumented foreigners.
2. Participation rates of foreigners by gender and place of birth: persistent imbalances
In 1999-2000, as in previous years, the partici-pation rates of foreigners varied markedly by gen-der (see Table I.14). The participation rate of
Table I.13. Foreign or foreign-born labour force in selected OECD countries, 1994 and 1999
Thousands and percentages
1. Data for Austria, Finland, Norway and Sweden refer to 1995; to 1996 for Canada.2. Including overstayers; excluding permanent workers.3. Data cover foreigners in employment, including apprentices, trainees and cross-border workers. The unemployed are not included.Sources: C: Census;
E: Estimates by the National Statistical Institute; LFS: Labour force survey; R: Population register or register of foreigners; WP: Work permits.
Foreign labour force
Thousands % of total labour forceSource data
19941 1999 1994 1999
Austria 368 368 9.6 9.5 LFSBelgium 335 382 8.1 8.7 LFSCzech Republic 91 152 1.7 2.9 WPDenmark 48 72 1.7 2.5 LFSFinland 18 31 0.7 1.2 LFSFrance 1 590 1 592 6.4 6.1 LFSGermany 3 543 3 460 9.0 8.7 LFSGreece 66 171 1.6 3.8 LFSHungary 20 28 0.5 0.7 WPIreland 41 58 2.9 3.4 LFSItaly 307 748 1.5 3.6 WPJapan2 600 670 0.9 1.0 EKorea 31 93 0.2 0.4 RLuxembourg3 106 146 51.0 57.3 WPNetherlands 290 268 4.0 3.4 LFSNorway 59 68 2.7 2.9 LFSPortugal 78 92 1.6 1.8 WPSlovak Republic 4 4 . . . . WPSpain 122 173 0.8 1.0 WPSweden 186 181 4.1 4.1 LFSSwitzerland 740 701 18.9 18.1 RUnited Kingdom 1 030 1 132 3.6 3.9 LFS
Foreign-born labour force
Thousands % of total labour forceSource data
19941 1999 1994 1999
Australia 2 164 2 310 24.8 24.6 LFSCanada 2 839 . . 19.2 . . CUnited States 12 900 16 114 9.8 11.7 LFS
© OECD 2001
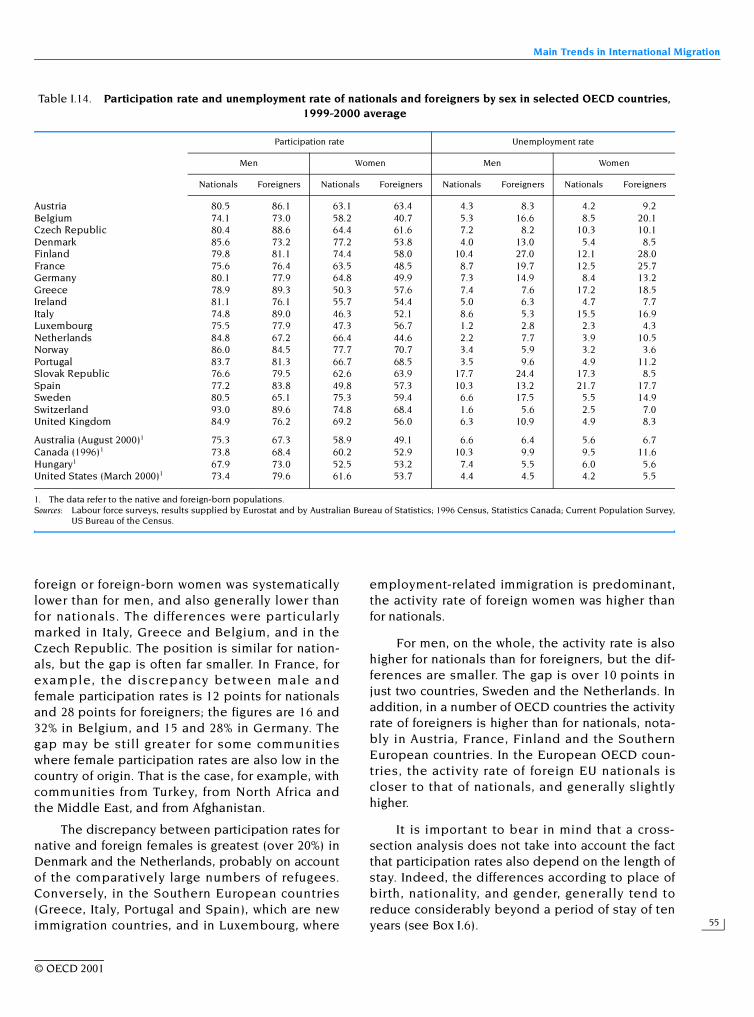
Main Trends in International Migration
55
foreign or foreign-born women was systematicallylower than for men, and also generally lower thanfor nationals. The differences were particularlymarked in Italy, Greece and Belgium, and in theCzech Republic. The position is similar for nation-als, but the gap is often far smaller. In France, forexample, the discrepancy between male andfemale participation rates is 12 points for nationalsand 28 points for foreigners; the figures are 16 and32% in Belgium, and 15 and 28% in Germany. Thegap may be still greater for some communitieswhere female participation rates are also low in thecountry of origin. That is the case, for example, withcommunities from Turkey, from North Africa andthe Middle East, and from Afghanistan.
The discrepancy between participation rates fornative and foreign females is greatest (over 20%) inDenmark and the Netherlands, probably on accountof the comparatively large numbers of refugees.Conversely, in the Southern European countries(Greece, Italy, Portugal and Spain), which are newimmigration countries, and in Luxembourg, where
employment-related immigration is predominant,the activity rate of foreign women was higher thanfor nationals.
For men, on the whole, the activity rate is alsohigher for nationals than for foreigners, but the dif-ferences are smaller. The gap is over 10 points injust two countries, Sweden and the Netherlands. Inaddition, in a number of OECD countries the activityrate of foreigners is higher than for nationals, nota-bly in Austria, France, Finland and the SouthernEuropean countries. In the European OECD coun-tries, the activity rate of foreign EU nationals iscloser to that of nationals, and generally slightlyhigher.
It is important to bear in mind that a cross-section analysis does not take into account the factthat participation rates also depend on the length ofstay. Indeed, the differences according to place ofbirth, nationality, and gender, generally tend toreduce considerably beyond a period of stay of tenyears (see Box I.6).
Table I.14. Participation rate and unemployment rate of nationals and foreigners by sex in selected OECD countries, 1999-2000 average
1. The data refer to the native and foreign-born populations.Sources: Labour force surveys, results supplied by Eurostat and by Australian Bureau of Statistics; 1996 Census, Statistics Canada; Current Population Survey,
US Bureau of the Census.
Participation rate Unemployment rate
Men Women Men Women
Nationals Foreigners Nationals Foreigners Nationals Foreigners Nationals Foreigners
Austria 80.5 86.1 63.1 63.4 4.3 8.3 4.2 9.2Belgium 74.1 73.0 58.2 40.7 5.3 16.6 8.5 20.1Czech Republic 80.4 88.6 64.4 61.6 7.2 8.2 10.3 10.1Denmark 85.6 73.2 77.2 53.8 4.0 13.0 5.4 8.5Finland 79.8 81.1 74.4 58.0 10.4 27.0 12.1 28.0France 75.6 76.4 63.5 48.5 8.7 19.7 12.5 25.7Germany 80.1 77.9 64.8 49.9 7.3 14.9 8.4 13.2Greece 78.9 89.3 50.3 57.6 7.4 7.6 17.2 18.5Ireland 81.1 76.1 55.7 54.4 5.0 6.3 4.7 7.7Italy 74.8 89.0 46.3 52.1 8.6 5.3 15.5 16.9Luxembourg 75.5 77.9 47.3 56.7 1.2 2.8 2.3 4.3Netherlands 84.8 67.2 66.4 44.6 2.2 7.7 3.9 10.5Norway 86.0 84.5 77.7 70.7 3.4 5.9 3.2 3.6Portugal 83.7 81.3 66.7 68.5 3.5 9.6 4.9 11.2Slovak Republic 76.6 79.5 62.6 63.9 17.7 24.4 17.3 8.5Spain 77.2 83.8 49.8 57.3 10.3 13.2 21.7 17.7Sweden 80.5 65.1 75.3 59.4 6.6 17.5 5.5 14.9Switzerland 93.0 89.6 74.8 68.4 1.6 5.6 2.5 7.0United Kingdom 84.9 76.2 69.2 56.0 6.3 10.9 4.9 8.3
Australia (August 2000)1 75.3 67.3 58.9 49.1 6.6 6.4 5.6 6.7Canada (1996)1 73.8 68.4 60.2 52.9 10.3 9.9 9.5 11.6Hungary1 67.9 73.0 52.5 53.2 7.4 5.5 6.0 5.6United States (March 2000)1 73.4 79.6 61.6 53.7 4.4 4.5 4.2 5.5
© OECD 2001
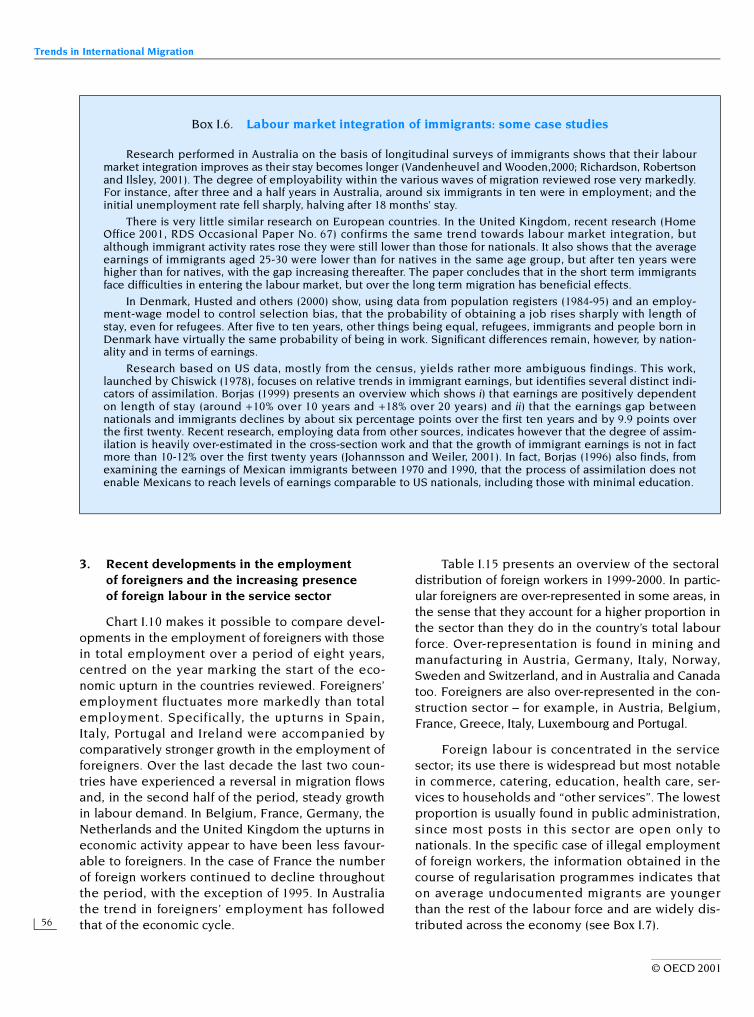
Trends in International Migration
56
3. Recent developments in the employment of foreigners and the increasing presence of foreign labour in the service sector
Chart I.10 makes it possible to compare devel-opments in the employment of foreigners with thosein total employment over a period of eight years,centred on the year marking the start of the eco-nomic upturn in the countries reviewed. Foreigners’employment fluctuates more markedly than totalemployment. Specifically, the upturns in Spain,Italy, Portugal and Ireland were accompanied bycomparatively stronger growth in the employment offoreigners. Over the last decade the last two coun-tries have experienced a reversal in migration flowsand, in the second half of the period, steady growthin labour demand. In Belgium, France, Germany, theNetherlands and the United Kingdom the upturns ineconomic activity appear to have been less favour-able to foreigners. In the case of France the numberof foreign workers continued to decline throughoutthe period, with the exception of 1995. In Australiathe trend in foreigners’ employment has followedthat of the economic cycle.
Table I.15 presents an overview of the sectoraldistribution of foreign workers in 1999-2000. In partic-ular foreigners are over-represented in some areas, inthe sense that they account for a higher proportion inthe sector than they do in the country’s total labourforce. Over-representation is found in mining andmanufacturing in Austria, Germany, Italy, Norway,Sweden and Switzerland, and in Australia and Canadatoo. Foreigners are also over-represented in the con-struction sector – for example, in Austria, Belgium,France, Greece, Italy, Luxembourg and Portugal.
Foreign labour is concentrated in the servicesector; its use there is widespread but most notablein commerce, catering, education, health care, ser-vices to households and “other services”. The lowestproportion is usually found in public administration,since most posts in this sector are open only tonationals. In the specific case of illegal employmentof foreign workers, the information obtained in thecourse of regularisation programmes indicates thaton average undocumented migrants are youngerthan the rest of the labour force and are widely dis-tributed across the economy (see Box I.7).
Box I.6. Labour market integration of immigrants: some case studies
Research performed in Australia on the basis of longitudinal surveys of immigrants shows that their labourmarket integration improves as their stay becomes longer (Vandenheuvel and Wooden,2000; Richardson, Robertsonand Ilsley, 2001). The degree of employability within the various waves of migration reviewed rose very markedly.For instance, after three and a half years in Australia, around six immigrants in ten were in employment; and theinitial unemployment rate fell sharply, halving after 18 months’ stay.
There is very little similar research on European countries. In the United Kingdom, recent research (HomeOffice 2001, RDS Occasional Paper No. 67) confirms the same trend towards labour market integration, butalthough immigrant activity rates rose they were still lower than those for nationals. It also shows that the averageearnings of immigrants aged 25-30 were lower than for natives in the same age group, but after ten years werehigher than for natives, with the gap increasing thereafter. The paper concludes that in the short term immigrantsface difficulties in entering the labour market, but over the long term migration has beneficial effects.
In Denmark, Husted and others (2000) show, using data from population registers (1984-95) and an employ-ment-wage model to control selection bias, that the probability of obtaining a job rises sharply with length ofstay, even for refugees. After five to ten years, other things being equal, refugees, immigrants and people born inDenmark have virtually the same probability of being in work. Significant differences remain, however, by nation-ality and in terms of earnings.
Research based on US data, mostly from the census, yields rather more ambiguous findings. This work,launched by Chiswick (1978), focuses on relative trends in immigrant earnings, but identifies several distinct indi-cators of assimilation. Borjas (1999) presents an overview which shows i) that earnings are positively dependenton length of stay (around +10% over 10 years and +18% over 20 years) and ii) that the earnings gap betweennationals and immigrants declines by about six percentage points over the first ten years and by 9.9 points overthe first twenty. Recent research, employing data from other sources, indicates however that the degree of assim-ilation is heavily over-estimated in the cross-section work and that the growth of immigrant earnings is not in factmore than 10-12% over the first twenty years (Johannsson and Weiler, 2001). In fact, Borjas (1996) also finds, fromexamining the earnings of Mexican immigrants between 1970 and 1990, that the process of assimilation does notenable Mexicans to reach levels of earnings comparable to US nationals, including those with minimal education.
© OECD 2001
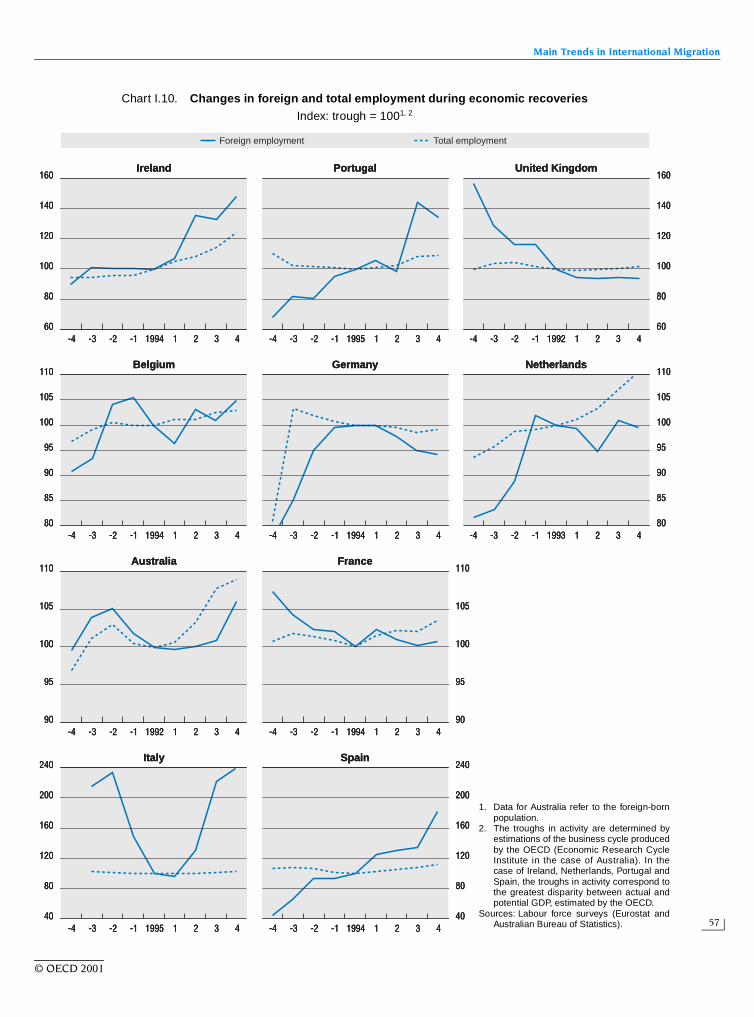
Main Trends in International Migration
57
Chart I.10. Changes in foreign and total employment during economic recoveriesIndex: trough = 1001, 2
160
140
120
100
80
60
160
140
120
100
80
60
110
105
100
95
90
85
80
110
105
100
95
90
85
80
110
105
100
95
90
110
105
100
95
90
240
200
160
120
80
40
240
200
160
120
80
401995-1-2-3-4 1 2 3 4 1994-1-2-3-4 1 2 3 4
1992-1-2-3-4 1 2 3 4 1994-1-2-3-4 1 2 3 4
1994-1-2-3-4 1 2 3 4 1994-1-2-3-4 1 2 3 4
1994-1-2-3-4 1 2 3 4 1995-1-2-3-4 1 2 3 4
1993-1-2-3-4 1 2 3 4
1992-1-2-3-4 1 2 3 4
Foreign employment
Ireland
Total employment
Portugal United Kingdom
Belgium Germany Netherlands
Australia France
Italy Spain
160
140
120
100
80
60
160
140
120
100
80
60
110
105
100
95
90
85
80
110
105
100
95
90
85
80
110
105
100
95
90
110
105
100
95
90
240
200
160
120
80
40
240
200
160
120
80
401995-1-2-3-4 1 2 3 4 1994-1-2-3-4 1 2 3 4
1992-1-2-3-4 1 2 3 4 1994-1-2-3-4 1 2 3 4
1994-1-2-3-4 1 2 3 4 1994-1-2-3-4 1 2 3 4
1994-1-2-3-4 1 2 3 4 1995-1-2-3-4 1 2 3 4
1993-1-2-3-4 1 2 3 4
1992-1-2-3-4 1 2 3 4
Foreign employment
Ireland
Total employment
Portugal United Kingdom
Belgium Germany Netherlands
Australia France
Italy Spain
1. Data for Australia refer to the foreign-bornpopulation.
2. The troughs in activity are determined byestimations of the business cycle producedby the OECD (Economic Research CycleInstitute in the case of Australia). In thecase of Ireland, Netherlands, Portugal andSpain, the troughs in activity correspond tothe greatest disparity between actual andpotential GDP, estimated by the OECD.
Sources: Labour force surveys (Eurostat andAustralian Bureau of Statistics).
© OECD 2001
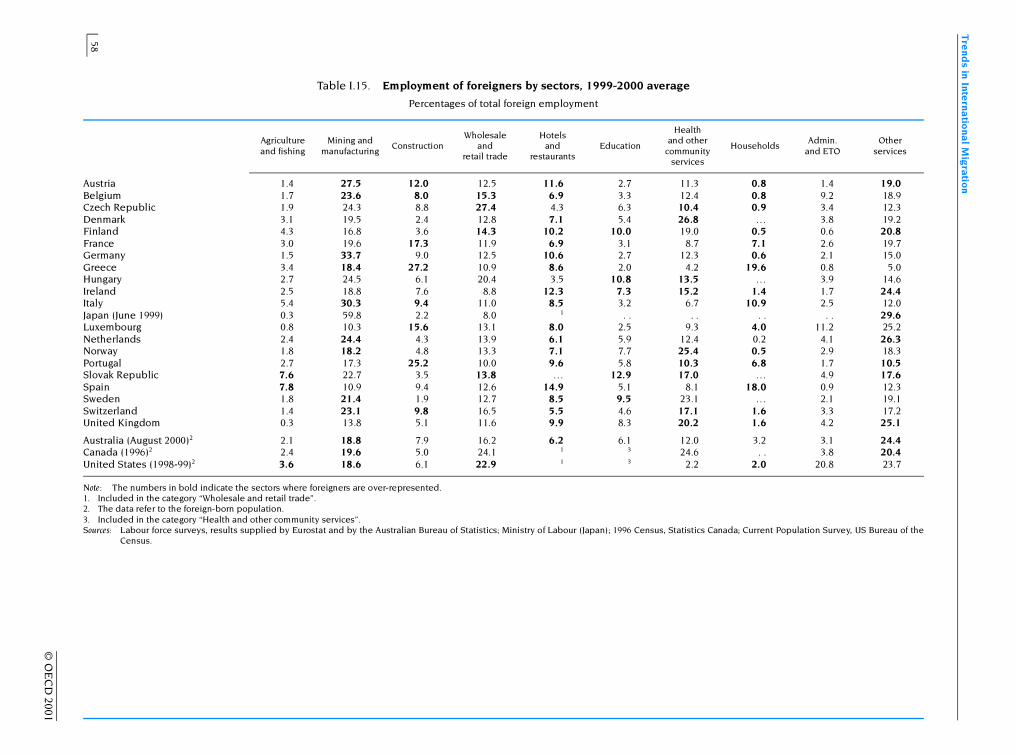
Tre
nds in Inte
rnatio
nal M
igration
58
© O
EC
D 2001
a; Current Population Survey, US Bureau of the
ouseholdsAdmin.
and ETOOther
services
0.8 1.4 19.00.8 9.2 18.90.9 3.4 12.3… 3.8 19.2
0.5 0.6 20.87.1 2.6 19.70.6 2.1 15.0
19.6 0.8 5.0… 3.9 14.6
1.4 1.7 24.410.9 2.5 12.0
. . . . 29.64.0 11.2 25.20.2 4.1 26.30.5 2.9 18.36.8 1.7 10.5… 4.9 17.6
18.0 0.9 12.3… 2.1 19.1
1.6 3.3 17.21.6 4.2 25.1
3.2 3.1 24.4. . 3.8 20.4
2.0 20.8 23.7
Table I.15. Employment of foreigners by sectors, 1999-2000 average
Percentages of total foreign employment
Note: The numbers in bold indicate the sectors where foreigners are over-represented.1. Included in the category “Wholesale and retail trade”.2. The data refer to the foreign-born population.3. Included in the category “Health and other community services”.Sources: Labour force surveys, results supplied by Eurostat and by the Australian Bureau of Statistics; Ministry of Labour (Japan); 1996 Census, Statistics Canad
Census.
Agriculture and fishing
Mining and manufacturing
ConstructionWholesale
and retail trade
Hotels and
restaurantsEducation
Health and other
community services
H
Austria 1.4 27.5 12.0 12.5 11.6 2.7 11.3Belgium 1.7 23.6 8.0 15.3 6.9 3.3 12.4Czech Republic 1.9 24.3 8.8 27.4 4.3 6.3 10.4Denmark 3.1 19.5 2.4 12.8 7.1 5.4 26.8Finland 4.3 16.8 3.6 14.3 10.2 10.0 19.0France 3.0 19.6 17.3 11.9 6.9 3.1 8.7Germany 1.5 33.7 9.0 12.5 10.6 2.7 12.3Greece 3.4 18.4 27.2 10.9 8.6 2.0 4.2Hungary 2.7 24.5 6.1 20.4 3.5 10.8 13.5Ireland 2.5 18.8 7.6 8.8 12.3 7.3 15.2Italy 5.4 30.3 9.4 11.0 8.5 3.2 6.7Japan (June 1999) 0.3 59.8 2.2 8.0 1 . . . .Luxembourg 0.8 10.3 15.6 13.1 8.0 2.5 9.3Netherlands 2.4 24.4 4.3 13.9 6.1 5.9 12.4Norway 1.8 18.2 4.8 13.3 7.1 7.7 25.4Portugal 2.7 17.3 25.2 10.0 9.6 5.8 10.3Slovak Republic 7.6 22.7 3.5 13.8 … 12.9 17.0Spain 7.8 10.9 9.4 12.6 14.9 5.1 8.1Sweden 1.8 21.4 1.9 12.7 8.5 9.5 23.1Switzerland 1.4 23.1 9.8 16.5 5.5 4.6 17.1United Kingdom 0.3 13.8 5.1 11.6 9.9 8.3 20.2
Australia (August 2000)2 2.1 18.8 7.9 16.2 6.2 6.1 12.0Canada (1996)2 2.4 19.6 5.0 24.1 1 3 24.6United States (1998-99)2 3.6 18.6 6.1 22.9 1 3 2.2
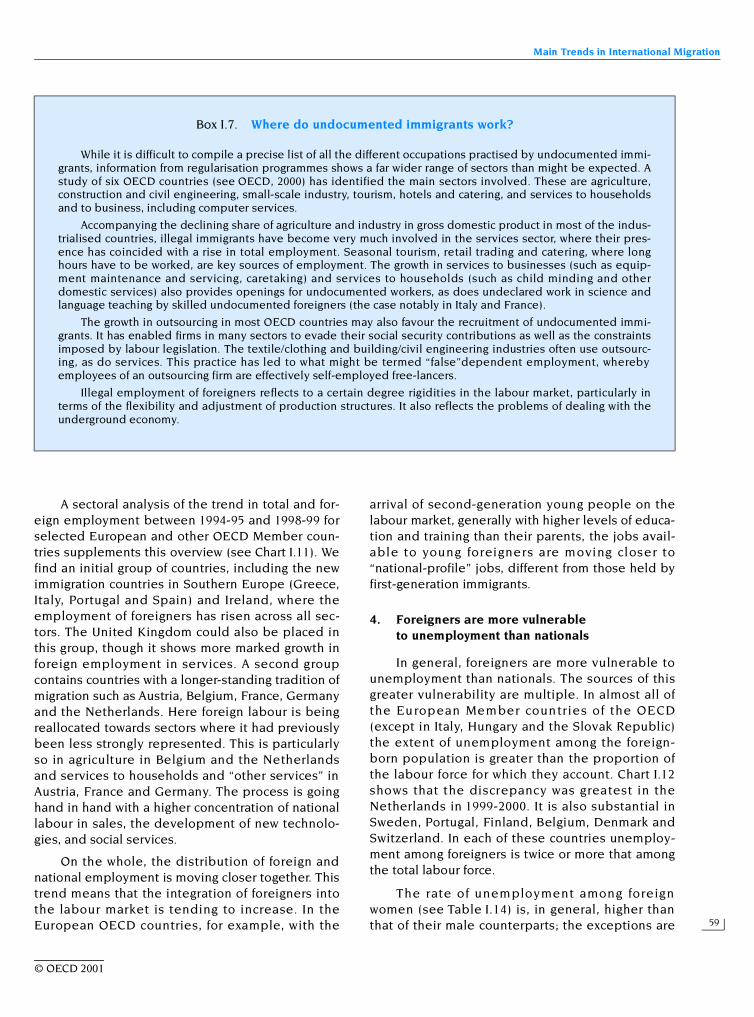
Main Trends in International Migration
59
A sectoral analysis of the trend in total and for-eign employment between 1994-95 and 1998-99 forselected European and other OECD Member coun-tries supplements this overview (see Chart I.11). Wefind an initial group of countries, including the newimmigration countries in Southern Europe (Greece,Italy, Portugal and Spain) and Ireland, where theemployment of foreigners has risen across all sec-tors. The United Kingdom could also be placed inthis group, though it shows more marked growth inforeign employment in services. A second groupcontains countries with a longer-standing tradition ofmigration such as Austria, Belgium, France, Germanyand the Netherlands. Here foreign labour is beingreallocated towards sectors where it had previouslybeen less strongly represented. This is particularlyso in agriculture in Belgium and the Netherlandsand services to households and “other services” inAustria, France and Germany. The process is goinghand in hand with a higher concentration of nationallabour in sales, the development of new technolo-gies, and social services.
On the whole, the distribution of foreign andnational employment is moving closer together. Thistrend means that the integration of foreigners intothe labour market is tending to increase. In theEuropean OECD countries, for example, with the
arrival of second-generation young people on thelabour market, generally with higher levels of educa-tion and training than their parents, the jobs avail-able to young foreigners are moving closer to“national-profile” jobs, different from those held byfirst-generation immigrants.
4. Foreigners are more vulnerable to unemployment than nationals
In general, foreigners are more vulnerable tounemployment than nationals. The sources of thisgreater vulnerability are multiple. In almost all ofthe European Member countries of the OECD(except in Italy, Hungary and the Slovak Republic)the extent of unemployment among the foreign-born population is greater than the proportion ofthe labour force for which they account. Chart I.12shows that the discrepancy was greatest in theNetherlands in 1999-2000. It is also substantial inSweden, Portugal, Finland, Belgium, Denmark andSwitzerland. In each of these countries unemploy-ment among foreigners is twice or more that amongthe total labour force.
The rate of unemployment among foreignwomen (see Table I.14) is, in general, higher thanthat of their male counterparts; the exceptions are
Box I.7. Where do undocumented immigrants work?
While it is difficult to compile a precise list of all the different occupations practised by undocumented immi-grants, information from regularisation programmes shows a far wider range of sectors than might be expected. Astudy of six OECD countries (see OECD, 2000) has identified the main sectors involved. These are agriculture,construction and civil engineering, small-scale industry, tourism, hotels and catering, and services to householdsand to business, including computer services.
Accompanying the declining share of agriculture and industry in gross domestic product in most of the indus-trialised countries, illegal immigrants have become very much involved in the services sector, where their pres-ence has coincided with a rise in total employment. Seasonal tourism, retail trading and catering, where longhours have to be worked, are key sources of employment. The growth in services to businesses (such as equip-ment maintenance and servicing, caretaking) and services to households (such as child minding and otherdomestic services) also provides openings for undocumented workers, as does undeclared work in science andlanguage teaching by skilled undocumented foreigners (the case notably in Italy and France).
The growth in outsourcing in most OECD countries may also favour the recruitment of undocumented immi-grants. It has enabled firms in many sectors to evade their social security contributions as well as the constraintsimposed by labour legislation. The textile/clothing and building/civil engineering industries often use outsourc-ing, as do services. This practice has led to what might be termed “false”dependent employment, wherebyemployees of an outsourcing firm are effectively self-employed free-lancers.
Illegal employment of foreigners reflects to a certain degree rigidities in the labour market, particularly interms of the flexibility and adjustment of production structures. It also reflects the problems of dealing with theunderground economy.
© OECD 2001
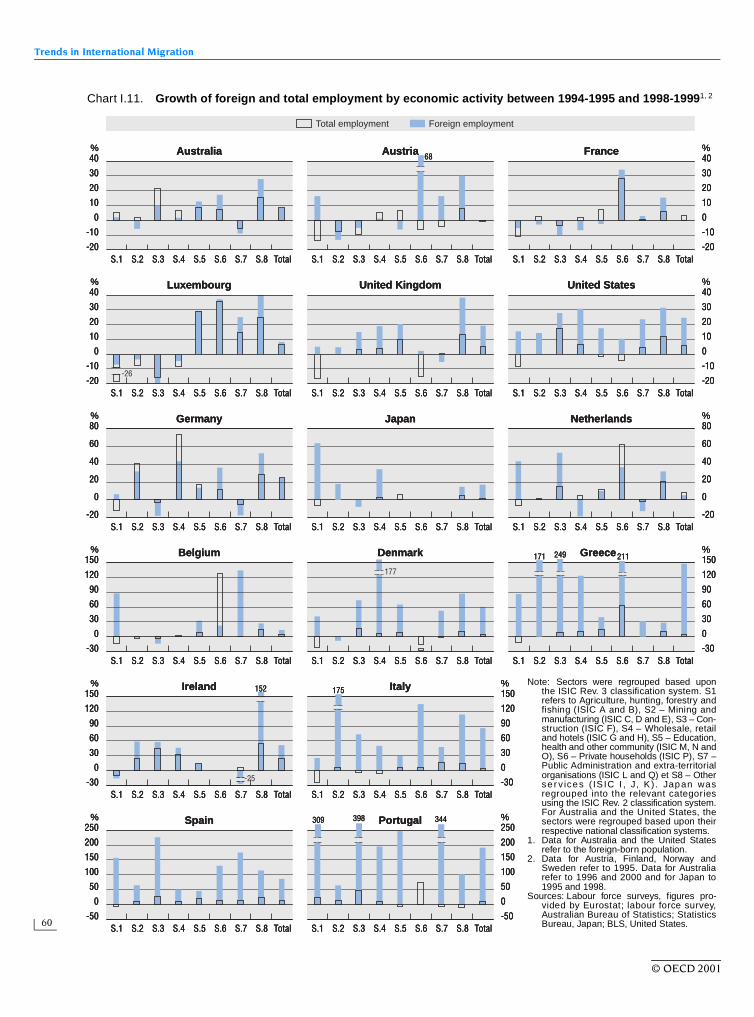
Trends in International Migration
60
Chart I.11. Growth of foreign and total employment by economic activity between 1994-1995 and 1998-19991, 2
40
30
20
10
0
-10
-20
40
30
20
10
0
-10
-20
%40
%
% %
%80
%
%150
%
%150
%250
30
20
10
0
-10
-20
40
30
20
10
0
-10
-20
60
40
20
0
-20
80
60
40
20
0
-20
120
90
60
30
0
-30
150
120
90
60
30
0
-30
120
90
60
30
0
-30
%150
120
90
60
30
0
-30
200
150
100
50
0
-50
%250
200
150
100
50
0
-50S.1 S.2 S.3 S.4 S.5 S.6 S.7 S.8 Total S.8 TotalS.1 S.2 S.3 S.4 S.5 S.6 S.7
S.1 S.2 S.3 S.4 S.5 S.6 S.7 S.8 Total S.8 TotalS.1 S.2 S.3 S.4 S.5 S.6 S.7
S.1 S.2 S.3 S.4 S.5 S.6 S.7 S.8 Total S.8 TotalS.1 S.2 S.3 S.4 S.5 S.6 S.7 S.8 TotalS.1 S.2 S.3 S.4 S.5 S.6 S.7
S.8 TotalS.1 S.2 S.3 S.4 S.5 S.6 S.7S.1 S.2 S.3 S.4 S.5 S.6 S.7 S.8 Total S.8 TotalS.1 S.2 S.3 S.4 S.5 S.6 S.7
S.8 TotalS.1 S.2 S.3 S.4 S.5 S.6 S.7S.1 S.2 S.3 S.4 S.5 S.6 S.7 S.8 Total S.8 TotalS.1 S.2 S.3 S.4 S.5 S.6 S.7
S.8 TotalS.1 S.2 S.3 S.4 S.5 S.6 S.7S.1 S.2 S.3 S.4 S.5 S.6 S.7 S.8 Total S.8 TotalS.1 S.2 S.3 S.4 S.5 S.6 S.7
68
-26
152
-25
175
344398309
177
171 249 211
Total employment Foreign employment
Australia Austria France
Belgium Denmark Greece
Ireland Italy
Spain Portugal
Luxembourg United Kingdom
Germany Japan Netherlands
United States40
30
20
10
0
-10
-20
40
30
20
10
0
-10
-20
%40
%
% %
%80
%
%150
%
%150
%250
30
20
10
0
-10
-20
40
30
20
10
0
-10
-20
60
40
20
0
-20
80
60
40
20
0
-20
120
90
60
30
0
-30
150
120
90
60
30
0
-30
120
90
60
30
0
-30
%150
120
90
60
30
0
-30
200
150
100
50
0
-50
%250
200
150
100
50
0
-50S.1 S.2 S.3 S.4 S.5 S.6 S.7 S.8 Total S.8 TotalS.1 S.2 S.3 S.4 S.5 S.6 S.7
S.1 S.2 S.3 S.4 S.5 S.6 S.7 S.8 Total S.8 TotalS.1 S.2 S.3 S.4 S.5 S.6 S.7
S.1 S.2 S.3 S.4 S.5 S.6 S.7 S.8 Total S.8 TotalS.1 S.2 S.3 S.4 S.5 S.6 S.7 S.8 TotalS.1 S.2 S.3 S.4 S.5 S.6 S.7
S.8 TotalS.1 S.2 S.3 S.4 S.5 S.6 S.7S.1 S.2 S.3 S.4 S.5 S.6 S.7 S.8 Total S.8 TotalS.1 S.2 S.3 S.4 S.5 S.6 S.7
S.8 TotalS.1 S.2 S.3 S.4 S.5 S.6 S.7S.1 S.2 S.3 S.4 S.5 S.6 S.7 S.8 Total S.8 TotalS.1 S.2 S.3 S.4 S.5 S.6 S.7
S.8 TotalS.1 S.2 S.3 S.4 S.5 S.6 S.7S.1 S.2 S.3 S.4 S.5 S.6 S.7 S.8 Total S.8 TotalS.1 S.2 S.3 S.4 S.5 S.6 S.7
68
-26
152
-25
175
344398309
177
171 249 211
Total employment Foreign employment
Australia Austria France
Belgium Denmark Greece
Ireland Italy
Spain Portugal
Luxembourg United Kingdom
Germany Japan Netherlands
United States
Note: Sectors were regrouped based uponthe ISIC Rev. 3 classification system. S1refers to Agriculture, hunting, forestry andfishing (ISIC A and B), S2 – Mining andmanufacturing (ISIC C, D and E), S3 – Con-struction (ISIC F), S4 – Wholesale, retailand hotels (ISIC G and H), S5 – Education,health and other community (ISIC M, N andO), S6 – Private households (ISIC P), S7 –Public Administration and extra-territorialorganisations (ISIC L and Q) et S8 – Otherse r v ices ( IS IC I , J, K ) . Japan wasregrouped into the relevant categoriesusing the ISIC Rev. 2 classification system.For Australia and the United States, thesectors were regrouped based upon theirrespective national classification systems.
1. Data for Australia and the United Statesrefer to the foreign-born population.
2. Data for Austria, Finland, Norway andSweden refer to 1995. Data for Australiarefer to 1996 and 2000 and for Japan to1995 and 1998.
Sources: Labour force surveys, figures pro-vided by Eurostat; labour force survey,Australian Bureau of Statistics; StatisticsBureau, Japan; BLS, United States.
© OECD 2001
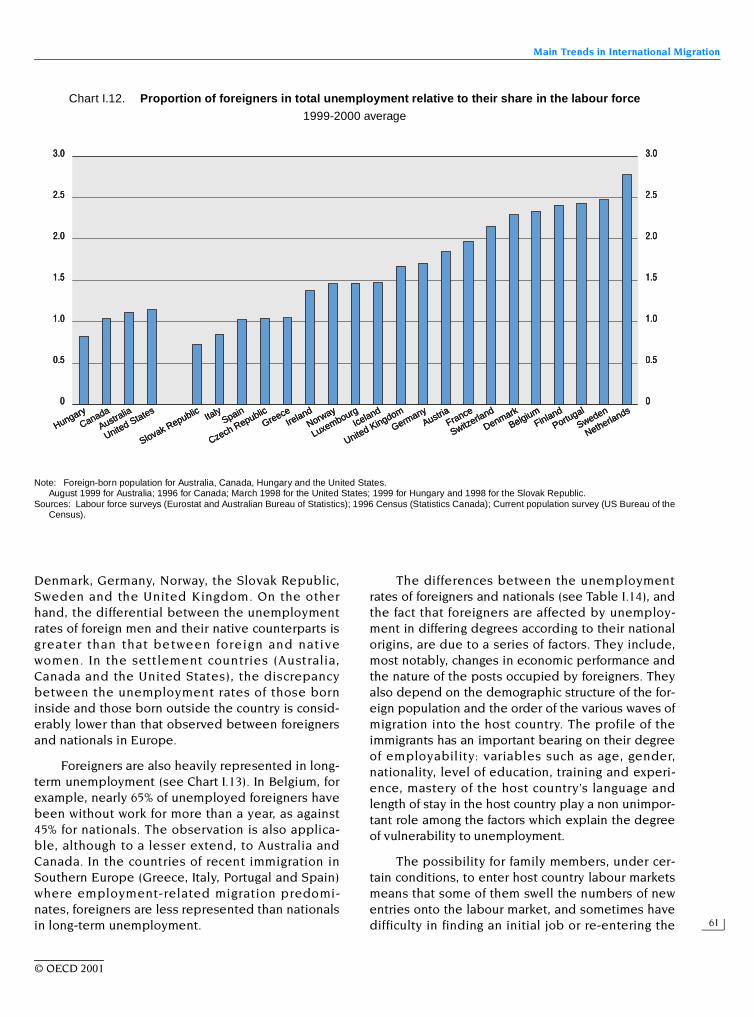
Main Trends in International Migration
61
Denmark, Germany, Norway, the Slovak Republic,Sweden and the United Kingdom. On the otherhand, the differential between the unemploymentrates of foreign men and their native counterparts isgreater than that between foreign and nativewomen. In the settlement countries (Australia,Canada and the United States), the discrepancybetween the unemployment rates of those borninside and those born outside the country is consid-erably lower than that observed between foreignersand nationals in Europe.
Foreigners are also heavily represented in long-term unemployment (see Chart I.13). In Belgium, forexample, nearly 65% of unemployed foreigners havebeen without work for more than a year, as against45% for nationals. The observation is also applica-ble, although to a lesser extend, to Australia andCanada. In the countries of recent immigration inSouthern Europe (Greece, Italy, Portugal and Spain)where employment-related migration predomi-nates, foreigners are less represented than nationalsin long-term unemployment.
The differences between the unemploymentrates of foreigners and nationals (see Table I.14), andthe fact that foreigners are affected by unemploy-ment in differing degrees according to their nationalorigins, are due to a series of factors. They include,most notably, changes in economic performance andthe nature of the posts occupied by foreigners. Theyalso depend on the demographic structure of the for-eign population and the order of the various waves ofmigration into the host country. The profile of theimmigrants has an important bearing on their degreeof employability: variables such as age, gender,nationality, level of education, training and experi-ence, mastery of the host country’s language andlength of stay in the host country play a non unimpor-tant role among the factors which explain the degreeof vulnerability to unemployment.
The possibility for family members, under cer-tain conditions, to enter host country labour marketsmeans that some of them swell the numbers of newentries onto the labour market, and sometimes havedifficulty in finding an initial job or re-entering the
Chart I.12. Proportion of foreigners in total unemployment relative to their share in the labour force1999-2000 average
Note: Foreign-born population for Australia, Canada, Hungary and the United States.August 1999 for Australia; 1996 for Canada; March 1998 for the United States; 1999 for Hungary and 1998 for the Slovak Republic.
Sources: Labour force surveys (Eurostat and Australian Bureau of Statistics); 1996 Census (Statistics Canada); Current population survey (US Bureau of theCensus).
3.0
2.5
2.0
1.5
1.0
0.5
0
3.0
2.5
2.0
1.5
1.0
0.5
0
Canada
Hungary
Australia
Slovak Republic
United StatesItaly
Czech RepublicSpain
GreeceFrance
Austria
Switzerland
Belgium
DenmarkFinland
Sweden
Portugal
NetherlandsNorway
Ireland
Luxembourg
United KingdomIceland
Germany
3.0
2.5
2.0
1.5
1.0
0.5
0
3.0
2.5
2.0
1.5
1.0
0.5
0
Canada
Hungary
Australia
Slovak Republic
United StatesItaly
Czech RepublicSpain
GreeceFrance
Austria
Switzerland
Belgium
DenmarkFinland
Sweden
Portugal
NetherlandsNorway
Ireland
Luxembourg
United KingdomIceland
Germany
3.0
2.5
2.0
1.5
1.0
0.5
0
3.0
2.5
2.0
1.5
1.0
0.5
0
Canada
Hungary
Australia
Slovak Republic
United StatesItaly
Czech RepublicSpain
GreeceFrance
Austria
Switzerland
Belgium
DenmarkFinland
Sweden
Portugal
NetherlandsNorway
Ireland
Luxembourg
United KingdomIceland
Germany
© OECD 2001
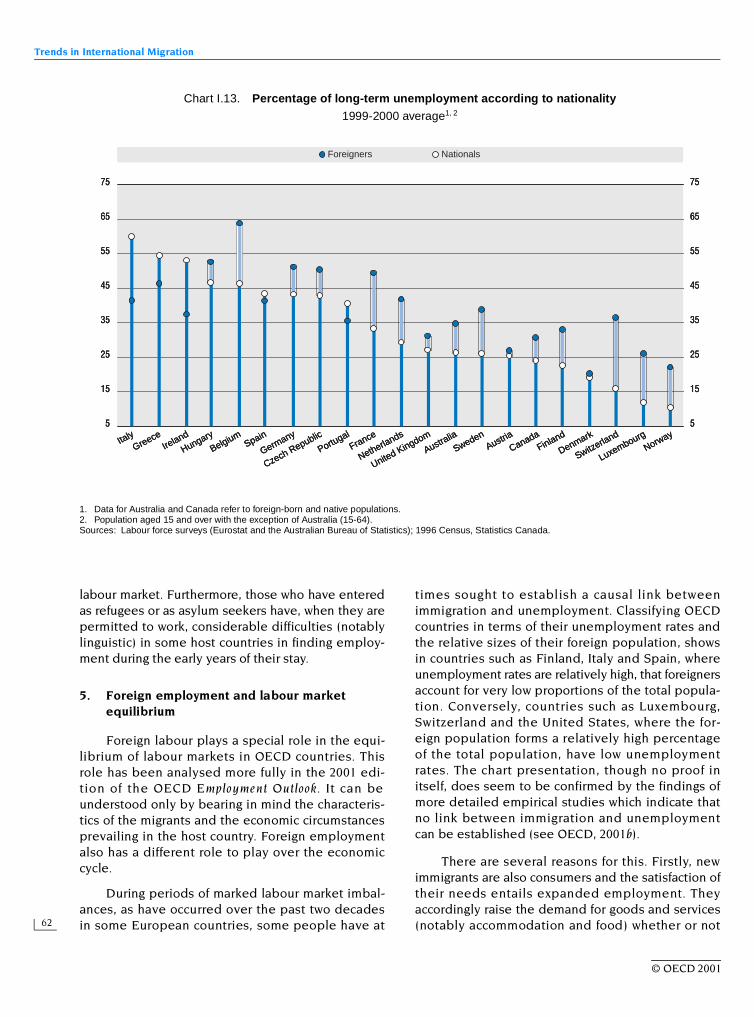
Trends in International Migration
62
labour market. Furthermore, those who have enteredas refugees or as asylum seekers have, when they arepermitted to work, considerable difficulties (notablylinguistic) in some host countries in finding employ-ment during the early years of their stay.
5. Foreign employment and labour market equilibrium
Foreign labour plays a special role in the equi-librium of labour markets in OECD countries. Thisrole has been analysed more fully in the 2001 edi-tion of the OECD Employment Outlook. It can beunderstood only by bearing in mind the characteris-tics of the migrants and the economic circumstancesprevailing in the host country. Foreign employmentalso has a different role to play over the economiccycle.
During periods of marked labour market imbal-ances, as have occurred over the past two decadesin some European countries, some people have at
times sought to establish a causal link betweenimmigration and unemployment. Classifying OECDcountries in terms of their unemployment rates andthe relative sizes of their foreign population, showsin countries such as Finland, Italy and Spain, whereunemployment rates are relatively high, that foreignersaccount for very low proportions of the total popula-tion. Conversely, countries such as Luxembourg,Switzerland and the United States, where the for-eign population forms a relatively high percentageof the total population, have low unemploymentrates. The chart presentation, though no proof initself, does seem to be confirmed by the findings ofmore detailed empirical studies which indicate thatno link between immigration and unemploymentcan be established (see OECD, 2001b).
There are several reasons for this. Firstly, newimmigrants are also consumers and the satisfaction oftheir needs entails expanded employment. Theyaccordingly raise the demand for goods and services(notably accommodation and food) whether or not
Chart I.13. Percentage of long-term unemployment according to nationality1999-2000 average1, 2
1. Data for Australia and Canada refer to foreign-born and native populations.2. Population aged 15 and over with the exception of Australia (15-64).Sources: Labour force surveys (Eurostat and the Australian Bureau of Statistics); 1996 Census, Statistics Canada.
75
65
55
45
35
25
15
5
75
65
55
45
35
25
15
5
Foreigners Nationals
ItalyGreece
Ireland
Hungary
BelgiumSpain
Germany
Czech Republic
PortugalFrance
Netherlands
United Kingdom
Australia
SwedenAustria
CanadaFinland
Denmark
Switzerland
LuxembourgNorway
75
65
55
45
35
25
15
5
75
65
55
45
35
25
15
5
Foreigners Nationals
ItalyGreece
Ireland
Hungary
BelgiumSpain
Germany
Czech Republic
PortugalFrance
Netherlands
United Kingdom
Australia
SwedenAustria
CanadaFinland
Denmark
Switzerland
LuxembourgNorway
75
65
55
45
35
25
15
5
75
65
55
45
35
25
15
5
Foreigners Nationals
ItalyGreece
Ireland
Hungary
BelgiumSpain
Germany
Czech Republic
PortugalFrance
Netherlands
United Kingdom
Australia
SwedenAustria
CanadaFinland
Denmark
Switzerland
LuxembourgNorway
© OECD 2001
Main Trends in International Migration
63
they subsequently raise the labour supply. Secondly,except in very special circumstances such as therepatriations from Algeria to France in 1962 and fromAngola to Portugal in the early 1970s and the arrivalsof Cubans in Miami in 1980, the inflows are extremelysmall compared to the labour force already in thecountry. Finally, most of the research which has madeempirical estimates generally concludes that immi-grant or foreign labour is complementary to, ratherthan a substitute for, that of nationals.
Most of the econometric studies undertaken inthe United States, Australia and Europe have con-cluded that immigration does not lead to a decreasein the incomes of nationals. These conclusions areall the more robust for having been based on a widevar iety of data source s and methodolo gicalapproaches. Studies show that the impact of foreign-ers on the labour market is always positive for allcategories of labour with the exception in the caseof the United States of earlier migrant waves and inEurope of some low-skilled groups. Given that thelabour market characteristics of those groups aresimilar, they are in direct competition. Nevertheless,though the impact can be negative it is very small.Accordingly, immigration cannot be held responsi-ble for labour market disequilibria, although foreignworkers in some OECD Member countries do seemrelatively more vulnerable to cyclical downturns.
In periods of expansion, foreign labour seemsto have a twofold impact on the equilibrium anddynamics of the labour market. It provides aresponse to greater demand for labour, in particularat periods when it is rising very strongly. Further, itassists the reassignment of nationals’ employmentto more dynamic and attractive sectors. The lattereffect ties in with the theory of labour market seg-mentation, under which activities at the bottom ofthe social scale exert little attraction and displaychronic labour shortages, which foreign workers areready to fill. In countries where the geographical andsectoral mobility of the native population is limited,foreign workers may also introduce greater flexibilityto the labour market and hence assist its develop-ment. There are, however difficulties in establishinga migration policy principally designed to respondto short-term labour market requirements.
The contribution of immigration to long-termgrowth is not confined to its quantitative impact onincreases in the labour force; it is also reflected in itsqualitative impact in terms of human capital accu-mulation. In the present context of growth in OECDMember countries, labour shortages are particularly
marked in information and communications technol-ogies. Most OECD Member countries have in factalready amended their legislation in order to facili-tate the admission of skilled and highly skilledworkers (see Appendix at the end of Part I).
C. RECENT TRENDS IN INTERNATIONAL MIGRATION IN ASIA AND CENTRAL AND EASTERN EUROPE
The 2000 edition of Trends in International Migra-tion focused mainly on migration flows in Asia. In thecurrent report, particular attention is accorded tomigration flows of Asian origin to OECD countries.Many OECD Member countries count among theirpopulation a significant number of immigrants fromCentral and Eastern Europe (CEEC) and other coun-tries of the East. The pending membership of cer-tain CEECs to the European Union is arousingconcern over increasing flows from the CEECs andtowards Member countries of the European Union.However, this apprehension seems unjustified asdemonstrated by the majority of studies analysingthe prospective migratory flows as a result of theenlargement of the European Union. Moreover, cer-tain CEECs have become progressively migrationcountries. The present report will examine in detailthese two themes.
1. Recent developments in Asian migration to OECD countries1
a) Asian migration to OECD countries is following a rising trend and an increasing diversification in the categories of entries
Asia has for some time been one of the chiefsources of immigration towards the OECD area(see Map I.4). Recent migration movements from theregion to OECD countries have been characterisedby two clear trends: on the one hand, a strengthen-ing of the traditional steady flows, and on the other,a widening of the range of destination countries,immigrant nationalities and the categories underwhich they enter.
Several OECD countries, in particular the UnitedStates, Canada, Australia, France and the UnitedKingdom, have for many years received flows ofimmigrants or refugees from Asia. In the case of theUnited Kingdom these are principally from the Indiansub-continent and are strongly linked to the country'scolonial past. Similarly, the ex-French colonies supplylarge communities of immigrants from South-EastAsian origin. Since the early 1960s, East and South-
© OECD 2001
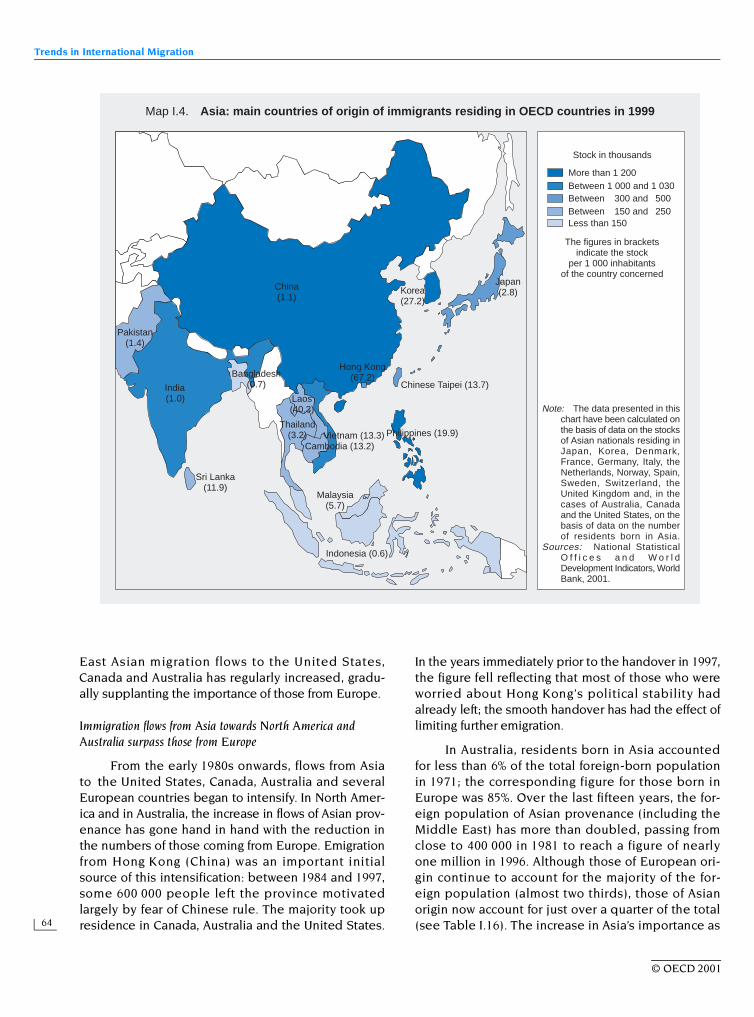
Trends in International Migration
64
East Asian migration flows to the United States,Canada and Australia has regularly increased, gradu-ally supplanting the importance of those from Europe.
Immigration flows from Asia towards North America and Australia surpass those from Europe
From the early 1980s onwards, flows from Asiato the United States, Canada, Australia and severalEuropean countries began to intensify. In North Amer-ica and in Australia, the increase in flows of Asian prov-enance has gone hand in hand with the reduction inthe numbers of those coming from Europe. Emigrationfrom Hong Kong (China) was an important initialsource of this intensification: between 1984 and 1997,some 600 000 people left the province motivatedlargely by fear of Chinese rule. The majority took upresidence in Canada, Australia and the United States.
In the years immediately prior to the handover in 1997,the figure fell reflecting that most of those who wereworried about Hong Kong’s political stability hadalready left; the smooth handover has had the effect oflimiting further emigration.
In Australia, residents born in Asia accountedfor less than 6% of the total foreign-born populationin 1971; the corresponding figure for those born inEurope was 85%. Over the last fifteen years, the for-eign population of Asian provenance (including theMiddle East) has more than doubled, passing fromclose to 400 000 in 1981 to reach a figure of nearlyone million in 1996. Although those of European ori-gin continue to account for the majority of the for-eign population (almost two thirds), those of Asianorigin now account for just over a quarter of the total(see Table I.16). The increase in Asia’s importance as
Map I.4. Asia: main countries of origin of immigrants residing in OECD countries in 1999
Stock in thousands
More than 1 200Between 1 000 and 1 030Between 300 and 500Between 150 and 250Less than 150
The figures in bracketsindicate the stock
per 1 000 inhabitantsof the country concerned
Japan(2.8)
Sri Lanka(11.9)
India(1.0)
Thailand(3.2) Philippines (19.9)Vietnam (13.3)
Cambodia (13.2)
Malaysia(5.7)
Indonesia (0.6)
Laos(40.3)
Chinese Taipei (13.7)
Korea(27.2)
Pakistan(1.4)
Hong Kong(67.2)Bangladesh
(0.7)
China(1.1)
Note: The data presented in thischart have been calculated onthe basis of data on the stocksof Asian nationals residing inJapan, Korea, Denmark,France, Germany, Italy, theNetherlands, Norway, Spain,Sweden, Switzerland, theUnited Kingdom and, in thecases of Australia, Canadaand the United States, on thebasis of data on the numberof residents born in Asia.
Sources: National StatisticalO f f i c e s a n d W o r l dDevelopment Indicators, WorldBank, 2001.
© OECD 2001
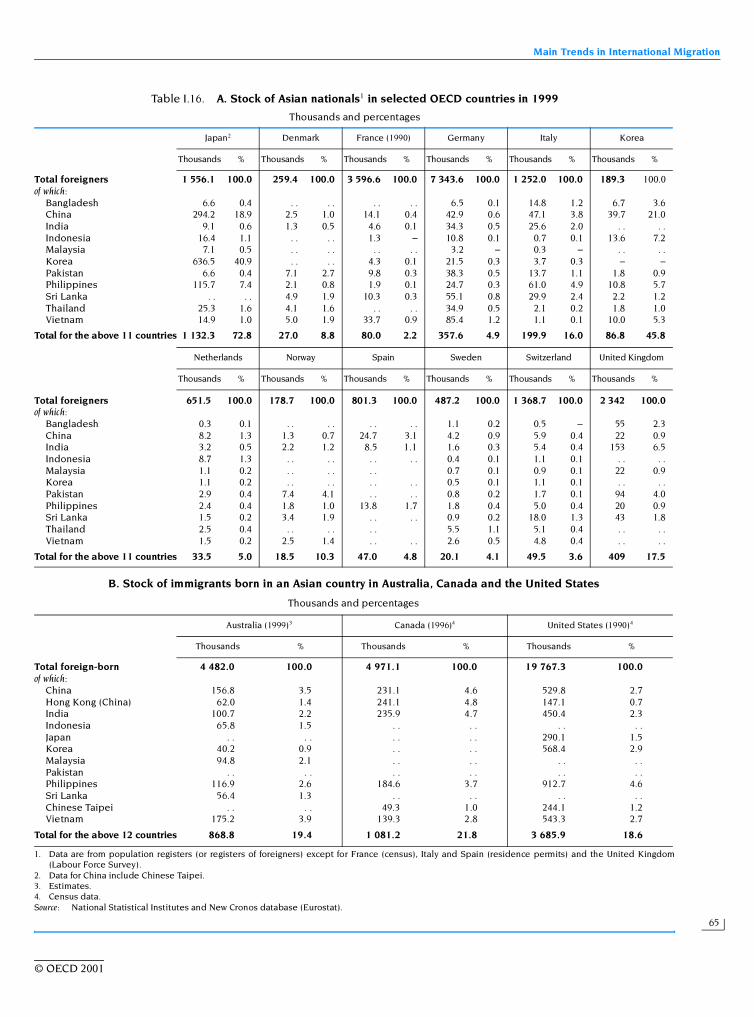
Main Trends in International Migration
65
Table I.16. A. Stock of Asian nationals1 in selected OECD countries in 1999
Thousands and percentages
1. Data are from population registers (or registers of foreigners) except for France (census), Italy and Spain (residence permits) and the United Kingdom(Labour Force Survey).
2. Data for China include Chinese Taipei.3. Estimates.4. Census data.Source: National Statistical Institutes and New Cronos database (Eurostat).
Japan2 Denmark France (1990) Germany Italy Korea
Thousands % Thousands % Thousands % Thousands % Thousands % Thousands %
Total foreigners 1 556.1 100.0 259.4 100.0 3 596.6 100.0 7 343.6 100.0 1 252.0 100.0 189.3 100.0of which:
Bangladesh 6.6 0.4 . . . . . . . . 6.5 0.1 14.8 1.2 6.7 3.6China 294.2 18.9 2.5 1.0 14.1 0.4 42.9 0.6 47.1 3.8 39.7 21.0India 9.1 0.6 1.3 0.5 4.6 0.1 34.3 0.5 25.6 2.0 . . . .Indonesia 16.4 1.1 . . . . 1.3 – 10.8 0.1 0.7 0.1 13.6 7.2Malaysia 7.1 0.5 . . . . . . . . 3.2 – 0.3 – . . . .Korea 636.5 40.9 . . . . 4.3 0.1 21.5 0.3 3.7 0.3 – –Pakistan 6.6 0.4 7.1 2.7 9.8 0.3 38.3 0.5 13.7 1.1 1.8 0.9Philippines 115.7 7.4 2.1 0.8 1.9 0.1 24.7 0.3 61.0 4.9 10.8 5.7Sri Lanka . . . . 4.9 1.9 10.3 0.3 55.1 0.8 29.9 2.4 2.2 1.2Thailand 25.3 1.6 4.1 1.6 . . . . 34.9 0.5 2.1 0.2 1.8 1.0Vietnam 14.9 1.0 5.0 1.9 33.7 0.9 85.4 1.2 1.1 0.1 10.0 5.3
Total for the above 11 countries 1 132.3 72.8 27.0 8.8 80.0 2.2 357.6 4.9 199.9 16.0 86.8 45.8
Netherlands Norway Spain Sweden Switzerland United Kingdom
Thousands % Thousands % Thousands % Thousands % Thousands % Thousands %
Total foreigners 651.5 100.0 178.7 100.0 801.3 100.0 487.2 100.0 1 368.7 100.0 2 342 100.0of which:
Bangladesh 0.3 0.1 . . . . . . . . 1.1 0.2 0.5 – 55 2.3China 8.2 1.3 1.3 0.7 24.7 3.1 4.2 0.9 5.9 0.4 22 0.9India 3.2 0.5 2.2 1.2 8.5 1.1 1.6 0.3 5.4 0.4 153 6.5Indonesia 8.7 1.3 . . . . . . . . 0.4 0.1 1.1 0.1 . . . .Malaysia 1.1 0.2 . . . . . . 0.7 0.1 0.9 0.1 22 0.9Korea 1.1 0.2 . . . . . . . . 0.5 0.1 1.1 0.1 . . . .Pakistan 2.9 0.4 7.4 4.1 . . . . 0.8 0.2 1.7 0.1 94 4.0Philippines 2.4 0.4 1.8 1.0 13.8 1.7 1.8 0.4 5.0 0.4 20 0.9Sri Lanka 1.5 0.2 3.4 1.9 . . . . 0.9 0.2 18.0 1.3 43 1.8Thailand 2.5 0.4 . . . . . . 5.5 1.1 5.1 0.4 . . . .Vietnam 1.5 0.2 2.5 1.4 . . . . 2.6 0.5 4.8 0.4 . . . .
Total for the above 11 countries 33.5 5.0 18.5 10.3 47.0 4.8 20.1 4.1 49.5 3.6 409 17.5
B. Stock of immigrants born in an Asian country in Australia, Canada and the United States
Thousands and percentages
Australia (1999)3 Canada (1996)4 United States (1990)4
Thousands % Thousands % Thousands %
Total foreign-born 4 482.0 100.0 4 971.1 100.0 19 767.3 100.0of which:
China 156.8 3.5 231.1 4.6 529.8 2.7Hong Kong (China) 62.0 1.4 241.1 4.8 147.1 0.7India 100.7 2.2 235.9 4.7 450.4 2.3Indonesia 65.8 1.5 . . . . . . . .Japan . . . . . . . . 290.1 1.5Korea 40.2 0.9 . . . . 568.4 2.9Malaysia 94.8 2.1 . . . . . . . .Pakistan . . . . . . . . . . . .Philippines 116.9 2.6 184.6 3.7 912.7 4.6Sri Lanka 56.4 1.3 . . . . . . . .Chinese Taipei . . . . 49.3 1.0 244.1 1.2Vietnam 175.2 3.9 139.3 2.8 543.3 2.7
Total for the above 12 countries 868.8 19.4 1 081.2 21.8 3 685.9 18.6
© OECD 2001
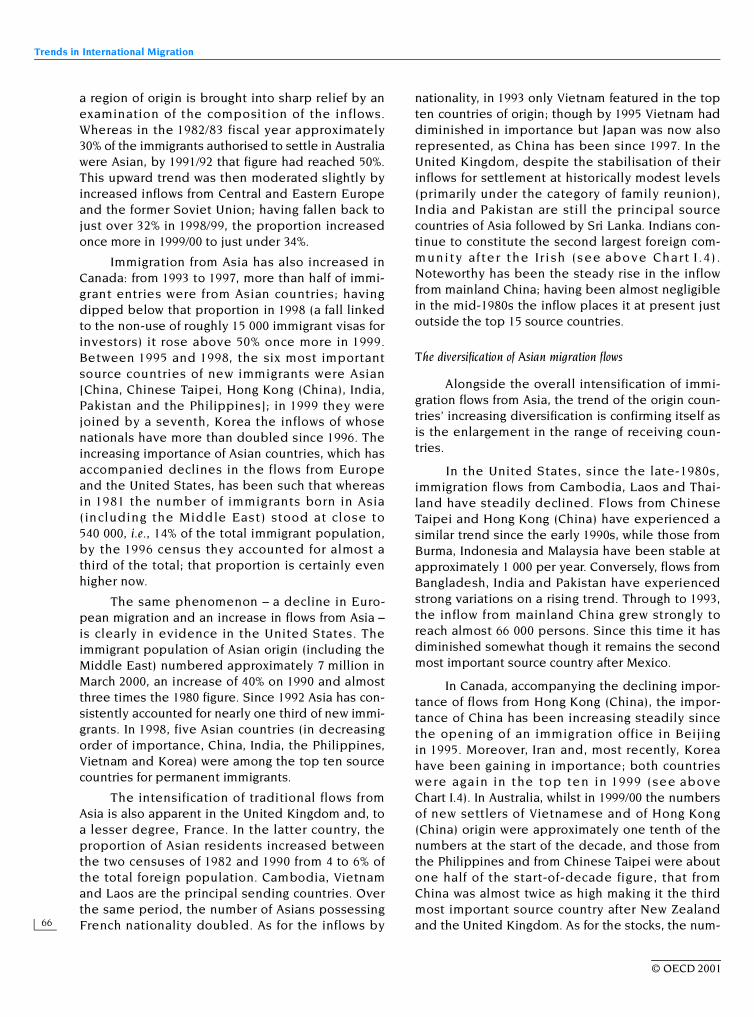
Trends in International Migration
66
a region of origin is brought into sharp relief by anexamination of the composition of the inflows.Whereas in the 1982/83 fiscal year approximately30% of the immigrants authorised to settle in Australiawere Asian, by 1991/92 that figure had reached 50%.This upward trend was then moderated slightly byincreased inflows from Central and Eastern Europeand the former Soviet Union; having fallen back tojust over 32% in 1998/99, the proportion increasedonce more in 1999/00 to just under 34%.
Immigration from Asia has also increased inCanada: from 1993 to 1997, more than half of immi-grant entries were from Asian countries; havingdipped below that proportion in 1998 (a fall linkedto the non-use of roughly 15 000 immigrant visas forinvestors) it rose above 50% once more in 1999.Between 1995 and 1998, the six most importantsource countries of new immigrants were Asian[China, Chinese Taipei, Hong Kong (China), India,Pakistan and the Philippines]; in 1999 they werejoined by a seventh, Korea the inflows of whosenationals have more than doubled since 1996. Theincreasing importance of Asian countries, which hasaccompanied declines in the flows from Europeand the United States, has been such that whereasin 1981 the number of immigrants born in Asia(including the Middle East) stood at close to540 000, i.e., 14% of the total immigrant population,by the 1996 census they accounted for almost athird of the total; that proportion is certainly evenhigher now.
The same phenomenon – a decline in Euro-pean migration and an increase in flows from Asia –is clearly in evidence in the United States. Theimmigrant population of Asian origin (including theMiddle East) numbered approximately 7 million inMarch 2000, an increase of 40% on 1990 and almostthree times the 1980 figure. Since 1992 Asia has con-sistently accounted for nearly one third of new immi-grants. In 1998, five Asian countries (in decreasingorder of importance, China, India, the Philippines,Vietnam and Korea) were among the top ten sourcecountries for permanent immigrants.
The intensification of traditional flows fromAsia is also apparent in the United Kingdom and, toa lesser degree, France. In the latter country, theproportion of Asian residents increased betweenthe two censuses of 1982 and 1990 from 4 to 6% ofthe total foreign population. Cambodia, Vietnamand Laos are the principal sending countries. Overthe same period, the number of Asians possessingFrench nationality doubled. As for the inflows by
nationality, in 1993 only Vietnam featured in the topten countries of origin; though by 1995 Vietnam haddiminished in importance but Japan was now alsorepresented, as China has been since 1997. In theUnited Kingdom, despite the stabilisation of theirinflows for settlement at historically modest levels(primarily under the category of family reunion),India and Pakistan are still the principal sourcecountries of Asia followed by Sri Lanka. Indians con-tinue to constitute the second largest foreign com-munity af ter the Ir i sh (see above Chart I .4) .Noteworthy has been the steady rise in the inflowfrom mainland China; having been almost negligiblein the mid-1980s the inflow places it at present justoutside the top 15 source countries.
The diversification of Asian migration flows
Alongside the overall intensification of immi-gration flows from Asia, the trend of the origin coun-tries’ increasing diversification is confirming itself asis the enlargement in the range of receiving coun-tries.
In the United States, since the late-1980s,immigration flows from Cambodia, Laos and Thai-land have steadily declined. Flows from ChineseTaipei and Hong Kong (China) have experienced asimilar trend since the early 1990s, while those fromBurma, Indonesia and Malaysia have been stable atapproximately 1 000 per year. Conversely, flows fromBangladesh, India and Pakistan have experiencedstrong variations on a rising trend. Through to 1993,the inflow from mainland China grew strongly toreach almost 66 000 persons. Since this time it hasdiminished somewhat though it remains the secondmost important source country after Mexico.
In Canada, accompanying the declining impor-tance of flows from Hong Kong (China), the impor-tance of China has been increasing steadily sincethe opening of an immigration office in Beijingin 1995. Moreover, Iran and, most recently, Koreahave been gaining in importance; both countrieswere again in the top ten in 1999 (see aboveChart I.4). In Australia, whilst in 1999/00 the numbersof new settlers of Vietnamese and of Hong Kong(China) origin were approximately one tenth of thenumbers at the start of the decade, and those fromthe Philippines and from Chinese Taipei were aboutone half of the start-of-decade figure, that fromChina was almost twice as high making it the thirdmost important source country after New Zealandand the United Kingdom. As for the stocks, the num-
© OECD 2001
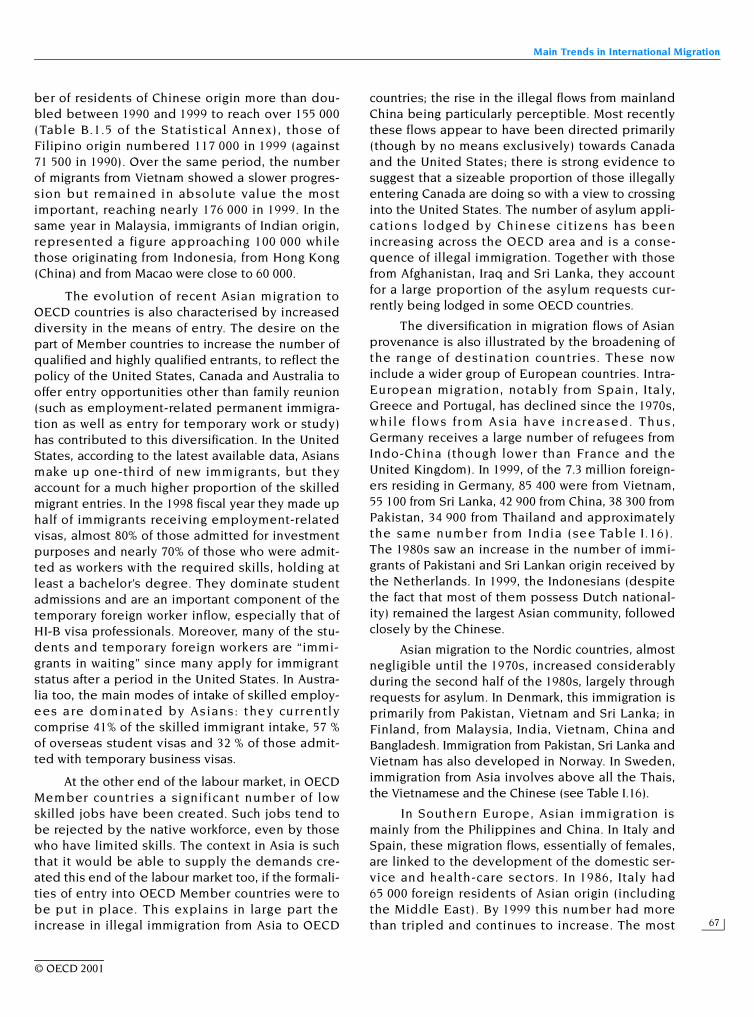
Main Trends in International Migration
67
ber of residents of Chinese origin more than dou-bled between 1990 and 1999 to reach over 155 000(Table B.1.5 of the Statistical Annex), those ofFilipino origin numbered 117 000 in 1999 (against71 500 in 1990). Over the same period, the numberof migrants from Vietnam showed a slower progres-sion but remained in absolute value the mostimportant, reaching nearly 176 000 in 1999. In thesame year in Malaysia, immigrants of Indian origin,represented a figure approaching 100 000 whilethose originating from Indonesia, from Hong Kong(China) and from Macao were close to 60 000.
The evolution of recent Asian migration toOECD countries is also characterised by increaseddiversity in the means of entry. The desire on thepart of Member countries to increase the number ofqualified and highly qualified entrants, to reflect thepolicy of the United States, Canada and Australia tooffer entry opportunities other than family reunion(such as employment-related permanent immigra-tion as well as entry for temporary work or study)has contributed to this diversification. In the UnitedStates, according to the latest available data, Asiansmake up one-third of new immigrants, but theyaccount for a much higher proportion of the skilledmigrant entries. In the 1998 fiscal year they made uphalf of immigrants receiving employment-relatedvisas, almost 80% of those admitted for investmentpurposes and nearly 70% of those who were admit-ted as workers with the required skills, holding atleast a bachelor’s degree. They dominate studentadmissions and are an important component of thetemporary foreign worker inflow, especially that ofHI-B visa professionals. Moreover, many of the stu-dents and temporary foreign workers are “immi-grants in waiting” since many apply for immigrantstatus after a period in the United States. In Austra-lia too, the main modes of intake of skilled employ-ees are dominated by Asians: they currentlycomprise 41% of the skilled immigrant intake, 57 %of overseas student visas and 32 % of those admit-ted with temporary business visas.
At the other end of the labour market, in OECDMember countries a significant number of lowskilled jobs have been created. Such jobs tend tobe rejected by the native workforce, even by thosewho have limited skills. The context in Asia is suchthat it would be able to supply the demands cre-ated this end of the labour market too, if the formali-ties of entry into OECD Member countries were tobe put in place. This explains in large part theincrease in illegal immigration from Asia to OECD
countries; the rise in the illegal flows from mainlandChina being particularly perceptible. Most recentlythese flows appear to have been directed primarily(though by no means exclusively) towards Canadaand the United States; there is strong evidence tosuggest that a sizeable proportion of those illegallyentering Canada are doing so with a view to crossinginto the United States. The number of asylum appli-cations lodged by Chinese citizens has beenincreasing across the OECD area and is a conse-quence of illegal immigration. Together with thosefrom Afghanistan, Iraq and Sri Lanka, they accountfor a large proportion of the asylum requests cur-rently being lodged in some OECD countries.
The diversification in migration flows of Asianprovenance is also illustrated by the broadening ofthe range of destination countries. These nowinclude a wider group of European countries. Intra-European migration, notably from Spain, Italy,Greece and Portugal, has declined since the 1970s,while f lows from Asia have increased. Thus ,Germany receives a large number of refugees fromIndo-China (though lower than France and theUnited Kingdom). In 1999, of the 7.3 million foreign-ers residing in Germany, 85 400 were from Vietnam,55 100 from Sri Lanka, 42 900 from China, 38 300 fromPakistan, 34 900 from Thailand and approximatelythe same number from India (see Table I.16).The 1980s saw an increase in the number of immi-grants of Pakistani and Sri Lankan origin received bythe Netherlands. In 1999, the Indonesians (despitethe fact that most of them possess Dutch national-ity) remained the largest Asian community, followedclosely by the Chinese.
Asian migration to the Nordic countries, almostnegligible until the 1970s, increased considerablyduring the second half of the 1980s, largely throughrequests for asylum. In Denmark, this immigration isprimarily from Pakistan, Vietnam and Sri Lanka; inFinland, from Malaysia, India, Vietnam, China andBangladesh. Immigration from Pakistan, Sri Lanka andVietnam has also developed in Norway. In Sweden,immigration from Asia involves above all the Thais,the Vietnamese and the Chinese (see Table I.16).
In Southern Europe, Asian immigration ismainly from the Philippines and China. In Italy andSpain, these migration flows, essentially of females,are linked to the development of the domestic ser-vice and health-care sectors. In 1986, Italy had65 000 foreign residents of Asian origin (includingthe Middle East). By 1999 this number had morethan tripled and continues to increase. The most
© OECD 2001
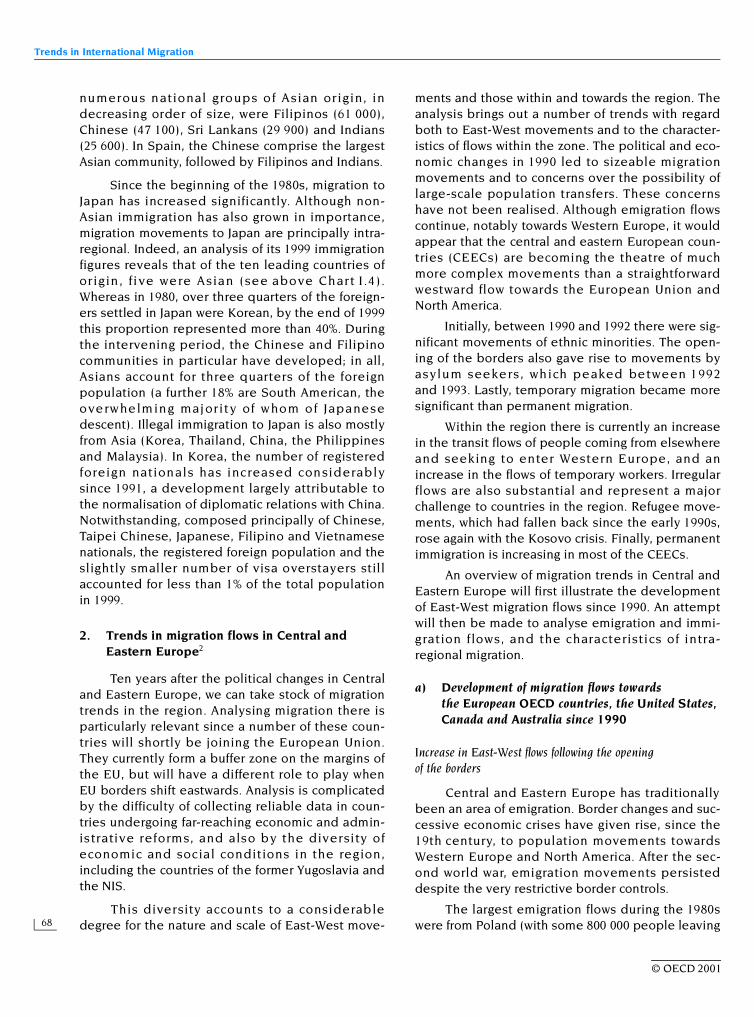
Trends in International Migration
68
numerous national groups of Asian or igin, indecreasing order of size, were Filipinos (61 000),Chinese (47 100), Sri Lankans (29 900) and Indians(25 600). In Spain, the Chinese comprise the largestAsian community, followed by Filipinos and Indians.
Since the beginning of the 1980s, migration toJapan has increased significantly. Although non-Asian immigration has also grown in importance,migration movements to Japan are principally intra-regional. Indeed, an analysis of its 1999 immigrationfigures reveals that of the ten leading countries ofor igin, f ive were Asian (see above Chart I .4 ).Whereas in 1980, over three quarters of the foreign-ers settled in Japan were Korean, by the end of 1999this proportion represented more than 40%. Duringthe intervening period, the Chinese and Filipinocommunities in particular have developed; in all,Asians account for three quarters of the foreignpopulation (a further 18% are South American, theoverwhelming major ity of whom of Japanesedescent). Illegal immigration to Japan is also mostlyfrom Asia (Korea, Thailand, China, the Philippinesand Malaysia). In Korea, the number of registeredforeign nationals has increased considerablysince 1991, a development largely attributable tothe normalisation of diplomatic relations with China.Notwithstanding, composed principally of Chinese,Taipei Chinese, Japanese, Filipino and Vietnamesenationals, the registered foreign population and theslightly smaller number of visa overstayers stillaccounted for less than 1% of the total populationin 1999.
2. Trends in migration flows in Central and Eastern Europe2
Ten years after the political changes in Centraland Eastern Europe, we can take stock of migrationtrends in the region. Analysing migration there isparticularly relevant since a number of these coun-tries will shortly be joining the European Union.They currently form a buffer zone on the margins ofthe EU, but will have a different role to play whenEU borders shift eastwards. Analysis is complicatedby the difficulty of collecting reliable data in coun-tries undergoing far-reaching economic and admin-istrative reforms, and also by the diversity ofeconomic and social conditions in the region,including the countries of the former Yugoslavia andthe NIS.
This diversity accounts to a considerabledegree for the nature and scale of East-West move-
ments and those within and towards the region. Theanalysis brings out a number of trends with regardboth to East-West movements and to the character-istics of flows within the zone. The political and eco-nomic changes in 1990 led to sizeable migrationmovements and to concerns over the possibility oflarge-scale population transfers. These concernshave not been realised. Although emigration flowscontinue, notably towards Western Europe, it wouldappear that the central and eastern European coun-tries (CEECs) are becoming the theatre of muchmore complex movements than a straightforwardwestward flow towards the European Union andNorth America.
Initially, between 1990 and 1992 there were sig-nificant movements of ethnic minorities. The open-ing of the borders also gave rise to movements byasylum seekers, which peaked between 1992and 1993. Lastly, temporary migration became moresignificant than permanent migration.
Within the region there is currently an increasein the transit flows of people coming from elsewhereand seeking to enter Western Europe, and anincrease in the flows of temporary workers. Irregularflows are also substantial and represent a majorchallenge to countries in the region. Refugee move-ments, which had fallen back since the early 1990s,rose again with the Kosovo crisis. Finally, permanentimmigration is increasing in most of the CEECs.
An overview of migration trends in Central andEastern Europe will first illustrate the developmentof East-West migration flows since 1990. An attemptwill then be made to analyse emigration and immi-gration flows, and the characteristics of intra-regional migration.
a) Development of migration flows towards the European OECD countries, the United States, Canada and Australia since 1990
Increase in East-West flows following the opening of the borders
Central and Eastern Europe has traditionallybeen an area of emigration. Border changes and suc-cessive economic crises have given rise, since the19th century, to population movements towardsWestern Europe and North America. After the sec-ond world war, emigration movements persisteddespite the very restrictive border controls.
The largest emigration flows during the 1980swere from Poland (with some 800 000 people leaving
© OECD 2001
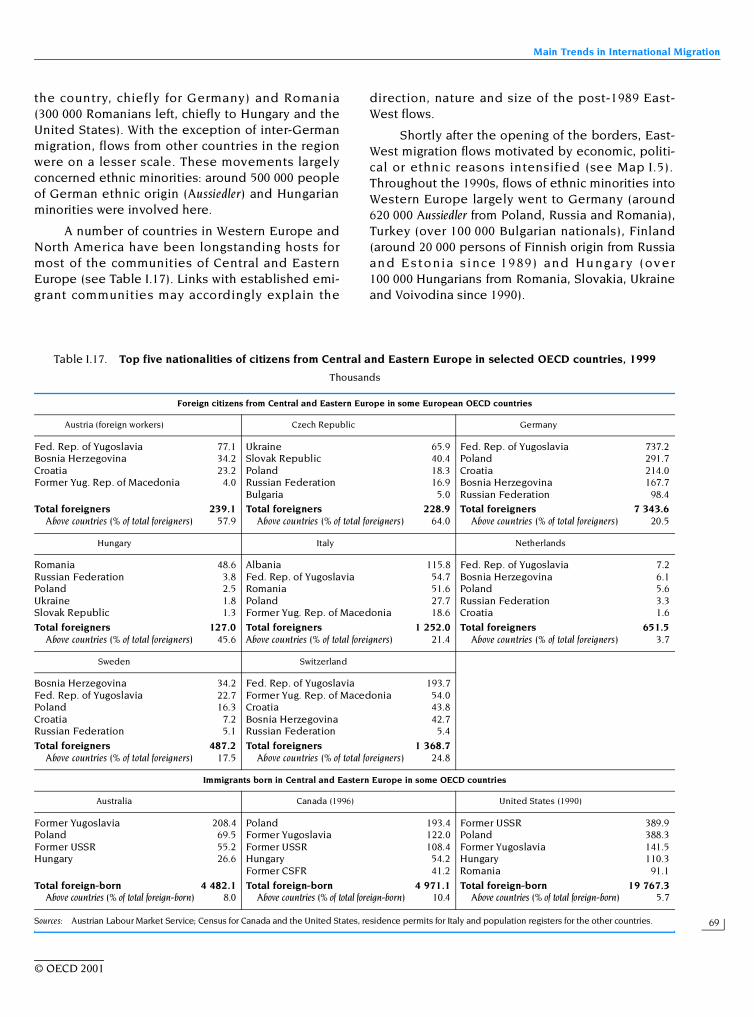
Main Trends in International Migration
69
the country, chiefly for Germany) and Romania(300 000 Romanians left, chiefly to Hungary and theUnited States). With the exception of inter-Germanmigration, flows from other countries in the regionwere on a lesser scale. These movements largelyconcerned ethnic minorities: around 500 000 peopleof German ethnic origin (Aussiedler) and Hungarianminorities were involved here.
A number of countries in Western Europe andNorth America have been longstanding hosts formost of the communities of Central and EasternEurope (see Table I.17). Links with established emi-grant communities may accordingly explain the
direction, nature and size of the post-1989 East-West flows.
Shortly after the opening of the borders, East-West migration flows motivated by economic, politi-cal or ethnic reasons intensified (see Map I.5).Throughout the 1990s, flows of ethnic minorities intoWestern Europe largely went to Germany (around620 000 Aussiedler from Poland, Russia and Romania),Turkey (over 100 000 Bulgarian nationals), Finland(around 20 000 persons of Finnish origin from Russiaan d Esto nia s ince 19 89) and Hu nga ry (ov er100 000 Hungarians from Romania, Slovakia, Ukraineand Voivodina since 1990).
Table I.17. Top five nationalities of citizens from Central and Eastern Europe in selected OECD countries, 1999
Thousands
Sources: Austrian Labour Market Service; Census for Canada and the United States, residence permits for Italy and population registers for the other countries.
Foreign citizens from Central and Eastern Europe in some European OECD countries
Austria (foreign workers) Czech Republic Germany
Fed. Rep. of Yugoslavia 77.1 Ukraine 65.9 Fed. Rep. of Yugoslavia 737.2Bosnia Herzegovina 34.2 Slovak Republic 40.4 Poland 291.7Croatia 23.2 Poland 18.3 Croatia 214.0Former Yug. Rep. of Macedonia 4.0 Russian Federation 16.9 Bosnia Herzegovina 167.7
Bulgaria 5.0 Russian Federation 98.4Total foreigners 239.1 Total foreigners 228.9 Total foreigners 7 343.6
Above countries (% of total foreigners) 57.9 Above countries (% of total foreigners) 64.0 Above countries (% of total foreigners) 20.5
Hungary Italy Netherlands
Romania 48.6 Albania 115.8 Fed. Rep. of Yugoslavia 7.2Russian Federation 3.8 Fed. Rep. of Yugoslavia 54.7 Bosnia Herzegovina 6.1Poland 2.5 Romania 51.6 Poland 5.6Ukraine 1.8 Poland 27.7 Russian Federation 3.3Slovak Republic 1.3 Former Yug. Rep. of Macedonia 18.6 Croatia 1.6
Total foreigners 127.0 Total foreigners 1 252.0 Total foreigners 651.5Above countries (% of total foreigners) 45.6 Above countries (% of total foreigners) 21.4 Above countries (% of total foreigners) 3.7
Sweden Switzerland
Bosnia Herzegovina 34.2 Fed. Rep. of Yugoslavia 193.7Fed. Rep. of Yugoslavia 22.7 Former Yug. Rep. of Macedonia 54.0Poland 16.3 Croatia 43.8Croatia 7.2 Bosnia Herzegovina 42.7Russian Federation 5.1 Russian Federation 5.4
Total foreigners 487.2 Total foreigners 1 368.7Above countries (% of total foreigners) 17.5 Above countries (% of total foreigners) 24.8
Immigrants born in Central and Eastern Europe in some OECD countries
Australia Canada (1996) United States (1990)
Former Yugoslavia 208.4 Poland 193.4 Former USSR 389.9Poland 69.5 Former Yugoslavia 122.0 Poland 388.3Former USSR 55.2 Former USSR 108.4 Former Yugoslavia 141.5Hungary 26.6 Hungary 54.2 Hungary 110.3
Former CSFR 41.2 Romania 91.1
Total foreign-born 4 482.1 Total foreign-born 4 971.1 Total foreign-born 19 767.3Above countries (% of total foreign-born) 8.0 Above countries (% of total foreign-born) 10.4 Above countries (% of total foreign-born) 5.7
© OECD 2001
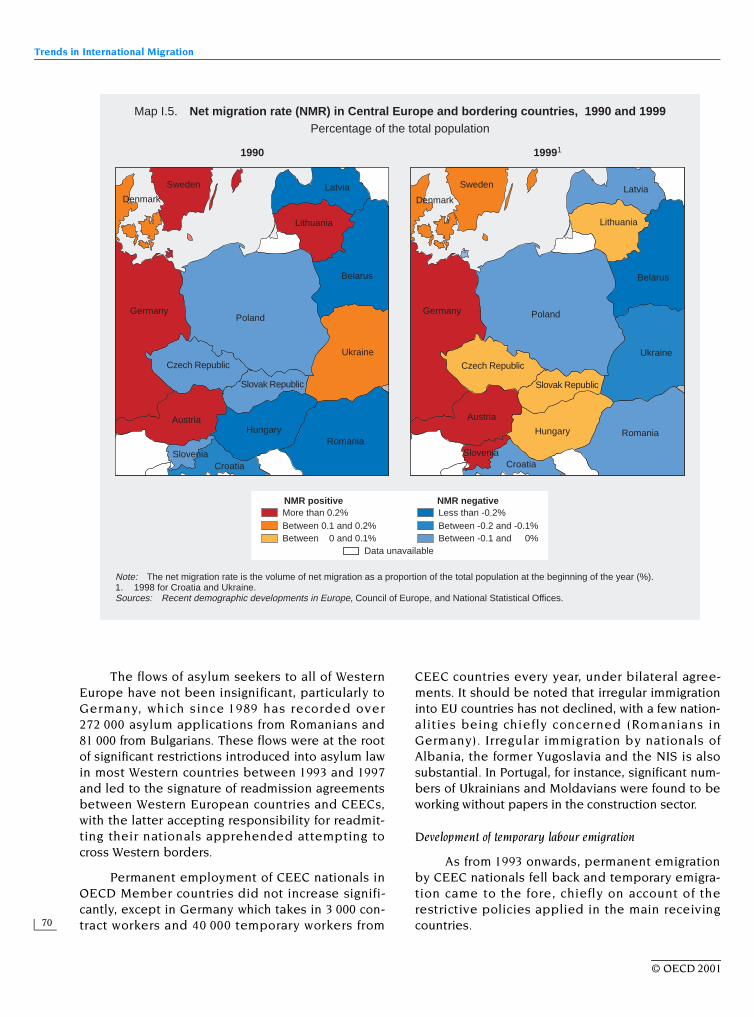
Trends in International Migration
70
The flows of asylum seekers to all of WesternEurope have not been insignificant, particularly toGermany, which since 1989 has recorded over272 000 asylum applications from Romanians and81 000 from Bulgarians. These flows were at the rootof significant restrictions introduced into asylum lawin most Western countries between 1993 and 1997and led to the signature of readmission agreementsbetween Western European countries and CEECs,with the latter accepting responsibility for readmit-ting their nationals apprehended attempting tocross Western borders.
Permanent employment of CEEC nationals inOECD Member countries did not increase signifi-cantly, except in Germany which takes in 3 000 con-tract workers and 40 000 temporary workers from
CEEC countries every year, under bilateral agree-ments. It should be noted that irregular immigrationinto EU countries has not declined, with a few nation-alities being chiefly concerned (Romanians inGermany). Irregular immigration by nationals ofAlbania, the former Yugoslavia and the NIS is alsosubstantial. In Portugal, for instance, significant num-bers of Ukrainians and Moldavians were found to beworking without papers in the construction sector.
Development of temporary labour emigration
As from 1993 onwards, permanent emigrationby CEEC nationals fell back and temporary emigra-tion came to the fore, chiefly on account of therestrictive policies applied in the main receivingcountries.
Austria
Sweden
Germany
HungaryRomania
Denmark
Poland
Belarus
Ukraine
Lithuania
Latvia
CroatiaSlovenia
Austria
Sweden
Germany
Hungary Romania
Denmark
Poland
Belarus
UkraineCzech Republic
Lithuania
Latvia
CroatiaSlovenia
Map I.5. Net migration rate (NMR) in Central Europe and bordering countries, 1990 and 1999Percentage of the total population
1990 19991
Between -0.2 and -0.1%Between -0.1 and -0.0%
More than 0.2% Less than -0.2%
Data unavailable
NMR positive NMR negative
Between 0.1 and 0.2%Between 0.0 and 0.1%
Note: The net migration rate is the volume of net migration as a proportion of the total population at the beginning of the year (%).1. 1998 for Croatia and Ukraine.Sources: Recent demographic developments in Europe, Council of Europe, and National Statistical Offices.
Slovak Republic
Czech Republic
Slovak Republic
Austria
Sweden
Germany
HungaryRomania
Denmark
Poland
Belarus
Ukraine
Lithuania
Latvia
CroatiaSlovenia
Austria
Sweden
Germany
Hungary Romania
Denmark
Poland
Belarus
UkraineCzech Republic
Lithuania
Latvia
CroatiaSlovenia
Map I.5. Net migration rate (NMR) in Central Europe and bordering countries, 1990 and 1999Percentage of the total population
1990 19991
Between -0.2 and -0.1%Between -0.1 and -0.0%
More than 0.2% Less than -0.2%
Data unavailable
NMR positive NMR negative
Between 0.1 and 0.2%Between 0.0 and 0.1%
Note: The net migration rate is the volume of net migration as a proportion of the total population at the beginning of the year (%).1. 1998 for Croatia and Ukraine.Sources: Recent demographic developments in Europe, Council of Europe, and National Statistical Offices.
Slovak Republic
Czech Republic
Slovak Republic
© OECD 2001
Main Trends in International Migration
71
Total entries of permanent immigrants fromCEECs, as a percentage of total immigration flows,have fallen since 1991 in Denmark, France, theUnited Kingdom, the Netherlands and Sweden. Thefall in emigration to OECD countries is very markedfor Poles, Romanians and Bulgarians. The nature ofemigration seems to be changing. Its chief feature isnow short and frequent movements, with more fre-quent returns.
The number of refugees and asylum seekers orig-inating from the CEECs has also declined, since theOECD Member countries now consider most of theCEECs to be “safe” countries, the citizens of which arenot eligible, in principle, to lodge asylum requests.However, the number of migrants granted temporaryresident status on humanitarian grounds increasedacross all Western countries on account of the conflictin the former Yugoslavia. In 1999 numerous refugeesfrom the former Yugoslavia went to Germany,Switzerland, Austria, Norway and Canada. Manymigrants from Kosovo returned home at the end of theconflict, to a greater degree than refugees from BosniaHerzegovina after the Dayton Agreements of 1995,since the conflict was not so prolonged.
Whereas permanent emigration to OECD coun-tries is declining, the temporary migration of work-ers is developing. Labour movements predominate,facilitated by the suspension of the requirement fora short-stay visa for nationals of some CEECs goingto EU countries. In 1999 Poles were still the mostnumerous group working in Germany (nearly200 000 seasonal workers). Many temporary jobsheld by CEEC nationals are within the framework ofintergovernmental agreements for seasonal workand subcontracted employment. In Italy, among sea-sonal workers, Czechs, Slovaks and Poles predomi-nate; in Greece, Albanians and Bulgarians; inFinland, Russians and Estonians. As a rule, move-ments of temporary workers are fostered by regionalproximity and regulated by bilateral agreements(principally between Germany and Poland, andbetween Austria on the one hand and Hungary andthe Slovak and Czech Republics on the other).
Increasing presence of CEE nationals in OECD countries
Today, the majority of countries in WesternEurope and North America, together with Australia,have in their population a significant number ofimmigrants from the CEECs and the countries totheir South and East. Nationals of the formerYugoslavia, followed by Poles, are the most numer-
ous groups in Australia. In the United States, Polesare slightly outnumbered by nationals of the formerSoviet Union, while in Canada the latter are only halfas numerous as Poles (see Table I.17).
Among the European member countries of theOECD, Germany is the principal host country fornationals of the CEECs, the former Yugoslavia andthe former Soviet Union. With a total of 1.8 million,they represented 25% of the resident foreign popu-lation in 1999. They are also very numerous inAustria (around 370 000, or nearly 70% of the resi-dent foreign population), and to a lesser degree inItaly (over 295 000, or nearly 24% of the total). A. verylarge number of nationals of the former Yugoslaviaare resident in Western Europe (nearly 1.2 million inGermany, over 300 000 in Switzerland), as are thePoles (nearly 300 000 in Germany, over 50 000 inFrance).
Some CEECs are making estimates of the num-bers of their nationals resident abroad, and aredeveloping programmes to encourage the return ofthese groups, who may represent significant invest-ment potential. Around 100 000 people of Hungariannationality have been enumerated in the UnitedStates, 50 000 in Canada, and 30 000 in Australia.
The forthcoming accession of some CEECs to the European Union is raising concern over the future of westward migration flows
Five CEECs are currently candidates for thenext stage of European Union enlargement in 2005:the Czech Republic, Estonia, Hungary, Poland andSlovenia. The other countries in the region will beincluded in subsequent waves of enlargement. Twopoints deserve attention in this respect.
First, as when Greece joined the EuropeanCommunity in 1981, and then Spain and Portugalin 1986, enlargement will have a marked effect onthe stability and the economic growth of the candi-date countries, which are already the most dynamicones in the region. They are accordingly becomingvery attractive to migration from adjoining countriesto the South and East (see below) and need to aligntheir policies to regulate flows with those in force inthe European Union, and more particularly theSchengen area.
Second, recent discussions on enlargementamong current EU members show that a number ofthem are apprehensive about inflows of CEEC work-ers after enlargement, under the principle of freemovement. Accordingly, the accession treaties for thecountries in the first wave are likely to include a
© OECD 2001
Trends in International Migration
72
transitional clause meaning that workers from CEECcountries cannot freely enter the labour marketthroughout the Union. Some estimates, however,indicate that the countries joining the EuropeanUnion may well experience return movements bytheir nationals resident in the West. Net East-Westflows could accordingly be smaller, or indeed reverse,a f te r th e CEEC s jo in th e Eu r o pe an U ni o n(see Box I.8).
b) Main characteristics of inflows and outflows in the CEECs
Since 1990, migration trends in the region differconsiderably. Some countries have chiefly experi-
enced outflows since 1989 (Poland, Romania,Bulgaria, the former Yugoslavia, the former SovietUnion, Albania). Elsewhere (the Czech Republic,Hungary, Lithuania), emigration has fallen back con-siderably and the predominant trend is for perma-nent immigration. But some trends do seem to applyacross the area, particularly “transit” migration.
Emigration flows no longer concern the whole area
Permanent outflows are trending downwards.The main areas of departure are the former SovietUnion, Romania, Poland, the former Yugoslavia,Albania and Bulgaria. While flows from Poland havestabilised over the last few years at around 20 000 a
Box I.8. EU enlargement and research on its impact on flows of CEE workers
In 1993 the Copenhagen European Council agreed on the principles of enlarging the European Union, in par-ticular to a number of central and eastern European countries (CEECs). In 1998 negotiations were launched withthe five most economically advanced countries (Poland, the Czech Republic, Hungary, Estonia and Slovenia – theLuxembourg Group) and in February 2000 with a further five (Bulgaria, Lithuania, Latvia, Romania, the SlovakRepublic – the Helsinki Group). An initial wave of accessions may accordingly take place in 2005, and a second asfrom 2007.
Enlargement raises some apprehension in EU Member countries such as Germany and Austria, which fearlarge-scale inflows of workers from the CEECs under the principle of free movement. In June 2001 the EuropeanCommission signed agreements with three candidate countries (Hungary, the Slovak Republic, Latvia) which pre-cluded free access to the labour market of EU countries for a maximum period of seven years after accession. Thenegotiation of similar treaties is under way with the other countries, but they are reluctant to see their nationalsbeing treated as “second-class citizens”. Recent research to assess the impact of EU enlargement on workermigration all concludes, however, that East-West flows will not have a major impact on the labour markets of thecurrent fifteen EU countries, and that over the long term they could dwindle or possibly reverse.
The report for the European Commission, published by the European Integration Consortium,1 employs vari-ables such as income differentials and unemployment rates in host and departure countries, etc. The research isbased on a number of assumptions, including per capita GDP convergence of 2% a year between East and West,and no change in unemployment rates in the EU and the CEECs. The findings suggest that the groups of CEECnationals will increase substantially in most of the countries concerned, but the increase will be spread over anumber of years. Were accession to take place today, around 335 000 additional people would settle in the fif-teen-country EU, with the numbers falling in subsequent years. According to these estimates, in 30 years’ timethe population of CEEC origin would represent no more than 3.5% of the population of the European Union.Another research paper estimates the flows at between 267 000 and 336 000 a year.2 Assuming accession byHungary, Poland and the Czech Republic in 2005, the Austrian research institute WIFO3 forecasts that the numberof migrants from those three countries would be 144 000 in that year and then fall off.
The immigration of workers from the CEECs would have different effects on individual EU countries and fordifferent categories of labour. According to the European Integration Consortium, immigration is expected to gochiefly to Germany (65%) and Austria (12%). In addition, the inflows would not raise competition for most workersapart from the unskilled, who could be affected both by lower remuneration and by higher unemployment.
1. Boeri, T., Brücker, H. and others: The Impact of Eastern European Enlargement on Employment and Labour Markets in the EU MemberStates, DIW, CEPR, FIEF, IGIER, HIS, Berlin and Milan, 2001.
2. Hille, H. and Straubhaar, T.: The impact of EU enlargement on migration movements and economic integration: results of recent studies, inMigration Policies and EU Enlargement, Paris: OECD, 2001.
3. Breuss, F.: Macroeconomic Effects of EU Enlargement for Old and New Members, WIFO Working Papers, No. 143, April 2001.
© OECD 2001
Main Trends in International Migration
73
year, the total number of “permanent” emigrantsfrom Romania has fallen steadily over recent years(with the exception of irregular movements). The fig-ure in 1999 was 12 500, barely 15% of the 1990 level.This downward trend in emigration is also found inEstonia and Latvia, where the migration balance,still negative, is some 4% of the 1992 level. In 1999Lithuania had a positive migration balance.
In other countries in the region, not coveredin detail in this report, notably Albania and thecountries of the former Yugoslavia and the formerSoviet Union, emigration is still substantial. In 199937 000 arrivals of Albanian nationals were reportedin Italy (over three times more than in 1998), andaround 2 000 Russians in Finland. In the same year,the largest groups of immigrants to Germany werenationals of the former Yugoslavia (nearly 88 000)and Poland (around 72 000). Fresh destinations foremployment-related migration are appearing,including Italy, Portugal and Ireland. The latter saw aninefold increase in entries of CEEC workersbetween 1998 and 2000, although the numbersinvolved are still relatively small (2 400).
Trend towards longer-term immigration in the CEECs
A trend towards longer-term immigration canbe observed in most countries in the region, but fewof them as yet have a positive migration balance.Immigration to the CEECs comes largely fromadjoining countries; at the same time, inflows fromWestern Europe and more distant areas are alsodeveloping.
A number of factors have assisted entries andresidence by new migrants in the central andeastern European countries. As part of the reformsduring the 1990s, they amended their nationalitylegislation, in particular allowing expatriates whohad been stripped of nationality to recover it. A fur-ther stage was the introduction of short and long-term residence permits for foreigners, signature ofthe Geneva Convention on Refugees, and abolitionof the requirement for short-stay entry visas fornationals of most OECD countries.
The scale of the immigration which is develop-ing in most CEECs varies from one country toanother. In Hungary, over 15 000 foreigners had set-tled on a lasting basis in 1999. In the Czech Republicand Poland permanent entries include returningnationals and in 1999 stood at 9 900 and 7 500respectively. In Hungary and the Czech Republic thestocks of permanent and long-term residents stood
at 127 000 and 229 000 respectively in the last yearfor which data are available (see Table I.18). InBulgaria a little over 63 600 people held long-termresidence permits in 1999, and some 39 000 heldpermanent residence permits. The proportion of for-eign residents in the CEECs is, however, generallyless than 2% of the total population (0.1% for Poland,2% for the Czech Republic).
In 1999, inflows into Central and Eastern Europewere largely from adjoining countries. In Hungary, forexample, 6 000 Romanians, followed by 1 700 nation-als of the former Yugoslavia, outstripped the 1 000 orso Chinese settled there permanently. Vietnameseand Chinese are found in a number of countries(24 900 Vietnamese residents, and 4 300 Chinese, inthe Czech Republic), with the Vietnamese datingfrom before 1990 and the latter arriving morerecently. Nationals of Western Europe (chieflyGermany, France, the United Kingdom and Italy) andthe United States are also present, usually holdingskilled or highly skilled jobs. The Czech Republic, forinstance, in 1999 had 6 100 Germans and 3 800 Ameri-cans; in Romania, Italians (4 600) and Germans (2 700)were most strongly represented. The proportion ofEU nationals is over 11% in Hungary, and close to 15%in Poland and 18% in Bulgaria. In the first two coun-tries, CEEC nationals take a predominant share ofpermanent immigration.
Persistence of transit migration to Western Europe
For many migrants seeking to enter WesternEurope or North America, the CEECs constitute astage on their journey. Most of these migrants aredocumented, having entered as tourists or as busi-nessmen or students. Due to their common borderwith Germany, the countries most affected by thisare Poland and the Czech Republic. Hungary is alsoa transit country, on account of its borders withAustria. Bulgaria is a transit country for migrantsseeking to enter Greece, as well as those seeking toreach other parts of Western Europe.
Transit migration encourages the development ofillegal immigration and undocumented employment ina number of the CEECs. The migrants come fromneighbouring countries such as Turkey, Albania or theformer Yugoslavia, but also from Asia (Bangladesh,India, Afghanistan, Iran, Iraq). In 1999 Hungaryreported some 11 000 attempts to leave the countryillegally, chiefly in the direction of Austria and theSlovak Republic, and 4 000 attempts to enter ille-gally, demonstrating the difficulty of entering
© OECD 2001
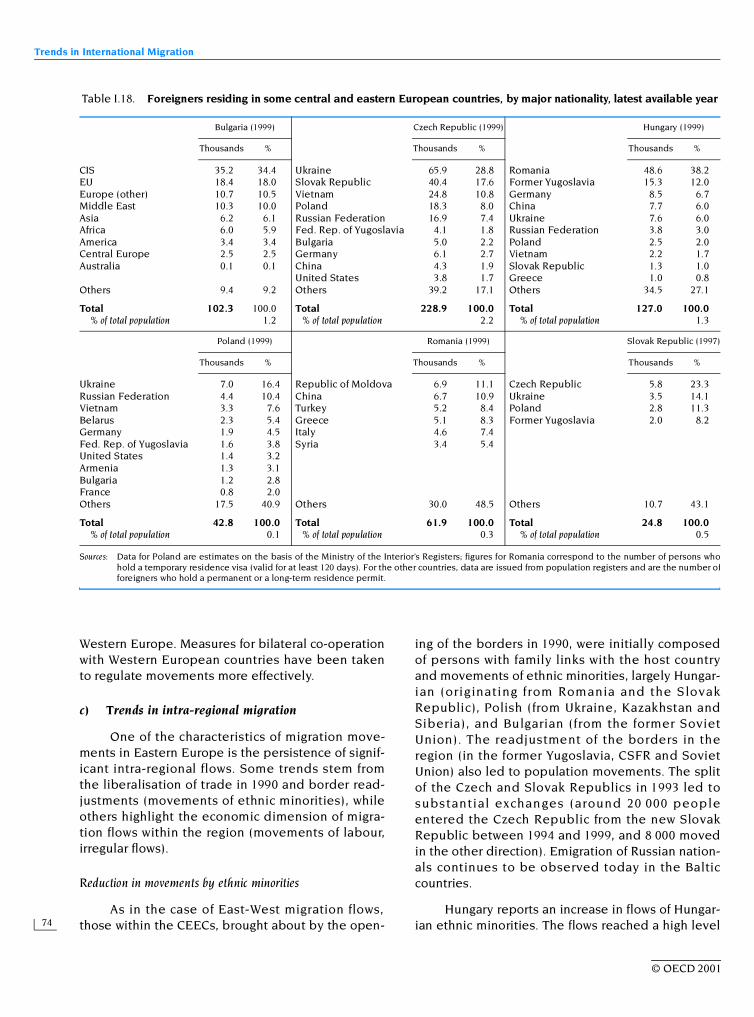
Trends in International Migration
74
Western Europe. Measures for bilateral co-operationwith Western European countries have been takento regulate movements more effectively.
c) Trends in intra-regional migration
One of the characteristics of migration move-ments in Eastern Europe is the persistence of signif-icant intra-regional flows. Some trends stem fromthe liberalisation of trade in 1990 and border read-justments (movements of ethnic minorities), whileothers highlight the economic dimension of migra-tion flows within the region (movements of labour,irregular flows).
Reduction in movements by ethnic minorities
As in the case of East-West migration flows,those within the CEECs, brought about by the open-
ing of the borders in 1990, were initially composedof persons with family links with the host countryand movements of ethnic minorities, largely Hungar-ian (originating from Romania and the SlovakRepublic), Polish (from Ukraine, Kazakhstan andSiberia), and Bulgarian (from the former SovietUnion). The readjustment of the borders in theregion (in the former Yugoslavia, CSFR and SovietUnion) also led to population movements. The splitof the Czech and Slovak Republics in 1993 led tosubstantial exchanges (around 20 000 peopleentered the Czech Republic from the new SlovakRepublic between 1994 and 1999, and 8 000 movedin the other direction). Emigration of Russian nation-als continues to be observed today in the Balticcountries.
Hungary reports an increase in flows of Hungar-ian ethnic minorities. The flows reached a high level
Table I.18. Foreigners residing in some central and eastern European countries, by major nationality, latest available year
Sources: Data for Poland are estimates on the basis of the Ministry of the Interior’s Registers; figures for Romania correspond to the number of persons whohold a temporary residence visa (valid for at least 120 days). For the other countries, data are issued from population registers and are the number offoreigners who hold a permanent or a long-term residence permit.
Bulgaria (1999) Czech Republic (1999) Hungary (1999)
Thousands % Thousands % Thousands %
CIS 35.2 34.4 Ukraine 65.9 28.8 Romania 48.6 38.2EU 18.4 18.0 Slovak Republic 40.4 17.6 Former Yugoslavia 15.3 12.0Europe (other) 10.7 10.5 Vietnam 24.8 10.8 Germany 8.5 6.7Middle East 10.3 10.0 Poland 18.3 8.0 China 7.7 6.0Asia 6.2 6.1 Russian Federation 16.9 7.4 Ukraine 7.6 6.0Africa 6.0 5.9 Fed. Rep. of Yugoslavia 4.1 1.8 Russian Federation 3.8 3.0America 3.4 3.4 Bulgaria 5.0 2.2 Poland 2.5 2.0Central Europe 2.5 2.5 Germany 6.1 2.7 Vietnam 2.2 1.7Australia 0.1 0.1 China 4.3 1.9 Slovak Republic 1.3 1.0
United States 3.8 1.7 Greece 1.0 0.8Others 9.4 9.2 Others 39.2 17.1 Others 34.5 27.1
Total 102.3 100.0 Total 228.9 100.0 Total 127.0 100.0% of total population 1.2 % of total population 2.2 % of total population 1.3
Poland (1999) Romania (1999) Slovak Republic (1997)
Thousands % Thousands % Thousands %
Ukraine 7.0 16.4 Republic of Moldova 6.9 11.1 Czech Republic 5.8 23.3Russian Federation 4.4 10.4 China 6.7 10.9 Ukraine 3.5 14.1Vietnam 3.3 7.6 Turkey 5.2 8.4 Poland 2.8 11.3Belarus 2.3 5.4 Greece 5.1 8.3 Former Yugoslavia 2.0 8.2Germany 1.9 4.5 Italy 4.6 7.4Fed. Rep. of Yugoslavia 1.6 3.8 Syria 3.4 5.4United States 1.4 3.2Armenia 1.3 3.1Bulgaria 1.2 2.8France 0.8 2.0Others 17.5 40.9 Others 30.0 48.5 Others 10.7 43.1
Total 42.8 100.0 Total 61.9 100.0 Total 24.8 100.0% of total population 0.1 % of total population 0.3 % of total population 0.5
© OECD 2001
Main Trends in International Migration
75
in 1999, particularly for people from Romania andthe Ukraine. The increase may be explained by theapprehension that Hungary will shortly introducethe admission rules applied in the EU, which arehighly restrictive for Romanian and Ukrainiannationals.
Gypsy minorities are present in most countriesin the region, and flows both to Western Europe andwithin Central Europe were very substantial onceborders opened; they have since fallen consider-ably overall. At the same time, countries such asFinland saw numbers of gypsy migrants rise in 1999(1 500 from Slovakia and 300 from Poland). A num-ber of countries (the Czech Republic, the SlovakRepublic, Bulgaria, Hungary) are conducting activeprogrammes to integrate Gypsies socially and eco-nomically, often with funding under programmes bythe European Union (PHARE) and/or the Council ofEurope, which may, over the long term, mean thatthey become sedentary. But Gypsies are frequentlymarginalised and their living conditions deplorable.They often live on the edges of larger towns (Roma-nia, Hungary, Bulgaria, the Federal Republic ofYugoslavia, the Czech Republic) or in villagesentirely inhabited by Gypsies (Bulgaria, Romania)3.In the majority of cases, Gypsies have a level of edu-cation much lower than the rest of the populationand are more vulnerable to unemployment. Adegree of rejection by the rest of the populationrenders the success of active policies targetedtowards this group more difficult. As a result, theseminorities are still much inclined to emigrate.
Temporary labour migration
• Trends in labour migration flows
The existence of free-trade areas has an impor-tant effect on emigration. The data available show aslight increase in labour migration due to the imple-mentation in the member States of the Central Euro-pean Free Trade Area (CEFTA),4 since economicco-operation between countries in transition favourssuch migration. The available information points to asignificant increase in the temporary employment offoreign labour, particularly in the business catego-ries. In those countries which have experienced thehighest growth rates in recent years, the number ofwork permits issued to foreigners each year is sub-stantial.
In Hungary, the number of newly issued workpermits has continued to rise since 1996, to reach
nearly 30 000 in 1999. In Poland around 20 000 per-mits are issued each year. In the Czech Republic,after peaking in 1995-96, the temporary immigrationof foreign workers has declined continually due tothe deterioration in the labour market situation.Immigration by business people has tended toincrease since 1996, however. Unlike these threecountries, Romania and Bulgaria attract fewer for-eign workers, but numbers are increasing there aswell.
Combating illegal employment is a priority forgovernments. The CEECs are introducing increas-ingly strict arrangements. These include penaltiesfor employers illegally recruiting foreigners (theCzech Republic, Poland, Hungary, Latvia) andinspections by the Labour and Interior Ministries(the Czech Republic, Poland). In some countries theinformal sector accounts for approximately 30% ofGDP (Hungary), and the participation of foreignersin this sector is understood to be important. InPoland, according to estimates by the country's Min-istry of Labour, between 100 000 and 150 000 undoc-umented foreigners are thought to be working everyyear in the construction sector.
• Origins of foreign labour
The available statistics on the numbers of for-eign workers show that in the CEECs immigrants fromadjoining countries are most numerous, although thenumber of EU nationals and people from other coun-tries is rising steadily. In the Czech Republic, in addi-tion to the Slovak workers who are permitted freeaccess to the labour market, there are sizeable num-bers of Ukrainians and Poles (41 300 foreigners heldwork permits in 1999 and around 53 200 Slovaks hadjobs). In Hungary work permits are generally grantedfor those sectors experiencing labour shortages or topersons with particular expertise or specific experi-ence. Most foreign workers come from the NIS (2 300)and Romania (10 600).
A number of people from Asia and the MiddleEast have settled on a long-term basis in theregion. Chinese and Vietnamese are prominent incatering and retailing in Poland and the CzechRepublic. Numerous nationals of Turkey and Mid-dle Eastern countries settled in 1999 in Romania(Turkey 5 200, Syria 3 300, Iran 2 000 and Iraq 2 000)and in Bulgaria (a total of over 10 000 permanentand long-term residents).
The numbers of EU nationals are not large, butare on the increase (nearly 15% of foreigners with
© OECD 2001
Trends in International Migration
76
work permits in Hungary). A fairly large group ofWestern Europeans working in Hungary consist ofsenior managers in foreign firms who, under the cur-rent regulations, do not require work permits. InPoland, EU nationals mostly hold skilled jobs: whilethe British predominate in education, most national-ities are broadly represented among executives inforeign firms.
Conclusion
At the conclusion of this overview of migrationflows in Central and Eastern Europe, a number oftrends emerge. First of all, East-West migration flowspersist but inflows into most CEECs have increasedand diversified. Most of these countries are becom-ing a prime destination for migrants from the Eastand South (the NIS and the former Yugoslavia).
It is still too early to say that flows in the regionhave become globalised. Apart from the CzechRepublic and Hungary, which stand out as new hostcountries for foreigners from more distant regions,immigration is usually from Western Europe andfrom adjoining countries. The migration balances inAlbania, Bulgaria, Poland, Romania, the Baltic coun-tries, the NIS and the former Yugoslavia are still neg-ative, although the number of foreigners settlingthere is trending upwards.
More generally, we cannot limit the study topermanent and long-term movements because thisgroup of countries is defined less as an area of set-tlement than as an area of transit, trade and eco-nomic activity. It would appear that very short-term,indeed “pendular”, migration is quite common in anumber of countries and that cultural and historicalties make short-term cross-border movements “nat-ural”. These factors demonstrate how important it isfor governments in the region to clarify and harmon-ise the status of the resident foreign population andforeign migrant workers, which would make it easierto regulate flows. Such reforms are also required fortheir accession to the European Union.5
D. AN OVERVIEW OF MIGRATION POLICIES6
Migration policies of OECD Member countriescan be divided into four sections. The first consistsof measures adopted at national and internationallevel to strengthen the control of flows, includingthose of asylum seekers. The second category con-cerns the fight against irregular migration and theillegal employment of foreign workers. The third cat-egory covers all measures that aim to ensure a bet-
ter integration of migrants in the host country. Thelast category concerns co-operation at internationallevel in the area of migration.
1. Policies for regulating and controlling flows
a) New laws concerning immigration
Several OECD Member countries have recentlymodified their legislation and implemented newprovisions governing the entry, residence andemployment of foreigners. While some reforms haveled to improvements in the status of foreignersalready settled in the host country, most of themhave been aimed essentially at tightening bordercontrols, simplifying and speeding up the procedurefor examining asylum applications, as well asamending the conditions for entry, residence andemployment.
In November 2000, the Spanish Parliamentpassed Spain’s new Immigration Act after the firstreading of the Bill. In many areas, it is much morerestrictive than the previous Act, which came intoforce in January 2000. The new Act provides for theimmediate expulsion of foreigners resident in Spainillegally, while the previous legislation had simplyintroduced a system of fines. Permanent residencepermits can now be obtained only after five yearsresiding and working in Spain, instead of two underthe previous legislation. There are now three criteriafor entry into Spain: the possession of valid identitypapers, proof of sufficient means of support for theduration of the stay and proof of the purpose andconditions of stay. Except in special circumstances,the government will no longer be required to explic-itly state or justify the reasons for refusing to grantan entry visa. What is more, the text restricts to legalresidents only, some of the constitutional rights thathad formerly been granted to all foreigners underthe January 2000 Act, such as the right to work, theright to strike and join unions and the right of associ-ation and demonstration. Lastly, foreigners have theright to vote in municipal elections in Spain only ifSpanish nationals are accorded reciprocal rights inthe foreigner’s country of origin.
In Portugal, a new Immigration and Foreigners’Work Act was adopted by Parliament in July 2000. Italters the process for granting visas and creates cat-egories of people who cannot be expelled (peopleborn in Portugal and habitually residing there, peo-ple who have resided in Portugal since the age often, and the parents of minors). This Act also creates
© OECD 2001
Main Trends in International Migration
77
a new residence permit, valid for one year andrenewable for up to five years. It is linked to the per-formance of paid employment and may be grantedto undocumented foreigners who can provide proofof a contract of employment. In practice, this mea-sure facilitates the regularisation of a large numberof foreign workers employed in the construction sec-tor, where there is a heavy reliance on this work-force. A report published in August 2001 andprepared at the request of the Government by theInstitute for Employment and Professional Training,forecasts that Portugal will probably require approx-imately 20 000 additional immigrant workers by theend of 2001, notably in the domain of agriculture,the construction sector and cleaning services as wellas in hotel and catering. A similar report will be pub-lished annually which should allow an estimation offoreign labour requirements in order to assist theGovernment in distributing new residence and workpermits to foreigners.
A new Act came into force in the Netherlands inthe first half of 2001. It focuses mainly on asylumpolicy; in particular it provides for asylum applica-tion procedures to be simplified and shortened, andintroduces new conditions for the granting of refu-gee status and related rights. The Act also estab-lishes new rules relating to residence permits, aswell as the control and expulsion of undocumentedforeigners. However, it remits to secondary legisla-tion the circumstances under which a foreigner mayobtain an ordinary permit for the purposes ofemployment, study, occupation as an au pair, and forthe reason of family reunion. After five years’ resi-dence in the Netherlands on a fixed-term permit, aforeigner may obtain an ordinary residence permitas long as, inter alia, he/she has sufficient means ofsubsistence. Lastly, the Act makes changes to thesystem whereby asylum seekers may enter thelabour market. Three types of work permit are intro-duced for this category of foreigner: for a workperiod of indefinite length, for a fixed period, and atemporary permit. These permits grant the holdersdifferent rights.
In September 2000, the German Ministry of theInterior set up a Cross-party Committee with the taskof formulating proposals regarding the legislativeframework surrounding immigration and bringing itinto line with the needs of the German economy. Theproject (the Süssmuth Report) was submitted inAugust 2001 and contains proposals that could giverise to a new law on immigration in 2002 and whichhave sparked off an intense debate in Germany. The
proposals concern, on one hand, the immigration offoreign workers, which would be facilitated in the caseof skilled workers with good knowledge of German andwhose skills match the needs of the Germaneconomy – as assessed by a future Federal Office.Such workers would be awarded a permanent resi-dence permit. An annual immigration quota foremployment is the subject of a debate in the frame-work of this same project. This quota of approximately50 000 people would not affect solely highly qualifiedworkers selected on the basis of the points system.Inversely, residence of asylum seekers could initiallybe limited to a duration of three months and the entryof children for family reunion would be reserved exclu-sively to children under 12 years, against 16 years atthe present time (although this measure does not con-cern, on the one hand, children over 12 years possess-ing a good knowledge of German, and on the otherhand, highly qualified workers and their familieswhose children could join them in Germany on thecondition that they under 18 years old).
In Greece, the government approved a new billon immigration in November 2000. The bill delegatesto local Prefectures the Ministry of Public Order’sauthority to issue residence permits. Under the newbill, residence permits will be issued for a period of12 months, and have to be renewed six times beforethey can be issued for two years. A foreigner will onlybe able to obtain a permanent residence permit afterten years’ residence in Greece. The bill also statesthat, before applying for a work permit on behalf of aforeigner, all employers must check that no availableperson in the local resident workforce, whether Greekor of foreign origin, matches the vacancy. The new billintroduces stringent measures against anyone givingaid or assistance to undocumented foreigners oremploying them. Further, a foreigner may only be nat-uralised after 10 years’ legal residence during the12 years prior to lodging the application, and must pay1 470 EUR. Lastly, the bill compels the public healthservices to report any undocumented person except ina case of emergency or of deteriorating health; it alsoremoves the right of children of undocumented for-eigners to attend state schools. Family reunion forspouse and children is subject to relatively strict con-ditions and almost exclusively reserved to “greencard” holders. Asylum seekers, who have obtainedhumanitarian or political refugee status, may benefitfrom family reunion. There are no restrictions on familyreunion on immigrants of Greek origin.
In Switzerland, the seven bilateral free tradeagreements signed with the European Community
© OECD 2001
Trends in International Migration
78
and its Member States, including the agreement onfreedom of movement, were approved by referen-dum in May 2000. The agreement on the freedom ofmovement largely mirrors the provisions as definedby the Treaty on the European Community. Transi-tional periods have been fixed with regard to non-discriminatory access to the labour market. Applica-tion of the agreement’s provisions as they affectnationals of EFTA member states is being examined.The Government also agreed to remove, during thesummer of 2000, visa requirements for any foreignerholding a Schengen visa or a permanent residencepermit from a member State of the European Union,EFTA, Canada or the United States.
A new Foreigners’ Act drawn up during 2000 hasreached the consultation stage. It focuses on nation-als of third countries and on national of countries ofthe European Union at a subsidiary level, in situa-tions that are not covered by the bilateral agree-ment on the freedom of movement. The bill allowslabour market access to skilled migrants, and on thebasis of annual quotas. The Act also provides forimprovements in the legal status of foreigners, par-ticularly insofar as it reduces obstacles linked tochanging profession, company or canton, and grantsthe right to family reunion to all those in possessionof a residence permit.
The Australian Government has created a tem-porary protection visa for migrants in an irregular situ-ation who may acquire refugee status. It has alsoattached particular attention to border controls andthe fight against human trafficking, in establishing aseries of measures which permit the inspection andblockage of vessels beyond its territorial watersshould there be suspicion of human trafficking orwhich would prevent anyone seeking asylum if he/she is also the beneficiary of such a protection inanother country. A new sponsored visitor visa classfor family and business visitors, which leaves open tothe decision maker the option of requesting a secu-rity bond in respect of the visitor, was introduced on1 July 2000. Australia has decided to restrict the rightsof New Zealand residents to social benefits, particu-larly by imposing on them stricter conditions for entryinto the country: the right to reside in Australia is nolonger automatic. New Zealand nationals must nowmeet the same conditions as all other migrants toqualify for social benefits.
In February 2001, the Minister of Citizenshipand Immigration tabled new legislation in the Houseof Commons. The legislative changes proposed inthe new Immigration and Refugee Protection Act
reintroduces severe penalties for people smugglersand traffickers, speeds up family reunification andmaintains Canada’s humanitarian tradition of provid-ing safe haven to people in need of protection.Another Act recognising the rights and duties ofcohabiting couples was enacted in 2000. It estab-lishes the right of residence for a foreign nationalwho is the partner of a Canadian national. The possi-bility of creating a system for selecting skilled work-ers, focusing on the ability of immigrants to work inan information economy is under review.
In Hungary, Poland, and the Czech and SlovakRepublics, as well as in Bulgaria and Romania, legis-lation on residence and work of foreigners is thesubject of an important revision intended to alignexisting measures with those presently applicablein the European Union. The modifications are princi-pally concerned with entry and residence of foreign-ers (including asylum seekers and refugees),citizenship, the fight against illegal employment offoreigners and the signature of international agree-ments on readmission. In the Czech Republic, a newForeigners’ Residence Act came into force on1 January 2000. It introduced new permanent andtemporary residence permits, including permanentstay with no visa, with a short-term (maximum90 days) visa, and with a long-term visa. A temporaryprotection system and a visa granting an exceptionalleave to remain have also been created. Lastly, theAct states that visas are mandatory for nationals ofseveral CIS Republics including Russia, Ukraine,Belarus, Kazakhstan, Kirgizstan, Turkmenistan andMoldavia, as well as for Cuban nationals. In Hungary,visa requirements for Moldavia, Belarus and Russiahave been introduced in 2001. Similar measureshave already been adopted for the countries ofCentral Asia and the Caucasus.
In the case of the Baltic States, Estonia intro-duced in September 2000 a mandatory visa schemein respect of Russian nationals with a view to bringingits own legislation in line with that of member Statesof the European Union. This new scheme ends thesimplified system previously available to Russianinhabitants of the bordering region. Lithuania, too,must adopt similar measures, particularly in respectof Belarussian, Russian and Bulgarian nationals.
b) Legislation aimed at dissuading false asylum seekers
Several OECD Member countries, includingIreland and the United Kingdom have, for over a
© OECD 2001
Main Trends in International Migration
79
year, been experiencing a sharp rise in asylumapplications; in 2000, the United Kingdom becamethe main destination European country for asylumseekers. In response to this the authorities haveimplemented a series of measures aimed at dis-couraging unfounded applications. In April 2000, asystem of assistance in kind based on the distribu-tion of vouchers was introduced, which replaced theprevious regime of financial assistance. This system,which was designed to reduce fraud, is still very con-troversial, and is expected to be slackened. Thegovernment has also removed from asylum appli-cants the right to choose where they live; they areinstead placed across the country.
The number of applications rejected in the firstinstance is rising sharply, mainly because of legalirregularities; the number of appeals against rejec-tions is also rising as a result: almost 8 000 appealswere lodged in September 2000, that is to say eighttimes more than in January 2000. In November 2000,the government announced the introduction of anew strategy for integrating refugees. It will have abudget of GBP 1.5 m.
Ireland has also had to deal with a sharpincrease in asylum applications. A new law on refu-gees came into force in November 2000. Most nota-bly, this law introduces a control system involvingthe use of fingerprints, and accords additionalauthority to the police as part of the fight against thetrafficking of asylum seekers.
In Finland, amendments to the Foreigners’ Actde s ign e d t o acce le ra te t he exa min at i on ofunfounded asylum applications came into force on10 July 2000. This measure is mainly aimed at reduc-ing the number of Gypsies entering the country:in 1999 they accounted for approximately one thirdof asylum applicants. In Norway, the ImmigrationDirectorate is now responsible for interviewing asy-lum seekers; they had previously been conductedby police officers. From 1 January 2001 onwards,appeals against negative decisions will have to beaddressed to a newly created Immigration AppealsBoard.
In Poland, amendments to the 1997 Foreigners’Act, which are currently under review by Parliament,provide notably for the introduction of a system oftemporary social protection, an accelerated proce-dure for examining manifestly fraudulent asylumapplications, and a change in legal procedures fordealing with foreigners in custody. A new Refugeesand Asylum Seekers’ Act, providing in particular for
accelerated procedures, and dealing with mattersrelating to manifestly fraudulent applications andunaccompanied minors, came into force in Lithuaniain September 2000. New laws are also in the processof being adopted in Estonia and Latvia.
2. Reinforcement of legislation concerning the fight against irregular migration and illegal employment of foreigners
a) Combating irregular migration
In May 2000, following the signature of a similaragreement with Belgium, the United Kingdom andFrance initialled an agreement providing for jointaction to prevent illegal immigration to the UnitedKingdom via the Eurostar train service. Drivers ofvehicles will be held personally responsible if dis-covered trying to pass illegal immigrants into theUnited Kingdom. The imposition on lorry drivers ofa non-criminal penalty of GBP 2 000 was introducedfor each illegal entrant to the United Kingdom dis-covered in their vehicle.
In Japan, several amendments to the Immigra-tion Act came into force in February 2000. Re-entryrefusal was extended from one year to five years foroverstayers who had illegally entered the territory.
New sanctions aimed at the employers ofundocumented foreigners (two years in prison orfines up to AUD 66 000) are to be introduced by theAustralian government in 2001.
In 1999 Austria reinforced legislation on legalaction against smugglers of human cargo and multi-plied border controls. As a consequence, the num-ber of illegal entrants rejected at Austrian bordershas declined (8 600 in the first half of 2000 comparedwith 9 800 during the same period one year earlier).
Among the changes in legislation proposed inFebruary 2001 in the revision of the law on immigra-tion and the protection of refugees, Canada hadreintroduced severe penalties for people smugglersand traffickers.
In order to fight against the passage of illegalimmigrants through its territory towards countries ofth e Eu ropean Unio n, Estonia had set up inSeptember 2000, a unilateral visa system whichrequires delivery of all necessary identity papers inorder to cross the Russian-Estonian border. Thismeasure puts an end to the more simplified systemfrom which those living close to this border had pre-viously benefited. The Lithuanian Minister of theInterior, after having set up the Centre for Registra-
© OECD 2001
Trends in International Migration
80
tion of Foreigners in Pabrade, where all foreignersfound to be in an irregular situation are held, hadvoted in 1998 a law relating to the expulsion of for-eigners in an irregular situation. Since this time,there has been a reorganisation of the border policeand its personnel have been redeployed in order toreinforce controls at the border with Belarus. Finally,the penal code has been amended to enable a max-imum term of 15 years imprisonment for the smug-gling of immigrants.
Due to her large areas of land and coastal bor-ders, the Greek Government views the fight againstillegal entries as a high priority. In 1999, almost20 000 foreigners had been expulsed following anadministrative decision (8 000 more than in 1998);the majority of which originated from the Balkan coun-tries. Over the past five years, more than one millionAlbanians were also turned back at the border.
In Hungary, sanctions for employers employingillegal foreign labour have been recently reinforcedbut the severest penalties fall on the workers. If aforeigner is apprehended at his workplace without avalid work permit, he may be banished from Hun-garian territory for a period of one to five years. Thefine payable by the employer is five times the mini-mum wage. A work permit is necessary for the major-ity of jobs carried out by foreign workers. A workpermit can only be delivered if there is no Hungar-ian available on the local labour market having thenecessary qualifications demanded by the position.An employer must register a vacancy sixty days priorto the start of the contract (30 days in the case ofseasonal or occasional employment). In Romania,the hiring of a foreigner without a work permitexposes the employer to a fine of 250 to 500 dollars.
Turkey is preparing new legal arrangements forwork and res idence permits. The aim of theintended legislation is combating illegal employ-ment. Employers who hire illegal immigrant labourcan be penalised (up to 2.5 billion Turkish Liras) aswell as the il legal workers themselves (up to500 million Turkish Liras).
Trafficking of migrants was also addressed inthe last US Congress. The Victims of Trafficking andViolen ce Pro tect io n Act , s igne d into law inNovember 2000, created 5 000 new “T” non-immigrantvisas annually for women and children who havebeen victims of “severe trafficking.” An additional10 000 new “U” non-immigrant visas were created foraliens who have suffered physical or mental abuse
as victims of crimes such as rape, domestic violenceand involuntary servitude. In February 2001, USPresident George Bush and Mexican President Vice-nte Fox met and pledged to engage in high-levelnegotiations to constructively address migration andlabour issues between our two countries.
Italy has reinforced repressive measures tocombat illegal immigration and the human traffick-ing. Between 1998 and 1999, the number of expul-sions (escorted to the border and expelled) havealmost tripled, passing from 9 000 to 25 000. A billdrafted in August 2001 which provides for prisonsentences for foreigners attempting to illegally enteron Italian soil as well as for those who have failed toleave the country after an expulsion order, is pres-ently being discussed. The latter group also runs therisk of being banned from Italian territory for aperiod of 10 years.
Following an official enquiry carried out earlyin 2000 in the horticultural sector of the Netherlands,it has been decided to penalise more severelythose employers hiring illegal foreign workers, whohave previously been condemned for so doing.
b) Recent regularisation programmes and their results
In Spain, a regularisation operation has beenincorporated into the transitional provisions of thenew Rights and Freedoms of Foreigners Act ofJanuary 2000. It applies to all foreigners perma-nently on Spanish soil on 1 June 1999 and who eitherheld a work permit and/or a residence permit between1 February 1997 and 1 February 2000, or requestedsuch a permit before 31 March 2000, or lodged an asy-lum application before 1 February 2000 as well as tofamily members of nationals of third countries,nationals of Member States of the European Unionor of Spanish nationals. Almost 245 000 applicationsfor regularisation had been lodged; of these, almostone third had been filed by Moroccan nationalswishing to obtain residence and employment per-mits, mainly for agriculture, domestic services andconstruction. By the end of October 2000, almost124 000 out of slightly over 185 000 applicationsexamined had been accepted. Furthermore, almost20 000 nationals of Ecuador had obtained in thesame year a residents permit for Spain on humani-tarian grounds.
Following the regularisation operation that tookplace in Greece during 1998, almost 371 000 undocu-
© OECD 2001
Main Trends in International Migration
81
mented people received a white card’ entitling themto enter the labour market and enjoy equal employ-ment rights. Of these, nearly 212 000 filed applica-tions for a green card’ in February 2000 entitling themto work for 1-3 years and, in certain circumstances, torenew their work permits. By September 2000, thisgreen card had been issued to over 147 700 people;the process of examining applications continues. Anew operation for regularisation took place between5th June and 7th September 2001 and, from the firstavailable reports, more than 350 000 requests wereregistered.
The regularisation operation in Italy that beganin 1998 was continued into 2000. A Decree ofOctober 1998 established a quota of 38 000 workerswho could be regularised in 1998, of whom 3 000were Albanian, 1 500 Moroccan, and 1 500 Tunisian.Of the 250 000 applications lodged in 1998, some39% of them were still being examined at mid-Jan uar y 2 000. In Ju ne 200 0, th e gov ern men tannounced that during 40 000 residence permitswould be issued to undocumented migrants duringthat year, and 53 000 files would have been exam-ined by the end of July.
In Belgium, the regularisation programmeimplemented in January 2000 looked at 35 000 cases(concerning approximately 52 000 people of whom17 per cent came from the Democratic Republic ofCongo and more than 12 per cent from Morocco).Regularisation gives entitlement to unlimited stayand access to the labour market. The regularisationprocedure would end by October 2001.
In March 2000, Switzerland carried out a pro-gramme to regularise certain categories of foreignerswho had entered the country before 31 Decem-ber 1992 and were now in serious personal need.This operation, known as Humanitarian Action 2000’,concerned almost 13 000 people, most of whomwere Sri Lankan nationals.
In December 2000, the United States Congressadopted the Legal Immigration and Family Equity Act(LIFEA). In particular, it enables almost 400 000 undoc-umented migrants to apply for regularisation as long asthey can prove that they entered the United Statesbefore 1 January 1982. The law also introduced Vvisas: these are reserved for about 500 000 familymembers of documented migrants who have beenwaiting for their green card applications to be pro-cessed for over three years.
In Mexico, a regularisation programme wasconducted f rom February to May 2000. Over
2 600 applications, most of them filed by nationals ofGuatemala, Salvador and Honduras, were processed.
New Zealand has adopted provisional mea-sures concerning foreigners whose visas had expiredbut who are well integrated in the country. An expul-sion process concerning persons having an illegalstatus in New Zealand came into full effect on 1stOctober 1999. From that date, anyone residing ille-gally in New Zealand has 42 days to appeal, afterwhich they are liable to immediate removal. How-ever, those overstayers who had become well set-tled (those with a New Zealand resident or citizenpartner, New Zealand born children, or who hadbeen in New Zealand for five years or more by30 March 2001), would be subject to this new provi-sion, and are therefore being given the opportunityto apply to regularise their immigration statusbetween 1 October 2000 and 30 March 2001. Suc-cessful applicants will be granted an open work per-mit, and will be permitted to apply for New Zealandresidence after a two-year period.
In July 2000, the Portuguese Governmentobtained a legislative permit from Parliament toamend the Act of August 1998 dealing with theadmission, residence and departure of foreigners.Most notably, the amendment that came into forcein 2001 allows undocumented foreigners in posses-sion of a firm offer of employment to reside in thecountry. As of July 2001, almost 76 500 residencepermits have been delivered (one-third to Ukraini-ans and almost one-fifth to Brazilians). Approxi-mately 30 000 cases are still being considered.
As the review procedure launched in France inJune 1997 is nearly complete, a provisional assess-ment can now be made: 75 600 foreigners have beenregularised under this procedure. Three-quarters ofthe people regularised came from Africa (some55 000), including 30 000 from sub-Saharan Africaand rather less than 25 000 from the Maghreb. Theremaining one-fourth were from Asia (20%) andEurope (5%). The breakdown by nationality washighly concentrated, four nationalities accountingfor 45% of regular isat ions: 12 000 Alger ians ,8 800 Moroccans, 7 500 Chinese and 5 900 nationalsof the Democratic Republic of Congo.
3. Policies for the integration of immigrants
OECD Member countries are increasingly con-cerned about the issue of integrating foreignersalready present as well as those who plan to residein the host country for an extended period. In this
© OECD 2001
Trends in International Migration
82
report, the emphasis will be on measures of integra-tion recently taken by Member countries concernedwith the successful integration of foreigners in soci-ety and in the labour market.
a) Defining the groups of people to be targeted by integration measures
In several OECD European Member countries,the desire to implement genuine integration poli-cies has recently brought up the problem of how todefine the groups of people to be targeted by suchmeasures, or more general measures relating toimmigration, and has accordingly raised the issue ofobtaining pertinent data on these different catego-ries of foreigner. This has been the case not only inthe Netherlands and France, but also in Denmarkand Norway.
In 1999, the Dutch Central Bureau of Statistics(CBS) introduced the term allochtonous’, defined asthose persons of whom at least one of the parentswas born abroad. The CBS then draws a distinctionbetween first- and second-generation allochtonous’people: a first-generation “allochtonous” person isone who was born abroad of one or two parents bornabroad’; a second-generation “allochtonous” personis one who was born in the Netherlands of one or twoparents born abroad’. It follows that the CBS believesthat a person will be described as native’ (i.e. Dutch)if both parents were born in the Netherlands.
In France, the National Institute of Statisticsand Economic Studies (INSEE) has established sev-eral statistical distinctions since the population cen-sus of 1999. It first of all distinguished those who areFrench from birth’, from those who are French byacquisition of nationality. It then identified the con-cepts of the foreign population’ and an immigrantpopulation’: the foreign population being made upof people who declared citizenship other thanFrench citizenship in the recent census, while theimmigrant population includes people born abroadwho declared themselves to be of foreign national-ity or French by acquisition. According to the INSEE,the foreign and immigrant populations do not over-lap (not all immigrants are necessarily foreigners,and vice versa : immigrates may be French by acquisi-tion, and foreigners may be born in France). Bothcategories do, however, include individuals bornabroad holding foreign citizenship.
In Denmark, immigrants are defined for statisticalpurposes as people born abroad of two parents bornabroad or who are foreign citizens. Descendants of
immigrants are people born in Denmark whose par-ents are not Danish citizens born in Denmark. Immi-grants who have obtained Danish citizenship are notincluded in the statistics on the foreign population.In Norway, immigrants are defined as people bornabroad of parents with no Norwegian ancestors, orborn in Norway of parents born abroad.
b) Recent measures aiming at better integrating immigrants
Several regulations relating to the integrationof foreigners were adopted in France by the Direc-torate of Population and Migrations in 2000; theseparticularly concerned local contracts for receptionand integration, the implementation of a sponsor-ship campaign to support young people having diffi-culty in entering employment, and the introductionof single education support measure (the Local Edu-cation Support Contract).
One of the aspects of the policy of integrationrecently endorsed by the German Ministry of Labourand Social Affairs aims to improve communicationsbetween administrations and immigrants. This can beachieved through a better understanding of socialrights of foreigners, of professional training availableto them and of their native language. Furthermore,another part of the integration programme is aimedat foreign women (German language classes, informa-tion on training possibilities, etc.).
Australia has recently adopted a new pro-gramme for a multicultural Australia. The pro-gramme rests on the principles of Australian societythat guarantees liberty and equality to the popula-tion and enables the diverse components of thecountry's population to fully express itself in society.This programme also underlines a respect for cul-tures and religious beliefs while all at once empha-sising social equality.
In Canada, the reception of migrants is man-aged at every level of administration. Agreementsconcerning the installation of immigrants have beenreached between Citizenship and ImmigrationCanada and the different provinces of the country.Services offered abroad (advice for immigrants) hasthe double function of permitting future immigrantsto find their way upon their arrival in Canada. Fur-thermore, there are a number of programmes aimedat facilitating the installation of immigrants, puttingthem on the right professional track and insertion inthe labour market, and also assisting them in learn-ing the official languages of Canada.
© OECD 2001
Main Trends in International Migration
83
The new Integration of Foreigners Act thatcame into force in Denmark on 1 January 2000 trans-fers responsibility for integration policies to localmunicipal authorities. The Act establishes a Recep-tion Programme for New Arrivals and Refugees overa three-year period: in particular, this includes anindividual plan for each person, courses on the func-tioning of Danish society, and Danish lessons.
In Finland, since the adoption of a law in 1999,all immigrants resident in Finland can benefit from aprogramme to assist with integration into societyand into the labour market. In the framework of thisprogramme, an immigrant is given a subsistenceallowance immediately on his installation in thearea in which he resides. This indemnity, more oftenintended for asylum seekers or refugees, can bereduced by 20 per cent if the person refuses to par-ticipate in the integration programme and espe-cially in professional training and Finnish languageclasses organised by the programme and in the caseof persistent refusal, this penalty can be raised to40 per cent.
In order to facilitate the integration and reinte-gration of children of migrants, the Greek Govern-ment has put in place three different schemes:reception classes, tutorials (doing supplementaryhours in addition to regular hours in small classes ofthree to nine students) and multicultural classes.In 1999-2000, 500 reception classes and 700 groupsof tutorials had been carried out at primary educa-tion level, essentially concentrated in the Athensregion. Over the same period, almost 9 000 studentswere taught in the reception classes, that is tosay approximately 13 per cent of the total numberof migrant children of all categories and almost5 000 students, i.e. 7.5 per cent of the total who hadbenefited from the tutorials. Twenty multiculturalclasses were opened in 1999-2000 in which almost3 500 students, of all levels, were educated.
In 1999 Italy had recorded a total of almost120 000 foreign children receiving schooling, a figurewhich reflects an increase of around 40 per cent incomparison to the previous year. This increase is anobvious indication of the stabilisation of the immi-grant population in Italy. The majority of these chil-dren received elementary education, even if thefigures for secondary education showed a strongincrease (more than 54%) over those for 1998. Never-theless, not all children who could be consideredminors entered the school system, especially thethousands of non-accompanied minors.
Luxembourg also gives special attention tothe integration of children of foreign origin intoLuxembourg’s schools. At present, one of theanswers provided by the ministerial authorities hasbeen the creation of a pilot early-education projectmade mandatory for communes as of this year.
A new policy on integration came into effectin 1998 and a new authority was established toimplement it. Integration policies are particularlyaimed at offering to immigrants the possibility tofulfil their own need and to integrate into society.The policies also aim to preserve fundamental dem-ocratic values and seek to ensure equal rights andopportunities for men and women as well as fightingagainst discrimination, xenophobia and racism.
c) Combating racism and discrimination
In Norway, the Immigration Directorate’s firstreport on racism and discrimination and two otherreports on the subject, one by the Centre for Com-bating Ethnic Discrimination, the other by the Anti-Racist Centre, were published during 2000. Thesereports establish that racism and discriminationexist in various sectors of Norwegian society, partic-ularly in the labour market and the housing market.
A programme for combating racism and ethnicdiscrimination was drawn up by the Finnish Ministryof Labour during 2000, and was due for adoption byt h e g o v e r n m e n t a t t h e e n d o f th e ye a r. I nSeptember 2000, the Irish Minister of Justiceannounced a re-examination of the 1989 law on rac-ism with a view to making it more effect ive:since 1989 only one case of incitement to racialhatred had been brought before the courts. InFrance, the Group for Studying and Combating Dis-crimination, which was set up in 2000 following theCitizenship Conference (Assises de la Citoyenneté) wasgiven, inter alia, responsibility for dealing with com-plaints received on the toll-free telephone numberthat had been put introduced as a means of combat-ing racial discrimination. The introduction of follow-up measures to this call-centre was approved by theDirectorate of Population and Migrat ions insummer 2000.
At the beginning of 2000, several initiativeshave been taken in Denmark with a view to improv-ing equal opportunities on the labour market, inde-pendently of the ethnic origin of the employedperson. The guidelines concerning recruitment andpersonnel policies, established for the public sector,have been extended to the private sector in order
© OECD 2001
Trends in International Migration
84
to have an impact on recruitment policies. Compa-nies hiring foreign personnel benefit from financialassistance. In July 2001, a new law on citizenship wasvoted in Sweden that acknowledges double nation-ality. This law will facilitate the naturalisation of chil-dren born to unmarried parents (with a Swedishfather), adopted children and stateless persons.
4. Migration, international co-operation and the enlargement of the European Union
International co-operation in the area of migra-tion principally concerns the regulation and control ofthe flows. Mechanisms for bilateral or multilateralco-operation are in place, whether on the question ofvisa or border control and agreements also exist princi-pally for the recruitment of highly skilled workers inorder to attract foreign investors or simply to encour-age the return of emigrants. Moreover, OECD Membercountries are become progressively aware of theadvantages to be gained from a collective examinationof the question of controlling migratory flows in rela-tion to the development of sending countries and theireconomic integration in the globalisation process.
Mechanisms for multilateral internationalco-operation in the field of immigration and asylumare still relatively limited, and Member countries ofthe OECD have a preference for bilateral agree-ments to deal, for example, with re-admission, andsometimes to establish programmes for the recruit-ment of workers. Bilateral re-admission agreementswith a view to combating unauthorised immigrationare being reached increasingly often.
A programme designed to attract foreign inves-tors (Immigration Programme for Investors) hasbeen in place since 1999 in Canada and nine othercentres for immigration of business men locatedoverseas Bei jing, Berl in, Buf falo, Damascus,Hong Kong/China, London, Paris, Singapore andSeoul) have been operational since 1998.
In the framework of the Programme for Industrialand Technical Training (ITTP), Korea annually recruitstrainees of which approximately one-third are takenfrom the network of affiliated Korean enterprisesestablished overseas. Since 1997, a certain number ofthese trainees, of which the maximum period of staycould extend to three years, are permitted to legallyengage in paid employment during the period oftheir training. Very often they carry out low-skilledjobs in the firms which brought them to Korea.
On 11 July 2001, the French and Algerian Gov-ernments signed an agreement on the status of
Algerians in France aimed at bringing it in line withthe status of other foreigners. This agreement is aprotocol to the 1968 Franco-Algerian Agreementdefining the conditions for the movement, employ-ment and residence of Algerian nationals and theirfamilies. This protocol is aimed at extending thebenefits of ordinary law to Algerians, since, due tovarious changes in the legislation, particularly in theAct of 1998, Algerians were governed by an agree-ment that was on the whole less favourable than theordinary law applying to other foreigners.
For returning and ethnic Greeks the pro-gramme launched in the early 1990s, leading to theestablishment of a National Foundation for theReception and Settlement of Repatriated Greeks toassist with housing and economic integration, wasdeemed inadequate given the numbers involved.Consequently a new Act was passed in 2000 to stepup the scheme and provide more accommodation,vocational training and job opportunities, social andcultural integration and public-sector jobs. Subsi-dies have also been granted to host regions. Thereis also an active promotion of Greek culture abroadby setting up cultural schemes and cultural centresin other countries, signing employment agreements,setting up Greek chambers of commerce abroad tostrengthen economic ties with Greece, and provid-ing assistance for Greek citizens abroad.
In Hungary, changes in migration legislationwhich seek to bring them in line with those in force inthe European Union, raise the important questionwith neighbouring countries or countries with histori-cal links whose citizens run the risk of no longer ben-efiting from a visa free entry system into Hungary.This is already the case for Moldavia, Belarus andcountries of Central Asia and Caucus. A visa require-ment for nationals of Romania, the Slovak Republic,the Federal Republic of Yugoslavia, Ukraine andCroatia would therefore have a negative impact onfamily and cultural contacts with those communities.
Since 1997, Italy has concluded 22 readmissionagreements, particularly with France, Spain, Greece,Austria, Switzerland and the majority of central andeastern European countries, as well as with Morocco,Tunisia, Algeria, Georgia and Nigeria. Other agree-ments are being negotiated, mainly with Malta,Senegal, Egypt, the Ukraine, Pakistan, the Philippinesand China. Confronted with the problem of illegalimmigration from the Southern Mediterranean banks,Italy has concluded bilateral agreements with certainsending countries, such as Tunisia, including the pos-sibility of increasing the quota of legal entries.
© OECD 2001
Main Trends in International Migration
85
One section of Portuguese migration policy isaimed at the Portuguese population living overseas.Portugal has recently adopted measures aimed at set-ting up a system for social aid in favour of its citizens of65 years and over living legally overseas. This systemwould favour those who do not receive sufficient socialprotection to meet their needs, often as a result of nothaving contributed to the pension system of the coun-try of residence for a number of years. These measureswould grant a monthly payment equivalent to half ofthe difference between the amount of the pensionwhich would have been paid by the Portuguese author-ities according to the recipient’s professional status andthe social benefits offered in the host country.
Ireland signed a bilateral re-admission agree-ment with Romania in May 2000, and is due to con-clude a similar agreement with Poland in the nearfuture. These agreements should enable the Irishauthorities to repatriate numerous asylum seekersfrom Romania and Poland whose claims have beendismissed by the courts; these include several hun-dred Gypsies who declared that they had sufferedpersecution and discrimination in Poland.
After signing agreements of readmission withFinland and Ireland, respectively in 1999 and 2000,the only Member states of the European Union not tohave concluded this type of agreement with Romaniaare the United Kingdom and Portugal. The Britishauthorities are presently considering a draft agree-ment. Moreover, a readmission agreement betweenRomania and Bulgaria was signed on 23 July 2000.Discussions are taking place with the authorities ofAfghanistan, Albania, Bangladesh, China, Estonia,Macedonia, Mexico and Sri Lanka. Agreements con-cerning seasonal workers, the exchange of qualifiedworkers, trainees and training contracts have beenconcluded in July and August 2000, with Switzerlandand Germany respectively.
For almost 40 years, the “Scandinavian pass-port” has guaranteed a total freedom of movementwithin the borders that constitute the five Scandina-vian countries. Nevertheless, it follows that freedomof movement between these countries could not becontinually assured if, irrespective of whether or notthey are members of the European Union, they didnot establish regulations compatible with theSchengen Agreement. Following ratification inMay 1999 of the Treaty of Amsterdam, Norway andIceland signed co-operation agreements with mem-ber States of the Schengen area. These agreementscame into force in Norway on 25 March 2001.
In Switzerland, a bilateral agreement on the cir-culation of individuals concluded with the European
Union was accepted by referendum in May 2000, atthe same time as the other bilateral agreements thathad been negotiated, and which could come intoforce in 2001. Transitory periods have been fixed asfar as access to the labour market is concerned.
Poland is pursuing with the institutions of theEuropean Union and member States pre-membershipnegotiations relating to Polish people’s access to theEuropean labour market, and adaptation of its legisla-tion to meet European standards. Romania has beenreceiving financial aid under the European UnionPHARE Programme since autumn 2000; this will enableit to strengthen frontier controls and adopt a passportsystem that is compatible with the Schengen criteria.
In November 2000, the European Commissionapproved two reports relating to immigration andasylum policy. The Commission believes that a newapproach needs to be put in place by the EuropeanUnion, in particular to take account of Member States’economic and demographic needs. It has also sug-gested that the admission of economic migrants beinstitutionalised in order to respond quickly andeffectively to national, regional and local marketneeds in respect of both highly skilled migrants andother categories of worker. In the Commission's view,responsibility for determining labour force needsought to be devolved to each Member State giventhe difficulties in evaluating them and in fixing spe-cific ceilings at European Union level. Several typesof status might be drawn up, and the rights ofmigrants who have been admitted could be estab-lished on the basis of their length of stay. In parallelwith this new policy on the admission of economicmigrants, policies for combating illegal immigrationand the trafficking of migrants, and policies for theintegration of foreigners and the reception of asylumseekers could be pursued and contained in provi-sions applying across the whole of the EuropeanUnion. Finally, a number of regulations are being pre-pared concerning the future status of workers fromthird countries residing in regular situation since sev-eral years in the European Union (see Box 9).
Mexico is implementing regional co-operationand consultation mechanisms, particularly as regardsthe re-admission of Mexican migrants, under both thePuebla Process and bilateral agreements with theUnited States. Proposals relating to authorised migra-tion on a permanent basis and to the enlargement ofprogrammes concerning temporary workers, bordersecurity and the regularisation of undocumentedMexicans in the United States are the subjects of cur-rent negotiations between the two countries.
© OECD 2001
Trends in International Migration
86
Box I.9. Future status of workers from third countries in the European Union1
The status of workers from third countries in the European Union (EU) was long a secondary issue for theCommunity’s authorities. Unlike nationals of EU Member countries, who enjoy rights laid down in the 1957 Treatyof Rome, particularly the part dealing with citizenship (equal treatment with nationals in host countries, freedomof movement), nationals of third countries are placed on a variety of footings. But moves to harmonise their statusand extend their rights have emerged over recent years, and particularly since the Tampere European Council on15-16 October 1999.
The European Union currently has over 12 million residents who are nationals of third countries. A number ofstatutory arrangements apply concurrently. Some of these residents have a privileged status, while others aresubject to the ordinary law of individual countries.
The first category enjoys some of the rights reserved for European citizens. Nationals of Iceland, Liechtensteinand Norway, countries which form part of the European Economic Area (EEA), are entitled to equal treatment withEU nationals and to freedom of movement within the European Union. Family members who are not EU nationalsmay settle in another country on family reunion grounds, following the working family member as he or shemoves. The provisions which apply to citizens of countries with association or co-operation agreements with theEU afford varying degrees of protection. Turkish nationals, for example, have status as defined by the Agreementof 12 September 1963 with Turkey and under the jurisprudence of the Court of Justice of the European Communi-ties (CJCE) they enjoy a number of the rights of Community nationals.2 In particular, free movement applies tothem. Under the association agreements with Tunisia and Morocco,3 workers from those two countries do notenjoy free movement but the conditions applying to their employment, remuneration, dismissal and social secu-rity arrangements are the same as for nationals. The agreements with the CEECs and the ACP countries do notprovide for equality of treatment or free movement.
Non-EU nationals may also enjoy some Community provisions applying to EU nationals in the social sphere,notably those relating to gender equality, health and safety. They also come under the principle of equal treat-ment without distinction of race or ethnic origin, embodied in Directive 2000/43/EC of 29 June 2000. With regard tofreedom of movement, they are entitled to move in the framework of intra-EU service provision, if they are independent employment. Apart from these specific cases, workers from non-EU countries are subject to the ordi-nary law of their host country.
At the same time, moves are being made to harmonise rules across the European Union and to extend therights of non-EU nationals. There are humanitarian reasons for this, but legal ones as well (since the 1997 AmsterdamTreaty, Community law makes an explicit reference to fundamental human rights). From this standpoint, theCharter of Fundamental Rights signed in Nice in December 2000 devotes two clauses to non-EU nationals withlong-stay residence or work permits and proposes eventually to accord them equal treatment with nationals andfreedom of movement.
A number of regulations are being prepared, which will adjust rights in terms of length of residence. Under theDirective presented by the Commission on 1 December 1999, the right to family reunion would be aligned with therules applying to EU citizens. Two proposed Directives concern freedom to provide services for non-EU nationals.The first, presented on 27 January 1999, concerns service provision by the self-employed. People in this categorywould receive an EC service provision card which exempts the holder from visa and permit requirements in otherEU countries. Secondment of employees for service provision may also lead to a similar card being issued.
The most significant initiative without doubt concerns long-stay residents. They would have to meet two con-ditions, if they were not born in an EU country. They would need to show stable resources, and health insurance.Under the proposed Directive presented in early 2001, meeting those conditions would be sufficient for an EClong-stay residence permit, valid for ten years and renewable. Such status would ensure equal treatment withnationals of the host country, notably with regard to access to employment, conditions of employment, social pro-tection, social and tax benefits, and recognition of qualifications. People holding such permits would be able tostay in other EU countries for a period of over three months, if they were carrying out economic activity as adependent or self-employed worker or following training, or could show adequate resources. In the host country,these non-EU nationals would enjoy equal treatment as in the country of issue, except with regard to social assis-tance and student grants.
1. This box has been prepared by Frédéric Baron, Maître de conférences (Université de Paris-IX-Dauphine).2. V.E. Tezcan: Le droit du travail et de séjour des travailleurs turcs dans l’Union européenne à la lumière des arrêts récents de la Cour de Justice des
Communautés européennes, Rev. Marché commun, February 2001, p. 117 (French only).3. The agreements concluded in 1976 between the European Community and Tunisia, Algeria and Morocco respectively were
replaced by association agreements signed in 1995; they came into force in March 1998 (Tunisia) and March 2000 (Morocco).
© OECD 2001
Main Trends in International Migration
© OEC
1. Thof
2. Thof
3. ReSymo19
4. FoCe
87
NOTES
is subsection has been drafted with the co-operationJohn Simpson, Consultant to the OECD Secretariat.
is subsection has been drafted with the co-operationMarin Sirakov, Consultant to the OECD Secretariat.
port by the Romeurope network, presented at themposium Roms, Sintés, Kalés – Tsiganes en Europe: Pro-uvoir la santé et les droits d’une minorité en détresse ,-20 October 2000, Paris.
unded in 1992 by the Visegrad countries, thentral European Free Trade Agreement comprised,
at the middle of 1999 , the founding Members(Hungary, Poland, the Czech Republic and theSlovak Republic) joined by Bulgaria, Romania andSlovenia.
5. For further information, see Migration Policies and EUEnlargement. The case of Central and Eastern Europe, Paris,OECD, 2001 (English only).
6. Section D has been drafted with the co-operation ofLucile Barros, Consultant to the OECD Secretariat.
D 2001
Trends in International Migration
Cur-
aris.
tional
Ageing
Earlyol. 26,
Chal-
88
BIBLIOGRAPHY
Borjas, G., 1996, “The Earnings of Mexican Immigrants in the UnitedStates”, Journal of Development Economics, Vol. 56, pp. 69-98.
Borjas, G.J., 1999, “The Economic Analysis of Immigration”, O. Ashenfelterand D. Card (dir. pub.), Handbook of Labour Economics,Vol. 3A, North Holland.
Chiswick, B., 1978, “The effects of Americanization on Earnings of foreign-born Men”, Journal of Political Economy, Vol. 4, No. 2.
Cobb-Clark, D.A., 2000, “Do Selection Criteria Make a Difference? Visa Cate-gory and the Labour Market Status of Immigrants toAustralia” , Economic Record, Vol. 76, No. 232.
European Commission, 2001, Employment in Europe 2001. Recent Trends and Prospects.
Glover, S., Gott, C., Loizillon, A., Portes, J., Price, R., Spencer, S.,Srinivasan, V. and Willis, S.C., 2001, Migration and Economic and Social Analysis, Home Office,RDS Occasional Paper No. 67.
Husted, L., Skyt Nielsen, H., Rosholm, M. and Smith, N., 2000, Employment and Wage Assimilation of Male First GenerationImmigrants in Denmark, IZA, Discussion Paper No. 101.
Johannson, H. and Weiler, S., 2001, Immigration and Wage Inequality: Panel Evidence fromrent Population Survey, Miméo.
OECD, 2001a, OECD Economic Outlook, No. 69, Paris.
OECD 2001b, OECD Employment Outlook, Paris.
OECD 2000, Combating the Illegal Employment of Foreign Workers, P
OECD, 1998, Maintaining Prosperity in an Ageing Society, Paris.
Richardson, S., Robertson, F. and Ilsley, D., 2001, The Labour Force Experience of New Migrants, NaInstitute for Labour Studies, Australia.
United Nations, 2000, Replacement Migration: Is it a Solution to Declining and Populations?
Vandenheuvel. A. and Wooden, M., 2000, “Immigrants’ Labour Market Experiences in theSettlement Years”, Australian Bulletin of Labour, VNo. 1.
Visco, I., 2001, “Ageing Populations: The Economic Issues and Policylenges”, OECD.
© OECD 2001