Embed Size (px)
Citation preview
Trends in Housing Costs: 1985 -
2005 and the 30-Percent-of-Income Standard
U.S. Department of Housing and Urban DevelopmentOffice of Policy Development and Research

Visit PD&R’s Web Site www.huduser.org to find this report and others sponsored by HUD’s Office of Policy Development and Research (PD&R). Other services of HUD USER, PD&R’s Research Information Service, include listservs; special interest reports, bimonthly publications (best practices, significant studies from other sources); access to public use databases; hotline 1-800-245-2691 for help accessing the information you need.
Trends in Housing Costs: 1985-2005 and the
30-Percent-of-Income Standard
Prepared for: U.S. Department of Housing and Urban Development
Office of Policy Development and Research
Principal Authors: Frederick J. Eggers
Fouad Moumen
June 2008
The contents of this report are the views of the contractor and do not necessarily reflect the views or policies of the U.S. Department of Housing and Urban Development or the U.S. Government.
Table of Contents
Section A: Overview........................................................................................1
PART 1: Trends in Housing Costs Relative to Income ....................................2
Section B: Data and Methodology .................................................................2 Section C: Costs for Owners with Mortgages ..............................................5 Section D: Costs for Owners without Mortgages ......................................13 Section E: Costs for Renters........................................................................20 Section F: Additional Analysis and Part I Summary ..................................27
PART 2: Adequacy of the 30-Percent-of-Income Standard ...........................29
Section G: Background on the 30-Percent Standard .................................29 Section H: Continued Adequacy of the 30-Percent Standard ...................31 Section I: Looking for an Alternative Test ................................................37
ii
Trends in Housing Costs: 1985-2005 and the 30-Percent-of-Income Standard
Section A: Overview
The Department of Housing and Urban Development (HUD) funds the Census Bureau to conduct the American Housing Survey (AHS)—a biennial record of the quality, use, and condition of the nation’s housing stock. Separate AHS surveys provide periodic examinations of the housing stock in selected large metropolitan areas. In 2007, HUD contracted with Econometrica, Inc. and ICF International to support the production and use of the AHS. As part of that contract, HUD commissioned this study of trends in housing costs and the adequacy of the 30-percent-of-income standard.
Shelter costs have been increasing faster than the costs of other items. According to the Bureau of Labor Statistics’ Consumer Price Index (CPI), the costs of equivalent levels of shelter increased by 104 percent from 1985 to 2005 compared to a 74-percent increase in the cost of all other items.1 At the same time, Americans continued to make housing a key component of their consumption and investment decisions as demonstrated by an increase in the average size of housing units and a higher percentage of households who
2are owners. As a result of these trends, median monthly housing costs, which include utility costs, have increased by128 percent, from $348 in 1985 to $793 in 2005. The proportion of income spent on housing by the median family increased from 19 to 22 percent over the same period.3
Shelter is considered a minimal human need, along with food and other basic consumer items. For this reason, public policy has focused on the ability of families both to acquire safe and sanitary housing in decent neighborhoods and to have sufficient income left over to purchase other essential goods and services. Over time, policy analysts have come to use “30 percent” as a standard to assess the affordability of housing. The belief is that households who have to pay more than 30 percent of their incomes for housing may be forced to forego other important needs.
In this study, HUD asked Econometrica, Inc. to look at two issues related to housing costs:
• What factors account for the changes in housing costs relative to income from 1985 to 2005?
• Is 30 percent still an appropriate standard for assessing the affordability ofhousing?
1 In the CPI, shelter costs include a weighted mix of rent, the rental equivalent costs of owner-occupiedhousing, expenditures on lodging away from home, and payments for tenant and homeowner insurance.“Shelter” does not include utility payments. 2 See 32 Years of Housing Data by Frederick J. Eggers and Alexander Thackeray athttp://www.huduser.org/intercept.asp?loc=/datasets/ahs/AHS_taskC.pdf. 3 The data on monthly housing costs and the ratio of monthly housing costs to income are from published reports of the 1985 and 2005 American Housing Surveys.
1
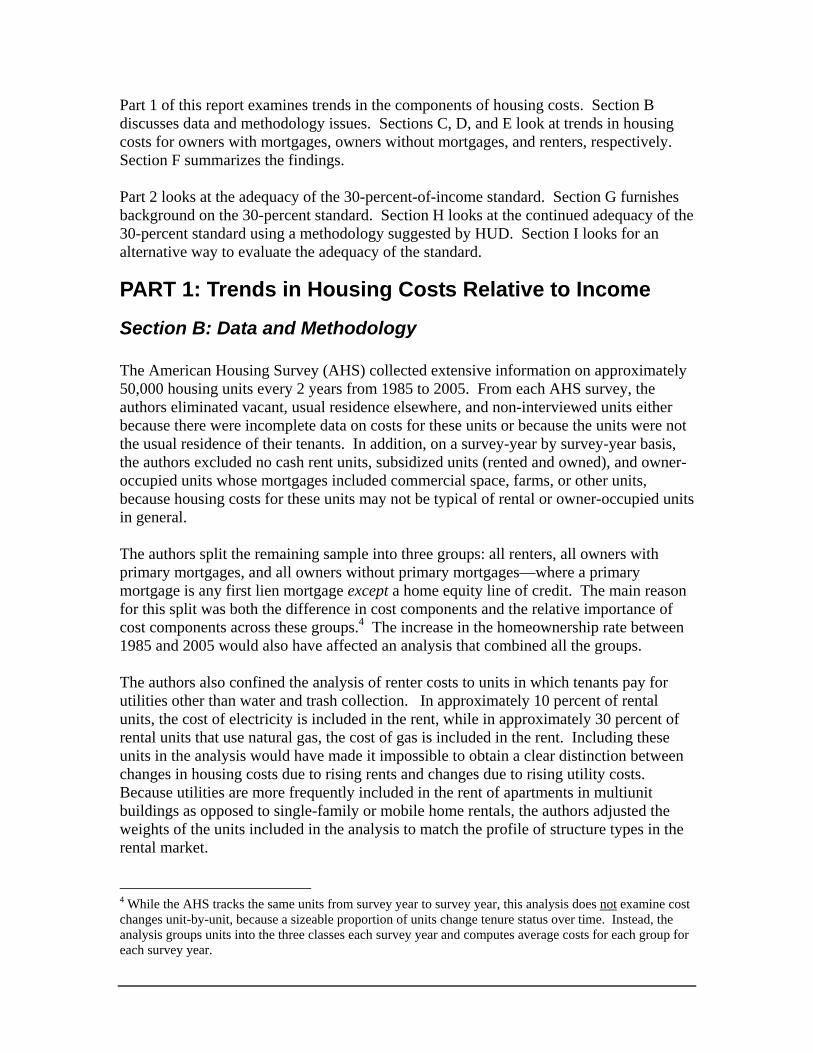
Part 1 of this report examines trends in the components of housing costs. Section B discusses data and methodology issues. Sections C, D, and E look at trends in housing costs for owners with mortgages, owners without mortgages, and renters, respectively. Section F summarizes the findings.
Part 2 looks at the adequacy of the 30-percent-of-income standard. Section G furnishes background on the 30-percent standard. Section H looks at the continued adequacy of the 30-percent standard using a methodology suggested by HUD. Section I looks for an alternative way to evaluate the adequacy of the standard.
PART 1: Trends in Housing Costs Relative to Income
Section B: Data and Methodology
The American Housing Survey (AHS) collected extensive information on approximately 50,000 housing units every 2 years from 1985 to 2005. From each AHS survey, the authors eliminated vacant, usual residence elsewhere, and non-interviewed units either because there were incomplete data on costs for these units or because the units were not the usual residence of their tenants. In addition, on a survey-year by survey-year basis, the authors excluded no cash rent units, subsidized units (rented and owned), and owner-occupied units whose mortgages included commercial space, farms, or other units, because housing costs for these units may not be typical of rental or owner-occupied units in general.
The authors split the remaining sample into three groups: all renters, all owners with primary mortgages, and all owners without primary mortgages—where a primary mortgage is any first lien mortgage except a home equity line of credit. The main reason for this split was both the difference in cost components and the relative importance of cost components across these groups.4 The increase in the homeownership rate between 1985 and 2005 would also have affected an analysis that combined all the groups.
The authors also confined the analysis of renter costs to units in which tenants pay for utilities other than water and trash collection. In approximately 10 percent of rental units, the cost of electricity is included in the rent, while in approximately 30 percent of rental units that use natural gas, the cost of gas is included in the rent. Including these units in the analysis would have made it impossible to obtain a clear distinction between changes in housing costs due to rising rents and changes due to rising utility costs. Because utilities are more frequently included in the rent of apartments in multiunit buildings as opposed to single-family or mobile home rentals, the authors adjusted the weights of the units included in the analysis to match the profile of structure types in the rental market.
4 While the AHS tracks the same units from survey year to survey year, this analysis does not examine cost changes unit-by-unit, because a sizeable proportion of units change tenure status over time. Instead, the analysis groups units into the three classes each survey year and computes average costs for each group for each survey year.
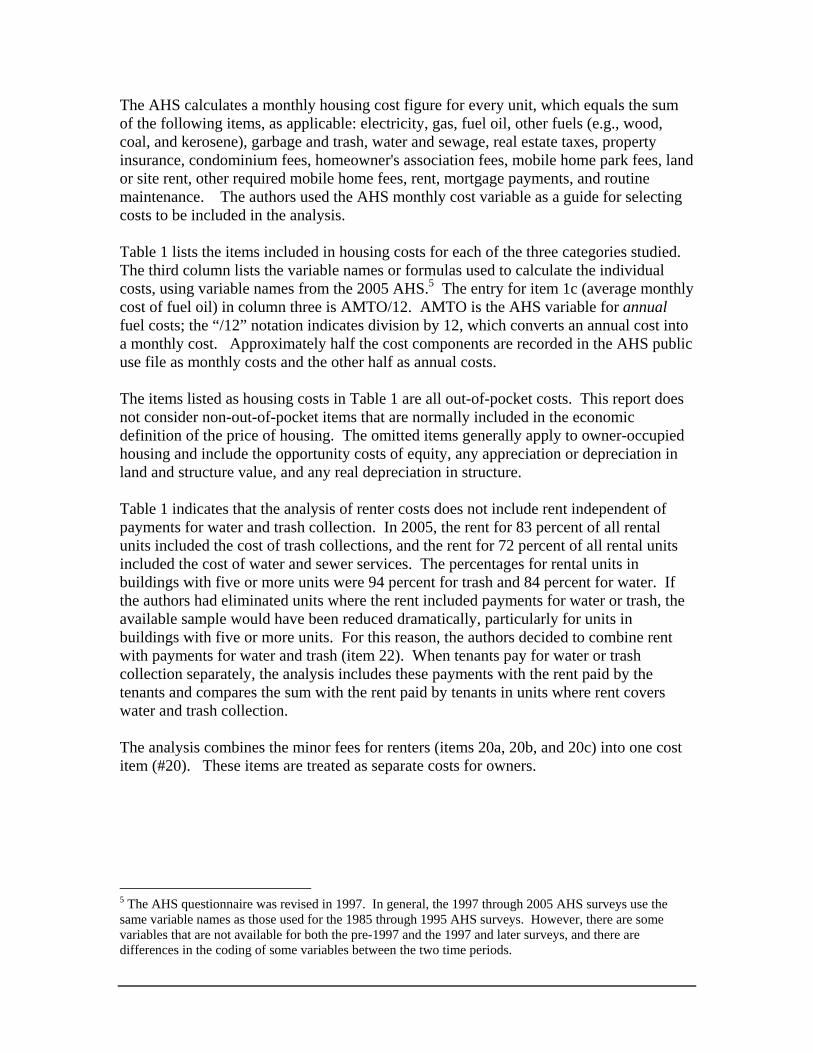
The AHS calculates a monthly housing cost figure for every unit, which equals the sum of the following items, as applicable: electricity, gas, fuel oil, other fuels (e.g., wood, coal, and kerosene), garbage and trash, water and sewage, real estate taxes, property insurance, condominium fees, homeowner's association fees, mobile home park fees, land or site rent, other required mobile home fees, rent, mortgage payments, and routine maintenance. The authors used the AHS monthly cost variable as a guide for selecting costs to be included in the analysis.
Table 1 lists the items included in housing costs for each of the three categories studied. The third column lists the variable names or formulas used to calculate the individual costs, using variable names from the 2005 AHS.5 The entry for item 1c (average monthly cost of fuel oil) in column three is AMTO/12. AMTO is the AHS variable for annual fuel costs; the “/12” notation indicates division by 12, which converts an annual cost into a monthly cost. Approximately half the cost components are recorded in the AHS public use file as monthly costs and the other half as annual costs.
The items listed as housing costs in Table 1 are all out-of-pocket costs. This report does not consider non-out-of-pocket items that are normally included in the economic definition of the price of housing. The omitted items generally apply to owner-occupied housing and include the opportunity costs of equity, any appreciation or depreciation in land and structure value, and any real depreciation in structure.
Table 1 indicates that the analysis of renter costs does not include rent independent of payments for water and trash collection. In 2005, the rent for 83 percent of all rental units included the cost of trash collections, and the rent for 72 percent of all rental units included the cost of water and sewer services. The percentages for rental units in buildings with five or more units were 94 percent for trash and 84 percent for water. If the authors had eliminated units where the rent included payments for water or trash, the available sample would have been reduced dramatically, particularly for units in buildings with five or more units. For this reason, the authors decided to combine rent with payments for water and trash (item 22). When tenants pay for water or trash collection separately, the analysis includes these payments with the rent paid by the tenants and compares the sum with the rent paid by tenants in units where rent covers water and trash collection.
The analysis combines the minor fees for renters (items 20a, 20b, and 20c) into one cost item (#20). These items are treated as separate costs for owners.
5 The AHS questionnaire was revised in 1997. In general, the 1997 through 2005 AHS surveys use the same variable names as those used for the 1985 through 1995 AHS surveys. However, there are some variables that are not available for both the pre-1997 and the 1997 and later surveys, and there are differences in the coding of some variables between the two time periods.
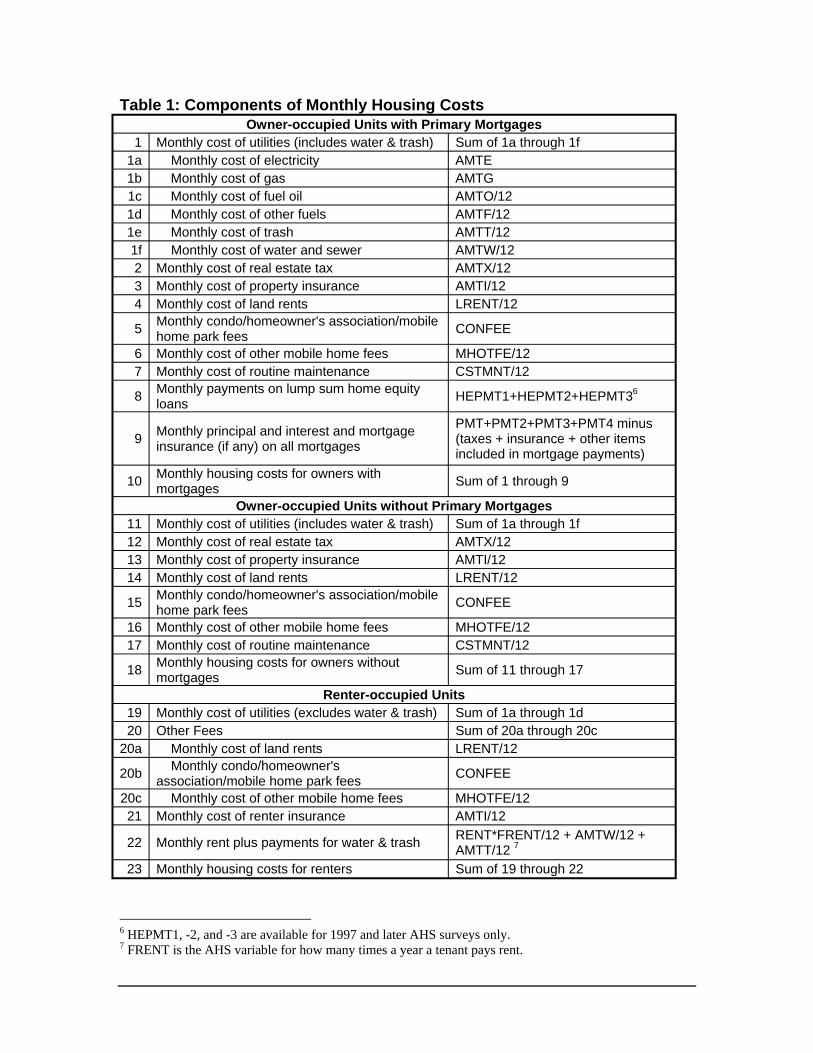
Table 1: Components of Monthly Housing Costs Owner-occupied Units with Primary Mortgages
1 Monthly cost of utilities (includes water & trash) Sum of 1a through 1f 1a Monthly cost of electricity AMTE 1b Monthly cost of gas AMTG 1c Monthly cost of fuel oil AMTO/12 1d Monthly cost of other fuels AMTF/12 1e Monthly cost of trash AMTT/12 1f Monthly cost of water and sewer AMTW/12 2 Monthly cost of real estate tax AMTX/12 3 Monthly cost of property insurance AMTI/12 4 Monthly cost of land rents LRENT/12
5 Monthly condo/homeowner's association/mobile home park fees CONFEE
6 Monthly cost of other mobile home fees MHOTFE/12 7 Monthly cost of routine maintenance CSTMNT/12
8 Monthly payments on lump sum home equity loans HEPMT1+HEPMT2+HEPMT36
9 Monthly principal and interest and mortgage insurance (if any) on all mortgages
PMT+PMT2+PMT3+PMT4 minus (taxes + insurance + other items included in mortgage payments)
10 Monthly housing costs for owners with mortgages Sum of 1 through 9
Owner-occupied Units without Primary Mortgages 11 Monthly cost of utilities (includes water & trash) Sum of 1a through 1f 12 Monthly cost of real estate tax AMTX/12 13 Monthly cost of property insurance AMTI/12 14 Monthly cost of land rents LRENT/12
15 Monthly condo/homeowner's association/mobile home park fees CONFEE
16 Monthly cost of other mobile home fees MHOTFE/12 17 Monthly cost of routine maintenance CSTMNT/12
18 Monthly housing costs for owners without mortgages Sum of 11 through 17
Renter-occupied Units 19 Monthly cost of utilities (excludes water & trash) Sum of 1a through 1d 20 Other Fees Sum of 20a through 20c
20a Monthly cost of land rents LRENT/12
20b Monthly condo/homeowner's association/mobile home park fees CONFEE
20c Monthly cost of other mobile home fees MHOTFE/12 21 Monthly cost of renter insurance AMTI/12
22 Monthly rent plus payments for water & trash RENT*FRENT/12 + AMTW/12 + AMTT/12 7
23 Monthly housing costs for renters Sum of 19 through 22
6 HEPMT1, -2, and -3 are available for 1997 and later AHS surveys only. 7 FRENT is the AHS variable for how many times a year a tenant pays rent.
Almost all units incurred costs—either directly or in rent or in homeowner or condominium fees—for electricity, water, and trash collection; and most owner-occupied units paid real estate taxes and premiums on property insurance. Many of the other costs are relevant to only a small portion of the properties examined; these include land costs, mobile fees, and certain fuel costs. The authors confronted the question of whether to average these infrequent costs over all units in their class or only over the units in their class that incurred the costs. Because this report analyzes trends in average housing costs and not trends in the costs of the separate components, it seemed more appropriate to average the costs over all units in the appropriate class, regardless of whether units incurred the costs.
Section C: Costs for Owners with Mortgages
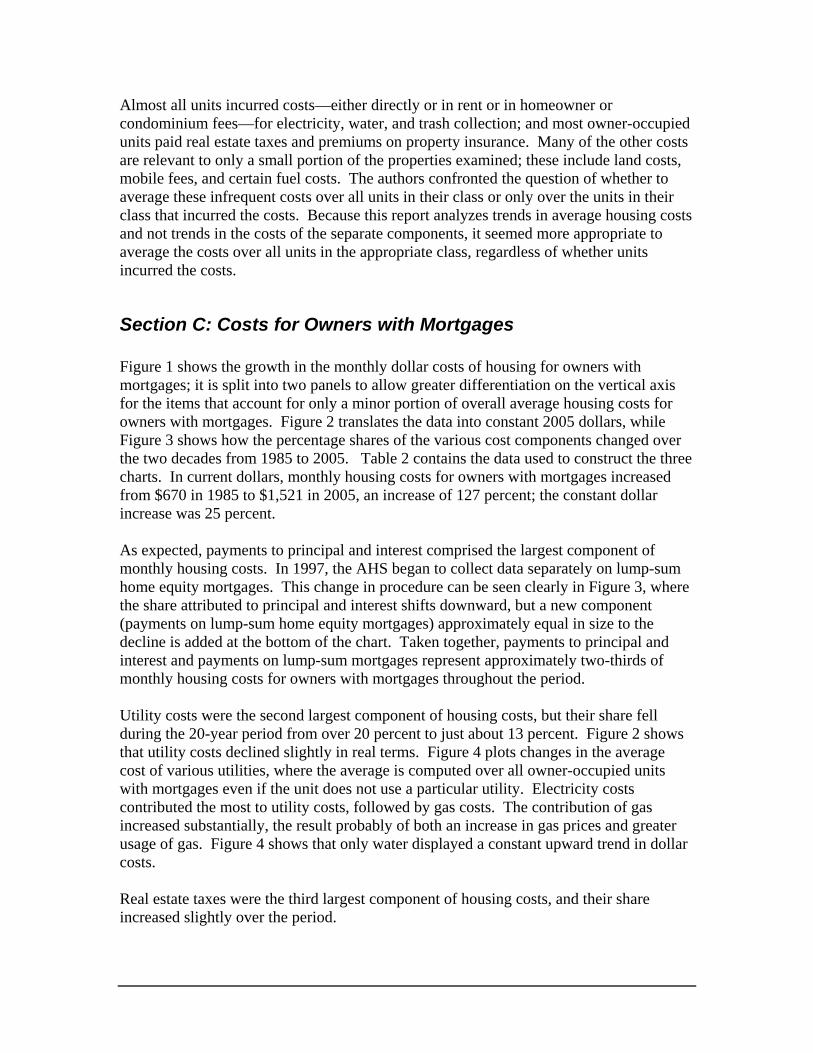
Figure 1 shows the growth in the monthly dollar costs of housing for owners with mortgages; it is split into two panels to allow greater differentiation on the vertical axis for the items that account for only a minor portion of overall average housing costs for owners with mortgages. Figure 2 translates the data into constant 2005 dollars, while Figure 3 shows how the percentage shares of the various cost components changed over the two decades from 1985 to 2005. Table 2 contains the data used to construct the three charts. In current dollars, monthly housing costs for owners with mortgages increased from $670 in 1985 to $1,521 in 2005, an increase of 127 percent; the constant dollar increase was 25 percent.
As expected, payments to principal and interest comprised the largest component of monthly housing costs. In 1997, the AHS began to collect data separately on lump-sum home equity mortgages. This change in procedure can be seen clearly in Figure 3, where the share attributed to principal and interest shifts downward, but a new component (payments on lump-sum home equity mortgages) approximately equal in size to the decline is added at the bottom of the chart. Taken together, payments to principal and interest and payments on lump-sum mortgages represent approximately two-thirds of monthly housing costs for owners with mortgages throughout the period.
Utility costs were the second largest component of housing costs, but their share fell during the 20-year period from over 20 percent to just about 13 percent. Figure 2 shows that utility costs declined slightly in real terms. Figure 4 plots changes in the average cost of various utilities, where the average is computed over all owner-occupied units with mortgages even if the unit does not use a particular utility. Electricity costs contributed the most to utility costs, followed by gas costs. The contribution of gas increased substantially, the result probably of both an increase in gas prices and greater usage of gas. Figure 4 shows that only water displayed a constant upward trend in dollar costs.
Real estate taxes were the third largest component of housing costs, and their share increased slightly over the period.
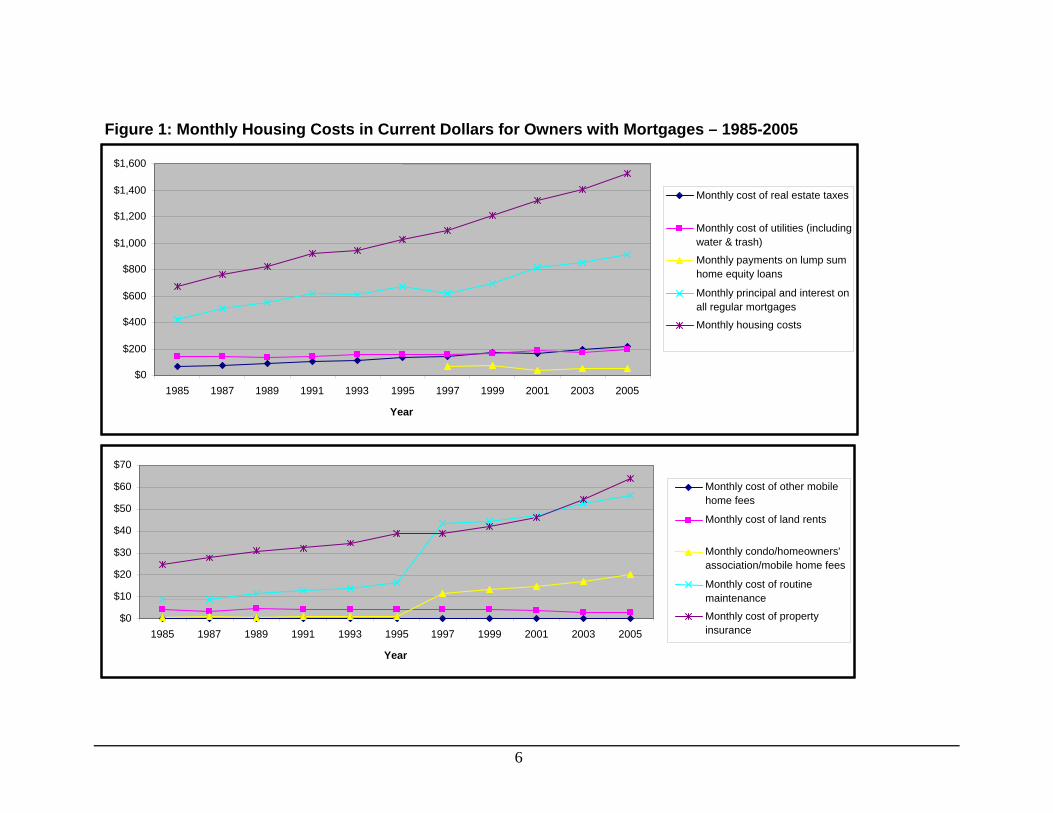
Figure 1: Monthly Housing Costs in Current Dollars for Owners with Mortgages – 1985-2005
$0
$200
$400
$600
$800
$1,000
$1,200
$1,400
$1,600
including
Monthly cost of real estate taxes
Monthly cost of utilities (water & trash)
Monthly payments on lump sum home equity loans
Monthly principal and interest on all regular mortgages
Monthly housing costs
1985 1987 1989 1991 1993 1995 1997 1999 2001 2003 2005
Year
$0
$10
$20
$30
$40
$50
$60
$70
1985 1987 1989 1991 1993 1995 1997 1999 2001 2003 2005
Year
home fees
association/mobile home fees
maintenance
insurance
Monthly cost of other mobile
Monthly cost of land rents
Monthly condo/homeowners'
Monthly cost of routine
Monthly cost of property
6
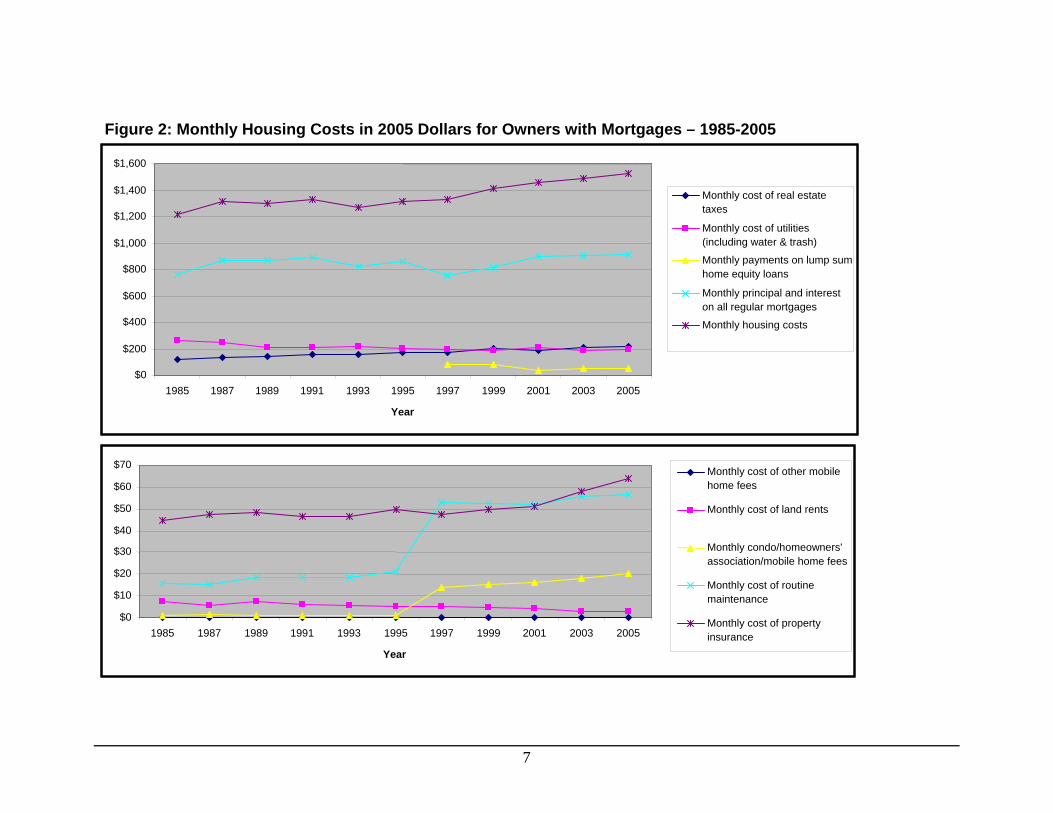
Figure 2: Monthly Housing Costs in 2005 Dollars for Owners with Mortgages – 1985-2005
$0
$200
$400
$600
$800
$1,000
$1,200
$1,400
$1,600
1985 1987 1989 1991 1993 1995 1997 1999 2001 2003 2005
Year
taxes
$0
$10
$20
$30
$40
$50
$60
$70
1985 1987 1989 1991 1993 1995 1997 1999 2001 2003 2005
Year
home fees
association/mobile home fees
maintenance
insurance
Monthly cost of real estate
Monthly cost of utilities (including water & trash)
Monthly payments on lump sum home equity loans
Monthly principal and interest on all regular mortgages
Monthly housing costs
Monthly cost of other mobile
Monthly cost of land rents
Monthly condo/homeowners'
Monthly cost of routine
Monthly cost of property
7
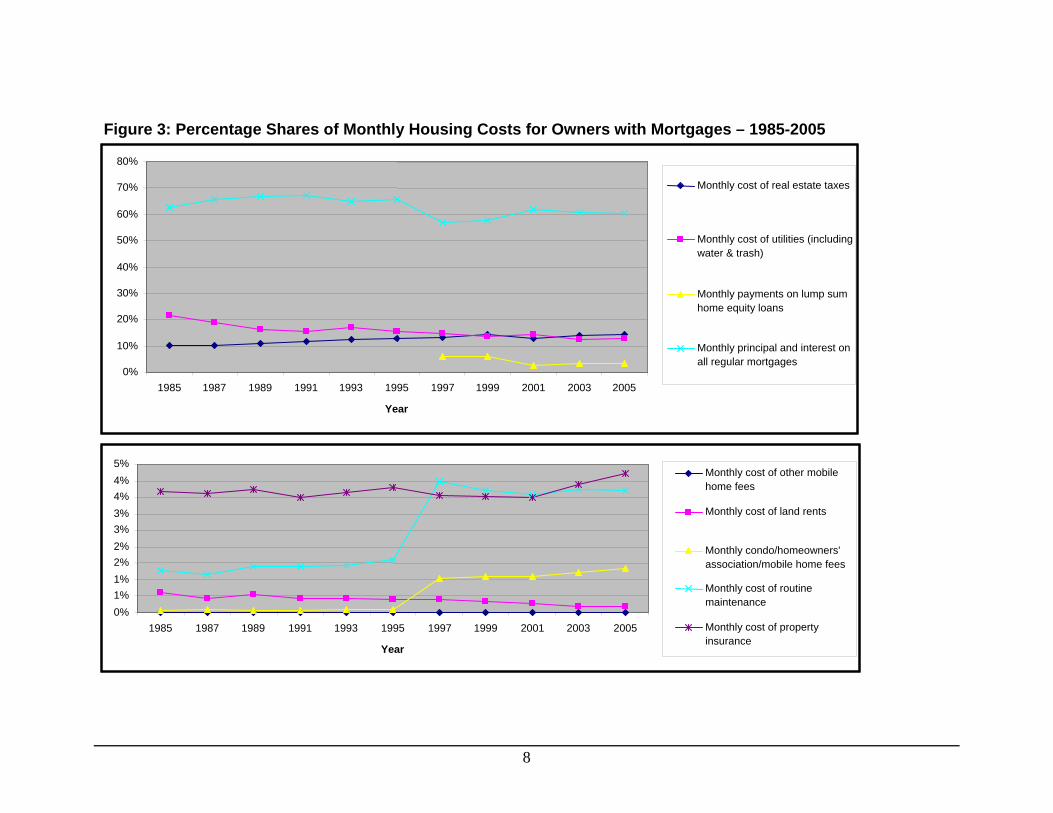
Figure 3: Percentage Shares of Monthly Housing Costs for Owners with Mortgages – 1985-2005
0%
10%
20%
30%
40%
50%
60%
70%
80%
1985 1987 1989 1991 1993 1995 1997 1999 2001 2003 2005
Year
including
0% 1% 1% 2% 2% 3% 3% 4% 4% 5%
1985 1987 1989 1991 1993 1995 1997 1999 2001 2003 2005
Year
home fees
association/mobile home fees
maintenance
insurance
Monthly cost of real estate taxes
Monthly cost of utilities (water & trash)
Monthly payments on lump sum home equity loans
Monthly principal and interest on all regular mortgages
Monthly cost of other mobile
Monthly cost of land rents
Monthly condo/homeowners'
Monthly cost of routine
Monthly cost of property
8
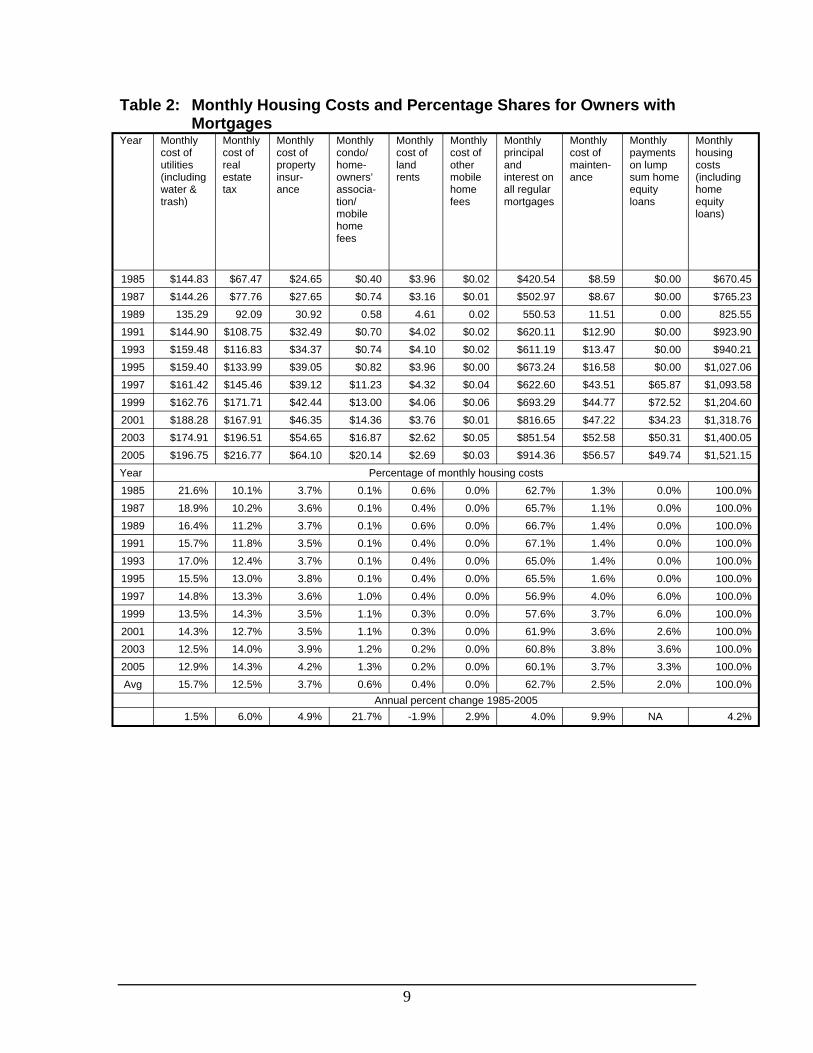
Table 2: Monthly Housing Costs and Percentage Shares for Owners with Mortgages
Year Monthly cost of utilities (including water & trash)
Monthly cost of real estate tax
Monthly cost of property insur- ance
Monthly condo/ home-owners’ association/ mobile home
Monthly cost of land rents
Monthly cost of other mobile home fees
Monthly principal and interest on all regular mortgages
Monthly cost of maintenance
Monthly payments on lump sum home equity loans
Monthly housing costs (including home equity loans)
fees
1985 $144.83 $67.47 $24.65 $0.40 $3.96 $0.02 $420.54 $8.59 $0.00 $670.45 1987 $144.26 $77.76 $27.65 $0.74 $3.16 $0.01 $502.97 $8.67 $0.00 $765.23 1989 135.29 92.09 30.92 0.58 4.61 0.02 550.53 11.51 0.00 825.55 1991 $144.90 $108.75 $32.49 $0.70 $4.02 $0.02 $620.11 $12.90 $0.00 $923.90 1993 $159.48 $116.83 $34.37 $0.74 $4.10 $0.02 $611.19 $13.47 $0.00 $940.21 1995 $159.40 $133.99 $39.05 $0.82 $3.96 $0.00 $673.24 $16.58 $0.00 $1,027.06 1997 $161.42 $145.46 $39.12 $11.23 $4.32 $0.04 $622.60 $43.51 $65.87 $1,093.58 1999 $162.76 $171.71 $42.44 $13.00 $4.06 $0.06 $693.29 $44.77 $72.52 $1,204.60 2001 $188.28 $167.91 $46.35 $14.36 $3.76 $0.01 $816.65 $47.22 $34.23 $1,318.76 2003 $174.91 $196.51 $54.65 $16.87 $2.62 $0.05 $851.54 $52.58 $50.31 $1,400.05 2005 $196.75 $216.77 $64.10 $20.14 $2.69 $0.03 $914.36 $56.57 $49.74 $1,521.15 Year Percentage of monthly housing costs 1985 21.6% 10.1% 3.7% 0.1% 0.6% 0.0% 62.7% 1.3% 0.0% 100.0% 1987 18.9% 10.2% 3.6% 0.1% 0.4% 0.0% 65.7% 1.1% 0.0% 100.0% 1989 16.4% 11.2% 3.7% 0.1% 0.6% 0.0% 66.7% 1.4% 0.0% 100.0% 1991 15.7% 11.8% 3.5% 0.1% 0.4% 0.0% 67.1% 1.4% 0.0% 100.0% 1993 17.0% 12.4% 3.7% 0.1% 0.4% 0.0% 65.0% 1.4% 0.0% 100.0% 1995 15.5% 13.0% 3.8% 0.1% 0.4% 0.0% 65.5% 1.6% 0.0% 100.0% 1997 14.8% 13.3% 3.6% 1.0% 0.4% 0.0% 56.9% 4.0% 6.0% 100.0% 1999 13.5% 14.3% 3.5% 1.1% 0.3% 0.0% 57.6% 3.7% 6.0% 100.0% 2001 14.3% 12.7% 3.5% 1.1% 0.3% 0.0% 61.9% 3.6% 2.6% 100.0% 2003 12.5% 14.0% 3.9% 1.2% 0.2% 0.0% 60.8% 3.8% 3.6% 100.0% 2005 12.9% 14.3% 4.2% 1.3% 0.2% 0.0% 60.1% 3.7% 3.3% 100.0% Avg 15.7% 12.5% 3.7% 0.6% 0.4% 0.0% 62.7% 2.5% 2.0% 100.0%
Annual percent change 1985-2005 1.5% 6.0% 4.9% 21.7% -1.9% 2.9% 4.0% 9.9% NA 4.2%
9
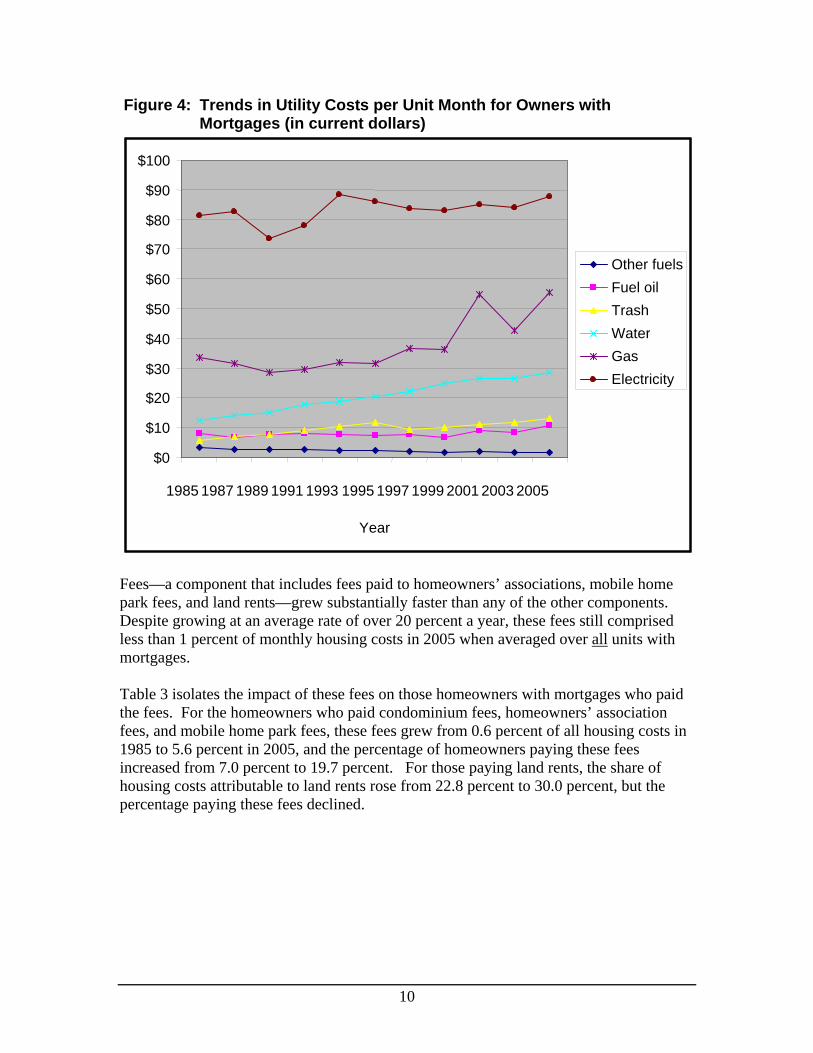
Figure 4: Trends in Utility Costs per Unit Month for Owners with Mortgages (in current dollars)
$100
$90
$80
$70
$60
$50
$40
$30
$20
$10
$0
1985 1987 1989 1991 1993 1995 1997 1999 2001 2003 2005
Other fuels Fuel oil Trash Water Gas Electricity
Year
Fees—a component that includes fees paid to homeowners’ associations, mobile home park fees, and land rents—grew substantially faster than any of the other components. Despite growing at an average rate of over 20 percent a year, these fees still comprised less than 1 percent of monthly housing costs in 2005 when averaged over all units with mortgages.
Table 3 isolates the impact of these fees on those homeowners with mortgages who paid the fees. For the homeowners who paid condominium fees, homeowners’ association fees, and mobile home park fees, these fees grew from 0.6 percent of all housing costs in 1985 to 5.6 percent in 2005, and the percentage of homeowners paying these fees increased from 7.0 percent to 19.7 percent. For those paying land rents, the share of housing costs attributable to land rents rose from 22.8 percent to 30.0 percent, but the percentage paying these fees declined.
10
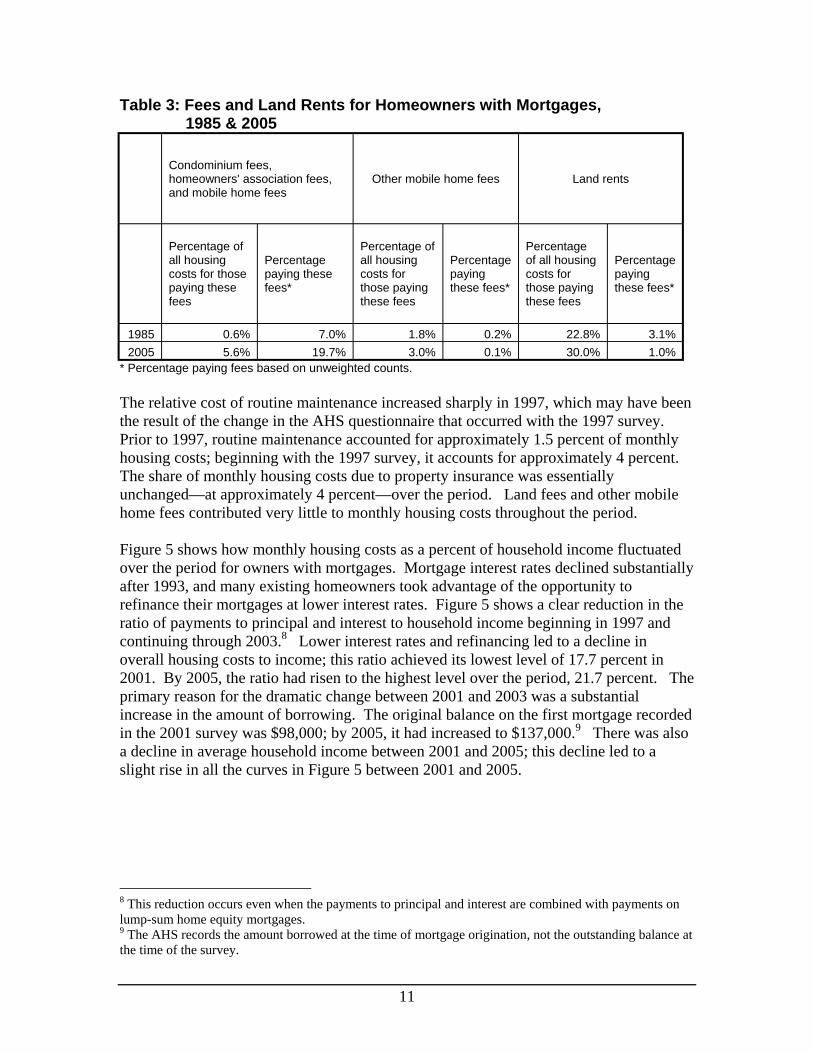
Table 3: Fees and Land Rents for Homeowners with Mortgages, 1985 & 2005
Condominium fees, homeowners' association fees, and mobile home fees
Other mobile home fees Land rents
Percentage of all housing costs for those paying these fees
Percentage paying these fees*
Percentage of all housing costs for those paying these fees
Percentage paying these fees*
Percentage of all housing costs for those paying these fees
Percentage paying these fees*
1985 0.6% 7.0% 1.8% 0.2% 22.8% 3.1% 2005 5.6% 19.7% 3.0% 0.1% 30.0% 1.0%
* Percentage paying fees based on unweighted counts.
The relative cost of routine maintenance increased sharply in 1997, which may have been the result of the change in the AHS questionnaire that occurred with the 1997 survey. Prior to 1997, routine maintenance accounted for approximately 1.5 percent of monthly housing costs; beginning with the 1997 survey, it accounts for approximately 4 percent. The share of monthly housing costs due to property insurance was essentially unchanged—at approximately 4 percent—over the period. Land fees and other mobile home fees contributed very little to monthly housing costs throughout the period.
Figure 5 shows how monthly housing costs as a percent of household income fluctuated over the period for owners with mortgages. Mortgage interest rates declined substantially after 1993, and many existing homeowners took advantage of the opportunity to refinance their mortgages at lower interest rates. Figure 5 shows a clear reduction in the ratio of payments to principal and interest to household income beginning in 1997 and continuing through 2003.8 Lower interest rates and refinancing led to a decline in overall housing costs to income; this ratio achieved its lowest level of 17.7 percent in 2001. By 2005, the ratio had risen to the highest level over the period, 21.7 percent. The primary reason for the dramatic change between 2001 and 2003 was a substantial increase in the amount of borrowing. The original balance on the first mortgage recorded in the 2001 survey was $98,000; by 2005, it had increased to $137,000.9 There was also a decline in average household income between 2001 and 2005; this decline led to a slight rise in all the curves in Figure 5 between 2001 and 2005.
8 This reduction occurs even when the payments to principal and interest are combined with payments on lump-sum home equity mortgages. 9 The AHS records the amount borrowed at the time of mortgage origination, not the outstanding balance at the time of the survey.
11
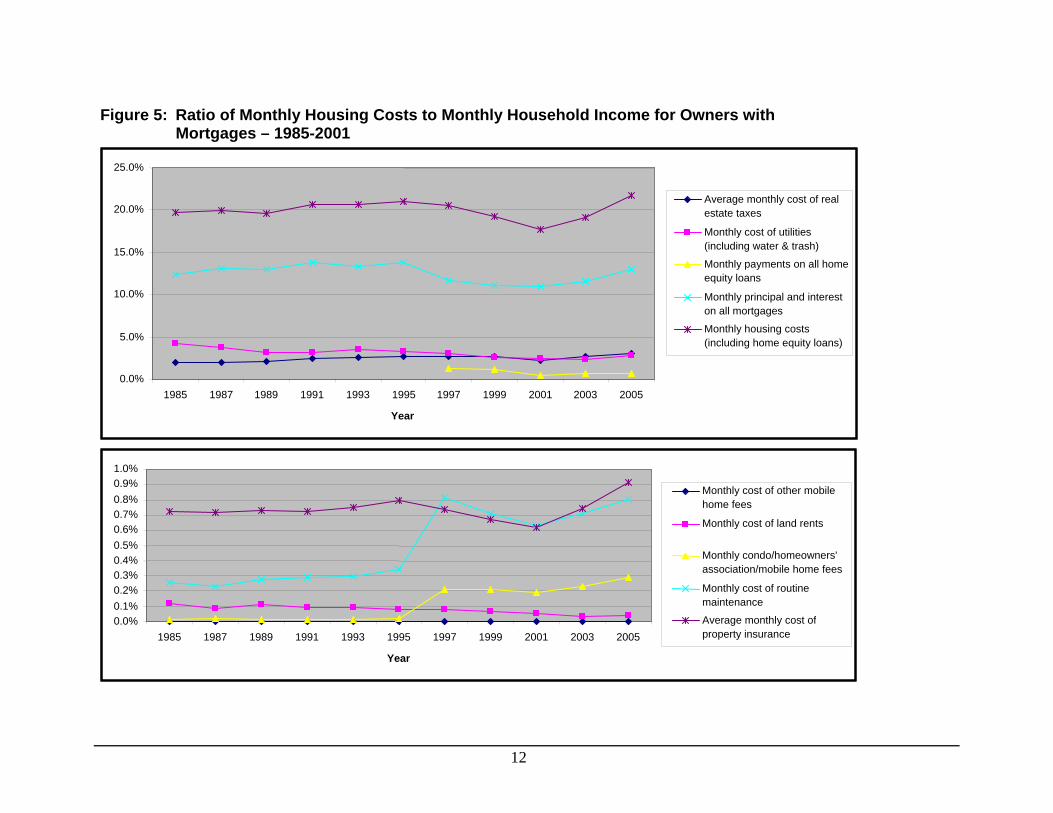
Figure 5: Ratio of Monthly Housing Costs to Monthly Household Income for Owners withMortgages – 1985-2001
0.0%
5.0%
10.0%
15.0%
20.0%
25.0%
1985 1987 1989 1991 1993 1995 1997 1999 2001 2003 2005
Year
Aestate taxes
on all mortgages
0.0% 0.1% 0.2% 0.3% 0.4% 0.5% 0.6% 0.7% 0.8% 0.9% 1.0%
1985 1987 1989 1991 1993 1995 1997 1999 2001 2003 2005
Year
home fees
association/mobile home fees
maintenance
A f
verage monthly cost of real
Monthly cost of utilities (including water & trash)
Monthly payments on all home equity loans
Monthly principal and interest
Monthly housing costs (including home equity loans)
Monthly cost of other mobile
Monthly cost of land rents
Monthly condo/homeowners'
Monthly cost of routine
verage monthly cost oproperty insurance
12
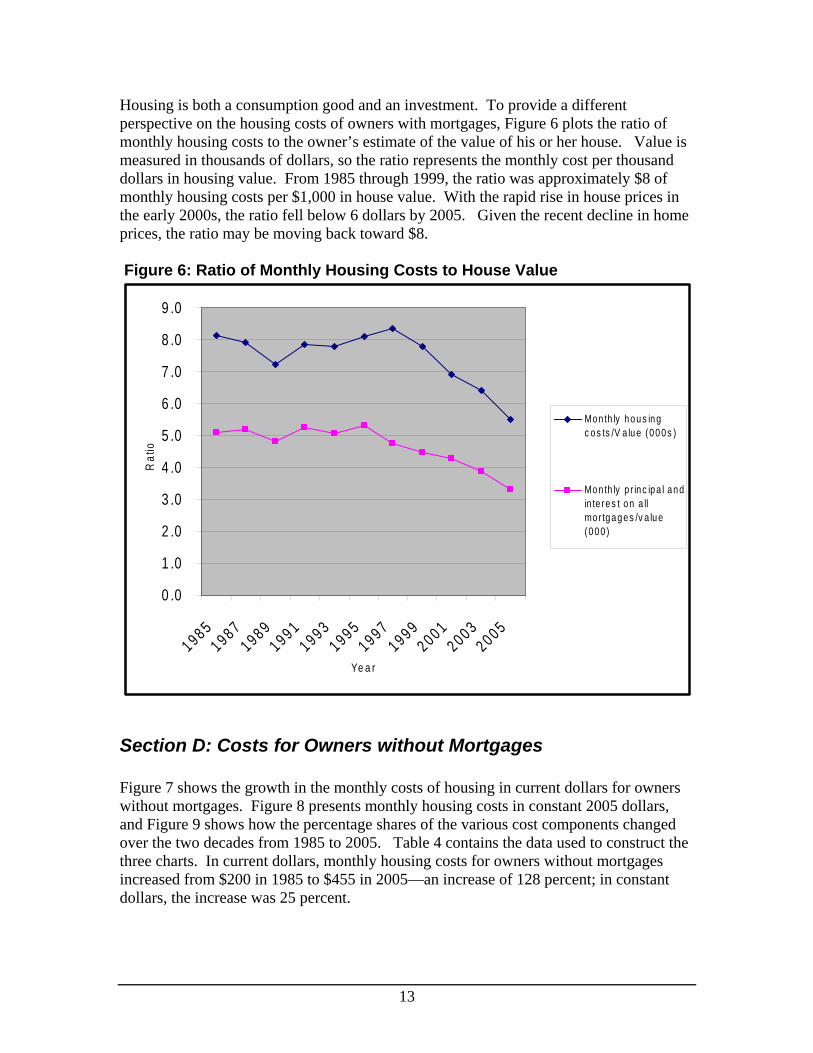
Housing is both a consumption good and an investment. To provide a different perspective on the housing costs of owners with mortgages, Figure 6 plots the ratio of monthly housing costs to the owner’s estimate of the value of his or her house. Value is measured in thousands of dollars, so the ratio represents the monthly cost per thousand dollars in housing value. From 1985 through 1999, the ratio was approximately $8 of monthly housing costs per $1,000 in house value. With the rapid rise in house prices in the early 2000s, the ratio fell below 6 dollars by 2005. Given the recent decline in home prices, the ratio may be moving back toward $8.
Figure 6: Ratio of Monthly Housing Costs to House Value
Rat
io
9 .0
8 .0
7 .0
6 .0
5 .0
4 .0
3 .0
2 .0
1 .0
0 .0
7 9 7 9 585 8 9 9 0120 08 91
19 95 9 9919 1 1 19 9319 9 21 1 20 03 0
Ye a r
Section D: Costs for Owners without Mortgages
Figure 7 shows the growth in the monthly costs of housing in current dollars for owners without mortgages. Figure 8 presents monthly housing costs in constant 2005 dollars, and Figure 9 shows how the percentage shares of the various cost components changed over the two decades from 1985 to 2005. Table 4 contains the data used to construct the three charts. In current dollars, monthly housing costs for owners without mortgages increased from $200 in 1985 to $455 in 2005—an increase of 128 percent; in constant dollars, the increase was 25 percent.
i/ l )
i ii l
/( 000 )
Mon th ly hous ng c os ts V a ue (000s
Mon th ly p r nc pa l and n te res t on a lmo r tgages v a lue
13
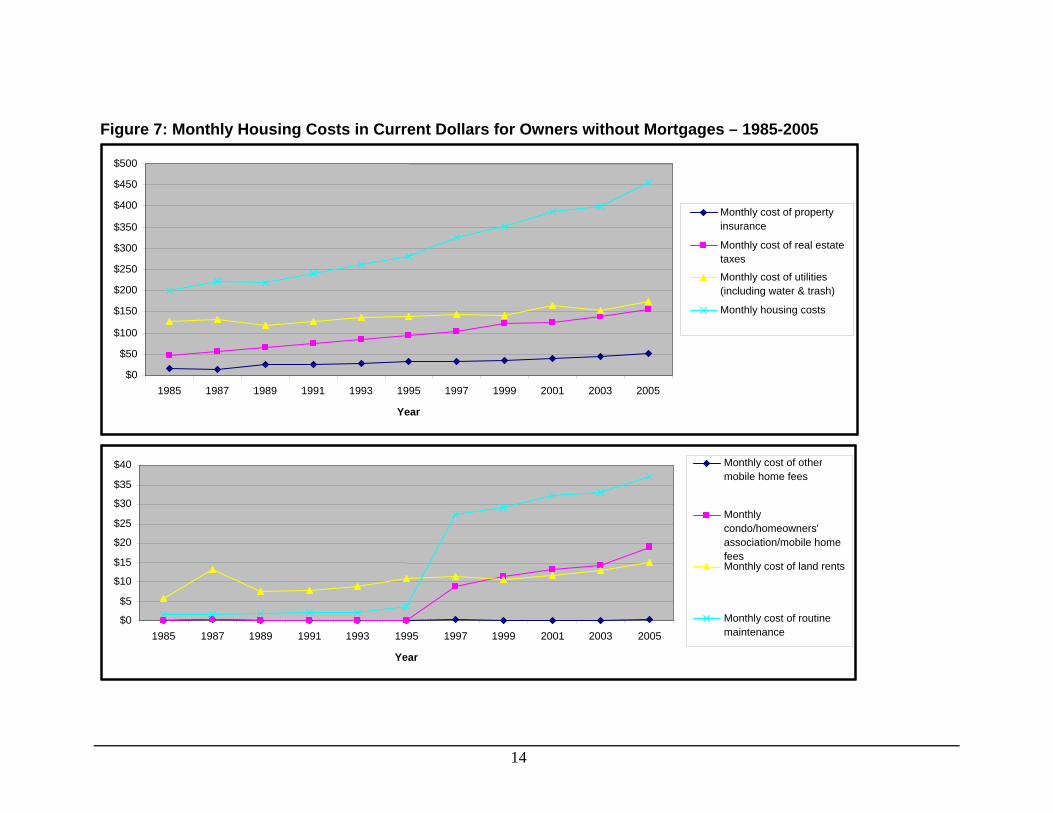
Figure 7: Monthly Housing Costs in Current Dollars for Owners without Mortgages – 1985-2005
$0
$50
$100
$150
$200
$250
$300
$350
$400
$450
$500
1985 1987 1989 1991 1993 1995 1997 1999 2001 2003 2005
Year
insurance
taxes
$0
$5
$10
$15
$20
$25
$30
$35
$40
1985 1987 1989 1991 1993 1995 1997 1999 2001 2003 2005
Year
r
association/mobile home fees
maintenance
Monthly cost of property
Monthly cost of real estate
Monthly cost of utilities (including water & trash)
Monthly housing costs
Monthly cost of othemobile home fees
Monthly condo/homeowners'
Monthly cost of land rents
Monthly cost of routine
14
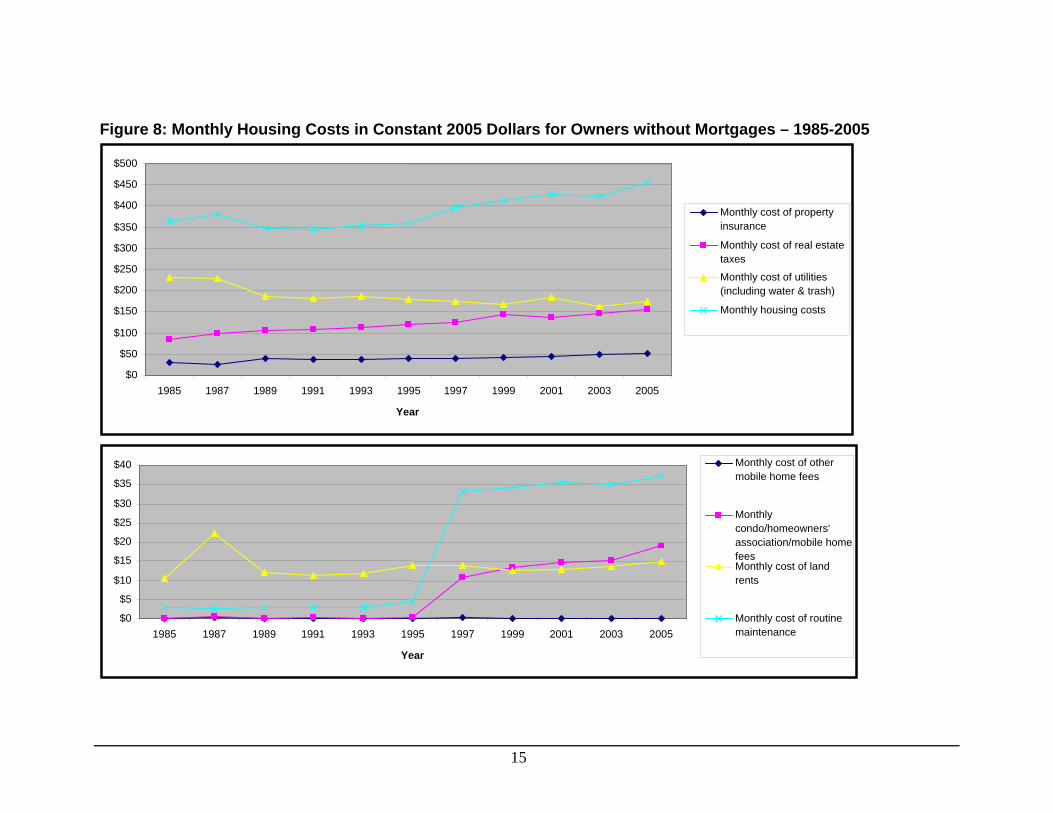
Figure 8: Monthly Housing Costs in Constant 2005 Dollars for Owners without Mortgages – 1985-2005
$0
$50
$100
$150
$200
$250
$300
$350
$400
$450
$500
insurance
taxes
Monthly cost of property
Monthly cost of real estate
Monthly cost of utilities (including water & trash)
Monthly housing costs
1985 1987 1989 1991 1993 1995 1997 1999 2001 2003 2005
Year
$0
$5
$10
$15
$20
$25
$30
$35
$40
1985 1987 1989 1991 1993 1995 1997 1999 2001 2003 2005
Year
r
association/mobile home fees
rents
maintenance
Monthly cost of othemobile home fees
Monthly condo/homeowners'
Monthly cost of land
Monthly cost of routine
15
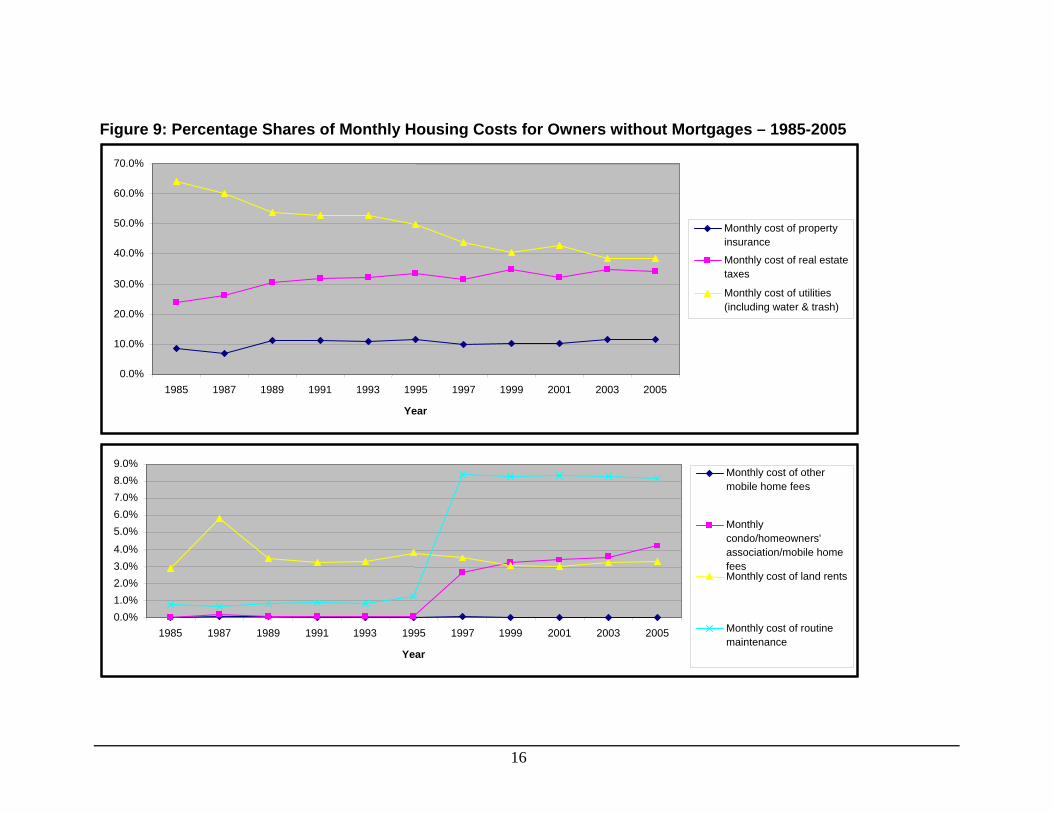
Figure 9: Percentage Shares of Monthly Housing Costs for Owners without Mortgages – 1985-2005
0.0%
10.0%
20.0%
30.0%
40.0%
50.0%
60.0%
70.0%
1985 1987 1989 1991 1993 1995 1997 1999 2001 2003 2005
Year
insurance
taxes
0.0% 1.0% 2.0% 3.0% 4.0%
5.0% 6.0% 7.0% 8.0% 9.0%
1985 1987 1989 1991 1993 1995 1997 1999 2001 2003 2005
Year
association/mobile home fees
maintenance
Monthly cost of property
Monthly cost of real estate
Monthly cost of utilities (including water & trash)
Monthly cost of other mobile home fees
Monthly condo/homeowners'
Monthly cost of land rents
Monthly cost of routine
16
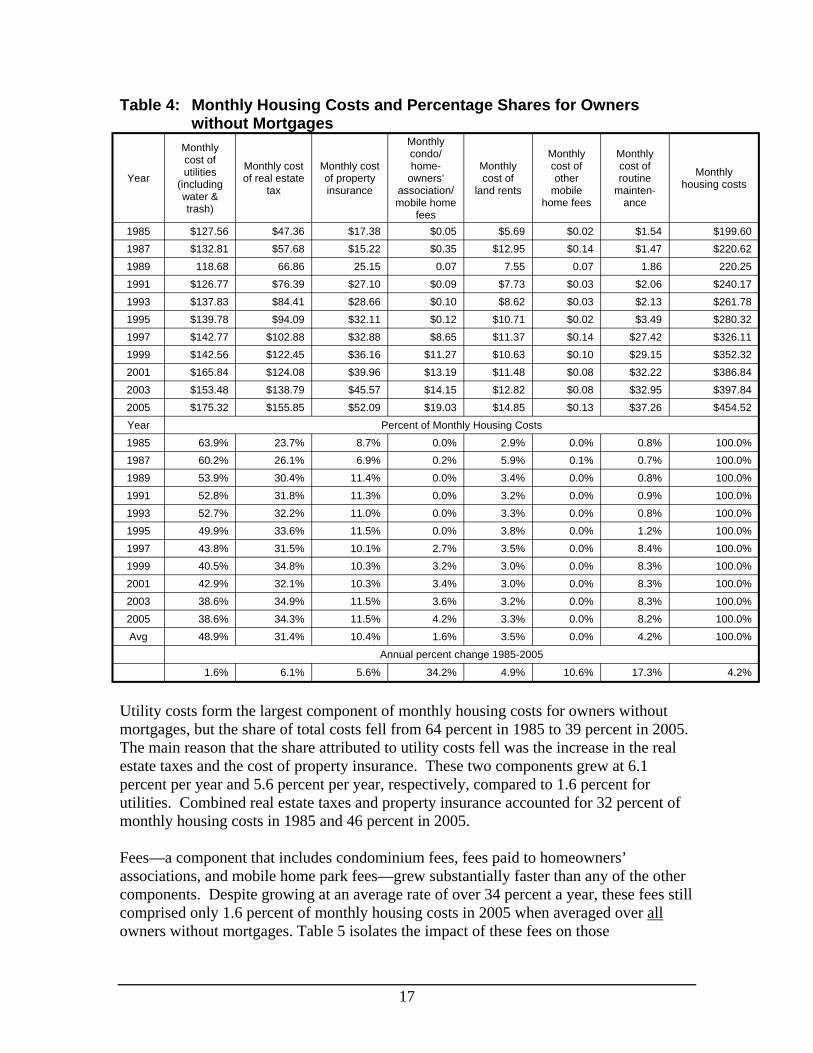
Table 4: Monthly Housing Costs and Percentage Shares for Owners without Mortgages
Year
Monthly cost of utilities
(including water & trash)
Monthly cost of real estate
tax
Monthly cost of property insurance
Monthly condo/ home-
owners’ association/ mobile home
fees
Monthly cost of
land rents
Monthly cost of other
mobile home fees
Monthly cost of routine
maintenance
Monthly housing costs
1985 $127.56 $47.36 $17.38 $0.05 $5.69 $0.02 $1.54 $199.60 1987 $132.81 $57.68 $15.22 $0.35 $12.95 $0.14 $1.47 $220.62 1989 118.68 66.86 25.15 0.07 7.55 0.07 1.86 220.25 1991 $126.77 $76.39 $27.10 $0.09 $7.73 $0.03 $2.06 $240.17 1993 $137.83 $84.41 $28.66 $0.10 $8.62 $0.03 $2.13 $261.78 1995 $139.78 $94.09 $32.11 $0.12 $10.71 $0.02 $3.49 $280.32 1997 $142.77 $102.88 $32.88 $8.65 $11.37 $0.14 $27.42 $326.11 1999 $142.56 $122.45 $36.16 $11.27 $10.63 $0.10 $29.15 $352.32 2001 $165.84 $124.08 $39.96 $13.19 $11.48 $0.08 $32.22 $386.84 2003 $153.48 $138.79 $45.57 $14.15 $12.82 $0.08 $32.95 $397.84 2005 $175.32 $155.85 $52.09 $19.03 $14.85 $0.13 $37.26 $454.52 Year Percent of Monthly Housing Costs 1985 63.9% 23.7% 8.7% 0.0% 2.9% 0.0% 0.8% 100.0% 1987 60.2% 26.1% 6.9% 0.2% 5.9% 0.1% 0.7% 100.0% 1989 53.9% 30.4% 11.4% 0.0% 3.4% 0.0% 0.8% 100.0% 1991 52.8% 31.8% 11.3% 0.0% 3.2% 0.0% 0.9% 100.0% 1993 52.7% 32.2% 11.0% 0.0% 3.3% 0.0% 0.8% 100.0% 1995 49.9% 33.6% 11.5% 0.0% 3.8% 0.0% 1.2% 100.0% 1997 43.8% 31.5% 10.1% 2.7% 3.5% 0.0% 8.4% 100.0% 1999 40.5% 34.8% 10.3% 3.2% 3.0% 0.0% 8.3% 100.0% 2001 42.9% 32.1% 10.3% 3.4% 3.0% 0.0% 8.3% 100.0% 2003 38.6% 34.9% 11.5% 3.6% 3.2% 0.0% 8.3% 100.0% 2005 38.6% 34.3% 11.5% 4.2% 3.3% 0.0% 8.2% 100.0% Avg 48.9% 31.4% 10.4% 1.6% 3.5% 0.0% 4.2% 100.0%
Annual percent change 1985-2005
1.6% 6.1% 5.6% 34.2% 4.9% 10.6% 17.3% 4.2%
Utility costs form the largest component of monthly housing costs for owners without mortgages, but the share of total costs fell from 64 percent in 1985 to 39 percent in 2005. The main reason that the share attributed to utility costs fell was the increase in the real estate taxes and the cost of property insurance. These two components grew at 6.1 percent per year and 5.6 percent per year, respectively, compared to 1.6 percent for utilities. Combined real estate taxes and property insurance accounted for 32 percent of monthly housing costs in 1985 and 46 percent in 2005.
Fees—a component that includes condominium fees, fees paid to homeowners’ associations, and mobile home park fees—grew substantially faster than any of the other components. Despite growing at an average rate of over 34 percent a year, these fees still comprised only 1.6 percent of monthly housing costs in 2005 when averaged over all owners without mortgages. Table 5 isolates the impact of these fees on those
17
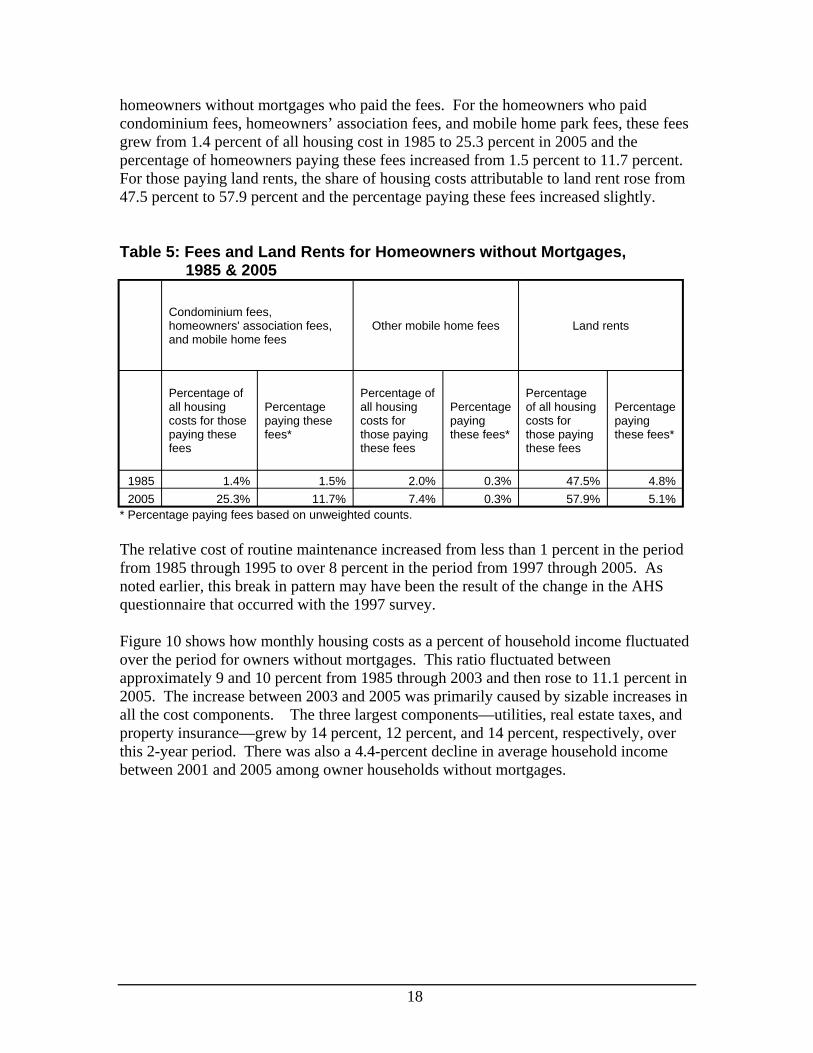
homeowners without mortgages who paid the fees. For the homeowners who paid condominium fees, homeowners’ association fees, and mobile home park fees, these fees grew from 1.4 percent of all housing cost in 1985 to 25.3 percent in 2005 and the percentage of homeowners paying these fees increased from 1.5 percent to 11.7 percent. For those paying land rents, the share of housing costs attributable to land rent rose from 47.5 percent to 57.9 percent and the percentage paying these fees increased slightly.
Table 5: Fees and Land Rents for Homeowners without Mortgages, 1985 & 2005
Condominium fees, homeowners' association fees, and mobile home fees
Other mobile home fees Land rents
Percentage of all housing costs for those paying these fees
Percentage paying these fees*
Percentage of all housing costs for those paying these fees
Percentage paying these fees*
Percentage of all housing costs for those paying these fees
Percentage paying these fees*
1985 1.4% 1.5% 2.0% 0.3% 47.5% 4.8% 2005 25.3% 11.7% 7.4% 0.3% 57.9% 5.1%
* Percentage paying fees based on unweighted counts.
The relative cost of routine maintenance increased from less than 1 percent in the period from 1985 through 1995 to over 8 percent in the period from 1997 through 2005. As noted earlier, this break in pattern may have been the result of the change in the AHS questionnaire that occurred with the 1997 survey.
Figure 10 shows how monthly housing costs as a percent of household income fluctuated over the period for owners without mortgages. This ratio fluctuated between approximately 9 and 10 percent from 1985 through 2003 and then rose to 11.1 percent in 2005. The increase between 2003 and 2005 was primarily caused by sizable increases in all the cost components. The three largest components—utilities, real estate taxes, and property insurance—grew by 14 percent, 12 percent, and 14 percent, respectively, over this 2-year period. There was also a 4.4-percent decline in average household income between 2001 and 2005 among owner households without mortgages.
18
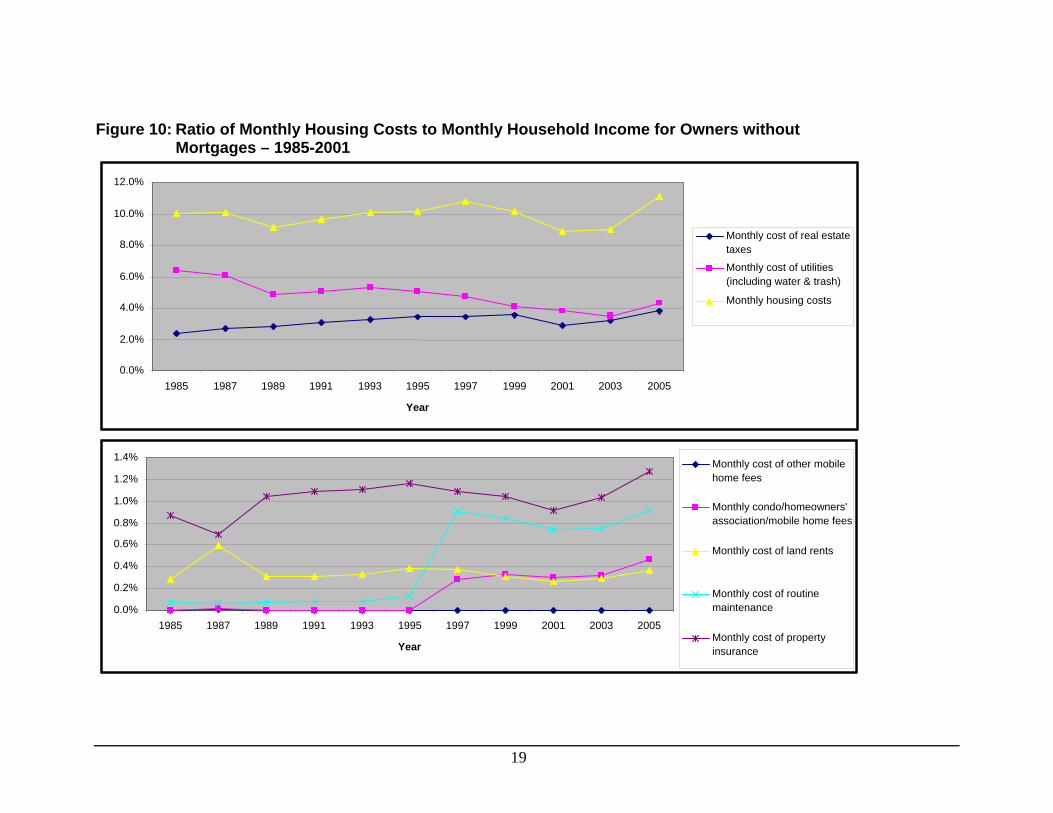
Figure 10: Ratio of Monthly Housing Costs to Monthly Household Income for Owners without Mortgages – 1985-2001
0.0%
2.0%
4.0%
6.0%
8.0%
10.0%
12.0%
taxes Monthly cost of real estate
Monthly cost of utilities (including water & trash)
Monthly housing costs
1985 1987 1989 1991 1993 1995 1997 1999 2001 2003 2005
Year
0.0%
0.2%
0.4%
0.6%
0.8%
1.0%
1.2%
1.4%
1985 1987 1989 1991 1993 1995 1997 1999 2001 2003 2005
Year
home fees
association/mobile home fees
maintenance
insurance
Monthly cost of other mobile
Monthly condo/homeowners'
Monthly cost of land rents
Monthly cost of routine
Monthly cost of property
19
Section E: Costs for Renters
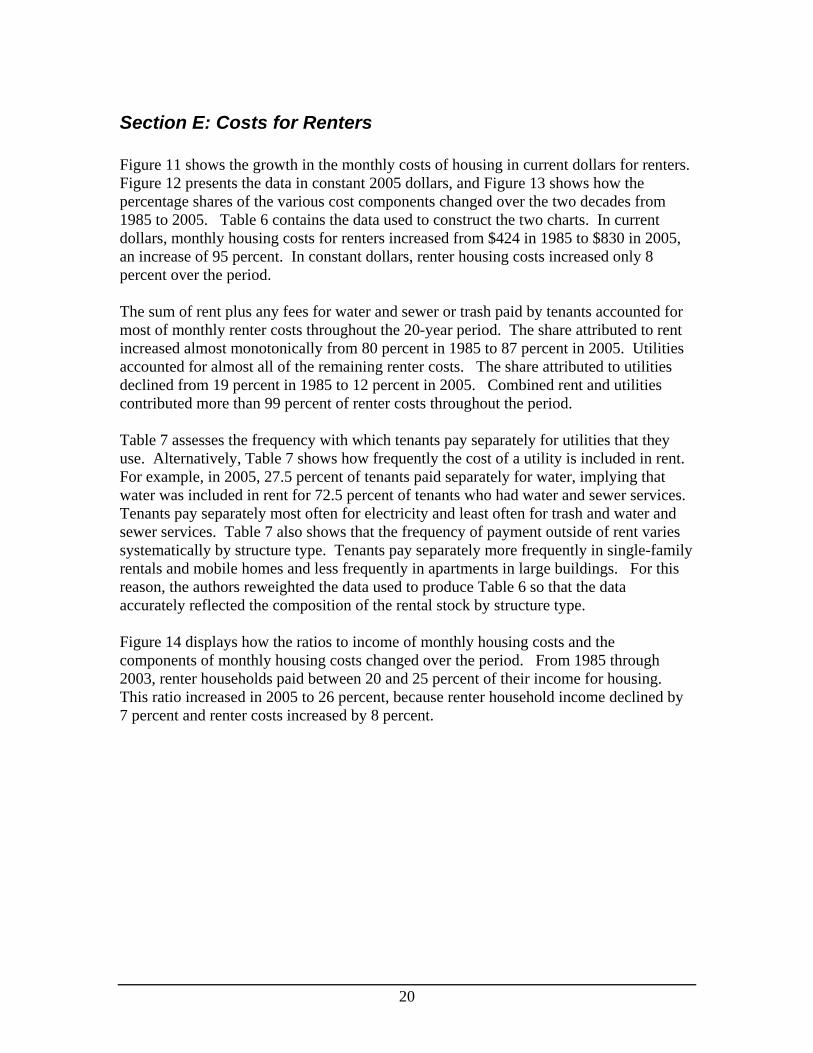
Figure 11 shows the growth in the monthly costs of housing in current dollars for renters. Figure 12 presents the data in constant 2005 dollars, and Figure 13 shows how the percentage shares of the various cost components changed over the two decades from 1985 to 2005. Table 6 contains the data used to construct the two charts. In current dollars, monthly housing costs for renters increased from $424 in 1985 to $830 in 2005, an increase of 95 percent. In constant dollars, renter housing costs increased only 8 percent over the period.
The sum of rent plus any fees for water and sewer or trash paid by tenants accounted for most of monthly renter costs throughout the 20-year period. The share attributed to rent increased almost monotonically from 80 percent in 1985 to 87 percent in 2005. Utilities accounted for almost all of the remaining renter costs. The share attributed to utilities declined from 19 percent in 1985 to 12 percent in 2005. Combined rent and utilities contributed more than 99 percent of renter costs throughout the period.
Table 7 assesses the frequency with which tenants pay separately for utilities that they use. Alternatively, Table 7 shows how frequently the cost of a utility is included in rent. For example, in 2005, 27.5 percent of tenants paid separately for water, implying that water was included in rent for 72.5 percent of tenants who had water and sewer services. Tenants pay separately most often for electricity and least often for trash and water and sewer services. Table 7 also shows that the frequency of payment outside of rent varies systematically by structure type. Tenants pay separately more frequently in single-family rentals and mobile homes and less frequently in apartments in large buildings. For this reason, the authors reweighted the data used to produce Table 6 so that the data accurately reflected the composition of the rental stock by structure type.
Figure 14 displays how the ratios to income of monthly housing costs and the components of monthly housing costs changed over the period. From 1985 through 2003, renter households paid between 20 and 25 percent of their income for housing. This ratio increased in 2005 to 26 percent, because renter household income declined by 7 percent and renter costs increased by 8 percent.
20
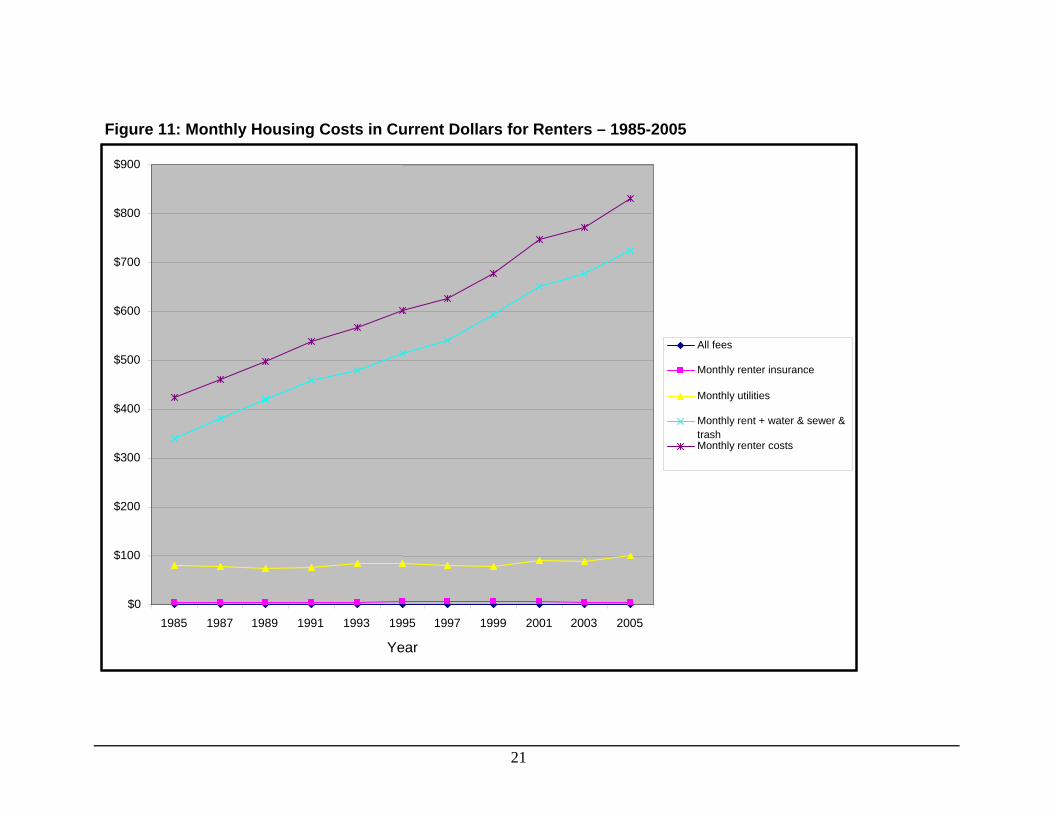
Figure 11: Monthly Housing Costs in Current Dollars for Renters – 1985-2005
$0
All fees
trash
$100
$200
$300
$400
$500
$600
$700
$800
$900
Monthly renter insurance
Monthly utilities
Monthly rent + water & sewer &
Monthly renter costs
1985 1987 1989 1991 1993 1995 1997 1999 2001 2003 2005
Year
21
Figure 12: Monthly Housing Costs in Constant 2005 Dollars for Renters – 1985-2005
$900
$800
$700
$600
$500
$400
$300
$200
$100
$01985 1987 1989 1991 1993 1995 1997 1999 2001 2003 2005
Year
All fees
insurance
r
Monthly renter
Monthly utilities
Monthly rent + wate& sewer & trash
Monthly renter costs
22
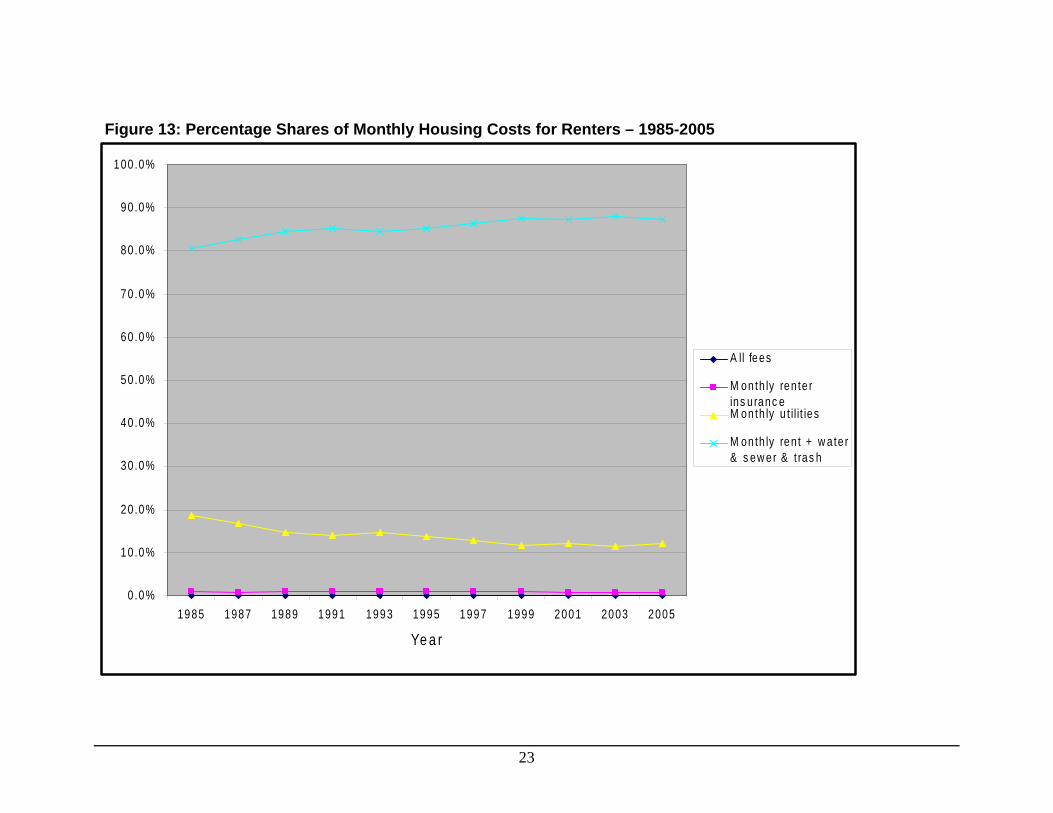
Figure 13: Percentage Shares of Monthly Housing Costs for Renters – 1985-2005
A ll f
l il it i
0 .0%
10 .0%
20 .0%
30 .0%
40 .0%
50 .0%
60 .0%
70 .0%
80 .0%
90 .0%
100 .0%
ees
M on th ly ren te r ins uranc e M on th y u t es
M on th ly ren t + w a te r & s ew er & t ras h
1985 1987 1989 1991 1993 1995 1997 1999 2001 2003 2005
Ye a r
23
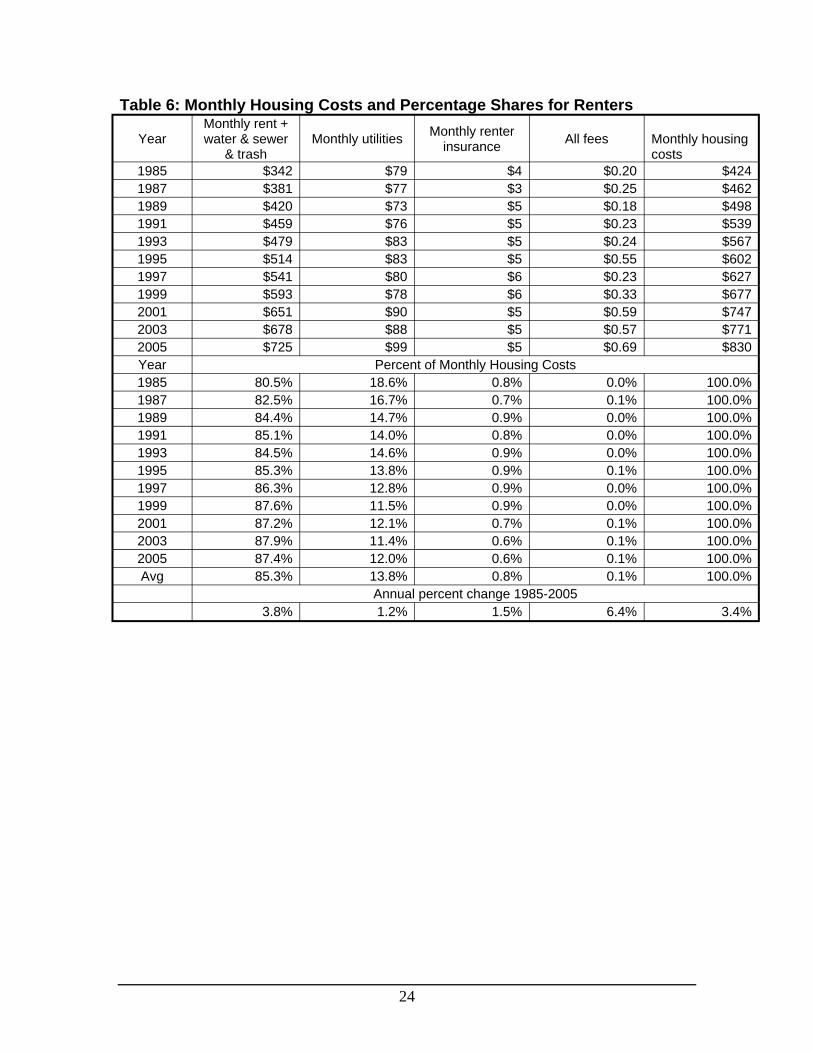
Table 6: Monthly Housing Costs and Percentage Shares for Renters
Year Monthly rent + water & sewer
& trash Monthly utilities Monthly renter
insurance All fees Monthly housing costs
1985 $342 $79 $4 $0.20 $424 1987 $381 $77 $3 $0.25 $462 1989 $420 $73 $5 $0.18 $498 1991 $459 $76 $5 $0.23 $539 1993 $479 $83 $5 $0.24 $567 1995 $514 $83 $5 $0.55 $602 1997 $541 $80 $6 $0.23 $627 1999 $593 $78 $6 $0.33 $677 2001 $651 $90 $5 $0.59 $747 2003 $678 $88 $5 $0.57 $771 2005 $725 $99 $5 $0.69 $830 Year Percent of Monthly Housing Costs 1985 80.5% 18.6% 0.8% 0.0% 100.0% 1987 82.5% 16.7% 0.7% 0.1% 100.0% 1989 84.4% 14.7% 0.9% 0.0% 100.0% 1991 85.1% 14.0% 0.8% 0.0% 100.0% 1993 84.5% 14.6% 0.9% 0.0% 100.0% 1995 85.3% 13.8% 0.9% 0.1% 100.0% 1997 86.3% 12.8% 0.9% 0.0% 100.0% 1999 87.6% 11.5% 0.9% 0.0% 100.0% 2001 87.2% 12.1% 0.7% 0.1% 100.0% 2003 87.9% 11.4% 0.6% 0.1% 100.0% 2005 87.4% 12.0% 0.6% 0.1% 100.0% Avg 85.3% 13.8% 0.8% 0.1% 100.0%
Annual percent change 1985-2005 3.8% 1.2% 1.5% 6.4% 3.4%
24
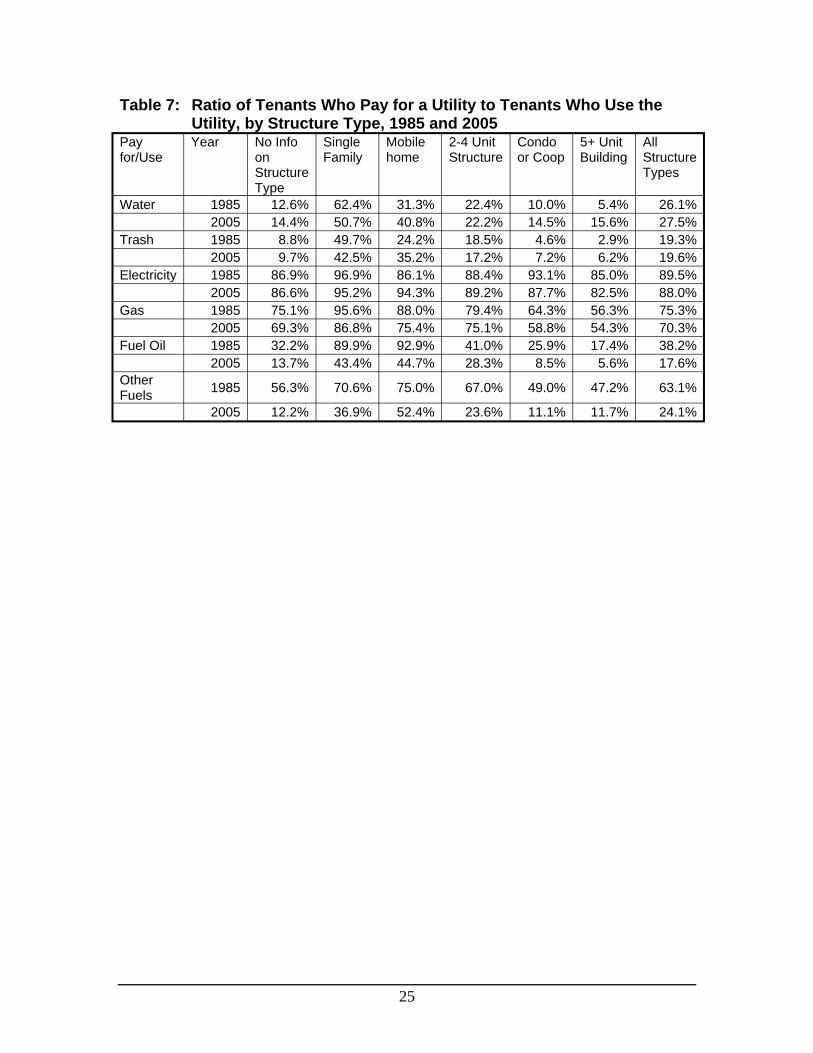
Table 7: Ratio of Tenants Who Pay for a Utility to Tenants Who Use the Utility, by Structure Type, 1985 and 2005
Pay for/Use
Year No Info on Structure Type
Single Family
Mobile home
2-4 Unit Structure
Condo or Coop
5+ Unit Building
All Structure Types
Water 1985 12.6% 62.4% 31.3% 22.4% 10.0% 5.4% 26.1% 2005 14.4% 50.7% 40.8% 22.2% 14.5% 15.6% 27.5% Trash 1985 8.8% 49.7% 24.2% 18.5% 4.6% 2.9% 19.3% 2005 9.7% 42.5% 35.2% 17.2% 7.2% 6.2% 19.6% Electricity 1985 86.9% 96.9% 86.1% 88.4% 93.1% 85.0% 89.5% 2005 86.6% 95.2% 94.3% 89.2% 87.7% 82.5% 88.0% Gas 1985 75.1% 95.6% 88.0% 79.4% 64.3% 56.3% 75.3% 2005 69.3% 86.8% 75.4% 75.1% 58.8% 54.3% 70.3% Fuel Oil 1985 32.2% 89.9% 92.9% 41.0% 25.9% 17.4% 38.2% 2005 13.7% 43.4% 44.7% 28.3% 8.5% 5.6% 17.6% Other Fuels 1985 56.3% 70.6% 75.0% 67.0% 49.0% 47.2% 63.1%
2005 12.2% 36.9% 52.4% 23.6% 11.1% 11.7% 24.1%
25
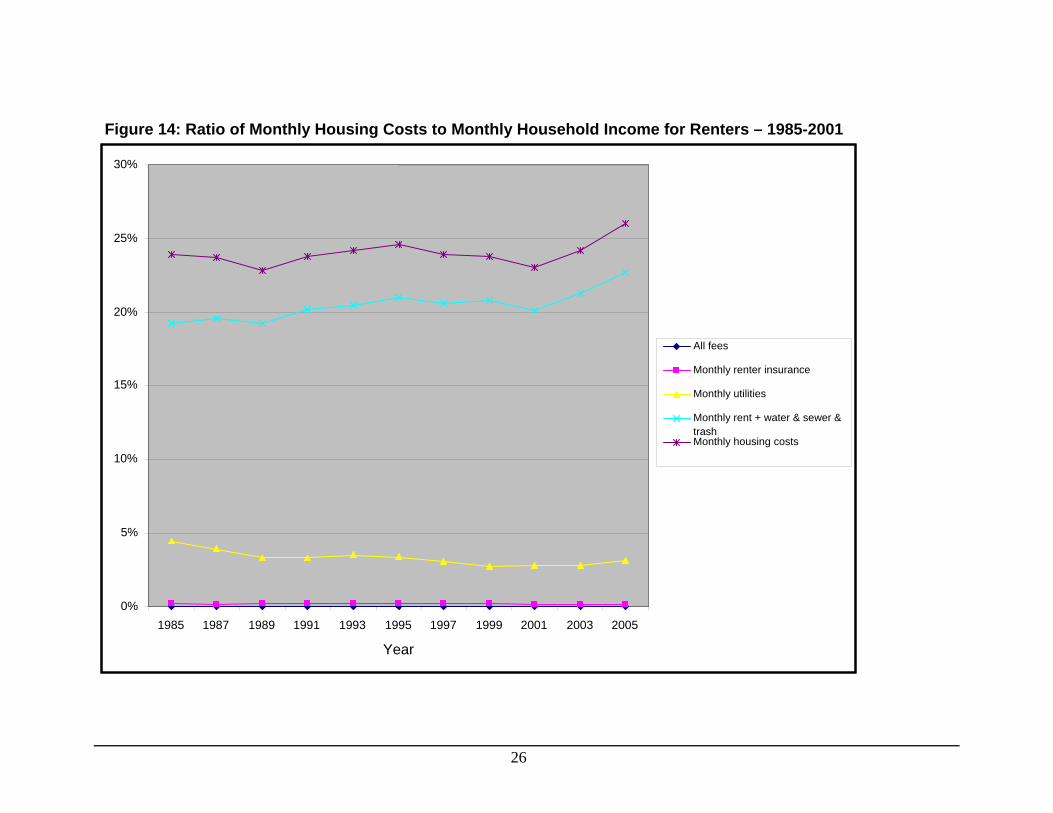
Figure 14: Ratio of Monthly Housing Costs to Monthly Household Income for Renters – 1985-2001
0%
5%
10%
15%
20%
25%
30%
Year
All fees
trash
1985 1987 1989 1991 1993 1995 1997 1999 2001 2003 2005
Monthly renter insurance
Monthly utilities
Monthly rent + water & sewer &
Monthly housing costs
26
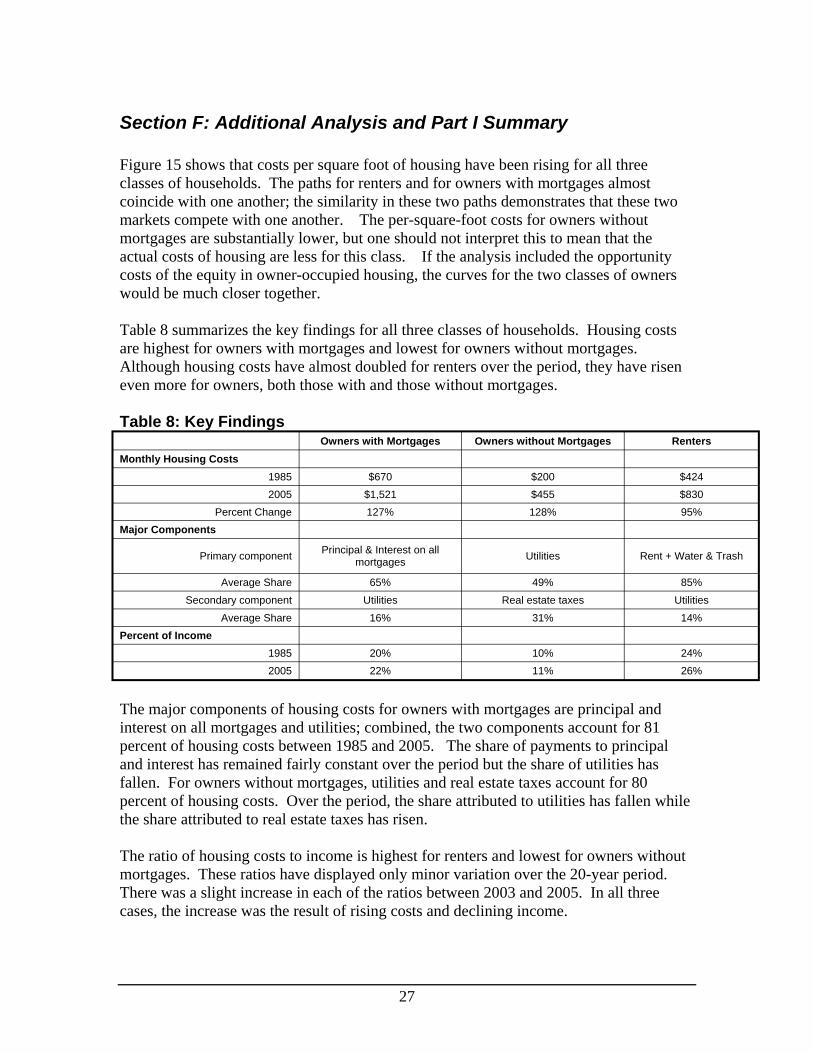
Section F: Additional Analysis and Part I Summary
Figure 15 shows that costs per square foot of housing have been rising for all three classes of households. The paths for renters and for owners with mortgages almost coincide with one another; the similarity in these two paths demonstrates that these two markets compete with one another. The per-square-foot costs for owners without mortgages are substantially lower, but one should not interpret this to mean that the actual costs of housing are less for this class. If the analysis included the opportunity costs of the equity in owner-occupied housing, the curves for the two classes of owners would be much closer together.
Table 8 summarizes the key findings for all three classes of households. Housing costs are highest for owners with mortgages and lowest for owners without mortgages. Although housing costs have almost doubled for renters over the period, they have risen even more for owners, both those with and those without mortgages.
Table 8: Key Findings Owners with Mortgages Owners without Mortgages Renters
Monthly Housing Costs 1985 $670 $200 $424 2005 $1,521 $455 $830
Percent Change 127% 128% 95% Major Components
Primary component Principal & Interest on all mortgages Utilities Rent + Water & Trash
Average Share 65% 49% 85%
Secondary component Utilities Real estate taxes Utilities
Average Share 16% 31% 14% Percent of Income
1985 20% 10% 24% 2005 22% 11% 26%
The major components of housing costs for owners with mortgages are principal and interest on all mortgages and utilities; combined, the two components account for 81 percent of housing costs between 1985 and 2005. The share of payments to principal and interest has remained fairly constant over the period but the share of utilities has fallen. For owners without mortgages, utilities and real estate taxes account for 80 percent of housing costs. Over the period, the share attributed to utilities has fallen while the share attributed to real estate taxes has risen.
The ratio of housing costs to income is highest for renters and lowest for owners without mortgages. These ratios have displayed only minor variation over the 20-year period. There was a slight increase in each of the ratios between 2003 and 2005. In all three cases, the increase was the result of rising costs and declining income.
27
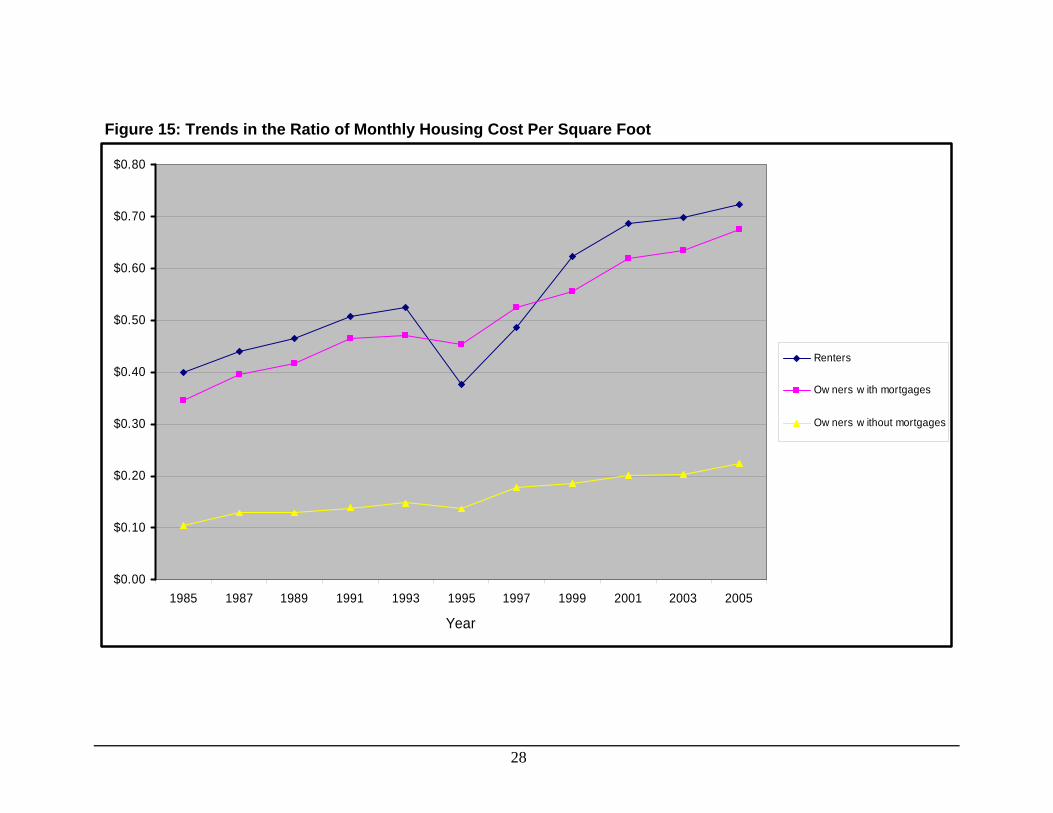
Figure 15: Trends in the Ratio of Monthly Housing Cost Per Square Foot
i
i
$0.00
$0.10
$0.20
$0.30
$0.40
$0.50
$0.60
$0.70
$0.80
Renters
Ow ners w th mortgages
Ow ners w thout mortgages
1985 1987 1989 1991 1993 1995 1997 1999 2001 2003 2005
Year
28
As noted, adjusting for the increasing size of units does not change the conclusion that housing costs have been rising. However, Figure 5 showed that the ratio of monthly housing costs to value has declined for owners, both those with and those without mortgages.
PART 2: Adequacy of the 30-Percent-of-Income Standard
Section G: Background on the 30-Percent Standard
Various Income Standards
HUD has developed the Housing Affordability Data System (HADS) “to provide housing analysts with consistent measures of affordability and burdens over a long period.”10 The HADS system looks at the affordability of housing from several perspectives, including the fraction of income that a household spends on housing. HADS uses “the standard assumption [emphasis added] that a unit is affordable if the household spends no more than 30 percent of its income on housing.”11 In this context, expenditures on “housing” include utility payments and, for owner-occupied housing, real estate taxes, hazard insurance, and fees such as condo fees or homeowners’ association fees. The “standard assumption” of 30 percent has a long history. Nelson and Vandenbroucke used this assumption in one of the earliest papers on the affordability of housing.12
But “30 percent” is not the only standard used in assessing affordability. The National Association of Realtors© (NAR) has published an index of affordability for homeowners dating back to at least 1970. This index is calculated by taking the ratio of 25 percent of median family income to the cost of a mortgage on the median-priced existing house at current interest rates and with a 20-percent downpayment. The NAR formula considers only the costs of payments to principal and interest and therefore excludes many of the costs included in the HADS definition of housing costs. Data from the 2001 through 2005 AHS surveys derived from Part 1 of this report indicate that principal and interest payments accounted for approximately 60 percent of the housing costs of homeowners with mortgages. Therefore, the NAR 25-percent standard is equivalent to a standard of 42 percent in the HADS context.13
HUD has periodically prepared reports for Congress analyzing the extent of serious housing needs. The standard used to identify “worst case needs” was affirmed in a 1990 report of the Senate Appropriations Committee: “families and individuals whose incomes
10 See page 1 of the 2007 HADS documentation at http://www.huduser.org/intercept.asp?loc=/Datasets/hads/HADS_doc.pdf. 11 Ibid., page 11. 12 Kathryn P. Nelson and David A. Vandenbroucke, “Affordable Rental Housing: Lost, Stolen, orStrayed?,” paper presented at the 1996 Mid-Year Meeting of the American Real Estate and Urban Economics Association, Washington, DC, May 28, 1996. 13 Let P&I=.25Y and P&I/MHC=0.6. Then 0.6MHC=.25Y and MHC/Y= 0.42.
29
fall 50 percent below an area’s median income, who either pay 50 percent or more of their monthly income for rent, or who live in substandard housing.”14
Origin of the 30-Percent Standard
The 30-percent standard probably originates in the set of rules that determine how much families in federally assisted housing must pay in rent. Until the late 1960s, public housing was the predominant form of federally assisted housing. In the public housing program as originally formulated, the federal government entered into agreements with local entities, known as public housing authorities (PHAs), under which the federal government would pay for the construction of public housing and PHAs undertook to manage the public housing projects and cover all operating costs from rents collected from tenants. These arrangements, which governed the public housing program from its creation in 1937 to 1968, had one problem: the poorest of the poor could not afford to live in public housing because they could not pay the rents required to cover operating costs and still have income left over for other necessities. Because of this shortcoming, Senator Brooke convinced Congress in 1968 to mandate that no family would have to pay more than 25 percent of its income toward rent in federally assisted housing.15 In 1981, Congress changed the minimum payment to 30 percent of income. This change was primarily designed to reduce the costs of federally assisted housing but it presumes, at least implicitly, that households should be able to provide for their non-housing needs with 70 percent of their income.
The authors do not know why the Brook Amendment established 25 percent instead of some other percentage as the maximum required contribution. There were three potential sources of data that could have been used to calculate an appropriate standard. First, the 1960 decennial census collected data on mortgage payment, rents, other housing costs, and incomes. The 1960 Census reported that the median ratio of housing costs to income was 19 percent for owners with mortgages and 10 percent for owners without mortgages; the 1960 Census did not publish the ratio of rent to income.16 Second, according to the national income accounts, expenditures on housing, including payments for utilities, averaged 14.3 percent of personal income in 1968.17 The ratio of housing costs to all expenditures probably varies substantially across income strata, so the 14-percent average may not reflect expenditure patterns among lower income households. The ratio of housing costs to personal income was 12.2 percent in 1981 when Congress raised the standard to 30 percent; in 2005 it was 17.4 percent.18 Third, the Bureau of Labor
14Committee Report to accompany H.R. 5158, The VA-HUD Appropriations Act for FY 1991 (S. Rpt. 101474) as reported on page 7 of Affordable Housing Needs 2005: Report to Congress, May 2007, U. S. Department of Housing and Urban Development,http://www.huduser.org/publications/affhsg/affhsgneed.html. 15 As a consequence of the so-called Brooke Amendment, the federal government now makes annualcontributions to PHAs to help them cover the difference between rental income and operating costs. 16 1960 Census of Housing, Volume V Residential Finance, Part I Homeowner Properties, page XXIX, athttp://www2.census.gov/prod2/decennial/documents/10959455v5p1ch1.pdf. 17 1970 Statistical Abstract of the United States, Tables 476 and 480. 18 1982/83 Statistical Abstract of the United States, Tables 692 and 698, and 2008 Statistical Abstract of the United States, Tables 656 and 662.
30
Statistics (BLS) collected data on consumer expenditures as part of the process of constructing the consumer price index. However, consumer expenditure data from these surveys are not available on the Internet for years prior to 1984.19 The 25-percent standard required a higher contribution for housing than either the median ratio for the owner-occupied housing or the average ratio for all housing from the two sources that the authors were able to check.
Section H: Continued Adequacy of the 30-Percent Standard
HUD suggested a straightforward way to analyze whether the 30-percent standard is still adequate. The method starts with the assumption that the standard was adequate in 1985. Then, using data from both the 1985 and 2005 AHS surveys, the method observes whether households can afford the same level of non-housing consumption in 2005 that they consumed in 1985 if they spend 30 percent of their incomes on housing in both years.
Tables 9 through 12 examine how the income left for non-housing consumption would have changed between 1985 and 2005 if households spent 30 percent on their incomes for housing. The tables report on households of different types and, within each type, on seven classes of households based on the ratio of household income to median income in the area in which the household lives.20 The categories are:
• Extremely low income – household income less than or equal to 30 percent of the local area median income
• Very low income – income higher than 30 percent but less than or equal to 50 percent of local area median income
• Low income – income higher than 50 percent but less than or equal to 60 percent of local area median income
• Moderate income – income higher than 60 percent but less than or equal to 80 percent of local area median income
• High income – income higher than 80 percent but less than or equal to 100 percent of local area median income
• Very high income – income higher than 100 percent but less than or equal to 120 percent of local area median income
• Extremely high income – income higher than 120 percent of local area median income
The tables use AHS data on income and housing costs and the categorization of households by income category from the HADS files. The Consumer Price Index was used to translate 1985 expenditures on items other than shelter into the 2005 dollars needed to purchase the equivalent non-housing items. Readers should note that the tables do not compare the same households in two different years. Instead, the analysis
19 BLS used the information from the consumer expenditure surveys to construct family budgets, which will be discussed in a later section. 20 The seven-level classification was developed by HUD for its HADS data system; the names applied to the categories are not used by HADS.
31
groups households by relative income in two different years and compares the groups from those years.
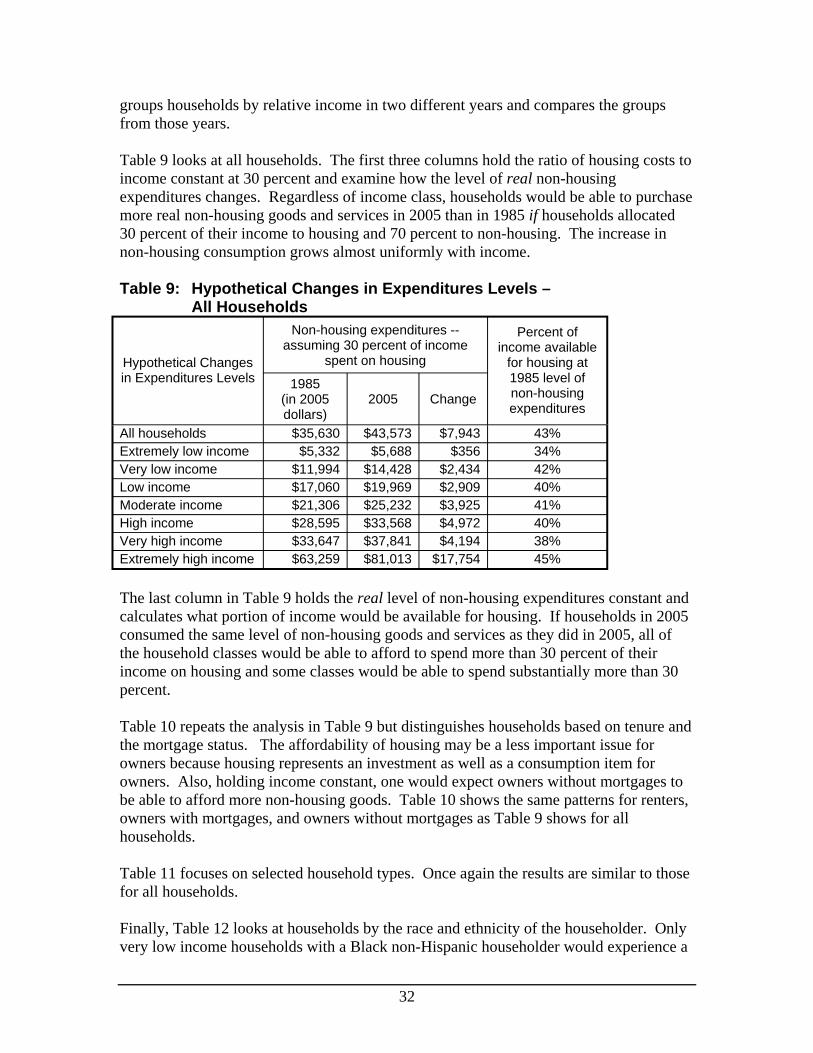
Table 9 looks at all households. The first three columns hold the ratio of housing costs to income constant at 30 percent and examine how the level of real non-housing expenditures changes. Regardless of income class, households would be able to purchase more real non-housing goods and services in 2005 than in 1985 if households allocated 30 percent of their income to housing and 70 percent to non-housing. The increase in non-housing consumption grows almost uniformly with income.
Table 9: Hypothetical Changes in Expenditures Levels – All Households
Hypothetical Changes in Expenditures Levels
Non-housing expenditures -- assuming 30 percent of income
spent on housing
Percent of income available
for housing at 1985 level of non-housing expenditures
1985 (in 2005 dollars)
2005 Change
All households $35,630 $43,573 $7,943 43% Extremely low income $5,332 $5,688 $356 34% Very low income $11,994 $14,428 $2,434 42% Low income $17,060 $19,969 $2,909 40% Moderate income $21,306 $25,232 $3,925 41% High income $28,595 $33,568 $4,972 40% Very high income $33,647 $37,841 $4,194 38% Extremely high income $63,259 $81,013 $17,754 45%
The last column in Table 9 holds the real level of non-housing expenditures constant and calculates what portion of income would be available for housing. If households in 2005 consumed the same level of non-housing goods and services as they did in 2005, all of the household classes would be able to afford to spend more than 30 percent of their income on housing and some classes would be able to spend substantially more than 30 percent.
Table 10 repeats the analysis in Table 9 but distinguishes households based on tenure and the mortgage status. The affordability of housing may be a less important issue for owners because housing represents an investment as well as a consumption item for owners. Also, holding income constant, one would expect owners without mortgages to be able to afford more non-housing goods. Table 10 shows the same patterns for renters, owners with mortgages, and owners without mortgages as Table 9 shows for all households.
Table 11 focuses on selected household types. Once again the results are similar to those for all households.
Finally, Table 12 looks at households by the race and ethnicity of the householder. Only very low income households with a Black non-Hispanic householder would experience a
32
decline in real non-housing expenditures and the observed decline is less than one percent.
Tables 9 through 12 lead to the conclusion that: if spending 30 percent of income on housing allowed an adequate level of consumption of non-housing goods and services in 1985, then spending 30 percent of income on housing in 2005 would also have allowed an adequate level of non-housing expenditures. The conclusion of adequacy rests on the assumption that 30 percent of income was the appropriate level of expenditure on housing in 1985 across income categories. The next section examines an alternative approach that does not rely on this assumption.
33

Table 10: Hypothetical Changes in Expenditures Levels – Households by Tenure and Mortgage Status
Non-housing expenditures -- assuming 30 percent of income
spent on housing
Percent of income available for housing at 1985 level of non-housing expenditures
1985 (in 2005
dollars)
2005 Change
Renters All households $25,977 $26,816 $839 32% Extremely low income $5,472 $5,782 $309 34% Very low income $12,605 $14,838 $2,234 41% Low income $17,449 $20,081 $2,633 39% Moderate income $21,063 $25,078 $4,015 41% High income $27,594 $32,668 $5,074 41% Very high income $30,970 $34,896 $3,926 38% Extremely high income $54,420 $66,347 $11,927 43%
Owners with mortgages All households $49,700 $58,981 $9,281 41% Extremely low income $5,490 $6,075 $585 37% Very low income $13,131 $15,882 $2,751 42% Low income $18,496 $21,322 $2,826 39% Moderate income $23,551 $26,898 $3,347 39% High income $31,370 $35,456 $4,086 38% Very high income $37,200 $40,719 $3,519 36% Extremely high income $68,074 $84,886 $16,812 44%
Owners without mortgages All households $29,126 $34,319 $5,192 41% Extremely low income $5,096 $5,413 $317 34% Very low income $11,008 $13,156 $2,148 41% Low income $15,742 $18,478 $2,736 40% Moderate income $19,925 $23,175 $3,250 40% High income $26,514 $30,854 $4,340 40% Very high income $31,581 $34,398 $2,817 36% Extremely high income $59,250 $77,076 $17,826 46%
34
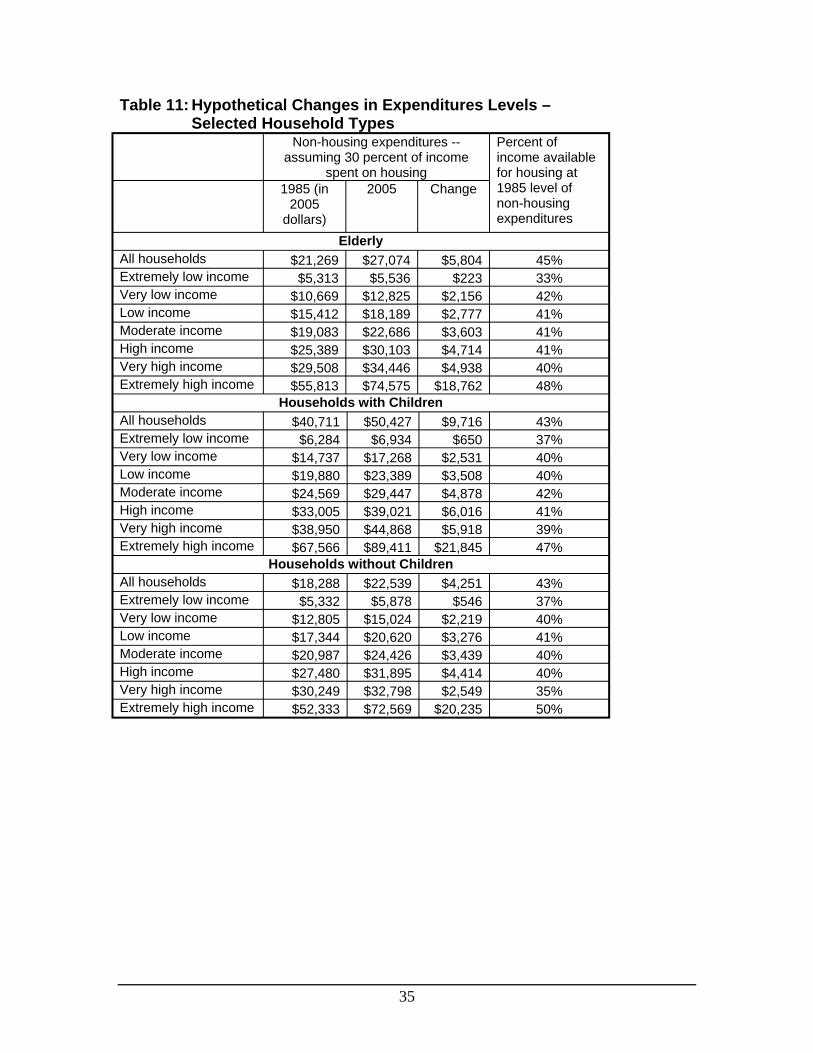
Table 11: Hypothetical Changes in Expenditures Levels – Selected Household Types
Non-housing expenditures -- Percent of assuming 30 percent of income income available
spent on housing for housing at 1985 level of non-housing expenditures
1985 (in 2005
dollars)
2005 Change
Elderly All households $21,269 $27,074 $5,804 45% Extremely low income $5,313 $5,536 $223 33% Very low income $10,669 $12,825 $2,156 42% Low income $15,412 $18,189 $2,777 41% Moderate income $19,083 $22,686 $3,603 41% High income $25,389 $30,103 $4,714 41% Very high income $29,508 $34,446 $4,938 40% Extremely high income $55,813 $74,575 $18,762 48%
Households with Children All households $40,711 $50,427 $9,716 43% Extremely low income $6,284 $6,934 $650 37% Very low income $14,737 $17,268 $2,531 40% Low income $19,880 $23,389 $3,508 40% Moderate income $24,569 $29,447 $4,878 42% High income $33,005 $39,021 $6,016 41% Very high income $38,950 $44,868 $5,918 39% Extremely high income $67,566 $89,411 $21,845 47%
Households without Children All households $18,288 $22,539 $4,251 43% Extremely low income $5,332 $5,878 $546 37% Very low income $12,805 $15,024 $2,219 40% Low income $17,344 $20,620 $3,276 41% Moderate income $20,987 $24,426 $3,439 40% High income $27,480 $31,895 $4,414 40% Very high income $30,249 $32,798 $2,549 35% Extremely high income $52,333 $72,569 $20,235 50%
35
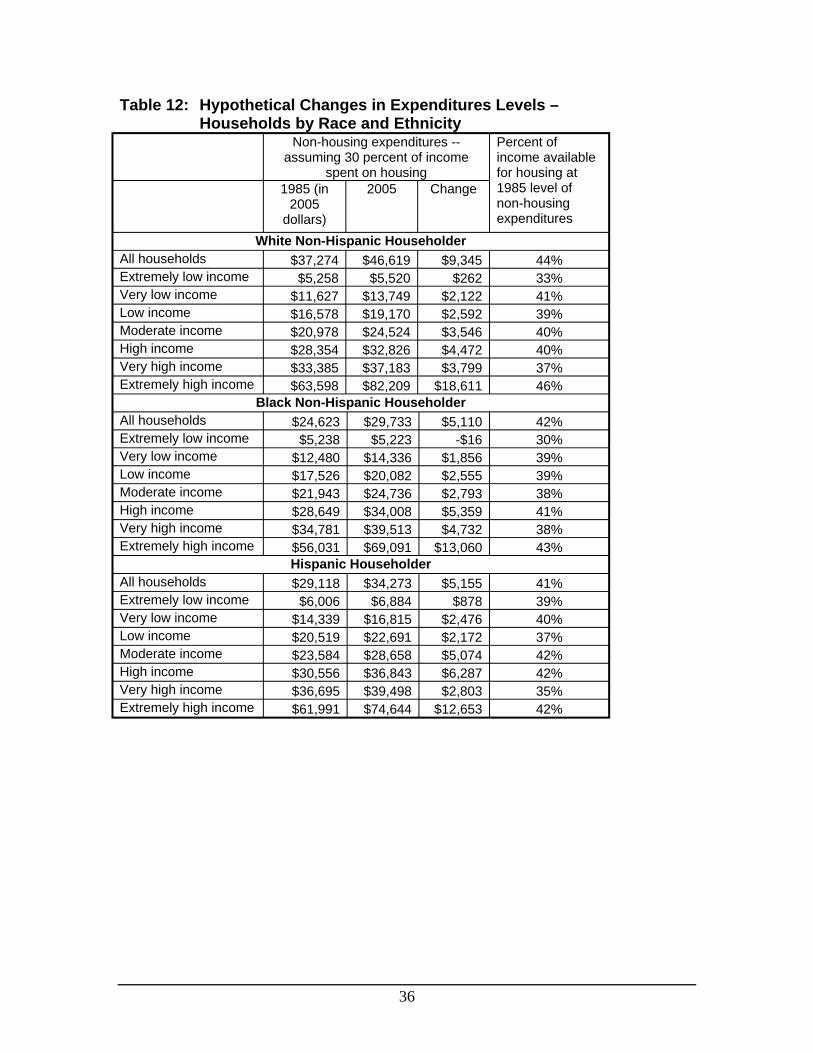
Table 12: Hypothetical Changes in Expenditures Levels – Households by Race and Ethnicity
Non-housing expenditures -- Percent of assuming 30 percent of income income available
spent on housing for housing at 1985 level of non-housing expenditures
1985 (in 2005
dollars)
2005 Change
White Non-Hispanic Householder All households $37,274 $46,619 $9,345 44% Extremely low income $5,258 $5,520 $262 33% Very low income $11,627 $13,749 $2,122 41% Low income $16,578 $19,170 $2,592 39% Moderate income $20,978 $24,524 $3,546 40% High income $28,354 $32,826 $4,472 40% Very high income $33,385 $37,183 $3,799 37% Extremely high income $63,598 $82,209 $18,611 46%
Black Non-Hispanic Householder All households $24,623 $29,733 $5,110 42% Extremely low income $5,238 $5,223 -$16 30% Very low income $12,480 $14,336 $1,856 39% Low income $17,526 $20,082 $2,555 39% Moderate income $21,943 $24,736 $2,793 38% High income $28,649 $34,008 $5,359 41% Very high income $34,781 $39,513 $4,732 38% Extremely high income $56,031 $69,091 $13,060 43%
Hispanic Householder All households $29,118 $34,273 $5,155 41% Extremely low income $6,006 $6,884 $878 39% Very low income $14,339 $16,815 $2,476 40% Low income $20,519 $22,691 $2,172 37% Moderate income $23,584 $28,658 $5,074 42% High income $30,556 $36,843 $6,287 42% Very high income $36,695 $39,498 $2,803 35% Extremely high income $61,991 $74,644 $12,653 42%
36
Section I: Looking for an Alternative Test
The preceding test of the adequacy of the 30-percent standard in 2005 depends upon the assumption that 30 percent was an adequate standard in 1985. The authors searched for an alternative test that did not depend on this assumption or similar assumptions.
A standard defined as a percent-of-income cannot work for all households. If household income is close to zero, spending 30 percent or even 100 percent of income on shelter will not secure safe and sanitary housing in a decent neighborhood, and spending 70 percent or even 100 percent on other goods and services will not meet the household’s minimum needs. To be satisfactory, a percent-of-income standard has to ensure that a reasonably large majority of households can acquire both sufficient housing and minimal non-housing goods. To use this loosely defined criterion to test adequacy, one must have some acceptable standards for what constitutes sufficient housing and minimal non-housing consumption.
During the 1960s, BLS developed a technique to compare the cost of living across metropolitan areas. Using data from the Consumer Expenditure Survey, BLS priced three bundles of goods and services across 25 metropolitan areas and the non-metropolitan portions of the four census regions. The bundles represented budgets for a family of four at a “lower,” “intermediate,” and “higher” level. BLS collected additional data to price these budgets for the last time in 1969, but updated the budgets through 1981 using detailed data on price changes at the local level.
There are several reasons why it would be inappropriate to use these family budgets to assess the 30-percent standard. First, BLS never intended the lower family budget to represent a minimal level of consumption. Second, collecting the additional data needed for the family budget involved the exercise of more than the usual level of judgment on the part of BLS field staff and, for this reason, BLS always treated the family budgets as less precise than their typical products.21 Third, changes in the methodology used to construct the CPI would affect the precision of any updates of the 1981 data. Fourth, BLS created budgets for specific family compositions and, therefore, it would be incorrect to apply that specific budget to a wider group of households. Despite these limitations, this section uses the family budget data to assess the adequacy of the 30percent standard because, as frequently happens in research, the absence of ideal data leads to the use of the only data available.
This section uses the family budget data for 1981, as opposed to earlier versions of the family budgets, for three reasons.22 These are the most recent data available; in particular, they are closest in time to the 1985 starting point for the analysis in the preceding section. Although they are updates of data collected in 1969, the BLS updates
21 See “A century of family budgets in the United States” by David S. Johnson, John M. Rogers, and Lucilla Tan in Monthly Labor Review, May 2001, pp. 28-45. 22 The authors thank Louise Campbell and John Rogers of BLS for their help in obtaining the family budget data.
37
are preferable to those the authors could make. And the 1981 budgets include line items for taxes and other non-consumption expenditures, so that the full budgets equal the income that the 30-percent standard would be applied to. The 1969 report has budgets that correspond to disposable (after tax) income rather than personal (pre-tax) income.
According to the BLS budget, expenditures on housing would average substantially less than 30 percent. For the low-level budget, all housing costs equal 14 percent of income. For the intermediate and high-level budgets, the percentages were 17 percent and 15 percent, respectively. These percentages call the 30-percent standard into question. If other expenditures (including taxes) account for approximately 85 percent of income, perhaps the 30-percent standard does not allow for enough non-housing consumption.
To investigate this possibility, the authors used data obtained from BLS to update the lower-level expenditures on non-housing, taxes, and other items to 2005 dollars. The updated amount is $27,013.23 Looking at Tables 7 through 10, it appears that, in general, moderate income households and households with lower incomes would not be able to afford this expenditure while still paying 30 percent of their income for housing. However, there are two exceptions to this conclusion, one of which is very important. Moderate income households with children and moderate income households with Hispanic householders could afford this level of non-housing expenditures. The exception for households with children is important because the BLS family budgets are defined for households with children.24 Also, it is important to keep in mind that, as a result of the Tax Reform Act of 1986, tax rates for lower income households are typically lower today than in 1981.
Given the weaknesses inherent in using the BLS family budgets as a standard for minimal consumption, only a tentative conclusion can be drawn. For the household type closest to the family type used by BLS, it appears that moderate income and higher-level income households of this type could afford the lower level of non-housing expenditures while allocating 30 percent of their income to housing. Households with children with less than moderate income apparently could not afford the lower level of non-housing expenditures. Low-income households with children fall close to $4,000 short of being able to afford $27,013 for non-housing goods and services and taxes. However, actual taxes might be lower in 2005, and the average household with children in 2005 contains fewer than four members and therefore may not need as many non-housing goods and services.25
Table 13 reports actual housing and non-housing expenditures in 2005 for households with children. The BLS lower-level budget for shelter appears low by 2005 standards.
23 To obtain this estimate, the authors subtracted shelter costs from family income (both from the 1981 lower-level budget) and multiplied the difference by the ratio of the CPI (all items except shelter) in 2005 to the same CPI in 1981. 24 The budgets assume a family consisting of “an employed husband, age 38, a wife not employed outside the home, an 8 year-old girl, and a 13 year-old boy.” 25 In 2005, a household of the type the BLS used for the family budgets would pay no income taxes on incomes less than $22,800 and would pay 10 percent on all income between $22,800 and $37,400. Earners in these households would pay Social Security and Medicare taxes.
38
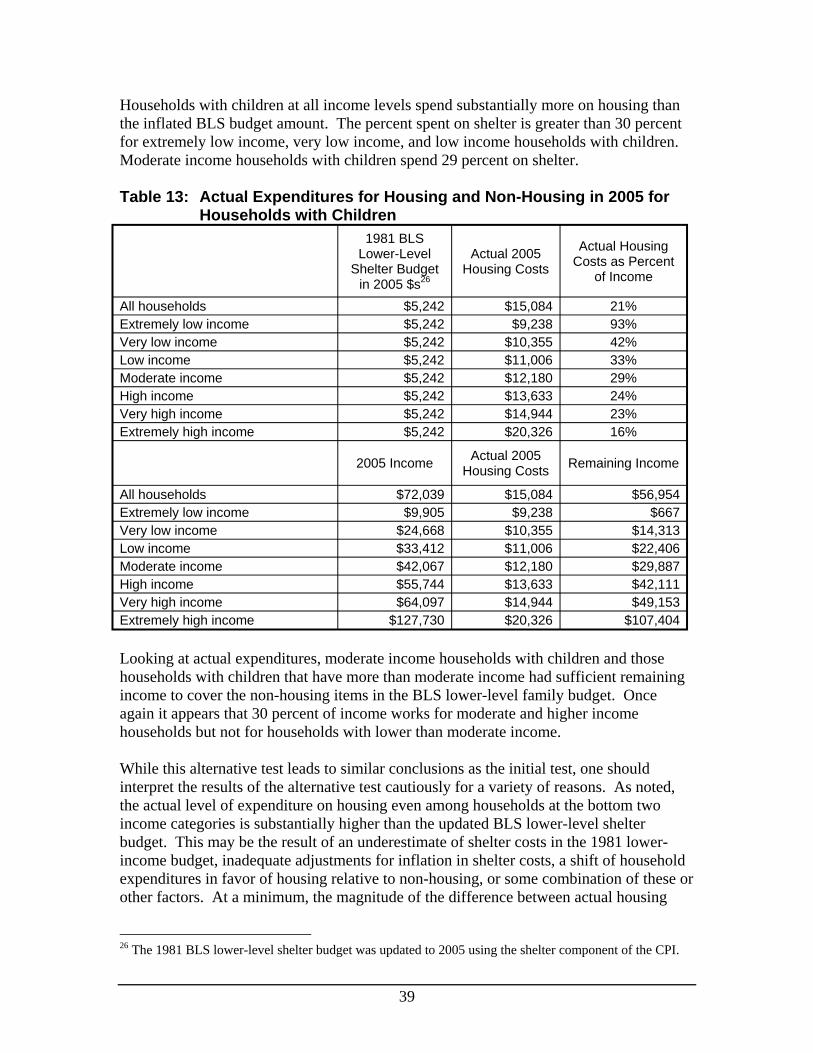
Households with children at all income levels spend substantially more on housing than the inflated BLS budget amount. The percent spent on shelter is greater than 30 percent for extremely low income, very low income, and low income households with children. Moderate income households with children spend 29 percent on shelter.
Table 13: Actual Expenditures for Housing and Non-Housing in 2005 for Households with Children
1981 BLS Lower-Level
Shelter Budget in 2005 $s26
Actual 2005 Housing Costs
Actual Housing Costs as Percent
of Income
All households $5,242 $15,084 21% Extremely low income $5,242 $9,238 93% Very low income $5,242 $10,355 42% Low income $5,242 $11,006 33% Moderate income $5,242 $12,180 29% High income $5,242 $13,633 24% Very high income $5,242 $14,944 23% Extremely high income $5,242 $20,326 16%
2005 Income Actual 2005 Housing Costs Remaining Income
All households $72,039 $15,084 $56,954 Extremely low income $9,905 $9,238 $667 Very low income $24,668 $10,355 $14,313 Low income $33,412 $11,006 $22,406 Moderate income $42,067 $12,180 $29,887 High income $55,744 $13,633 $42,111 Very high income $64,097 $14,944 $49,153 Extremely high income $127,730 $20,326 $107,404
Looking at actual expenditures, moderate income households with children and those households with children that have more than moderate income had sufficient remaining income to cover the non-housing items in the BLS lower-level family budget. Once again it appears that 30 percent of income works for moderate and higher income households but not for households with lower than moderate income.
While this alternative test leads to similar conclusions as the initial test, one should interpret the results of the alternative test cautiously for a variety of reasons. As noted, the actual level of expenditure on housing even among households at the bottom two income categories is substantially higher than the updated BLS lower-level shelter budget. This may be the result of an underestimate of shelter costs in the 1981 lower-income budget, inadequate adjustments for inflation in shelter costs, a shift of household expenditures in favor of housing relative to non-housing, or some combination of these or other factors. At a minimum, the magnitude of the difference between actual housing
26 The 1981 BLS lower-level shelter budget was updated to 2005 using the shelter component of the CPI.
39
expenditures and the updated shelter component should be seen as a weakness in the analysis. In addition, the reader should remember that BLS did not intend for the lower-level budget to be interpreted as a poverty-level budget.
40