Embed Size (px)
Citation preview
Download this presentation
1. Go to www.HotelNewsNow.com
2. Click “STR Data Presentations”
3. Select “STAY WYSE 2019: Hostel Performance” to download.
AGENDA
1. Who we are
2. London spotlight
3. Amsterdam spotlight
4. Key takeaways

Who we are
Nashville, TN
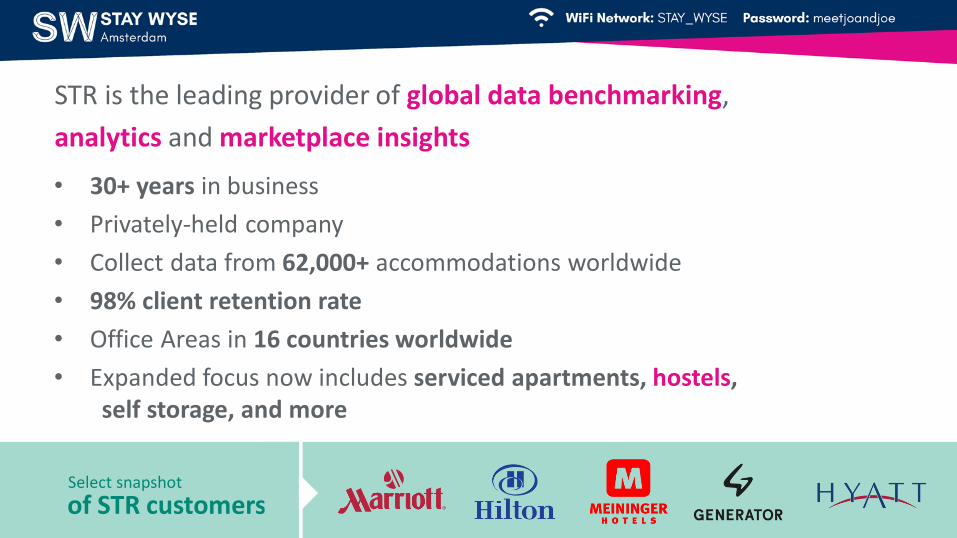
• 30+ years in business
• Privately-held company
• Collect data from 62,000+ accommodations worldwide
• 98% client retention rate
• Office Areas in 16 countries worldwide
• Expanded focus now includes serviced apartments, hostels,self storage, and more
STR is the leading provider of global data benchmarking,
analytics and marketplace insights
of STR customers Select snapshot

STR Locations:
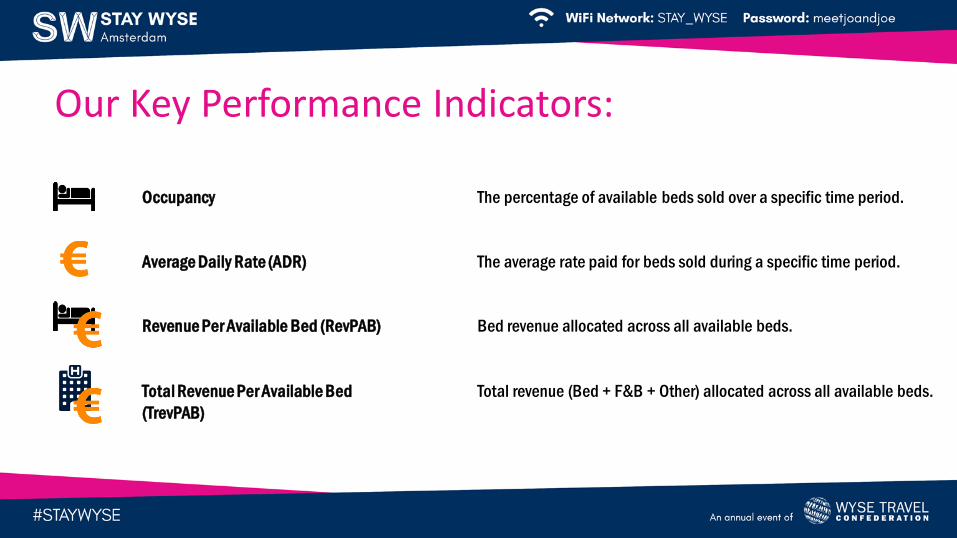
Our Key Performance Indicators:
MYTHS
Occupancy The percentage of available beds sold over a specific time period.
Average Daily Rate (ADR) The average rate paid for beds sold during a specific time period.
Revenue Per Available Bed (RevPAB) Bed revenue allocated across all available beds.
Total Revenue Per Available Bed Total revenue (Bed + F&B + Other) allocated across all available beds.
(TrevPAB)
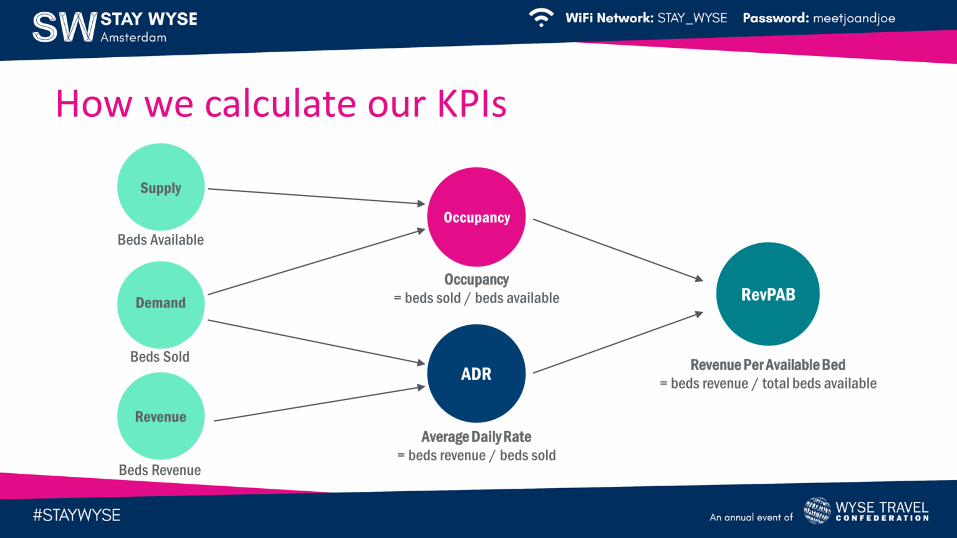
How we calculate our KPIs
Supply
Revenue
Demand
Occupancy
ADR
RevPAB
Beds Available
Beds Sold
Beds Revenue
Occupancy
= beds sold / beds available
Average Daily Rate
= beds revenue / beds sold
Revenue Per Available Bed
= beds revenue / total beds available
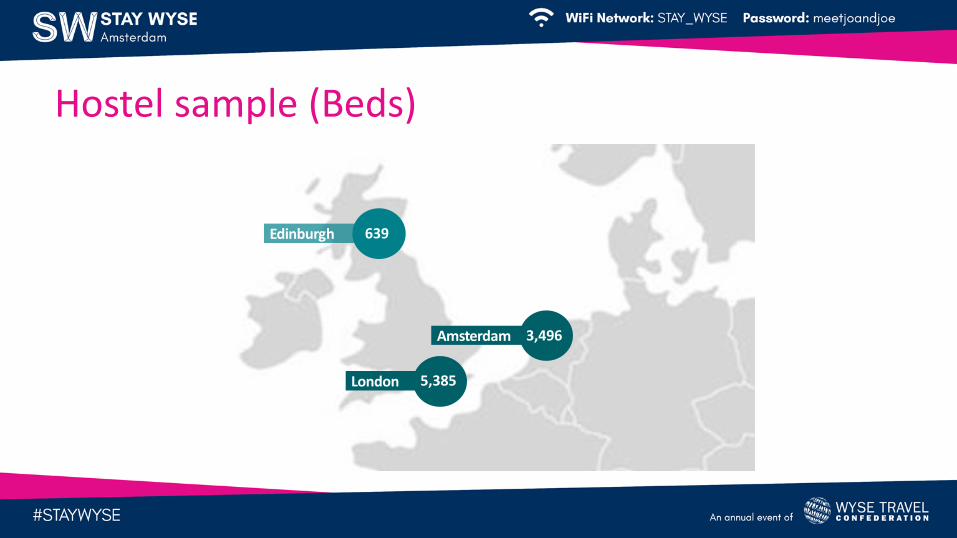
Hostel sample (Beds)
London 5,385
Amsterdam 3,496
Edinburgh 639

London Overview
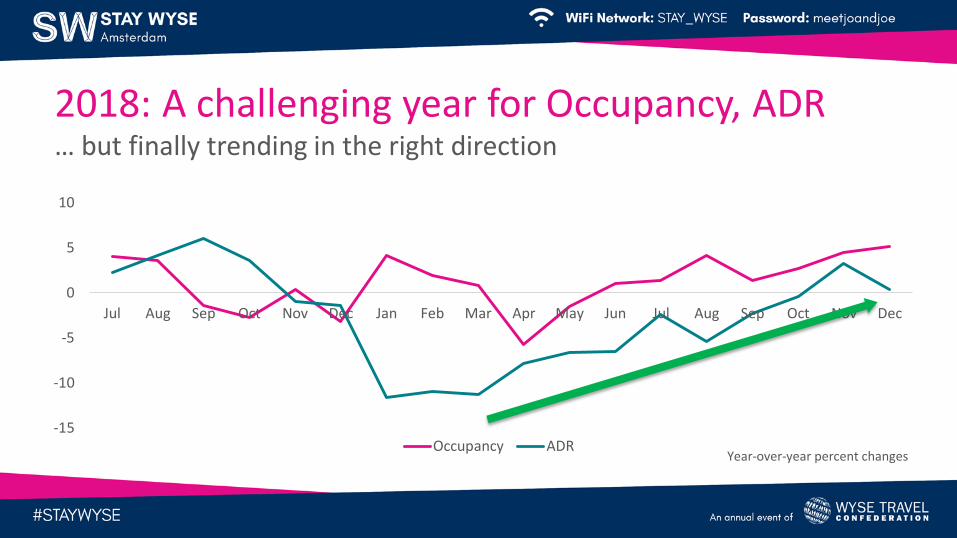
2018: A challenging year for Occupancy, ADR… but finally trending in the right direction
-15
-10
-5
0
5
10
Jul Aug Sep Oct Nov Dec Jan Feb Mar Apr May Jun Jul Aug Sep Oct Nov Dec
Occupancy ADRYear-over-year percent changes
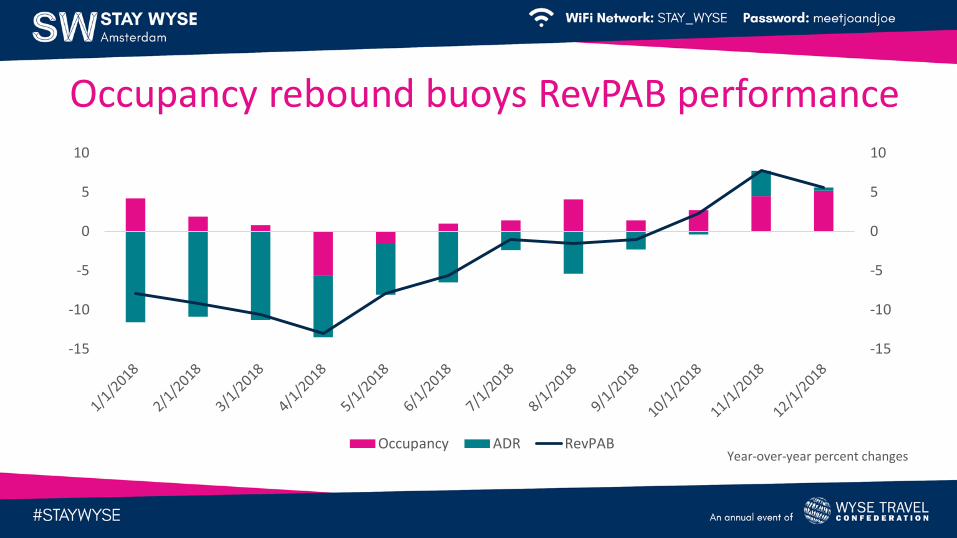
Occupancy rebound buoys RevPAB performance
-15
-10
-5
0
5
10
-15
-10
-5
0
5
10
Occupancy ADR RevPABYear-over-year percent changes
Occupancy ADR RevPAB TrevPAB
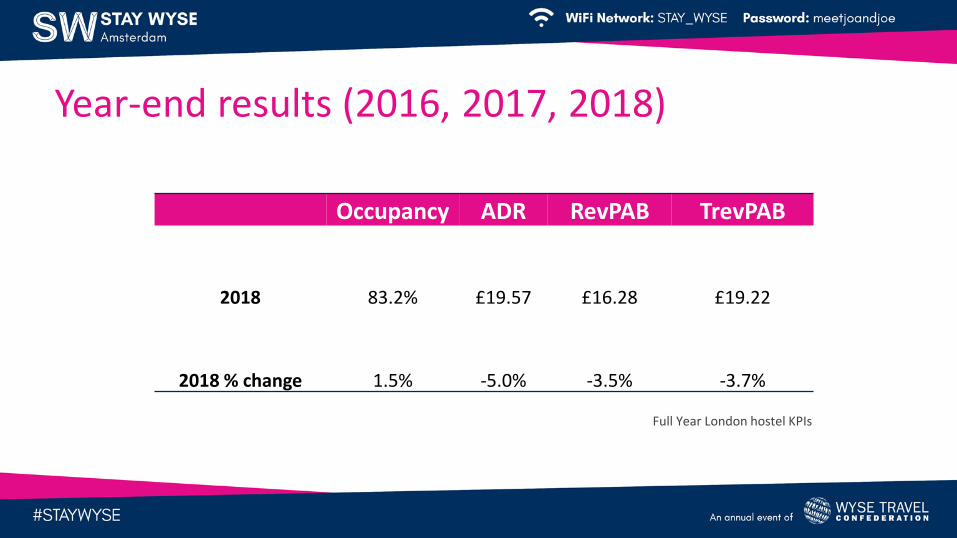
2018 83.2% £19.57 £16.28 £19.22
2018 % change 1.5% -5.0% -3.5% -3.7%
Full Year London hostel KPIs
Year-end results (2016, 2017, 2018)
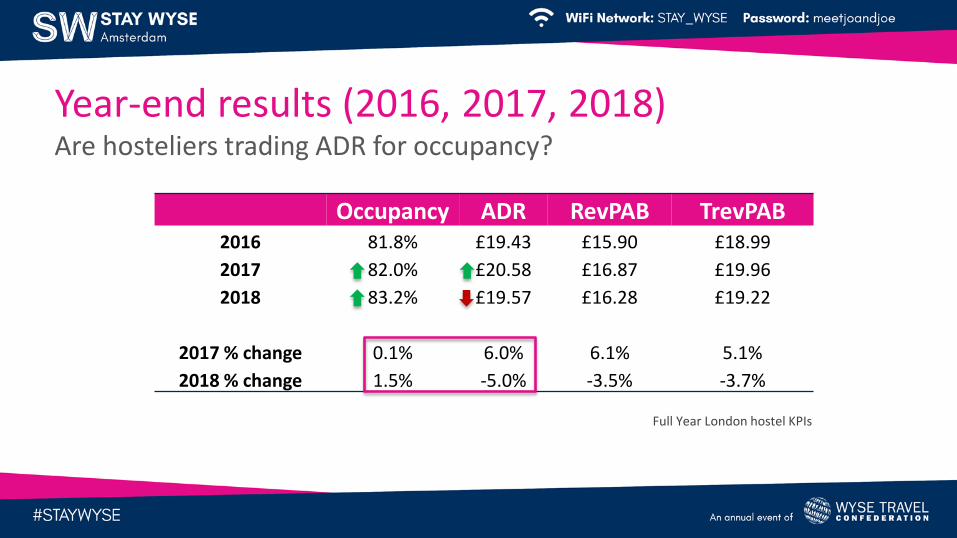
Occupancy ADR RevPAB TrevPAB2016 81.8% £19.43 £15.90 £18.99
2017 82.0% £20.58 £16.87 £19.96
2018 83.2% £19.57 £16.28 £19.22
2017 % change 0.1% 6.0% 6.1% 5.1%
2018 % change 1.5% -5.0% -3.5% -3.7%
Year-end results (2016, 2017, 2018)Are hosteliers trading ADR for occupancy?
Full Year London hostel KPIs
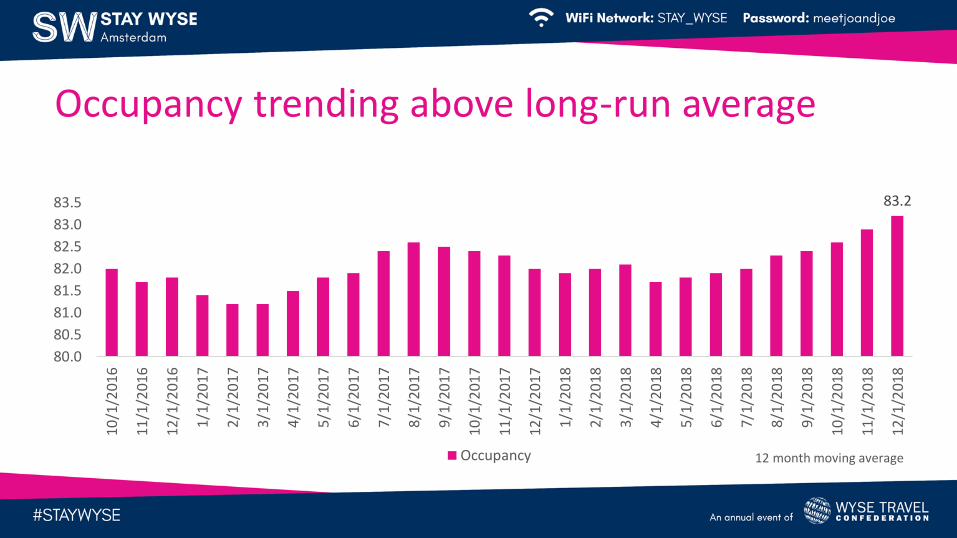
Occupancy trending above long-run average
83.2
80.0
80.5
81.0
81.5
82.0
82.5
83.0
83.5
10/1
/201
6
11/1
/201
6
12/1
/201
6
1/1/
2017
2/1/
2017
3/1/
2017
4/1/
2017
5/1/
2017
6/1/
2017
7/1/
2017
8/1/
2017
9/1/
2017
10/1
/201
7
11/1
/201
7
12/1
/201
7
1/1/
2018
2/1/
2018
3/1/
2018
4/1/
2018
5/1/
2018
6/1/
2018
7/1/
2018
8/1/
2018
9/1/
2018
10/1
/201
8
11/1
/201
8
12/1
/201
8
Occupancy 12 month moving average
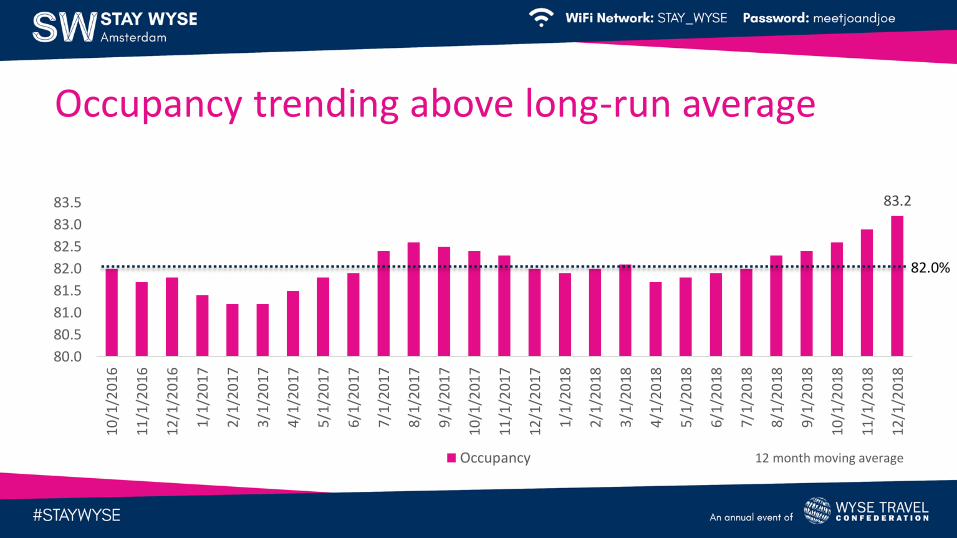
82.0%
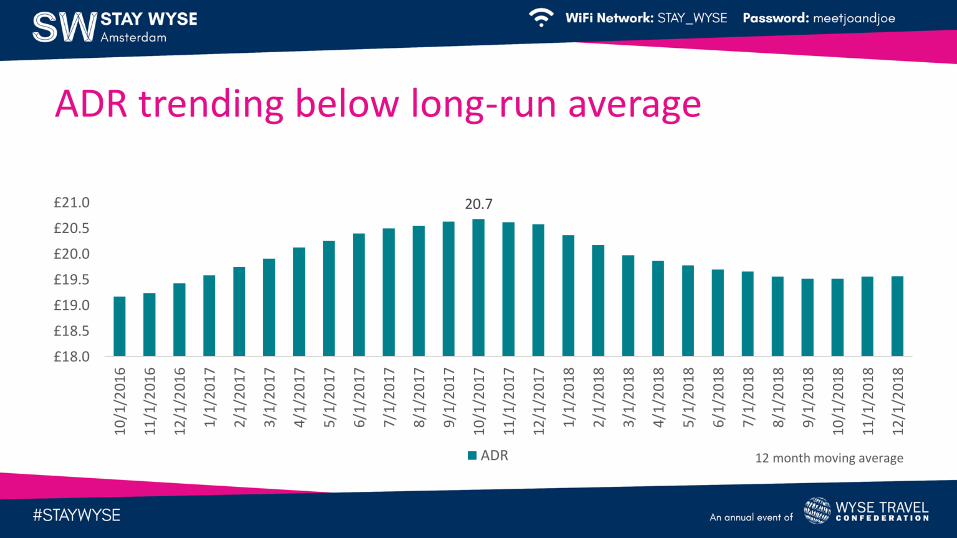
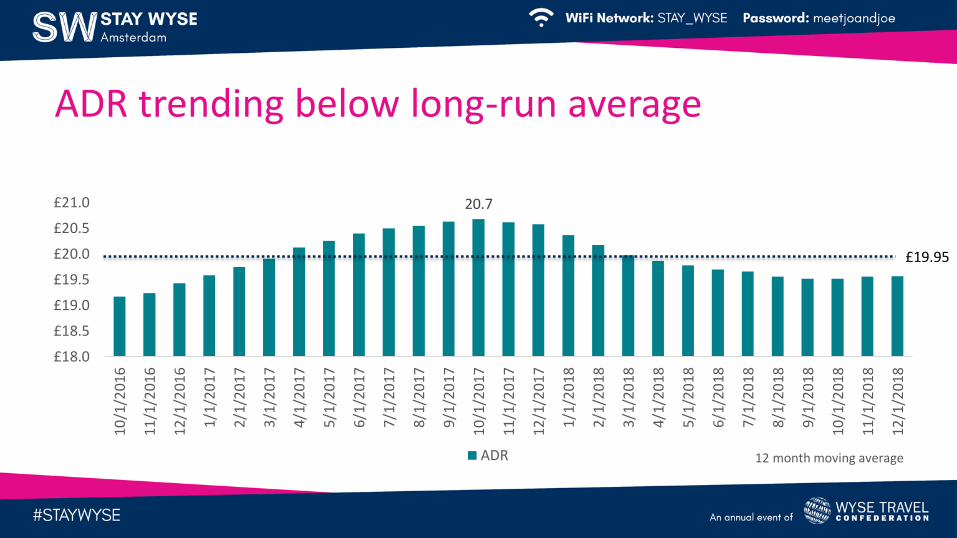
ADR trending below long-run average
20.7
£18.0
£18.5
£19.0
£19.5
£20.0
£20.5
£21.0
10/1
/201
6
11/1
/201
6
12/1
/201
6
1/1/
2017
2/1/
2017
3/1/
2017
4/1/
2017
5/1/
2017
6/1/
2017
7/1/
2017
8/1/
2017
9/1/
2017
10/1
/201
7
11/1
/201
7
12/1
/201
7
1/1/
2018
2/1/
2018
3/1/
2018
4/1/
2018
5/1/
2018
6/1/
2018
7/1/
2018
8/1/
2018
9/1/
2018
10/1
/201
8
11/1
/201
8
12/1
/201
8
ADR 12 month moving average
ADR trending below long-run average
20.7
£18.0
£18.5
£19.0
£19.5
£20.0
£20.5
£21.0
10/1
/201
6
11/1
/201
6
12/1
/201
6
1/1/
2017
2/1/
2017
3/1/
2017
4/1/
2017
5/1/
2017
6/1/
2017
7/1/
2017
8/1/
2017
9/1/
2017
10/1
/201
7
11/1
/201
7
12/1
/201
7
1/1/
2018
2/1/
2018
3/1/
2018
4/1/
2018
5/1/
2018
6/1/
2018
7/1/
2018
8/1/
2018
9/1/
2018
10/1
/201
8
11/1
/201
8
12/1
/201
8
ADR
£19.95
12 month moving average
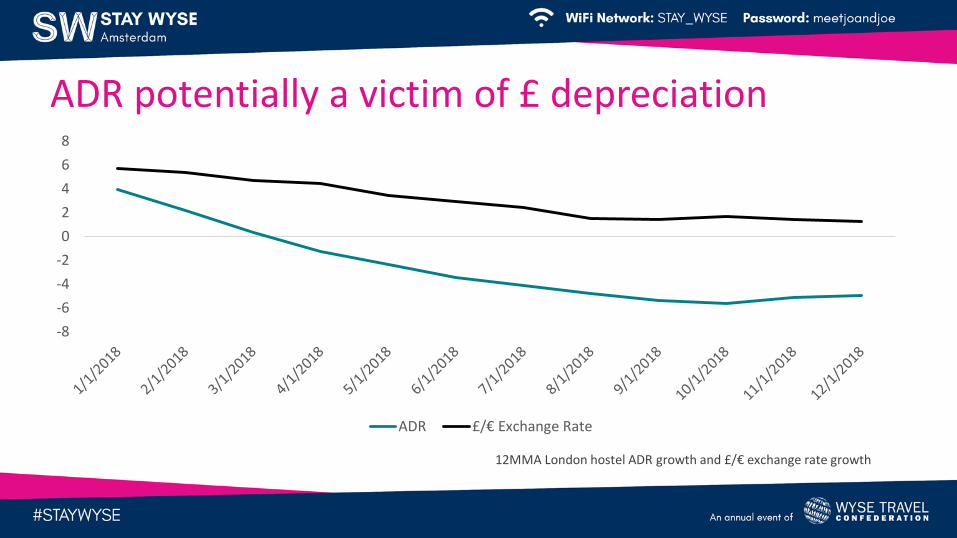
ADR potentially a victim of £ depreciation
-8
-6
-4
-2
0
2
4
6
8
ADR £/€ Exchange Rate
12MMA London hostel ADR growth and £/€ exchange rate growth
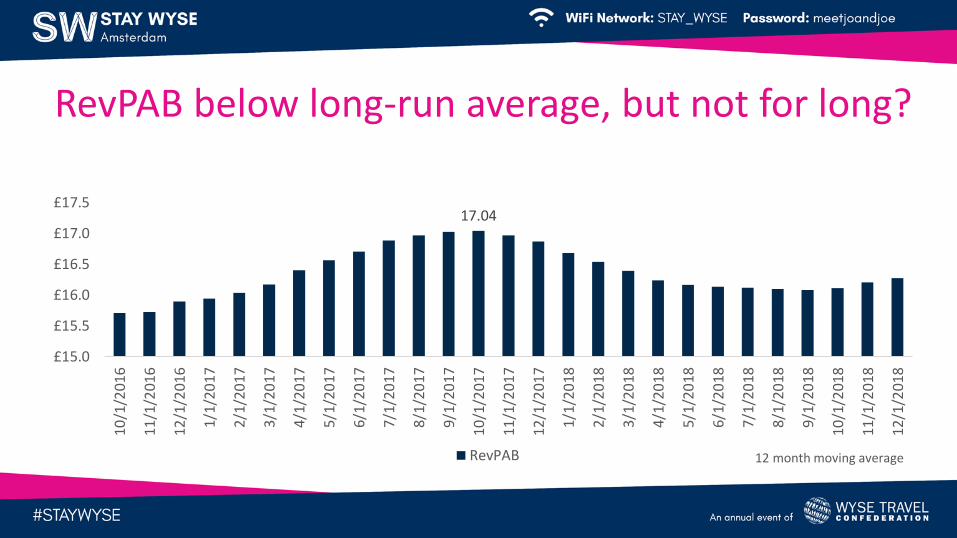
RevPAB below long-run average, but not for long?
17.04
£15.0
£15.5
£16.0
£16.5
£17.0
£17.5
10/1
/201
6
11/1
/201
6
12/1
/201
6
1/1/
2017
2/1/
2017
3/1/
2017
4/1/
2017
5/1/
2017
6/1/
2017
7/1/
2017
8/1/
2017
9/1/
2017
10/1
/201
7
11/1
/201
7
12/1
/201
7
1/1/
2018
2/1/
2018
3/1/
2018
4/1/
2018
5/1/
2018
6/1/
2018
7/1/
2018
8/1/
2018
9/1/
2018
10/1
/201
8
11/1
/201
8
12/1
/201
8
RevPAB 12 month moving average

RevPAB below long-run average, but not for long?
17.04
£15.0
£15.5
£16.0
£16.5
£17.0
£17.5
10/1
/201
6
11/1
/201
6
12/1
/201
6
1/1/
2017
2/1/
2017
3/1/
2017
4/1/
2017
5/1/
2017
6/1/
2017
7/1/
2017
8/1/
2017
9/1/
2017
10/1
/201
7
11/1
/201
7
12/1
/201
7
1/1/
2018
2/1/
2018
3/1/
2018
4/1/
2018
5/1/
2018
6/1/
2018
7/1/
2018
8/1/
2018
9/1/
2018
10/1
/201
8
11/1
/201
8
12/1
/201
8
RevPAB
£16.37
12 month moving average
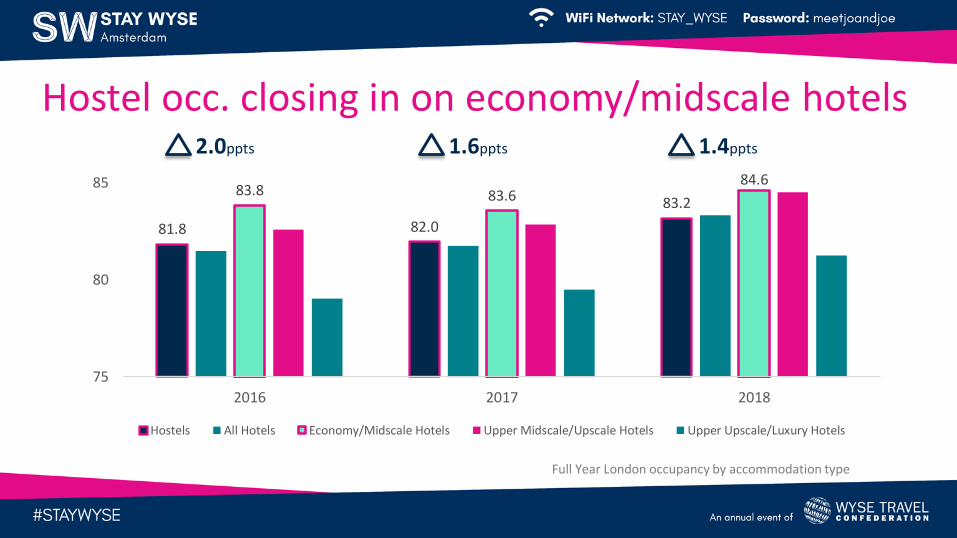
Hostel occ. closing in on economy/midscale hotels
81.8 82.0
83.283.8 83.6
84.6
75
80
85
2016 2017 2018
Hostels All Hotels Economy/Midscale Hotels Upper Midscale/Upscale Hotels Upper Upscale/Luxury Hotels
Full Year London occupancy by accommodation type
2.0ppts 1.6ppts 1.4ppts

2018 not the best year for pricing power
6.0
-5.0
2.2
0.0
-6
-4
-2
0
2
4
6
8
2017 2018
Hostels All Hotels Economy/Midscale Hotels Upper Midscale/Upscale Hotels Upper Upscale/Luxury Hotels
Full Year London occupancy by accommodation type

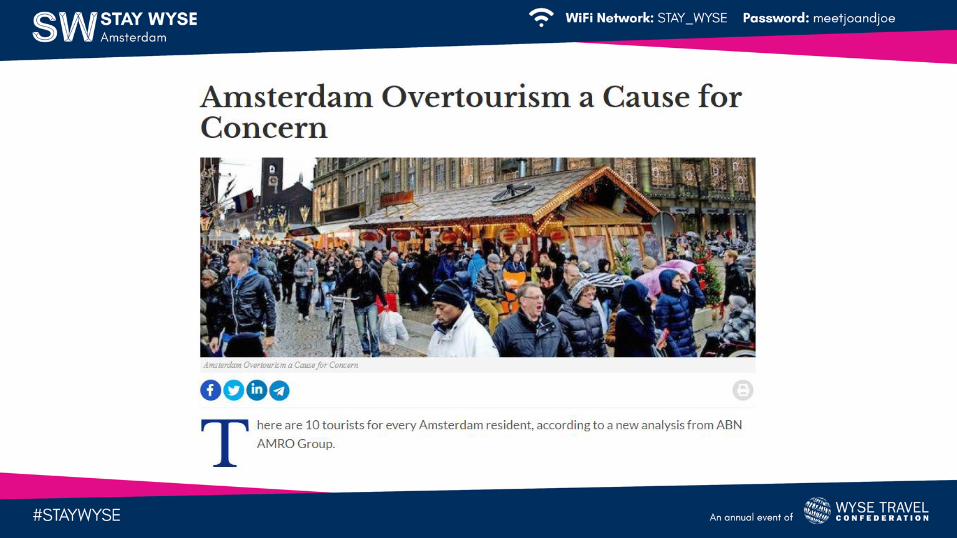
Amsterdam Overview
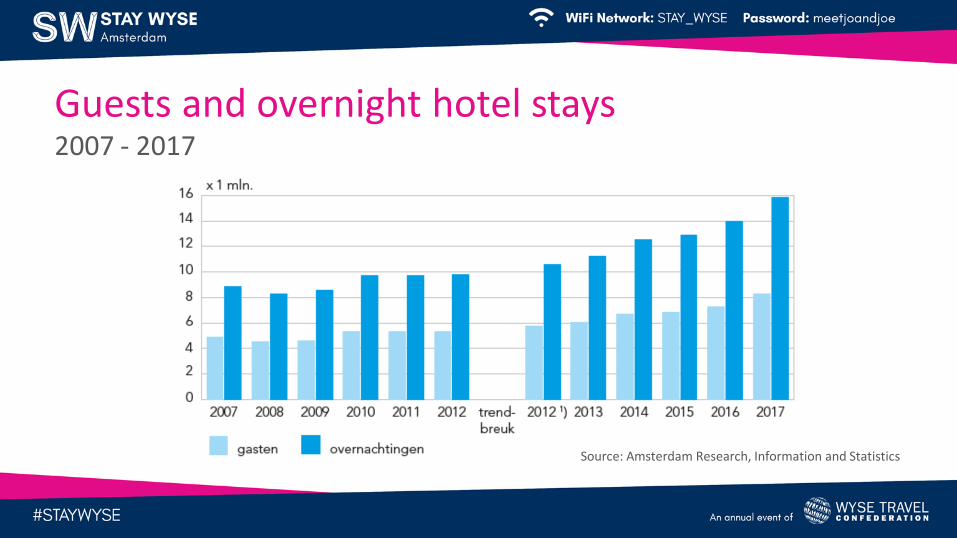
Guests and overnight hotel stays2007 - 2017
Source: Amsterdam Research, Information and Statistics

2018: Flat occupancy growth belies healthy market
-10
-5
0
5
10
15
Jul Aug Sep Oct Nov Dec Jan Feb Mar Apr May Jun Jul Aug Sep Oct Nov Dec
OccupancyYear-over-year percent changes
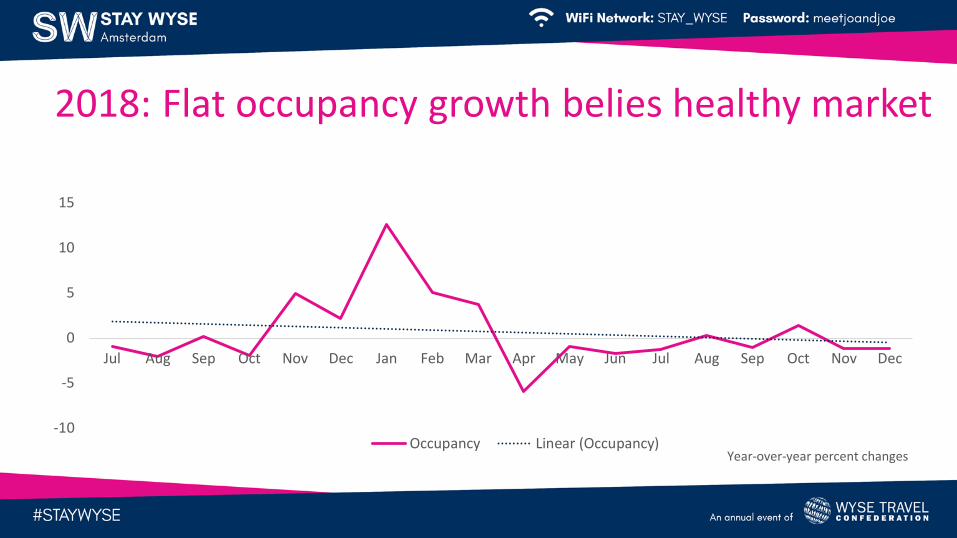
2018: Flat occupancy growth belies healthy market
-10
-5
0
5
10
15
Jul Aug Sep Oct Nov Dec Jan Feb Mar Apr May Jun Jul Aug Sep Oct Nov Dec
Occupancy Linear (Occupancy)Year-over-year percent changes
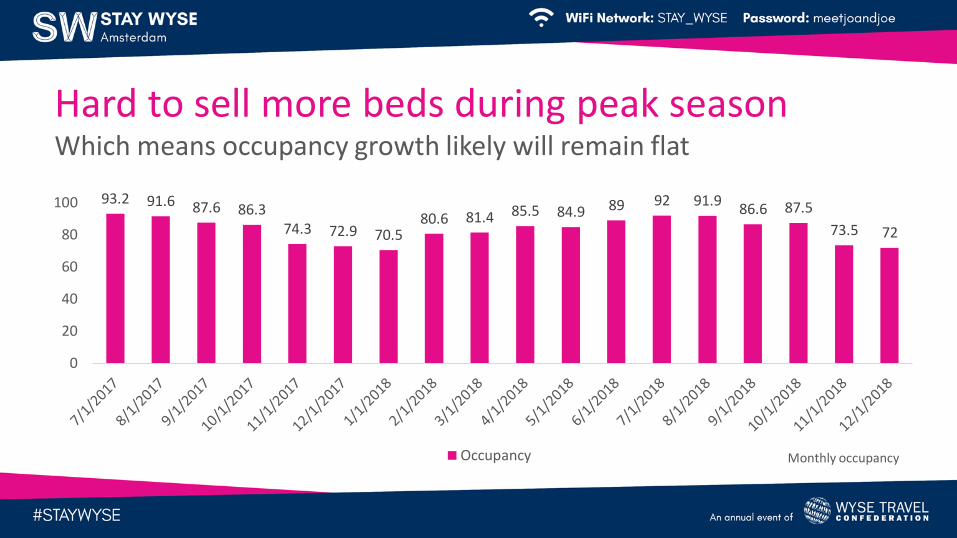
93.2 91.6 87.6 86.374.3 72.9 70.5
80.6 81.4 85.5 84.9 89 92 91.986.6 87.5
73.5 72
0
20
40
60
80
100
Occupancy Monthly occupancy
Hard to sell more beds during peak seasonWhich means occupancy growth likely will remain flat
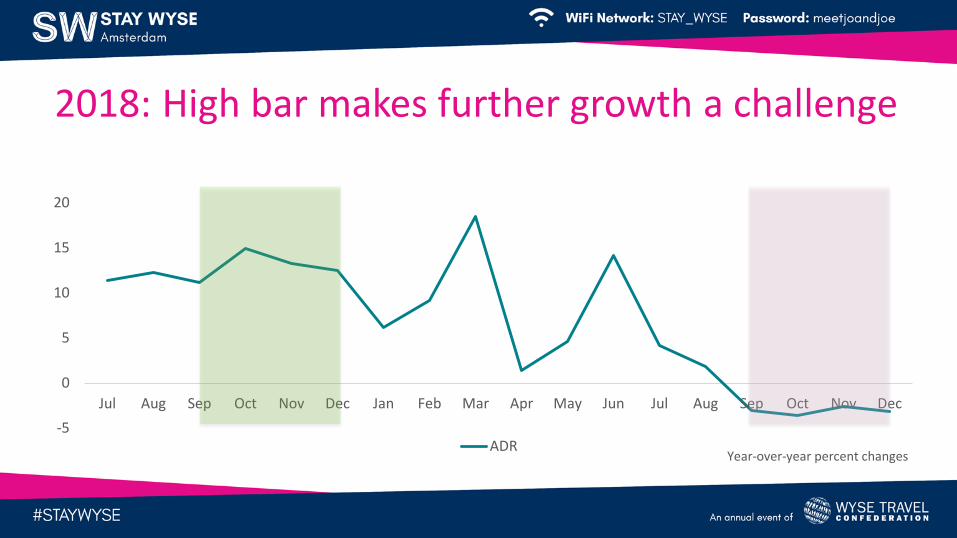
2018: High bar makes further growth a challenge
-5
0
5
10
15
20
Jul Aug Sep Oct Nov Dec Jan Feb Mar Apr May Jun Jul Aug Sep Oct Nov Dec
ADRYear-over-year percent changes
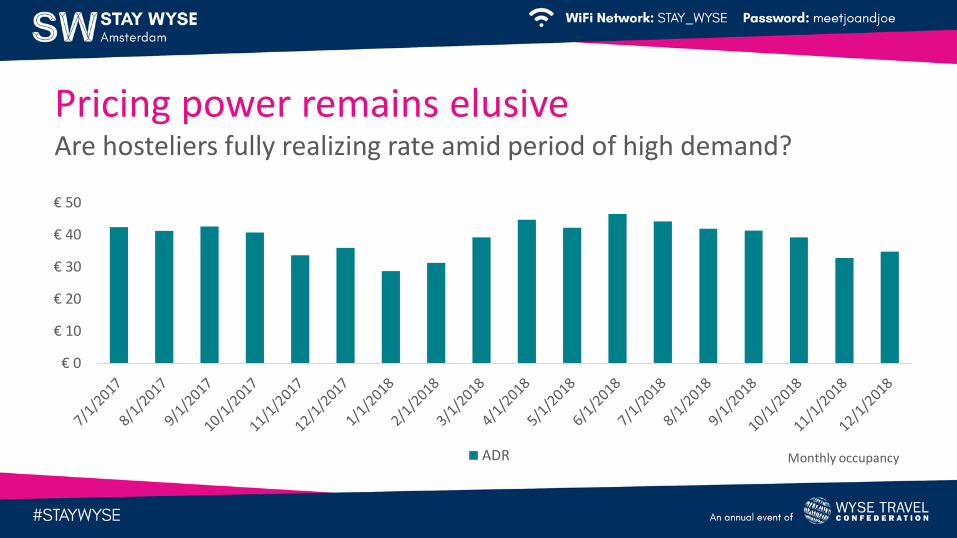
€ 0
€ 10
€ 20
€ 30
€ 40
€ 50
ADR Monthly occupancy
Pricing power remains elusiveAre hosteliers fully realizing rate amid period of high demand?
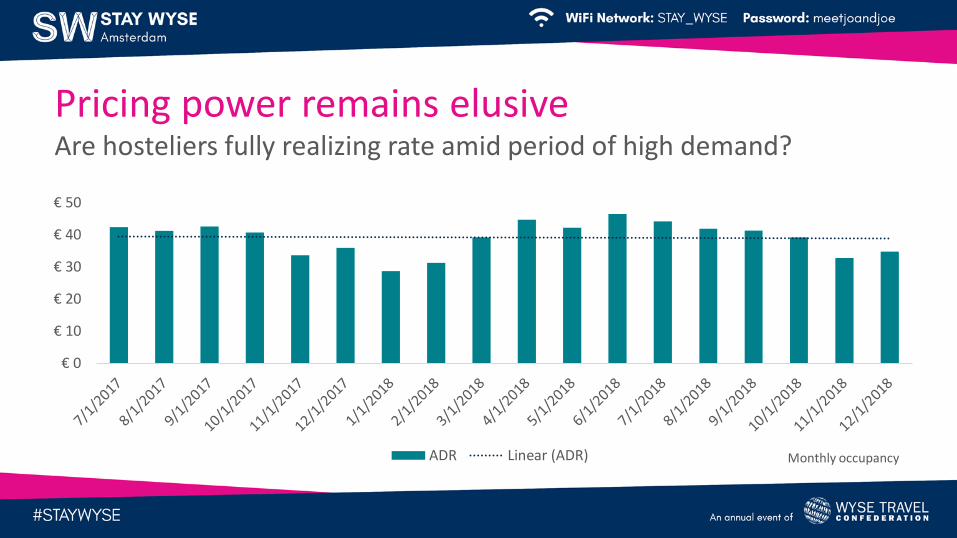
€ 0
€ 10
€ 20
€ 30
€ 40
€ 50
ADR Linear (ADR) Monthly occupancy
Pricing power remains elusiveAre hosteliers fully realizing rate amid period of high demand?
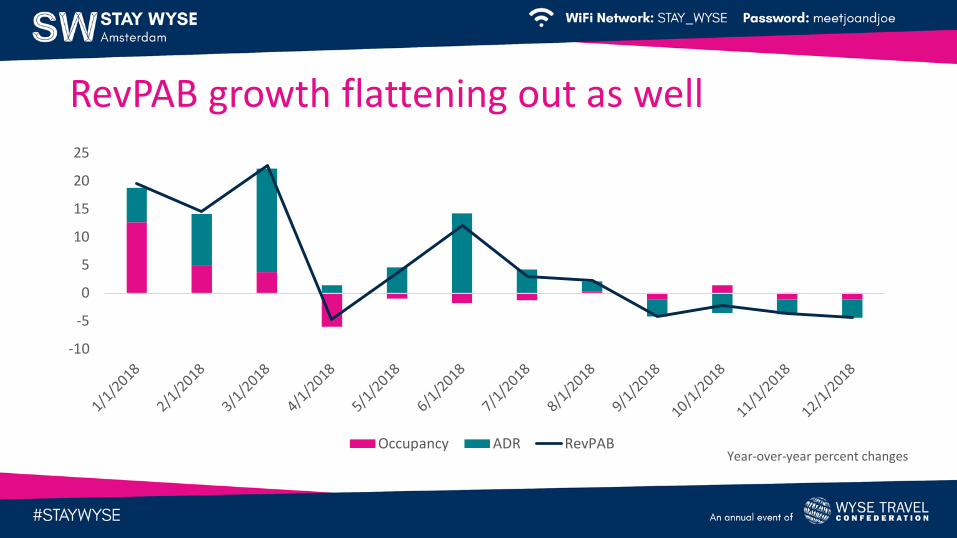
RevPAB growth flattening out as well
-10
-5
0
5
10
15
20
25
Occupancy ADR RevPABYear-over-year percent changes
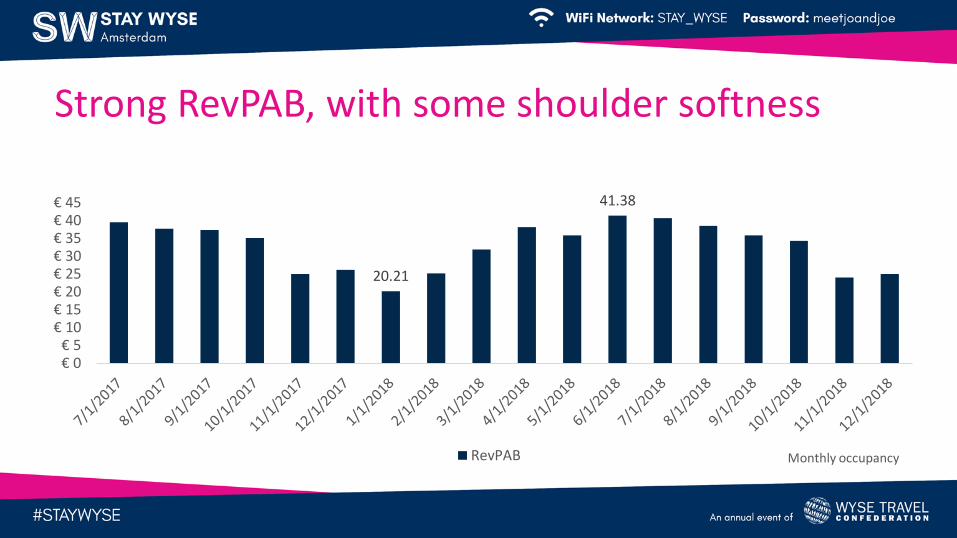
20.21
41.38
€ 0€ 5
€ 10€ 15€ 20€ 25€ 30€ 35€ 40€ 45
RevPAB Monthly occupancy
Strong RevPAB, with some shoulder softness
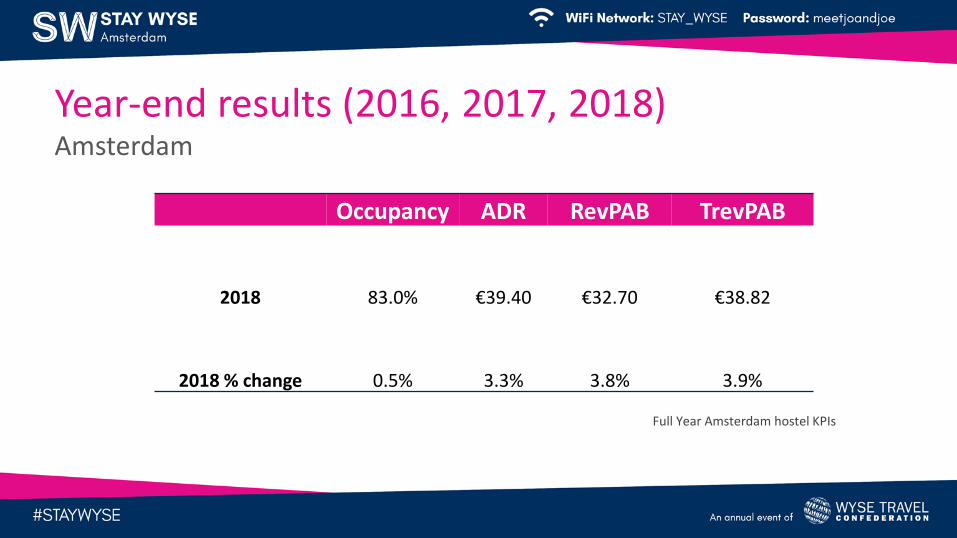
Occupancy ADR RevPAB TrevPAB
2018 83.0% €39.40 €32.70 €38.82
2018 % change 0.5% 3.3% 3.8% 3.9%
Full Year Amsterdam hostel KPIs
Year-end results (2016, 2017, 2018)Amsterdam
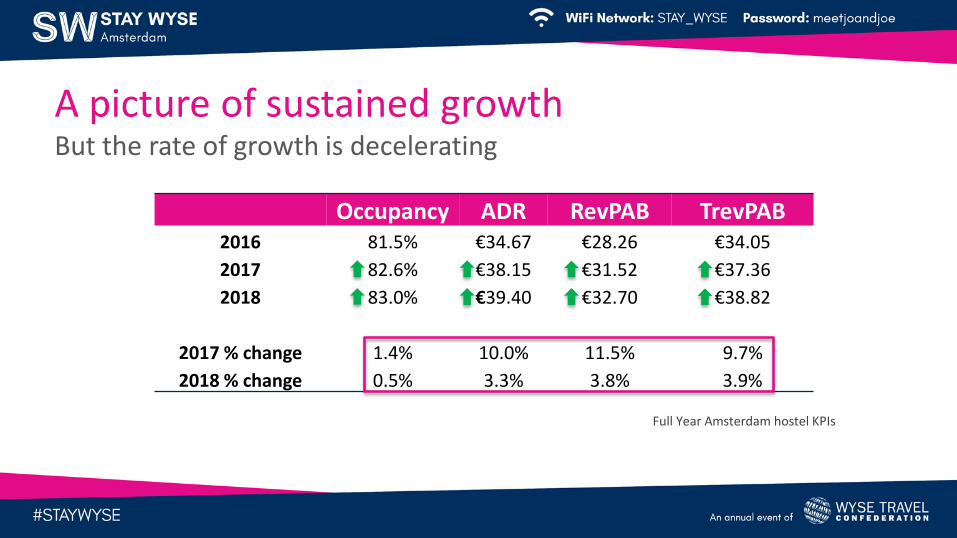
Occupancy ADR RevPAB TrevPAB2016 81.5% €34.67 €28.26 €34.05
2017 82.6% €38.15 €31.52 €37.36
2018 83.0% €39.40 €32.70 €38.82
2017 % change 1.4% 10.0% 11.5% 9.7%
2018 % change 0.5% 3.3% 3.8% 3.9%
Full Year Amsterdam hostel KPIs
A picture of sustained growthBut the rate of growth is decelerating

0
2
4
6
8
10
12
14
16
Occupancy ADR RevPAB TrevPAB
12MMA Amsterdam occupancy growth
Growth is decelerating across the boardOccupancy, ADR, RevPAB and TrevPAB

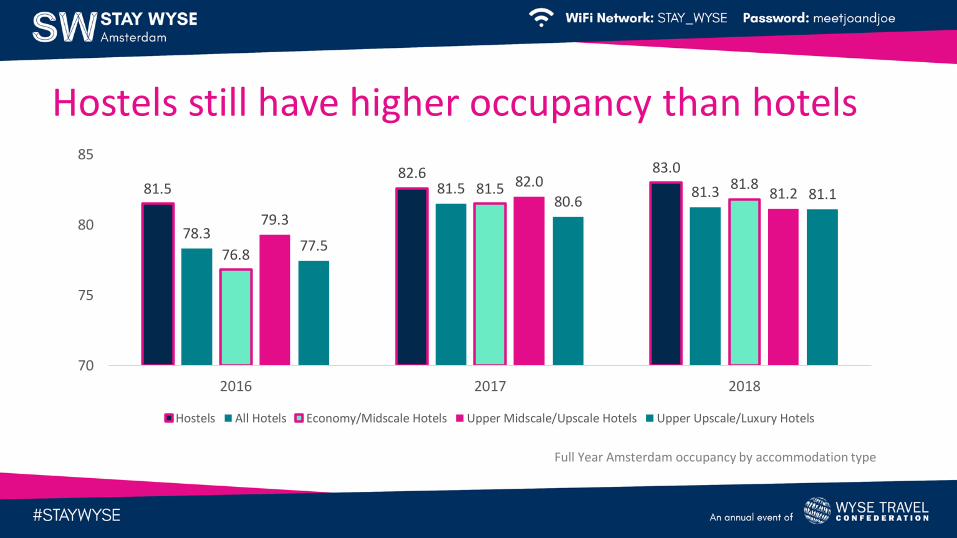
Hostels still have higher occupancy than hotels
81.582.6 83.0
78.3
81.5 81.3
76.8
81.5 81.8
79.3
82.081.2
77.5
80.6 81.1
70
75
80
85
2016 2017 2018
Hostels All Hotels Economy/Midscale Hotels Upper Midscale/Upscale Hotels Upper Upscale/Luxury Hotels
Full Year Amsterdam occupancy by accommodation type
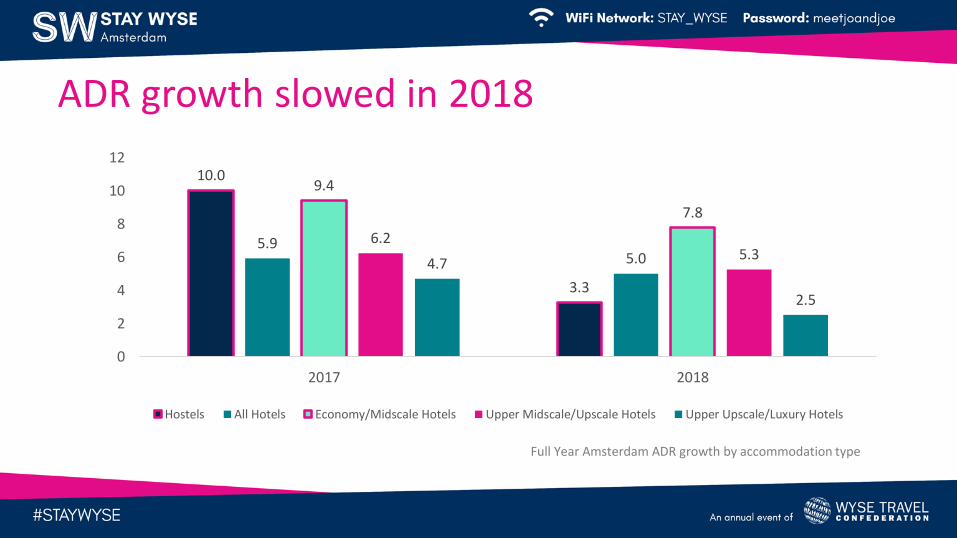
ADR growth slowed in 2018
10.0
3.3
5.95.0
9.4
7.8
6.25.3
4.7
2.5
0
2
4
6
8
10
12
2017 2018
Hostels All Hotels Economy/Midscale Hotels Upper Midscale/Upscale Hotels Upper Upscale/Luxury Hotels
Full Year Amsterdam ADR growth by accommodation type
Takeaways
1. Decreases in London ADR have outweighed any gains made in occupancy.
2. Unprecedented demand in Amsterdam is fueling strong performance.
3. Amsterdam: Hosteliers are nearing capacity in occupancy, which means ADR is the remaining growth vehicle.
4. ADR growth decelerated (or went negative) in both markets during 2018.
5. Fundamentals are strong going into 2019, although various market factors could impede performance.
Download our free report
Visit strglobal.com/hostel-performance-trends to download our free report.