Embed Size (px)
Citation preview

Trends in Higher Education Series
Education Pays 2013The Benefits of Higher Education for Individuals and Society
Sandy BaumJennifer MaKathleen Payea

Part 1: Individual and Societal Benefits2 EDUCATION PAYS 2013
© 2013 The College Board. College Board, Advanced Placement, Advanced Placement Program, SAT and the acorn logo are registered trademarks of the College Board. All other products and services may be trademarks of their respective owners. Visit the College Board on the Web: www.collegeboard.org.
About the College Board The College Board is a mission-driven not-for-profit organization that connects
students to college success and opportunity. Founded in 1900, the College
Board was created to expand access to higher education. Today, the membership
association is made up of over 6,000 of the world’s leading educational institutions
and is dedicated to promoting excellence and equity in education. Each year, the
College Board helps more than seven million students prepare for a successful
transition to college through programs and services in college readiness and
college success — including the SAT® and the Advanced Placement Program®.
The organization also serves the education community through research and
advocacy on behalf of students, educators and schools. For further information,
visit www.collegeboard.org.
Trends in Higher Education
The Trends in Higher Education publications include the Trends in College Pricing,
Trends in Student Aid, and Education Pays series in addition to How College Shapes
Lives: Understanding the Issues and other research reports and topical analysis
briefs published periodically. These reports are designed to provide a foundation of
evidence to strengthen policy discussions and decisions.
In addition to the figures and tables included in this report, more information and
data can be found on the Trends in Higher Education website.
trends.collegeboard.org
About the Authors Sandy Baum
Research Professor, George Washington University Graduate School of Education and Human Development and Senior Fellow, the Urban Institute
Jennifer Ma
Independent Consultant for the College Board
Kathleen Payea
Policy Analyst, the College Board
For inquiries or ordering hard copies, please contact: [email protected]

EDUCATION PAYS 2013 3 For detailed data, see: trends.collegeboard.org.
Contents
5 Executive Summary
7 Introduction
10 Part 1: Individual and Societal Benefits of Higher Education
Earnings
11 Education, Earnings, and Tax Payments
FIGURE 1.1 Median Earnings and Tax Payments by Education Level, 2011
12 Lifetime Earnings FIGURE 1.2 Lifetime Earnings Relative to High School Graduates by Education Level
13 Earnings Premium Relative to Price of Education
FIGURE 1.3 Cumulative Earnings Net of Loan Repayment for Tuition and Fees, by Education Level
14 Earnings by Race/Ethnicity, Gender, and Education Level
FIGURE 1.4 Median Earnings by Race/Ethnicity, Gender, and Education Level, 2009–2011
15 Earnings by Gender and Education Level
FIGURE 1.5 Median, 25th Percentile, and 75th Percentile Earnings by Gender and Education Level, 2011
16 Earnings over Time by Gender and Education Level
FIGURE 1.6 Median Earnings by Gender and Education Level, 1971–2011
17 Earnings Paths FIGURE 1.7A Median Earnings of Full-Time Workers by Age and Education Level, 2009–2011
FIGURE 1.7B Median Earnings of All Workers by Age and Education Level, 2009–2011
Other Economic Benefits
18 Employment FIGURE 1.8A Number Employed, Unemployed, and Not in the Labor Force by Education Level, 2002, 2007, and 2012
FIGURE 1.8B Labor Force Participation Rates by Age and Education Level, 2012
19 Unemployment FIGURE 1.9A Unemployment Rates by Education Level, 1992−2012
20 Unemployment FIGURE 1.9B Unemployment Rates by Age and Education Level, 2012
FIGURE 1.9C Unemployment Rates by Race/Ethnicity and Education Level, 2012
21 Job Satisfaction FIGURE 1.10A Sense of Learning New Things on the Job by Education Level, 2002, 2006, and 2010
FIGURE 1.10B Work Satisfaction Rates by Education Level, 1972–2012
22 Social Mobility FIGURE 1.11 Family Income Quintiles by Education and Parents’ Family Income, 2000–2008
23 Pension Plans FIGURE 1.12A Pension Plan Coverage by Education Level, 1991, 2001, and 2011
FIGURE 1.12B Participation Rates in Pension Plans by Education Level, 2011
24 Health Insurance FIGURE 1.13A Health Insurance Coverage of Full-Time Workers by Education Level, 1991, 2001, and 2011
FIGURE 1.13B Health Insurance Coverage of Part-Time Workers by Education Level, 1991, 2001, and 2011
25 Poverty FIGURE 1.14A Poverty Rates by Household Type and Education Level, 2011
FIGURE 1.14B Living Arrangements of Children by Poverty Status and Parents’ Education Level, 2011
26 Public Assistance Programs FIGURE 1.15 Public Assistance Program Participation Rates by Education Level, 2011
Health Benefits
27 Smoking FIGURE 1.16A Smoking Rates by Education Level, 1940–2012
FIGURE 1.16B Smoking Histories by Education Level, 2012
28 Exercise FIGURE 1.17A Exercise Rates by Age and Education Level, 2012
FIGURE 1.17B Participation in Aerobic Activities by Education Level, 2011
29 Obesity FIGURE 1.18A Adult Obesity Rates by Gender and Education Level, 1988–1994 and 2007–2010
FIGURE 1.18B Childhood Obesity Rates by Gender and Highest Education Level in the Household, 1988–1994 and 2007–2010

4 EDUCATION PAYS 2013
Contents — Continued
Other Individual and Societal Benefits
30 Parents and Children FIGURE 1.19A Time Mothers Spend on Children, by Employment Status and Education Level, 2003–2012
FIGURE 1.19B Time Mothers Spend on Children, by Type of Activity, Age of Youngest Child, Mother’s Employment Status and Education Level, 2003–2012
31 Civic Involvement FIGURE 1.20A Understanding of Political Issues by Education Level, 2012
FIGURE 1.20B Rates of Volunteering by Education Level, 2012
32 Voting FIGURE 1.21A Voting Rates by Age and Education Level, 2010 and 2012
FIGURE 1.21B Voting Patterns by Age and Education Level, 2012
33 Part 2: The Distribution of the Benefits: Who Participates and Succeeds in Higher Education?
College Enrollment
34 College Enrollment by Income
FIGURE 2.1 Enrollment Rates by Family Income, 1987–2012
35 College Enrollment by Race/Ethnicity
FIGURE 2.2A Enrollment Rates of Recent High School Graduates by Race/Ethnicity, 1974–2011
FIGURE 2.2B Enrollment Rates of All 18- to 24-Year-Olds by Race/Ethnicity, 1974–2011
36 College Enrollment by Gender and Age
FIGURE 2.3A Enrollment Rates of Recent High School Graduates and of All 18- to 24-Year-Olds by Gender, 1971–2011
FIGURE 2.3B Enrollment Rates of All 18- to 34-Year-Olds by Age, 1971–2011
37 Stratification Within Higher Education
FIGURE 2.4A Family Income by Postsecondary Sector, 2011-12
FIGURE 2.4B Postsecondary Sector by Family Income, 2011-12
38 Stratification Within Higher Education
FIGURE 2.5 Percentage of High School Seniors Academically Undermatched by Socioeconomic Status, 2004
Educational Attainment
39 Degrees and Certificates Awarded
FIGURE 2.6A Postsecondary Degrees and Certificates Awarded, 2011-12
FIGURE 2.6B Degrees and Certificates Awarded by Sector, 2011-12
FIGURE 2.6C Number of Certificates Awarded by Type, 2001-02 and 2011-12
40 College Completion FIGURE 2.7A Postsecondary Completion for Students Beginning Postsecondary Study in 2006
FIGURE 2.7B Postsecondary Completion by Dependency Status and Family Income, 1989-90, 1995-96, and 2003-04
41 Educational Attainment Over Time
FIGURE 2.8A Educational Attainment over Time, 1940–2012
FIGURE 2.8B Educational Attainment by Age Group, 2002 and 2012
42 Educational Attainment by Race/Ethicity and Gender
FIGURE 2.9 Educational Attainment by Race/Ethnicity and Gender, 1973–2012
43 Science, Technology, Engineering, or Mathematics (STEM) Fields
FIGURE 2.10A Beginning Four-Year College Students Who Earned Bachelor’s Degrees, Percentage Persisting in the Fields They Entered
FIGURE 2.10B High School Graduates Entering Four-Year Colleges, Graduating in STEM Fields, and Employed in STEM Fields
FIGURE 2.10C Majors of Bachelor’s Degree Recipients by Occupation, 2009
Geographic Comparisons
44 College Enrollment and Attainment by State
FIGURE 2.11 Educational Attainment by State
45 International Comparisons: Public Spending on Higher Education
FIGURE 2.12 International Expenditures on Higher Education Institutions from Public, Household, and Other Private Sources, 2010
46 References

EDUCATION PAYS 2013 5 For detailed data, see: trends.collegeboard.org.
Executive Summary
Education Pays 2013: The Benefits of Higher Education for Individuals and Society documents differences in the earnings and employment patterns of U.S. adults with different levels of education. It also compares health-related behaviors, reliance on public assistance programs, civic participation, and indicators of the well-being of the next generation. Financial benefits are easier to document than nonpecuniary benefits, but the latter may be as important to students themselves, as well as to the society in which they participate. Our goal is to call attention to ways in which both individuals and society as a whole benefit from increased levels of education.
Our focus is on outcomes correlated with levels of educational attainment, and it is important to be cautious about attributing all of the differences observed to causation. However, reliable statistical analyses support the significant role of postsecondary education in generating the benefits reported.
Many of the averages we report conceal considerable variation among people with similar levels of education. More information on this variation can be found in this report’s companion publication, How College Shapes Lives: Understanding the Issues.
Education Pays 2013 also examines the increases and the persistent disparities across demographic groups in college participation and completion. The magnitude of the benefits of postsecondary education makes ensuring improved access for all who can benefit imperative.
This executive summary highlights key ideas in the report.
THE BENEFITS OF HIGHER EDUCATION
Individuals with higher levels of education earn more and are more likely than others to be employed.
– Median earnings of bachelor’s degree recipients with no advanced degree working full time in 2011 were $56,500, $21,100 more than median earnings of high school graduates. Individuals with some college but no degree earned 14% more than high school graduates working full time. Their median after-tax earnings were 13% higher (Figure 1.1).
– Compared to a high school graduate, the median four-year college graduate who enrolls at age 18 and graduates in four years can expect to earn enough by age 36 to compensate for being out of the labor force for four years, as well as for borrowing the full amount required to pay tuition and fees without any grant assistance (Figure 1.3).
– Although 16% of male high school graduates earned as much as or more than the median earnings of male four-year college graduates in 2011 ($66,200), 84% earned less (Figure 1.5).
– As workers age, earnings rise more rapidly for those with higher levels of education. For example, the gap between the earnings of full-time workers whose highest degree is a bachelor’s degree and those of high school graduates grows
from 54% ($15,200) for 25- to 29-year-olds to 86% ($32,000) for 45- to 49-year-olds (Figure 1.7A).
– The 2012 unemployment rate for four-year college graduates ages 25 to 34 was 7.1 percentage points below that for high school graduates. The unemployment rates for those with associate degrees and with some college but no degree were 4.0 and 1.6 percentage points below that for high school graduates, respectively (Figure 1.9B).
The financial return associated with college credentials and the gaps in earnings by education level have increased over time.
– Between 2008 and 2011, the gap between the median earnings of high school graduates ages 25 to 34 and those in the same age range with a bachelor’s degree or higher declined from 74% to 69% for men and from 79% to 70% for women, but the long-term trend is upward (Figure 1.6).
– The difference between median earnings for women ages 25 to 34 working full time year-round with a bachelor’s degree or higher and those in the same age range with high school diplomas rose from 43% in 1971 to 56% in 1991 and to 70% in 2011. The earnings premium for men rose from 25% in 1971 to 56% and in 1991 and to 69% in 2011 (Figure 1.6).
Federal, state, and local governments enjoy increased tax revenues from college graduates and spend less on income support programs for them, providing a direct financial return on investments in postsecondary education.
– In 2011, 12% of high school graduates ages 25 and older lived in households that relied on SNAP (Supplemental Nutritional Assistance Program) benefits, compared to just 2% of those with at least a bachelor’s degree. The pattern was similar for the National School Lunch Program (Figure 1.15).
College-educated adults are more likely than others to receive health insurance and pension benefits from their employers.
– In 2011, employers provided pension plans to 52% of full-time workers with high school diplomas, 65% of those with bachelor’s degrees, and 73% of those with advanced degrees (Figure 1.12A).
– In 2011, employers provided health insurance to 55% of full-time workers with high school diplomas, 69% of those with bachelor’s degrees, and 73% of those with advanced degrees (Figure 1.13A).
Adults with higher levels of education are more active citizens than others.
– In 2012, 42% of four-year college graduates, 29% of adults with some college or an associate degree, and 17% of high school graduates volunteered for organizations (Figure 1.20B).

6 EDUCATION PAYS 2013
– Among adults ages 45 to 64, 59% of high school graduates and 80% of bachelor’s degree recipients voted in the 2012 election (Figure 1.21A).
College education leads to healthier lifestyles, reducing health care costs.
– The gap between the smoking rates of four-year college graduates and high school graduates increased from 2 percentage points in 1962 to 13 points in 1982, and to 17 points in 2012 (Figure 1.16A).
– Within each age group, college-educated adults are less likely than others to be obese. In addition, children living in households with more educated parents are less likely than other children to be obese (Figures 1.18A and 1.18B).
College-educated mothers spend more time with children and alter the composition of that time to suit children’s developmental needs more than less educated mothers.
– Among both those who are employed and those who are not, the amount of time mothers spend on their children’s activities increases with levels of education (Figure 1.19A).
College education increases the chances that adults will move up the socioeconomic ladder.
– Of adults who grew up in the middle family income quintile, 31% of those with a four-year college degree moved up to the top income quintile between 2000 and 2008, compared with just 12% of those without a four-year college degree (Figure 1.11).
Substantial evidence indicates that the associations described above are the result of increased educational attainment, not just of individual characteristics.
PARTICIPATION AND SUCCESS IN HIGHER EDUCATION
Although college enrollment rates continue to rise, large gaps in enrollment rates and patterns persist across demographic groups.
– The college enrollment rate of high school graduates from the lowest family-income quintile increased from 42% in 1992 to 50% in 2002, and to 52% in 2012. The rate for middle-income students increased from 53% to 55% to 65% over these decades, while 78% of the highest-income high school graduates enrolled in college in 1992 and in 2002, and 82% enrolled in 2012 (Figure 2.1).
– The gaps between the college enrollment rates of black and Hispanic high school graduates and white high school graduates narrowed considerably between 2001 and 2011, when 70% of white, 66% of black, and 62% of Hispanic high school graduates enrolled in college within a year of completing high school (Figure 2.2A).
– Thirty-eight percent of dependent undergraduate students from families with incomes below $29,600 enrolled in public two-year colleges in 2011-12, and 10% enrolled in for-profit institutions. In contrast, 22% of undergraduate students from families with incomes of $106,360 or higher enrolled in public two-year colleges, and 2% attended for-profit institutions (Figure 2.4B).
– Enrolling at institutions that are less selective than those for which students are academically qualified is most common among those from lower socioeconomic backgrounds. Most of this enrollment pattern is explained by where students apply rather than by admission decisions (Figure 2.5).
– In 2007-08, the percentage of young people enrolling in college within a year after they were scheduled to graduate from high school ranged from 29% in Nevada and 30% in the District of Columbia to 61% in Massachusetts and South Dakota (Figure 2.11).
Educational attainment rates are increasing, but college completion rates and attainment patterns differ considerably across demographic groups.
– Among students who began college in 2006 at the age of 24 or younger and enrolled exclusively full time, 78% had earned a degree or certificate six years later (Figure 2.7A).
– The percentage of adults in the U.S. between the ages of 25 and 34 with a four-year college degree grew from 6% in 1950 to 24% in 1980 and 1990. In 2012, 34% of adults in this age group had earned a bachelor’s degree or higher (Figure 2.8A).
– In 2012, the percentage of 25- to 29-year-olds with at least a bachelor’s degree ranged from 11% for Hispanic males to 43% for white non-Hispanic women (Figure 2.9).
Postsecondary education relies more on private funding in the U.S. than in most other developed countries.
– In 2010, the percentage of expenditures on higher education coming from public as opposed to private sources ranged from 22% in Chile and 25% in the United Kingdom, to 96% in Finland and Norway. In the United States, 36% of funding was public, 48% came from households, and 16% was from other private sources (Figure 2.12).

EDUCATION PAYS 2013 7 For detailed data, see: trends.collegeboard.org.
Introduction
As we emerge from the Great Recession, it is increasingly clear that our postsecondary education system and the economic and social context supporting it must evolve if we are to take best advantage of our human and physical resources. While the developing recovery has improved life for many Americans, those at the top are benefiting most. The gaps between those who grow up in privilege and those who do not continue to widen. Too many young people are struggling to find their places in the adult world.
A college education does not carry a guarantee of a good life or even of financial security. But the evidence is overwhelming that for most people, education beyond high school is a prerequisite for a secure lifestyle and significantly improves the probabilities of employment and a stable career with a positive earnings trajectory. It also provides tools that help people to live healthier and more satisfying lives, to participate actively in civil society, and to create opportunities for their children.
The word “college” has come to mean many different things. It includes universities with ivy-covered walls and small seminar classes, offering bachelor’s and graduate degrees. But it also includes public and private for-profit institutions specializing in short-term training for specific occupations. College students may be 18-year-olds straight out of high school or they may be adults seeking new labor-market skills in the middle of their work lives.
THE EDUCATION PAYS REPORT
Education Pays 2013 contains data on the financial and nonfinancial benefits of postsecondary education, broadly defined. Part 1 provides up-to-date information about earnings, employment and unemployment patterns, and nonwage attributes associated with the jobs held by people with different levels of education. Because many of the changes that education engenders in people’s lives are outside of their work lives, we report on health and lifestyle patterns as well.
Much of the information in this report pertains to the benefits that accrue to society as a whole when more people are college-educated, including increases in tax revenues and reductions in public expenditures. Other differences associated with postsecondary education, such as frequencies of smoking, obesity, voting, volunteering, and participating in educational activities with children also have a significant impact not only on individuals, but also on the fiscal and social strength of our nation.
The second part of Education Pays focuses on participation and success rates in postsecondary education, with an emphasis on differences among demographic groups. This year, we are introducing a new companion publication, How College Shapes
Lives: Understanding the Issues. This study examines the variation in postsecondary outcomes, as well as the ambiguity involved in measuring those outcomes. Education Pays includes some information on the variation in earnings among individuals with similar levels of education (Figure 1.5), the impact of the length of time it takes to earn a degree (Figure 1.3), and completion rates for those who begin college (Figure 2.7); however, it does not go into depth on these issues or provide much insight into growing concerns about the uncertainty involved in individual decisions about postsecondary education. Taken together, the two publications should provide readers with a greater understanding of the importance of investments in postsecondary education.
Not all investments in education pay off equally well. Well-designed policies and strong support for individual decision-making in a complex environment have the potential to make our society both more equitable and more productive. We should focus not only on providing more education but also on providing the opportunities that will best serve the varied needs, preferences, and circumstances of the population.
Like the College Board’s Trends in College Pricing and Trends in Student Aid reports, Education Pays collects and reports data. Some of the benefits of higher education documented in this report are widely cited; others are less well known. We bring publicly available government statistics together with less familiar academic research in order to paint a detailed and integrated picture of the benefits of higher education and how they are distributed. Where possible, we have summarized complex analyses in a manner consistent with the straightforward presentation style of this report. We provide references to more in-depth and sophisticated analyses so that readers can pursue issues of particular interest.
Education Pays is intended as a resource and a reference for anyone interested in understanding the value of investments in higher education and how different groups in society benefit from those investments. Readers will draw their own inferences about the public policies most consistent with the evidence provided.
THE PAYOFF OF HIGHER EDUCATION
The latest income data available for most of the indicators in Education Pays 2013 are for 2011. In the three years since we reported on 2008 income in Education Pays 2010, the gap between the median earnings of high school graduates ages 25 to 34 and those in the same age group with a bachelor’s degree or higher declined from 74% to 69% for men and from 79% to 70% for women. The earnings gap grows as workers age and move further along their career paths, but discussions

8 EDUCATION PAYS 2013
frequently focus on recent college graduates, particularly when the economy is weak. The increasing number of students who face difficulty repaying their student loans provides some justification for this perspective. But the evidence still strongly supports the conclusion that the long-term benefits of investing in postsecondary education exceed the costs, not just for society but also for the individual students who are bearing an increasing portion of the cost of their own education.
The long-term upward trend in the earnings premium for college graduates has led to a focus on that growth. But the premium does not have to keep growing for the investment to be a good one. According to Greenstone and Looney (2011) of the Brookings Institution’s Hamilton Project, “On average, the benefits of a four-year college degree are equivalent to an investment that returns 15.2 percent per year. This is more than double the average return to stock market investments since 1950, and more than five times the returns to corporate bonds, gold, long-term government bonds, or home ownership. From any investment perspective, college is a great deal.”
Our calculation in Figure 1.3 compares the median cumulative earnings of high school graduates to those of college graduates and finds that by about age 36, higher earnings compensate not only for four years out of the labor force, but also for average tuition and fee payments at a four-year university funded fully by student loans at 6.8% interest. The cumulative earnings of associate degree recipients reach this point when graduates are about 34. Modifying the assumptions underlying these calculations by, for example, increasing the assumed time spent in school, allowing for paid work while in school, or taking grant aid into consideration will lengthen or shorten the time required to make up the investment. But the key point is that for the typical student, the investment pays off very well over the course of a lifetime — even considering the expense.
Anecdotes about individual students whose paths through postsecondary education have not worked out well do not contradict the fact that on average and for most students, college is an excellent financial investment. Benson, Esteva, and Levy (2013) find that even after accounting for actual time to degree, the probability of enrolling in college but not completing a degree, and the higher taxes paid by those with higher levels of education, the average rate of return to college remains high. They explain that this reality is not incompatible with the perception that more former students are facing difficulties repaying their loans. This issue has gained attention because of a combination of rising tuition and debt levels with increasing variation in the earnings of college graduates.
In addition to the variation in earnings characterizing the weak economy in recent years, unemployment has become more
common, even for college graduates. But the data show large differences associated with level of education. Figure 1.9A shows that the unemployment rate for college graduates fell from its peak of 4.7% in 2010 to 4.0% in 2012, but it remained 2 percentage points higher than the 2007 level of 2.0%. However, the unemployment rate for high school graduates, which fell from its peak of 10.3% in 2010 to 8.3% in 2012, was almost 4 percentage points higher than its 2007 level of 4.4%.
It is important that we not allow the financial returns to college to obscure the other benefits of a college education. Paying for college requires too large of an expenditure to ignore the expected earnings on the other side, but we would lose a tremendous amount as a society if each individual set as his or her life goal maximizing lifetime income. College means many different things to people — partly depending on the stage of life at which they enroll, the type of institution they attend, the subjects they choose to study, whether they enroll full time or part time, and whether they are residential or commuter students. But as the data in Education Pays indicate, overall behavior patterns and attitudes differ considerably by level of education. The knowledge, fulfillment, self-awareness, and broadening of horizons associated with education transform the lives of students and of those with whom they live and work.
Postsecondary education should pay off well enough for people to pay back their loans and not suffer a diminished standard of living. But the personal growth, increased understanding of the world, and wider range of options available to college-educated adults deserve our attention. Our society would become immeasurably poorer if financial pressures were to lead us to think of higher education as synonymous with job training.
The fact is that the typical college graduate is considerably more likely than the typical high school graduate to have a job, and that job is likely to pay significantly more than the average earnings of high school graduates. The data may not be as colorful as the anecdotes we see so often in the press, but they tell a more realistic story. They also allow for a better understanding of which students and which circumstances are most likely to create the stories of the outliers who attract so much attention.
COLLEGE COMPLETION
Some of the doubts about the benefits of higher education arise from the fact that increasing college enrollment rates over time for all demographic groups have been accompanied by persistently low degree-completion rates. Not well known is that over three-quarters of students who begin college at age 24 or younger and enroll exclusively full time earn a degree or certificate within six years (Figure 2.7A). Moreover, the overall graduation rates for first-time full-time students are actually rising slowly.

EDUCATION PAYS 2013 9 For detailed data, see: trends.collegeboard.org.
Still, too many people begin college, invest both time and money, and never earn a credential. The gaps in completion rates by family income level, age, and enrollment intensity are large. We also know that there is considerable variation in completion rates across types of institutions and among individual institutions with similar student bodies. Unfortunately, these very real problems have led some observers to the unwarranted conclusion that people who do not have strong academic preparation, who do not have the required financial resources, or who are unfamiliar with the expectations and requirements of colleges and universities should not pursue postsecondary education.
Research, however, tells us otherwise. Numerous economic analyses indicate that students who, because of their demographic characteristics and academic experiences, hesitate to go to college stand to benefit the most from a postsecondary degree (Card, 2001; Brand & Xie, 2010; Hout, 2012). This finding does not imply that individuals on the margin of college attendance will end up earning more than those who knew from an early age that they would attend college. It means that the incremental gain in their earnings resulting from a college education may be larger. It is relatively rare for young people whose parents are affluent — or even middle-class — college graduates to skip college altogether. For them, going to college and earning a bachelor’s degree is the “default option.” Those who choose not to enroll usually have actively considered and rejected the idea. But for too many low-income and first-generation students, financial and logistical barriers loom so large that the possibility of going to college never seems realistic. Many of these students would likely benefit from appropriate postsecondary educational opportunities.
First-generation students and those from low-income backgrounds frequently lack the information needed to make the best choices when they do enroll in college. As the data in Part 2 of Education Pays reveal, many students enroll in colleges that are less selective and less challenging than those to which they would likely be admitted based on their academic qualifications. Numerous studies have shown that this enrollment pattern significantly decreases the probability of graduating.
As Figure 2.6A indicates, over 40% of the undergraduate credentials awarded in 2011-12 were certificates or associate degrees. Some people who begin bachelor’s degrees and end up leaving school without a credential might have been better served by enrolling in a shorter program; on the other hand, many who enroll in shorter programs diminish their chances of ever earning a four-year degree. Arguments that
confuse the idea of increasing postsecondary participation and attainment with the idea that almost everyone should earn a bachelor’s degree are misleading. There are many postsecondary options. Students need better guidance about which options to pursue. With that guidance, for most individuals the choice with the best long-run outcomes will involve some form of postsecondary study.
INTERPRETING THE EVIDENCE
Many of the graphs in this report compare the experiences of people with different education levels. In general, while simple descriptions of correlations provide useful clues, they do not reliably determine causation or measure the exact size of the effects. They are best interpreted as providing broadly-gauged evidence of the powerful role that higher education plays in the lives of individuals and in society. That said, a growing body of evidence points to the direct impact of higher education not only on specific job-related skills, but also on the attitudes and behavior patterns of students. Education enables people to better adapt to change. It also makes them more likely to take responsibility for their health and for the society in which they live, and to parent in ways that improve the prospects for their own children.
The evidence is overwhelming that higher education improves people’s lives, makes our economy more efficient, and contributes to a more equitable society. As Figure 1.11 illustrates, postsecondary education is key to the ability of adults to rise above the socioeconomic status of their parents. Without a college education, those born into the lower economic rungs are likely to stay there.
Narrowing the gaps in college participation and success across income groups is vital to our future as a nation. Different paths are appropriate for different individuals, and our challenge is to make the most promising paths readily available to students from all backgrounds. Money alone cannot solve this problem. As inequality in the distribution of resources in our society increases over time, the hurdles facing disadvantaged children grow in relative terms. Our education system must do better at helping them to overcome these hurdles.
The tables supporting all of the graphs in this report, a PDF version of the report, and a PowerPoint file containing individual slides for all of the graphs are available on our website at trends.collegeboard.org. Please feel free to cite or reproduce the data in this report for noncommercial purposes with proper attribution.

Part 1: Individual and Societal Benefits10 EDUCATION PAYS 2013
Part 1:Individual and Societal Benefits of Higher EducationThe benefits of investments in higher education are shared by individual students and the societies of which they are a part. Individuals with college degrees, and to a lesser extent those who have some college experience but do not have a degree, earn more than others and enjoy better working conditions. They contribute more to society, both through higher tax payments and through their civic involvement. College-educated adults also give their children benefits that increase the prospects that the next generation will prosper and will be in a position to contribute to society in a variety of ways.
The indicators in Part 1 of Education Pays document the financial benefits of college participation and success and other ways in which higher education improves the lives of adults and their communities.
Earnings are too often emphasized as the primary benefit of higher education, and may overshadow other outcomes that could well be as important. Nonetheless, the price of college makes an understanding of the financial benefits critical, and several of the following pages focus on earnings differences corresponding to levels of educational attainment. During their working lives, college graduates earn, on average, about 65% more than high school graduates, and those with advanced degrees earn two to three times as much as high school graduates. The earnings premium increases as workers move further along their career paths.
Salaries are not the only form of compensation correlated with education level. For example, college graduates are more likely than other employees to enjoy employer-provided health and pension benefits. They are more likely to feel that they learn new things on their jobs and are somewhat more satisfied with their work than others. These findings do not mean that there are no exceptions to the rule. Some individuals make fortunes despite little formal education, and some struggle financially, even with a college education. As Figure 1.5 illustrates, there is considerable variation in earnings among people with the same level of education. But the overall patterns are clear and dramatic — more education means increased opportunities. Although it requires the considerable investment of dollars, time, and effort, higher education measurably improves the lives of most who participate and significantly increases the probability that adults will move up in the socioeconomic hierarchy.
Society as a whole also enjoys a financial return on the investment in higher education. In addition to widespread productivity increases, the higher earnings of educated workers generate higher tax payments at the local, state, and federal levels. Four-year college graduates pay, on average, 78% more in taxes each year than high school graduates, and for those who continued on to earn a professional degree, average tax payments are more than three and a half times as high as those paid by high school graduates. Spending on social support programs such as unemployment compensation, SNAP, and Medicaid is much lower for individuals with higher levels of education.
While the pages in this section report relationships between education and outcomes and not measures of causation, a large body of reliable research provides evidence that most of the differences in outcomes are, in fact, the result of individuals’ education. The evidence is compelling that postsecondary education not only provides valued credentials but also increases skills and knowledge and changes the way people approach their lives.
Beyond the economic return to individuals and to society as a whole, higher education improves quality of life in a variety of ways, only some of which can be easily quantified. High levels of labor force participation, employment, and earnings increase the material well-being of individuals and the wealth of society, and also carry psychological benefits. Adults with higher levels of education are more likely to engage in organized volunteer work, to understand political issues, and to vote. They are also more likely to live healthy lifestyles. The issue is not just that they earn more and have better access to health care; college-educated adults smoke less, exercise more, and have lower obesity rates. These differences not only affect the lifestyles and life expectancies of individuals but also reduce medical costs for society as a whole. Mothers with higher levels of education spend more time on their children’s activities. In other words, participation in postsecondary education improves the quality of civil society.
The pages in this section do not provide a comprehensive measure of the benefits of higher education. They do, however, provide an indication of the nature and extent of the return on our investment in educational opportunities.

EDUCATION PAYS 2013 11 For detailed data, see: trends.collegeboard.org.
Education, Earnings, and Tax Payments
FIGURE 1.1 Median Earnings and Tax Payments of Full-Time Year-Round Workers Ages 25 and Older, by Education Level, 2011
The bars in this graph show median earnings at each education level. The blue segments represent the estimated average federal, state, and local taxes paid at these income levels. The orange segments show after-tax earnings.
NOTE: The numbers in parentheses on the y-axis indicate the percentage of all full-time year-round workers with each education level in 2011. Taxes paid include federal income, Social Security, Medicare, state and local income, sales, and property taxes. Percentages may not sum to 100 because of rounding.
SOURCES: U.S. Census Bureau, 2012, Table PINC-03; Internal Revenue Service, 2010; Davis et al., 2013; calculations by the authors.
In 2011, median earnings of bachelor’s degree recipients with no advanced degree working full time were $21,100 higher than those of high school graduates. The difference includes $5,000 in tax payments and $16,100 in after-tax income.
– Individuals with some college but no degree earned 14% more than high school graduates working full time year-round. Their median after-tax earnings were 13% higher.
– Median earnings for individuals with associate degrees working full time were 27% higher than median earnings for those with only a high school diploma. After-tax earnings were 25% higher.
– Individuals with master’s degrees earned twice as much before taxes and took home 90% more than high school graduates working full time. Those with doctoral degrees working full time earned 2.6 times as much and had after-tax earnings 2.4 times as high school graduates.
– The median total tax payments of full-time workers with a professional degree in 2011 were over three and a half times as high as the median tax payments of high school graduates working full time. After-tax earnings were about 2.7 times as high.
ALSO IMPORTANT:
– Seventy-seven percent of four-year college graduates ages 25 and older had earnings in 2011 and 58% worked full time year-round. Fifty-nine percent of high school graduates ages 25 and older had earnings, and 41% worked full time. (U.S. Census Bureau, 2012, Table PINC-03)
– The gap between the earnings of high school graduates and the earnings of individuals whose highest degree is a bachelor’s degree is 60% for full-time workers and 73% for all earners. The corresponding difference in tax payments is 77% for full-time workers and 96% for all earners. (U.S. Census Bureau, 2012, Table PINC-03)
– All of the differences in earnings reported here may not be attributable to education level. Educational credentials are correlated with a variety of other factors that affect earnings, including, for example, parents’ socioeconomic status and some personal characteristics.
– While the average high school graduate may not increase his or her earnings to the level of the average college graduate simply by earning a bachelor’s degree, careful research on the subject suggests that the figures cited here do not measurably overstate the financial return to higher education. (Carneiro, Heckman, & Vytlacil, 2003; Rouse, 2005; Harmon, Oosterbeek, & Walker, 2003)
Earnings
$23,400
$20,300
$14,800
$11,400
$8,600
$7,500
$6,400
$4,100
$45,100
$36,200
$32,900
$29,000
$21,000 $20,500
$78,800 $102,200
$70,700 $91,000
$55,200 $70,000
$56,500
$44,800
$40,400
$35,400
$25,100
Taxes Paid After-Tax Earnings
$0 $20,000 $40,000 $60,000 $80,000 $100,000 $120,000
Median Earnings
Educ
atio
n Le
vel
Less than aHigh School Diploma (7%)
High School Diploma (27%)
Some College,No Degree (17%)
Associate Degree (11%)
Bachelor’s Degree (25%)
Master’s Degree (10%)
Doctoral Degree (2%)
Professional Degree (2%)

12 EDUCATION PAYS 2013 Part 1: Individual and Societal Benefits
Lifetime Earnings
During a 40-year full-time working life, the median earnings of bachelor’s degree recipients without an advanced degree are 65% higher than the median earnings of high school graduates.
FIGURE 1.2 Expected Full-Time Lifetime Earnings Relative to High School Graduates, by Education Level
NOTE: Based on the sum of median 2011 earnings for full-time year-round workers at each age from 25 to 64 for each education level. No allowance is made for the shorter work life resulting from time spent in college or out of the labor force for other reasons. Future earnings are discounted at a 3% annual rate to account for the reality that because of forgone interest, dollars received in the future are not worth as much as those received today. Discounting does not have a large impact on the lifetime earnings ratios. The calculations are illustrative and do not represent what individuals will actually earn in the future. Earnings ratios calculated using data from another year will likely yield slightly different results. For example, the earnings ratio of bachelor’s degree recipients to high school graduates is 1.61 based on 2005 earnings data, 1.66 based on 2008 earnings data, and 1.65 based on 2011 earnings data.
SOURCES: U.S. Census Bureau, 2012, Table PINC-03; calculations by the authors.
– The median lifetime earnings of individuals with an associate degree and those with some college education but no degree (a category that includes certificate holders) are 27% and 13% higher than the median earnings of high school graduates, respectively.
– The calculations in Figure 1.2 are based on earnings of individuals working full time year-round. Because the proportion of adults working full time year-round increases with education level (for example, 65% of four-year college graduates and 51% of high school graduates between the ages of 25 and 64 worked full time in 2011), the lifetime earnings differentials would be larger if all adults — or all adult workers — were included in these calculations.
– As Figure 1.1 reports, higher earnings correspond to higher tax payments. If after-tax earnings were used to calculate lifetime earnings, the ratio of lifetime earnings for individuals with more than a high school diploma to lifetime earnings for high school graduates would decline slightly.
– While including advanced degree holders with those whose highest degree is a bachelor’s degree would overstate the payoff of a four-year degree, excluding them understates the payoff because part of the benefit of a bachelor’s degree is the option it provides for obtaining a graduate degree.
ALSO IMPORTANT:
– There are a variety of ways to estimate lifetime earnings for people with different levels of education. Although some reasonable assumptions would lower the ratios shown here and other reasonable assumptions would increase those ratios, the results consistently reveal significantly higher earnings levels associated with higher levels of education.
– A number of careful studies show that people who are kept out of college by barriers like a shortage of funds or the absence of nearby appropriate colleges earn higher than average returns when the barriers are lowered. In other words, the idea that students who are not enrolling in college would be unlikely to enjoy the average benefits reported here is not supported by the evidence. (Brand & Xie, 2010)
Earnings
0.72
1.001.13
1.27
1.65
1.96
2.43
2.92
Professional Degree
Doctoral Degree
Master’s Degree
Bachelor’s Degree
Associate Degree
Some College, No Degree
High School Diploma
Less than a High School
Diploma
Education Level
Earn
ings
Rat
io
0.00
0.50
1.00
1.50
2.00
2.50
3.00
3.50

EDUCATION PAYS 2013 13 For detailed data, see: trends.collegeboard.org.
FIGURE 1.3Estimated Cumulative Full-Time Earnings (in 2011 Dollars) Net of Loan Repayment for Tuition and Fees, by Education Level
Earnings Premium Relative to Price of Education
Compared to a high school graduate, the median four-year college graduate who enrolls at age 18 and graduates in four years can expect to earn enough by age 36 to compensate for being out of the labor force for four years and for borrowing the full tuition and fee amount without any grant aid.
– For the median associate degree recipient who borrows to cover tuition and fees at a community college and earns an associate degree two years after high school graduation, total earnings net of loan repayment exceed the total earnings of high school graduates by age 34.
All the break-even ages below refer to high school graduates as the comparison group:
1. The lower tuition and fee level in public colleges and universities lowers the break-even age for bachelor’s degree recipients graduating in four years from 36 to 33.
2. If a student stays out of the labor force and borrows the full tuition and fees for five years to complete a bachelor’s degree, the break-even age will be 37 instead of 36. Taking three years instead of two to complete an associate degree raises the break-even age from 34 to 38.
3. If a student borrows the average tuition and fees net of grant aid, the break-even age for both associate and bachelor’s degree recipients declines to 32.
4. Assuming average in-school earnings of $4,060 per year for bachelor’s degree recipients lowers the break-even age from 36 to 34. The higher average in-school earnings ($7,060) of associate degree recipients lowers their break-even age from 34 to 30. Associate and bachelor’s degree recipients’ in-school earnings are based on earnings of students who were enrolled in 2003-04 and earned an associate degree by 2006 and a bachelor’s degree by 2009, respectively.
5. If the earnings of all working adults — instead of only those working full time year-round — are considered, the typical four-year college graduate makes up for time out of the labor force and for paying tuition by age 33.
Orange solid line: cumulative median earnings at each age for high school graduates entering the workforce full time at age 18. Light blue solid line: cumulative median earnings at each age for four-year college graduates entering the workforce at age 22 after four years out of the labor force. Loan payments are subtracted from earnings for the first 10 years after graduation, covering both the principal and 6.8% interest during and after college. Light orange dotted line: the same calculation for students borrowing to cover two years of public two-year college tuition and fees and entering the workforce at age 20.
NOTE: Based on median 2011 earnings for individuals working full time year-round at each education level and each age. Includes only students who complete degrees; excludes bachelor’s degree recipients who earn advanced degrees. Assumes college graduates borrow $14,352 to cover total first-year tuition and fee charges for 2011-12 (weighted average of $8,256 average public four-year in-state and $27,883 private nonprofit four-year tuition and fees) for the first year and 5% more each of the next three years. Assumes associate degree recipients borrow $2,959 2011-12 average public two-year college tuition and 5% more the next year. Tuition payments and earnings are discounted at 3%, compounded every year beyond age 18. In previous editions of Education Pays, this calculation was based on public four-year in-state tuition and fees, rather than a weighted average.
SOURCES: U.S. Census Bureau, 2012, Table PINC-03; Baum and Ma, 2012; calculations by the authors.
Break-Even Ages Under Alternative Assumptions
AA Recipient
vs. HS
Graduate
BA Recipient
vs. HS
Graduate
BA Recipient
vs. AA
Recipient
Baseline (as shown in Figure 1.3) 34 36 37
Alternative Assumptions
1. In-state tuition and fees at public four-year institutions instead of weighted average of public and private nonprofit four-year tuition and fees
34 33 33
2. Longer time to degree: 3 years out of the labor force and 3 years of tuition borrowed for associate degree recipients; 5 years out of the labor force and 5 years of tuition borrowed for bachelor’s degree recipients
38 37 37
3. Borrowing weighted net tuition and fees (tuition and fees minus all grants and tax benefits)
32 32 32
4. Work average amount in college instead of no earnings 30 34 36
5. Based on all workers instead of just full-time year-round 30 33 35
Earnings
High School Diploma
Associate Degree
Bachelor’s Degree
$1,200,000
$1,000,000
$800,000
$600,000
$400,000
$200,000
$0
Cum
ulat
ive
Net
Ear
ning
s
646054484236302418
Age

14 EDUCATION PAYS 2013 Part 1: Individual and Societal Benefits
Earnings by Race/Ethnicity, Gender, and Education Level
NOTE: Based on combined data from the 2010, 2011, and 2012 Annual Social and Economic Supplement of the Current Population Survey. Earnings in 2009 and 2010 are adjusted to 2011 dollars using the Consumer Price Index for all urban consumers. Median earnings are the median of combined data. The “Asian,” “Black,” and “White” categories include individuals who reported one race only and who reported non-Hispanic. The sample size for Asian females with less than a high school diploma is too small to allow for reliable reporting.
SOURCES: U.S. Census Bureau, 2010a, 2011a, 2012a; Bureau of Labor Statistics, 2013a; calculations by the authors.
FIGURE 1.4Median Earnings (in 2011 Dollars) of Full-Time Year-Round Workers Ages 25–34, by Race/Ethnicity, Gender, and Education Level, 2009–2011
Median earnings for Asian men between the ages of 25 and 34 with a four-year college degree working full time year-round in 2009–2011 were 91% ($27,400) higher than median earnings for Asian men with a high school diploma. The college earnings premium for white males was 40% ($14,800).
– For women ages 25 to 34, the earnings premium for a four-year college degree ranged from 56% for black and white women ($14,200 and $15,300, respectively) to 85% ($22,700) for Asian women.
– Among full-time workers ages 25 to 34, the earnings differential between those with some college but no degree and high school graduates ranged from 9% ($3,200) for white men to 27% ($8,200) for Asian men.
– The earnings differential between associate degree recipients and high school graduates ranged from 17% ($4,300) for black women to 37% ($10,000) for Asian women.
– Median earnings for 25- to 34-year-old white male high school graduates working
full time were 38% ($10,300) higher than median earnings for white female high school graduates. Among bachelor’s degree recipients, the gender gap was 23% ($9,800).
ALSO IMPORTANT:
– Figure 1.4 shows the median earnings of individuals working full time year-round. The proportion of individuals working full time year-round increases with education level. For example, in 2009–2011, the proportion of the Asian female population working full time year-round ranged from 22% for those without a high school diploma to 48% for those with an advanced degree. The proportion of white men working full time year-round ranged from 37% for those without a high school diploma to 78% for those with an advanced degree.
Ratio of Median Earnings of Bachelor’s Degree Recipients to Median Earnings of High School Graduates, by Race/Ethnicity and Gender, Full-Time Year-Round Workers, 2009–2011
BA/HS Earnings Ratio
Ages 25–34
Ages 25 and Older
Asian Female 1.85 1.83
Male 1.91 1.93
Black Female 1.56 1.68
Male 1.67 1.56
Hispanic Female 1.60 1.64
Male 1.58 1.72
White Female 1.56 1.59
Male 1.40 1.61
All Female 1.60 1.61
Male 1.52 1.63
$26,
800 $32,
300
$36,
800
$49,
500
$70,
700
$30,
200
$23,
200
$38,
400
$40,
100
$57,
600
$76,
200
$25,
200
$18,
300
$29,
900
$31,
600 $4
0,30
0$5
0,80
0
$25,
300
$19,
300 $2
7,90
0$2
9,60
0$3
9,50
0 $47,
400
$27,
100
$21,
800 $3
0,30
0$3
5,50
0 $42,
400
$52,
500
$34,
000
$24,
400
$39,
200
$42,
400 $5
1,80
0$6
8,80
0
$26,
300
$19,
300
$29,
900
$34,
000 $4
2,10
0$5
2,40
0
$37,
400
$29,
200
$40,
600
$46,
100 $52,
200
$67,
300
$30,
500
$22,
700
$37,
200
$40,
000 $4
8,20
0$5
8,30
0
$27,
200
$25,
200 $3
3,80
0$3
5,30
0$4
5,30
0$6
6,30
0
Race/Ethnicity and Gender
Med
ian
Earn
ings
$0
$20,000
$40,000
$60,000
$80,000
$100,000
Female Male Female Male Female Male Female Male Female Male
Asian Black Hispanic White All
Less than a High School Diploma
High School Diploma
Some College, No Degree
Associate Degree
Bachelor’s Degree
Advanced Degree
Earnings

EDUCATION PAYS 2013 15 For detailed data, see: trends.collegeboard.org.
FIGURE 1.5 Median, 25th Percentile, and 75th Percentile Earnings of Full-Time Year-Round Workers Ages 25 and Older, by Gender and Education Level, 2011
Earnings by Gender and Education Level
– In 2011, although 16% of male high school graduates earned as much as or more than the median earnings of male four-year college graduates ($66,200), 84% earned less.
– In 2011, 20% of male four-year college graduates with no advanced degree earned less than the median earnings of male high school graduates ($40,400), while 80% earned more.
– In 2011, although 14% of female high school graduates earned as much as or more than the median earnings of female four-year college graduates ($49,100), 86% earned less.
– In 2011, 16% of female four-year college graduates with no advanced degree earned less than the median earnings of female high school graduates ($30,000), while 84% earned more.
– In 2011, 62% of males with some college education but no degree and 68% of males holding associate degrees earned more than the median earnings of male high school graduates.
– In 2011, 63% of females with some college education but no degree and 70% of females holding associate degrees earned more than the median earnings of female high school graduates.
ALSO IMPORTANT:
– Figure 1.5 includes only full-time year-round workers ages 25 and older. Among both men and women, the percentage of individuals who are employed rises with level of education, as does the percentage of those employed who are working full time. (Bureau of Labor Statistics, 2013b)
This graph shows earnings by education level separately for male and female full-time year-round workers ages 25 and older. The bottom of each bar shows the 25th percentile; 25% of the people in the group earn less than this amount. The box shows median earnings for the group. The top of the bar shows the 75th percentile; 25% of the people in the group earn more than this amount.
SOURCES: U.S. Census Bureau, 2012, Table PINC-03; U.S. Census Bureau, 2012a; calculations by the authors.
Earnings of full-time year-round workers are strongly correlated with level of education, but there is considerable variation in earnings among both men and women at each level of educational attainment.
Less than a High School
Diploma
Some College, No Degree
Bachelor’s Degree
Doctoral Degree
Less than a High School
Diploma
Some College, No Degree
Bachelor’s Degree
Doctoral Degree
High School Diploma
Associate Degree
Master’s Degree
Professional Degree
High School Diploma
Associate Degree
Master’s Degree
Professional Degree
$15,800$21,100 $25,200 $26,900
$35,100$44,600
$53,100 $54,100
$20,700
$30,000$34,600
$39,300$49,100
$60,300
$77,500 $80,700
$27,100
$40,500$47,000
$53,400
$69,000
$81,400
$109,000
$141,000
$19,900$27,300
$31,700 $36,000$43,900
$56,600$65,200
$71,800
$27,300
$40,400$47,100 $50,900
$66,200
$83,000
$100,800
$119,500
$40,200
$56,500$67,200
$71,900
$100,000
$125,000
$150,000
$170,000Median
25th Percentile
75th Percentile
Gender and Education Level
Ear
ning
s
$0
$50,000
$100,000
$150,000
$200,000
Female Male
Earnings

16 EDUCATION PAYS 2013 Part 1: Individual and Societal Benefits
SOURCES: Data for 1993 and prior: National Center for Education Statistics (NCES), 2004a; Data for 1994 and after: U.S. Census Bureau, 1995–2012, PINC tables; CPI-U: Bureau of Labor Statistics, 2013a; calculations by the authors.
Earnings over Time by Gender and Education LevelIn 2011, median earnings were 70% higher for females ages 25 to 34 with a bachelor’s degree or higher working full time year-round than for those with only a high school diploma; the premium for males was 69%. These earnings gaps were higher than the gaps a decade earlier, but lower than the peaks for women in 2009 and for men in 2008.
FIGURE 1.6 Median Earnings (in 2011 Dollars) of Full-Time Year-Round Workers Ages 25–34, by Gender and Education Level, 1971–2011
– Between 2006 and 2011, real median earnings declined by 7% for male high school graduates and by 2% for men with bachelor’s degrees or higher. Real median earnings rose by 2% for female high school graduates but declined by 2% for women with a bachelor’s degree or higher.
– Within the “Bachelor’s Degree or Higher” category, 25% of men and 31% of women had advanced degrees in 2011, compared to 23% of men and 24% of women a decade earlier.
– The gap between median earnings for 25- to 34-year-old males with advanced degrees and those with only bachelor’s degrees increased from 23% in 2001 to 36% in 2011; for women the increase was from 15% to 25%.
ALSO IMPORTANT:
– The overall distribution of income in the United States became more unequal between 1971 and 2011. The share of total income received by households in the lowest 20% of the income distribution declined from 4.1% in 1971 to 3.8% in 1991, and to 3.2% in 2011.
– The share of total income received by households in the highest 20% of the income distribution rose from 43.5% in 1971 to 46.5% in 1991, and to 51.1% in 2011.
– The share of total income received by households in the top 5% of the income distribution rose from 16.7% in 1971 to 18.1% in 1991 and to 22.3% in 2011. (U.S. Census Bureau 2012, Historical Income Table H-2)
Percentage of “Bachelor’s Degree or Higher” Category with Advanced Degrees (Master’s, Doctoral, or Professional)
1991 1992 1993 1994 1995 1996 1997 1998 1999 2000 2001 2002 2003 2004 2005 2006 2007 2008 2009 2010 2011
Female 20% 19% 20% 21% 21% 21% 22% 24% 23% 22% 24% 26% 27% 27% 27% 28% 31% 30% 28% 32% 31%
Male 25% 24% 23% 23% 25% 22% 22% 22% 22% 21% 23% 24% 25% 25% 25% 25% 24% 28% 27% 24% 25%
Advanced Degree
Bachelor’s Degree
Associate Degree
Bachelor’s Degreeor Higher
Some College or Associate Degree
Some College
High School Diploma
Grades 9−11
Med
ian
Earn
ings
in 2
011
Dol
lars
$20,000
$40,000
$60,000
$80,000
$01971 1975 1979 1983 1987 1991 1995 1999 2003 2007 2011 1971 1975 1979 1983 1987 1991 1995 1999 2003 2007 2011
Gender and YearFemale Male
Earnings

EDUCATION PAYS 2013 17 For detailed data, see: trends.collegeboard.org.
Earnings Paths
Earnings peak at ages 45–49 or 50–54 for workers at all levels of education. The increase in earnings from ages 25–29 to the peak is largest for four-year college graduates.
– For full-time year-round workers, median earnings of 45- to 49-year-olds with high school diplomas are 33% higher than those of 25- to 29-year-olds. The difference is 60% for four-year college graduates and larger for those with advanced degrees.
– The earnings gap between high school graduates and individuals with higher levels of education is smallest for 25- to 29-year-olds. For example:
� For full-time workers with associate degrees, the earnings gap grows from 25% ($7,000) for 25- to 29-year-olds to 34% ($12,500) for 45- to 49-year-olds and to 36% ($12,800) for 60- to 64-year-olds.
� For full-time workers whose highest degree is a bachelor’s degree, the earnings gap grows from 54% ($15,200) for 25- to 29-year-olds to 86% ($32,000) for 45- to 49-year-olds and is 74% ($26,500) for 60- to 64-year-olds.
– The earnings gap between high school graduates and bachelor’s degree holders ages 25 to 29 increases from 54% ($15,200) to 72% ($15,500) when part-time workers are included. For those ages 45 to 49, the earnings premium for four-year college graduates working full time is 86% ($32,000) and for all workers it is 87% ($26,700).
ALSO IMPORTANT:
FIGURE 1.7A Median Earnings of Full-Time Year-Round Workers by Age and Education Level, 2009–2011
Percentage of All Workers Working Full-Time Year-Round, by Age and Education Level, 2009–2011
Age
Less than a High
School Diploma
High School
Diploma
Some College,
No Degree
Associate Degree
Bachelor’s Degree
Master’s Degree
Doctoral Degree
Profes-sional
Degree
25 to 29 49% 60% 59% 65% 71% 68% 65% 68%
45 to 49 60% 70% 72% 73% 76% 78% 80% 84%
60 to 64 56% 61% 62% 63% 64% 60% 70% 71%
SOURCES: U.S. Census Bureau, 2012f; calculations by the authors.
Full-Time Year-Round Workers All Workers
Age
Less than a High School
Diploma
High School
Diploma
Some College,
No Degree
Associate Degree
Bachelor’s Degree
Master’s Degree
Doctoral Degree
Profes-sional
Degree
Less than a High School
Diploma
High School
Diploma
Some College,
No Degree
Associate Degree
Bachelor’s Degree
Master’s Degree
Doctoral Degree
Profes-sional
Degree
25 to 29 $22,000 $27,900 $31,100 $34,900 $43,100 $50,000 $59,400 $56,200 $16,000 $21,600 $23,900 $28,700 $37,100 $42,400 $48,900 $48,600
45 to 49 $26,900 $37,100 $44,300 $49,600 $69,100 $81,300 $100,000 $122,400 $21,200 $30,800 $36,700 $41,500 $57,500 $72,000 $92,300 $103,900
60 to 64 $27,300 $35,600 $43,100 $48,400 $62,100 $74,200 $100,900 $120,500 $20,100 $26,800 $32,500 $37,000 $47,000 $57,000 $84,300 $100,600
NOTE: Based on the 2009–2011 American Community Survey three-year combined data file. Earnings in 2009 and 2010 are adjusted to 2011 dollars using the Consumer Price Index for all urban consumers. Median earnings are the median of combined data.
SOURCES: U.S. Census Bureau, 2012f; calculations by the authors.
FIGURE 1.7B Median Earnings of All Workers by Age and Education Level, 2009–2011
Professional Degree
Doctoral Degree
Master’s Degree
Bachelor’s Degree
Associate Degree
Some College, No Degree
High School Diploma
Less than a High School Diploma
$0
$20,000
$40,000
$60,000
$80,000
$100,000
$120,000
$140,000
60 to 6455 to 5950 to 5445 to 4940 to 4435 to 3930 to 3425 to 29
Age
Med
ian
Earn
ings
Med
ian
Earn
ings
$0
$20,000
$40,000
$60,000
$80,000
$100,000
$120,000
$140,000
Age
60 to 6455 to 5950 to 5445 to 4940 to 4435 to 3930 to 3425 to 29
Earnings

Part 1: Individual and Societal Benefits18 EDUCATION PAYS 2013
Employment
In 2012, among adults between the ages of 25 and 64, 67% of high school graduates, 71% of those with some college but no degree, 77% of those with associate degrees, and 82% of those with four-year college degrees were employed.
– For all groups without any postsecondary degrees, the percentages employed were 6 points lower in 2012 than they had been in 2007. The percentage employed for associate degree holders was 4 percentage points lower in 2012 than in 2007. For those with a bachelor’s degree or higher, the decline was 2 percentage points.
– The number of employed four-year college graduates between the ages of 25 and 64 increased from 36.2 million in 2002 to 41.4 million in 2007 and to 43.5 million in 2012.
– Among both associate degree holders and those with at least a bachelor’s degree, the number of employed adults between the ages of 25 and 64 increased between 2007 and 2012, while employment declined for other groups.
– The overall educational attainment in the population increased between 2002 and 2012. For example, the total number of adults between the ages of 25 and 64 without a high school diploma declined by 1.4 million during this time period, while the number with at least a bachelor’s degree grew by 10.1 million.
– In 2012, 18% of individuals ages 65 and older were in the labor force, ranging from 10% of those without a high school diploma to 28% of those with at least a bachelor’s degree. In contrast, 77% of individuals ages 25 to 64 were in the labor force, ranging from 61% of those without a high school diploma to 85% for those with at least a bachelor’s degree.
FIGURE 1.8A Civilian Population Ages 25 to 64: Number (in Millions) and Percentage Employed, Unemployed, and Not in the Labor Force, 2002, 2007, and 2012
NOTE: To be considered a member of the labor force, individuals must either be employed or be actively seeking employment. Percentages may not sum to 100 because of rounding.
SOURCES: U.S. Census Bureau, 2002b, 2007a, and 2012b; calculations by the authors.
FIGURE 1.8B Labor Force Participation Rates by Age and Education Level, 2012
SOURCES: U.S. Census Bureau, 2012b; calculations by the authors.
Labor Force Participation Rates by Age and Education Level, 2012
Age
Less than a High School
Diploma
High School
Diploma
Some College,
No Degree
Associate Degree
Bachelor’s Degree or
Higher Total
25 to 34 68% 79% 80% 86% 88% 82%
35 to 44 69% 80% 82% 87% 88% 83%
45 to 54 63% 77% 80% 85% 88% 80%
55 to 64 43% 60% 65% 69% 75% 65%
Less than a HS Diploma
High School Diploma
Some College,No Degree
Associate Degree
Bachelor’s Degree or Higher
61%
82%77%74%
85%
10%
20% 22%15%
28%
46%
59%
73% 76%
66%
60%
80%
100%
40%
20%
0%
Age and Education Level
Labo
r For
ce P
artic
ipat
ion
Rate
25 to 64 65 and Older 25 and Older
Other Economic Benefits
Number of Individuals (Millions)
Educ
atio
n Le
vel a
nd Y
ear
2012
2007
2002
2012
2007
2002
2012
2007
2002
2012
2007
2002
2012
2007
2002
0 10 20 30 40 50 60
Hig
h Sc
hool
D
iplo
ma
Less
than
a H
igh
Scho
ol D
iplo
ma
Som
e Co
llege
, N
o D
egre
eA
ssoc
iate
D
egre
eB
ache
lor´
s D
egre
e or
Hig
her
81%
71%
77%
77%
23%
20%
19%
28.0
27.6
26.3
6%
67%
53%
59%
58%
36%
37%
39% 17.2
18.6
18.3
26% 47.0
46.7
47.973% 24%3%
73% 22%4%
4%
3%
3%15% 53.3
2%14% 49.3
43.2
17.2
15.0
13.5
84%
77%
81%3% 16%
16%
5%
3%14%
3%
8%
5%
6%
Not in the Labor ForceUnemployedEmployed
82%
18%
84%
6%

EDUCATION PAYS 2013 19 For detailed data, see: trends.collegeboard.org.
FIGURE 1.9A Unemployment Rates Among Individuals Ages 25 and Older, by Education Level, 1992–2012
Unemployment
SOURCE: Bureau of Labor Statistics, 2013b.
Unemployment Rates Among Individuals Ages 25 and Older, by Education Level, 1992–2012, Selected Years
Unemployment Rate
YearLess than a
High School Diploma High School DiplomaSome College,
No Degree Associate DegreeBachelor’s Degree
or HigherBA/HS
Unemployment Rate Ratio
1992 11.5% 6.8% 6.0% 4.8% 3.2% 0.46
1997 8.1% 4.3% 3.5% 2.7% 2.0% 0.47
2002 8.4% 5.3% 4.8% 4.0% 2.9% 0.55
2007 7.1% 4.4% 3.8% 3.0% 2.0% 0.46
2010 14.9% 10.3% 9.2% 7.0% 4.7% 0.46
2012 12.4% 8.3% 7.7% 6.2% 4.0% 0.48
The unemployment rate for individuals with at least a bachelor’s degree has consistently been about half the unemployment rate for high school graduates.
– The 4.0% 2012 unemployment rate for individuals ages 25 and older with at least a bachelor’s degree represented a decline from the 4.7% peak for this group in 2010. For associate degree holders, the decline was from 7.0% to 6.2% and for those with some college but no degree, the unemployment rate fell from 9.2% in 2010 to 7.7% in 2012.
– The 8.3% 2012 unemployment rate for individuals ages 25 and older with high school diplomas represented a decline from the 10.3% peak for this group in 2010. For those who are not high school graduates, the decline was from 14.9% to 12.4%.
– Over the 20 years from 1992 to 2012, the largest gaps between the unemployment rates for four-year college graduates and high school graduates were 5.6 percentage points in 2010 and 5.1 points in 2009 and 2011. The smallest gaps were 1.7 to 1.9 percentage points from 1999 through 2001.
– From 1992 through 2012, the difference between the annual unemployment rate for individuals with some college but no degree and high school graduates ranged from 0.3 percentage points in 2003 to 1.1 percentage points in 2010.
20122010200820062004200220001998199619941992
Less than a High School DiplomaHigh School DiplomaSome College, No DegreeAssociate DegreeBachelor’s Degree or Higher
Une
mpl
oym
ent R
ate
Year
0%
2%
4%
6%
8%
10%
12%
14%
16%
Other Economic Benefits

Part 1: Individual and Societal Benefits20 EDUCATION PAYS 2013
Unemployment
In 2012, when the unemployment rate for 25- to 34-year-olds with four-year college degrees was 4.1%, 11.2% of high school graduates in this age range were unemployed.
– The 2012 unemployment rates for 25- to 34-year-olds were 9.6% for those with some college but no degree and 7.2% for those with associate degrees.
– In 2012, the unemployment rate for 25- to 34-year-old four-year college graduates was slightly higher than the 3.9% rate for those ages 45 to 54. However, the unemployment rate for 25- to 34-year-old high school graduates was 11.2%, much higher than the 7.4% rate for those ages 45 to 54.
– The gaps in unemployment rates by education level were narrower for Asians than for other groups. The 2012 unemployment rate for Asian bachelor’s degree recipients was 70% of that for high school graduates, compared to 47% for blacks and Hispanics and 49% for whites.
– The 6.3% unemployment rate for black four-year college graduates in 2012 was about 70% higher than the 3.7% unemployment rate for white four-year college graduates. The 13.4% unemployment rate for black high school graduates was 79% higher than the 7.5% unemployment rate for white high school graduates.
– The 7.1 percentage point gap between the unemployment rates for blacks with at least a bachelor’s degree and black high school graduates is larger than the differences within other racial/ethnic groups, which range from 1.8 percentage points for Asians to 3.9 percentage points for Hispanics.
FIGURE 1.9B Unemployment Rates of Individuals Ages 25 and Older, by Age and Education Level, 2012
FIGURE 1.9C Unemployment Rates of Individuals Ages 25 and Older, by Race/Ethnicity and Education Level, 2012
SOURCES: U.S. Census Bureau, 2012b; calculations by the authors.
SOURCES: Bureau of Labor Statistics, 2013b; calculations by the authors. SOURCES: Bureau of Labor Statistics, 2013b; calculations by the authors.
Labor Force Participation Rates of Individuals Ages 25 and Older, by Race/Ethnicity and Education Level, 2012
Less than a High School
Diploma
High School
Diploma
Some College,
No Degree
Associate Degree
Bachelor’s Degree or
Higher
Asian 44% 60% 69% 72% 76%
Black 37% 62% 69% 75% 79%
Hispanic 61% 71% 76% 79% 80%
White 47% 59% 65% 73% 76%
Other Economic Benefits
6.8%
6.1% 7.0%
6.3%
4.3%
20.4
%
13.4
%
11.6
%
10.2
%
6.3% 11
.0%
9.0%
8.0%
8.0%
5.1%
11.4
%
7.5%
6.9%
5.4%
3.7%
Less than a High SchoolDiploma
High School Diploma
Some College,No Degree
Associate Degree
Bachelor’s Degree or Higher
Une
mpl
oym
ent R
ate
Race/Ethnicity and Education Level
0%
5%
10%
15%
20%
25%
WhiteHispanicBlackAsian
15.4
%
11.2
%
9.6%
7.2%
4.1%
12.1
%
8.7%
7.7%
6.0%
3.4%
11.9
%
7.4%
6.6%
5.3%
3.9%
10.6
%6.
3%
6.5%
5.9%
4.5%
Une
mpl
oym
ent R
ate
Age and Education Level
0%
5%
10%
15%
20%
25%
55 to 6445 to 5435 to 4425 to 34
Less than a High SchoolDiploma
High School Diploma
Some College,No Degree
Associate Degree
Bachelor’s Degree or Higher

EDUCATION PAYS 2013 21 For detailed data, see: trends.collegeboard.org.
Job Satisfaction
Among workers ages 30 to 45 with a bachelor’s degree or higher, 56% strongly agree that their jobs require them to keep learning new things. Among those with some college or an associate degree, 44% strongly agree with this statement, compared to just over 30% of those with a high school diploma.
– The percentage of workers ages 30 to 45 who report being very satisfied with their work ranges from 42% of those with less than a high school diploma and 47% of those with a high school diploma to 51% of those with a bachelor’s degree or higher.
– Differences in the percentage of workers who report being at least moderately satisfied with their work are smaller, ranging from 83% of those with less than a high school diploma to 89% of those with a bachelor’s degree or higher.
ALSO IMPORTANT:
– Over the 40 years from 1972 to 2012, 44% of employed individuals ages 30 to 45 who report being very satisfied with their jobs also report being very happy, while 24% of those who report being moderately satisfied with their jobs and 17% of those who report being dissatisfied with their jobs report being very happy. (National Opinion Research Center, 2013; calculations by the authors)
– Many factors determine job satisfaction. They include demographic factors, job characteristics, and earnings.
– Controlling for many individual demographic characteristics and income, education still has a significant and positive effect on job satisfaction. (Oreopoulos & Salvanes, 2011)
FIGURE 1.10A Sense of Learning New Things on the Job Among Employed Individuals Ages 30 to 45, by Education Level, 2002, 2006, and 2010
FIGURE 1.10B Work Satisfaction Rates Among Employed Individuals Ages 30 to 45, by Education Level, 1972–2012
NOTE: Based on the General Social Survey 1972–2012 cumulative data file with combined data from each survey year. Includes individuals ages 30 to 45 who were working full time or part time at the time of the survey. Figure 1.10A reports on the percentage of individuals who agreed with the following statement: “My job requires that I keep learning new things” (available in survey years 2002, 2006, and 2010) and Figure 1.10B reports on responses to the following question: “On the whole, how satisfied are you with the work you do?” (available in most years from 1972 to 2012). Components may not sum to totals because of rounding.
SOURCE: National Opinion Research Center, 2013.
Bachelor’s Degree or
Higher
Some College orAssociate
Degree
High School
Diploma
Less than a High School
Diploma
Very Satis�ed
Moderately Satis�ed
40% 41% 39% 38%
42% 47% 48% 51%
83%88% 87% 89%
Perc
enta
ge o
f Ind
ivid
uals
0%
20%
40%
60%
80%
100%
Education Level
Bachelor’s Degree or
Higher
Some College orAssociate
Degree
High School
Diploma
Less than a High School
Diploma
Strongly Agree
Agree
46% 48%
44% 38%
35% 32%
44% 56%
81% 81%89%
94%
Perc
enta
ge o
f Ind
ivid
uals
0%
20%
40%
60%
80%
100%
Education Level
Other Economic Benefits

Part 1: Individual and Societal Benefits22 EDUCATION PAYS 2013
Social Mobility
Of adults who grew up in the middle family income quintile, 31% of those with a four-year college degree moved up to the top income quintile between 2000 and 2008, compared with just 12% of those without a four-year college degree.
– Of adults who grew up in the bottom family income quintile, 47% of those without a bachelor’s degree remained in the bottom quintile, compared to 10% of those with a four-year college degree. Three percent of those without a bachelor’s degree had moved up to the top quintile, compared to 10% of those with a four-year college degree.
– Of adults who grew up in the top family income quintile, 51% of those with a bachelor’s degree remained in the top quintile, compared with 25% of those without a four-year college degree. Four percent of those with a bachelor’s degree had moved down to the bottom quintile, compared with 13% of those without a four-year college degree.
ALSO IMPORTANT:
– There is geographic variation in upward mobility within the United States, with less mobility in metropolitan areas in the Southeast and industrial Midwest and the highest mobility in metropolitan areas in the Northeast, Great Plains and West. (Chetty, Hendren, Kline, & Saez, 2013)
– There is less economic mobility across generations in the United States than in other developed countries such as the U.K., France, Germany, Sweden, Italy, Australia, Finland, Denmark, and Canada. (Pew Charitable Trusts, 2011)
– The high level of economic inequality in the United States is widely viewed as an important explanation for the relatively low level of social mobility in this country. Other explanations include inequality in childhood educational opportunities and disparities in the resources parents at different levels of the income distribution devote to enrichment activities for their children. (Krueger, 2012; Corak, 2013; Greenstone et al., 2013)
– Over the past four decades, high-income families have gone from spending slightly more than four times as much as low-income families on education and enrichment activities for their children to spending nearly seven times as much. (Duncan & Murnane, 2011)
FIGURE 1.11 Family Income Quintiles of Adult Children, by Education and Parents’ Family Income Quintile, 2000 to 2008
Family Income Quintiles of Adult Children, by Parents’ Family Income Quintile
Parents’ Income Quintile
Family Income Quintile of Adult Children
Lowest Second Third Fourth Highest
Top 8% 10% 19% 23% 40%
Fourth 9% 20% 23% 24% 24%
Third 14% 20% 23% 24% 19%
Second 25% 24% 18% 20% 14%
Bottom 43% 27% 17% 9% 4%
NOTE: “Family income” includes all taxable income (such as earnings, interest, and dividends) and cash transfers (such as Social Security and welfare) of all family members and has been adjusted for family size and inflation. “Income for parents” is computed as the mean value of total family income taken as reported in the Panel Study of Income Dynamics (PSID), 1967 through 1971. “Income for children” is computed as the mean value of total family income taken as reported in the PSID for the years 2000, 2002, 2004, 2006, and 2008. Percentages may not sum to 100 because of rounding.
SOURCE: Pew Charitable Trusts, 2012, Figures 3 and 18.
4%
5%
7%
12%
10% 37% 26% 17% 10%
14% 10% 27% 37%
15% 21% 26% 31%
10% 23% 27% 35%
5% 16% 23% 51%
Fourth HighestThirdSecondLowest
Pare
nts’
Inco
me
Qui
ntile
Percentage of Adult Children
Four-Year College Graduate Adult Children
0% 20% 40% 60% 80% 100%
Bottom
Second
Third
Fourth
Top
Other Economic Benefits
Fourth HighestThirdSecondLowest
13%
12%
17%
28%
47% 26% 16% 8%
3%
24% 20% 18% 9%
22% 25% 23% 12%
26% 22% 22% 18%
16% 22% 24% 25%
Pare
nts’
Inco
me
Qui
ntile
Percentage of Adult Children
Non-College Graduate Adult Children
0% 20% 40% 60% 80% 100%
Bottom
Second
Third
Fourth
Top

EDUCATION PAYS 2013 23 For detailed data, see: trends.collegeboard.org.
Pension Plans
– Employer-provided pension coverage has declined over the past 20 years, with the most rapid declines occurring in the most recent decade and for workers without a college education, particularly those without a high school diploma.
– The percentage of high school graduates working full time year-round who were offered pension coverage was 60% in 1991 and 2001, but had declined to 52% by 2011. The percentage of full-time workers with a bachelor’s degree who were offered pension plans was 72% in 1991, 74% in 2001, and 65% in 2011. The coverage rate for those with advanced degrees was 78% in 1991, 79% in 2001, and 73% in 2011.
– In 2011, the percentage of full-time workers offered pension plans by their employers who chose to participate ranged from 77% for those without a high school diploma to 94% for those with an advanced degree.
ALSO IMPORTANT:
– In 2011, the percentage of part-time workers (those who worked at least 20 hours a week for at least 26 weeks but less than full time year-round) offered pension plans ranged from 20% for those without a high school diploma and 33% for high school graduates to 46% for bachelor’s degree recipients and 58% for those with an advanced degree. (U.S. Census Bureau, 2012a; calculations by the authors.)
– In 2010, 68% of private sector employees with pension plans had access only to defined contribution plans, in which the payout depends on the amount accumulated in a personal account. Over time, these plans have become more common than defined benefit plans, which provide a predetermined income level each year after retirement. (U.S. Census Bureau, 2012d, Table 655)
– Low earnings levels, which are more common among individuals with lower education levels, may explain some decisions not to participate in employer-provided pension plans that require workers to contribute a portion of their wages.
SOURCES: U.S. Census Bureau, 1992, 2002a, and 2012a; calculations by the authors.
SOURCES: U.S. Census Bureau, 2012a; calculations by the authors.
FIGURE 1.12A Employer-Provided Pension Plan Coverage Among Full-Time Year-Round Workers Ages 25 and Older, by Education Level, 1991, 2001, and 2011
FIGURE 1.12B Participation Rates in Employer-Provided Pension Plans Among Eligible Full-Time Year-Round Workers Ages 25 and Older, by Education Level, 2011
College-educated workers are more likely than others to be offered pension plans by their employers. Among those to whom these plans are available, participation rates are higher for individuals with higher education levels.
Bachelor’s Degree
AdvancedDegree
Some College,No Degree
AssociateDegree
High School Diploma
Less than a High School
Diploma
77% 86% 88% 89% 92% 94%
Perc
enta
ge P
artic
ipat
ing
0%
20%
40%
60%
80%
100%
Education Level
1991 2001 2011
43%38%
29%
60%60%52%
66% 66%59%
68% 70%63%
72% 74%65%
78% 79%73%
Perc
enta
ge O
ffere
d
Education Level and Year
0%
20%
40%
60%
80%
100%
Advanced Degree
Bachelor’s Degree
Associate Degree
Some College, No Degree
High School Diploma
Less than a High School
Diploma
Other Economic Benefits

Part 1: Individual and Societal Benefits24 EDUCATION PAYS 2013
FIGURE 1.13A Employer-Provided Health Insurance Coverage Among Full-Time Year-Round Workers Ages 25 and Older, by Education Level, 1991, 2001, and 2011
FIGURE 1.13B Employer-Provided Health Insurance Coverage Among Part-Time Workers Ages 25 and Older, by Education Level, 1991, 2001, and 2011
Health Insurance
Among both full-time and part-time workers, those with higher levels of educational attainment are more likely than others to be covered by employer-provided health insurance.
– Between 1991 and 2011, health insurance coverage declined by 15% (10 percentage points) for high school graduates working full time year-round. The coverage rate declined from 65% in 1991 to 62% in 2001 and to 55% in 2011.
– Between 1991 and 2011, health insurance coverage declined by 8% (6 percentage points) for four-year college graduates without advanced degrees working full time year-round. The coverage rate declined from 75% in 1991 to 74% in 2001 and to 69% in 2011.
– In 1991, 61% of advanced degree holders, 45% of bachelor’s degree holders, and 36% of high school graduates working part time were covered by employer-provided health insurance. By 2011, those percentages had declined to 48%, 39%, and 27%, respectively.
ALSO IMPORTANT:
– In 2011, hospitals in the U.S. provided about $41.1 billion in care for which they were not compensated. This cost fell indirectly on federal and state governments and insured patients. (American Hospital Association, 2012)
– In 2011, when 18% of adults ages 18 and older were not covered by health insurance at any time during the year, only 9% of those with a bachelor’s degree or higher were not covered. This was the case for 15% of those with associate degrees, 18% of those with some college but no degree, and 21% of high school graduates. (U.S. Census Bureau, 2012h, Table HI01)
– In 2011, when 30% of adults ages 18 and older were covered by government health care plans, 20% of adults with a bachelor’s degree or higher, 25% of those with an associate degree, 27% of those with some college but no degree, and 36% of high school graduates had government coverage. (U.S. Census Bureau, 2012h, Table HI01)
NOTE: Part-time workers are those who worked at least 20 hours a week for at least 26 weeks during the year, but did not work full time year-round.
SOURCES: U.S. Census Bureau, 1992, 2002a, and 2012a; calculations by the authors.
1991 2001 2011
52%
65% 69% 71%75%
83%
45%
62% 66% 69%74% 76%
34%
55% 60% 64%69% 73%
Education Level and Year
Advanced Degree
Bachelor’s Degree
Associate Degree
Some College, No Degree
High School Diploma
Less than a High School
Diploma
Perc
enta
ge C
over
ed
0%
20%
40%
60%
80%
100%
1991 2001 2011
25%
36% 34%39%
45%
61%
22%
35% 38%43%
49%57%
16%
27% 30% 32%39%
48%
Education Level and Year
Advanced Degree
Bachelor’s Degree
Associate Degree
Some College, No Degree
High School Diploma
Less than a High School
Diploma
Perc
enta
ge C
over
ed
0%
20%
40%
60%
80%
100%
Other Economic Benefits

EDUCATION PAYS 2013 25 For detailed data, see: trends.collegeboard.org.
FIGURE 1.14A Percentage of Individuals Ages 25 and Older Living in Households in Poverty, by Household Type and Education Level, 2011
FIGURE 1.14B Living Arrangements of Children Under 18 Years of Age, by Poverty Status and Highest Education of Either Parent, 2011
NOTE: The numbers in parentheses on the x-axis represent each household type as a percentage of all households.
SOURCES: U.S. Census Bureau, 2012a; calculations by the authors.
SOURCE: U.S. Census Bureau, 2011d, Table C-3.
Poverty
– Individuals living in households headed by unmarried females with children under 18 have particularly high poverty rates. This family structure accounts for 6% to 9% of households headed by individuals with less than a four-year college degree, but only 3% of households headed by four-year college graduates. (Not shown in graph; U.S. Census Bureau, 2012a; calculations by the authors.)
– The 12% poverty rate for bachelor’s degree recipients living in families headed by unmarried females in 2011 was two and a half times as high as the overall poverty rate for those with a bachelor’s degree or higher, but was less than a third of the 40% poverty rate for high school graduates living in similar families.
– The 2011 poverty rate for all associate degree recipients was 8%, compared to 11% for individuals with some college but no degree and 14% for high school graduates with no college experience.
– In 2011, the percentage of all children under age 18 who lived with both parents increased with the highest education level of either parent.
ALSO IMPORTANT:
– The official poverty threshold varies with family size, number of children under 18, and senior citizen status. In 2011, a family of four with two children was considered poor if it had an income below $22,811. The poverty threshold was $11,702 for a single person under age 65 and $18,123 for a family of three with two children. (U.S. Census Bureau, 2011e)
– The poverty threshold is the official measure of poverty and is slightly different from the poverty guidelines used to determine eligibility for public programs. In 2011, the poverty guideline for families of four issued by the Department of Health and Human Services was $22,350. (U.S. Department of Health and Human Services, 2011)
The 5% poverty rate in 2011 for bachelor’s degree recipients was about one-third of the 14% poverty rate for high school graduates.
69% 24% 7%
42% 47% 11%
77% 17% 6%
53% 31% 16%
59% 26% 14%
67% 23% 10%
86% 9%
5%
3%
92%5%
Percentage of Children Under 18
0% 20% 40% 60% 80% 100%
Living with Mothers Only
Advanced Degree
Bachelor’s Degree
Some College or Associate Degree
High School Diploma
Less than a HighSchool Diploma
100% of Povertyand Above
Below 100% of Poverty
All Children
Living with Fathers Only or Other Living Arrangements
Living with Both Parents
Pove
rty
Stat
us a
nd P
aren
ts’ E
duca
tion
Leve
l
Hig
hest
Edu
catio
nof
Eith
er P
aren
tPo
vert
ySt
atus
58%
40%33%
24%
12%
29%
11%7% 4% 2%
28%
14% 11% 8% 5%
Less than a High SchoolDiploma
High School Diploma
Some College,No Degree
Associate Degree
Bachelor’s Degree or Higher
Household Type and Education Level
All HouseholdsMarried Couples with Related Children Under 18 (25%)
Female Householders with Related Children
Under 18 (6%)
Perc
enta
ge in
Pov
erty
0%
20%
40%
60%
80%
100%
Other Economic Benefits

26 EDUCATION PAYS 2013 Part 1: Individual and Societal Benefits
Public Assistance Programs
SOURCES: U.S. Census Bureau, 2012a; calculations by the authors.
FIGURE 1.15 Percentage of Individuals Ages 25 and Older Living in Households Participating in Selected Public Assistance Programs, by Education Level, 2011
In 2011, the percentages of high school graduates ages 25 and older living in households receiving benefits from SNAP (the Supplemental Nutrition Assistance Program — formerly known as Food Stamps) and from the free and reduced-price school lunch program were about six times as high as the percentages of those with a bachelor’s degree or higher participating in these programs.
– In 2011, about a quarter of adult high school graduates and 43% of those without a high school diploma lived in households that received Medicaid coverage. Participation rates were 19% for those with some college but no degree, 17% for those with an associate degree, and 9% for those with at least a four-year college degree.
ALSO IMPORTANT:
– Medicaid provides health insurance to many low-income families and other eligible individuals. The National School Lunch Program provides free or reduced-price lunches to eligible school children. SNAP subsidizes food purchases for eligible low-income households.
– The participation rates for Medicaid, SNAP, and the school lunch program were higher in 2011 than in 2008 and 2005, with the largest increases seen in adults without a high school diploma and the smallest increases seen in those with a four-year college degree. (Baum & Ma, 2007; Baum, Ma, & Payea, 2010)
– In 2008, 28.4 million participants received an annual average of $1,218 in SNAP benefits. Thirty-one million children received free or
reduced-price school lunches, at a total cost of $8.3 billion to the federal government. In 2006, 57.8 million participants received a total of $269.9 billion in Medicaid benefits. (U.S. Census Bureau, 2010c, Tables 144 and 558)
– A 2009 study from the RAND Corporation estimated that the discounted lifetime savings to taxpayers from reduced spending on social programs resulting from the increase from a high school diploma to some college ranged from $9,000 per white man to $22,000 per black woman (in 2002 dollars). Estimated reductions resulting from the increase from some college to a bachelor’s degree range from $9,000 per white man to $32,000 per black woman. (Carroll & Erkut, 2009, Tables 7.3 and 7.4)
43%
19%17%
9%
24% 22%
9% 7%2%
11%
24%
10%7%
2%
12%
Less than a High School Diploma
High School Diploma Some College,No Degree
Associate Degree Bachelor’s Degree or Higher
0%
10%
20%
30%
40%
50%
SNAPSchool LunchMedicaid
Perc
enta
ge P
artic
ipat
ing
Public Assistance Program
Other Economic Benefits

EDUCATION PAYS 2013 27 For detailed data, see: trends.collegeboard.org.
Smoking rates among college graduates have been significantly lower than smoking rates among other adults since information about the risks of smoking became public.
– Smoking rates in the United States increased in the 1940s, peaked at 46% in 1957, and began a steady decline in the 1960s.
– College graduates were at least as likely as others to smoke before the medical consensus on the dangers of smoking became clear. By 1970, when information was widespread and clear public warnings were mandatory, the smoking rate among college graduates had declined to 37%, while 44% of high school graduates smoked. This gap increased to 13 points in 1982, to 16 points in 1992, and to 17 points in 2012.
– In 2012, only 8% of individuals with at least a bachelor’s degree smoked, compared to 20% of those with some college or an associate degree and 25% of high school graduates and of those without a high school diploma.
– Among smokers with at least some college experience, almost half attempted to stop smoking in 2012. Among those with high school diplomas, 11% out of the 25% who smoked tried to quit.
ALSO IMPORTANT:
– Statistical analysis suggests that higher levels of education are not just correlated with lower smoking rates, but also cause declines in smoking. (de Walque, 2004; Grimard & Parent, 2007)
– In their analysis of the positive relationship between education and health outcomes, much of which is explained by differences in behaviors, Cutler and Lleras-Muney (2010) find that income, health insurance, and family background account for about 30% of the differences, but knowledge and measures of cognitive ability explain an additional 30%, with social networks explaining another 10% of the differences. The authors argue that “more important than specific knowledge is how one thinks.” They find that much of the difference seems to be driven by the fact that education raises cognition, which in turn improves behavior.
Smoking
FIGURE 1.16A Smoking Rates Among Individuals Ages 25 and Older, by Education Level, 1940–2012
FIGURE 1.16B Distribution of Smoking Histories Among Individuals Ages 25 and Older, by Education Level, 2012
NOTE: Percentages may not sum to 100 because of rounding.
SOURCES: National Center for Health Statistics, 2013; calculations by the authors.
NOTE: Data for 2001 through 2005 are three-year moving averages.
SOURCES: de Walque, 2004; National Center for Health Statistics, 2002–2013; calculations by the authors.
Smok
ing
Rate
Year
1940 1945 1950 1955 1960 1965 1970 1975 1980 1985 1990 1995 2000 2005 20120%
20%
40%
60%
Less than a High School DiplomaHigh School DiplomaSome College or Associate DegreeBachelor’s Degree or Higher
Health Benefits
53% 49% 52% 57% 68% 72%
10%
14%
11%
14%
10%
11%
9%
9% 5%4%
3%
3%
26%22% 27%25%
23%22%
Perc
enta
ge o
f Ind
ivid
uals
0%
20%
40%
60%
80%
100%
Education Level
Advanced Degree
Bachelor’s Degree
Associate Degree
Some College, No Degree
High School Diploma
Less than a High School
Diploma
Never SmokedFormer SmokerCurrent Smoker Who Tried to Quit in the Past 12 MonthsCurrent Smoker Who Did Not Try to Quit in the Past 12 Months

Part 1: Individual and Societal Benefits28 EDUCATION PAYS 2013
Exercise
Among young adults between the ages of 25 and 34, 68% of four-year college graduates and 40% of high school graduates reported exercising vigorously at least once a week in 2012; 17% of four-year college graduates and 20% of high school graduates reported light or moderate exercise.
– Among 55- to 64-year-olds, 52% of high school graduates reported some exercise and 25% reported exercising vigorously; 80% of four-year college graduates reported some exercise and 53% reported vigorous exercise.
– In 2011, 63% of four-year college graduates and 38% of high school graduates reported meeting the federal guidelines for physical activity of at least 2½ hours a week of moderate or 1¼ hours of intensive aerobic activity.
ALSO IMPORTANT:
– Numerous studies investigating the relationship between education and health support the idea that the skills, attitudes, and thought patterns fostered by education lead to more responsible health-related behaviors. (Mirowsky & Ross, 2003)
– Improvements in health are associated with each additional year of schooling, but in contrast to the relationship between education and wages, there does not appear to be a “sheepskin” effect with the completion of a degree having a bigger impact than just the completion of an additional year of education. (Cutler & Lleras-Muney, 2006)
– Additional health care costs in the United States in 2000 attributable to physical inactivity have been estimated at about $200 billion. (Sari, 2009)
SOURCES: National Center for Health Statistics, 2013; calculations by the authors.
FIGURE 1.17B Age-Adjusted Percentage Distribution of Leisure-Time Aerobic Activity Levels Among Individuals Ages 25 and Older, by Education Level, 2011
NOTE: “Inactive” is participating in no leisure-time aerobic activity that lasted at least 10 minutes. “Insufficiently Active” is participating in aerobic activities for at least 10 minutes but less than 150 minutes per week. “Sufficiently Active,” which meets 2008 federal physical activity guidelines, is participating in moderate-intensity leisure-time physical activity at least 150 minutes per week, or in vigorous-intensity leisure-time physical activity at least 75 minutes per week, or an equivalent combination. Percentages shown were age-adjusted using the projected 2000 U.S. population provided by the U.S. Census Bureau as the standard population. Age adjustment was used to allow comparisons among various population subgroups that have different age distributions. Percentages may not sum to 100 because of rounding.
SOURCE: Centers for Disease Control and Prevention, 2012, Table 29.
FIGURE 1.17A Exercise Rates Among Individuals Ages 25 and Older, by Age and Education Level, 2012
Bachelor’s Degree or
Higher
Some College orAssociate
Degree
High School
Diploma
Less than a High School
Diploma
29% 38%
48% 63%
17%
21%
30%
22%
43%
19%
54%
17%
Inactive
Insuf�ciently Active
Suf�ciently Active (met guidelines)
Perc
enta
ge o
f Ind
ivid
uals
0%
20%
40%
60%
80%
100%
Education Level
Health Benefits
Percentage of Individuals
0% 20% 40% 60% 80% 100%
Age
and
Edu
catio
n Le
vel
25 to
34
35 to
44
45 to
54
55 to
64
65 a
nd o
lder
Less than a High School Diploma High School Diploma
Some College, No DegreeAssociate Degree
Bachelor’s Degree or Higher
Vigorous Light/Moderate
39%
40%
53%
56%
68%
28%
40%
50%
54%
65%
23%
33%
42%
44%
59%
34%
38%
53%
12%
17%
25%
24%
39%
18% 22%
26%
19%
20%
18%
20%
17%
23%
20%
20%
20%
19%
22%
25%
23%
28%
24%
25% 27%
32%
29%
27%
33%
32%
36%
33%

EDUCATION PAYS 2013 29 For detailed data, see: trends.collegeboard.org.
Obesity
In 2007–2010, when 35% of all men and 36% of all women ages 25 and over were defined as obese, 28% of men and 26% of women with bachelor’s degrees were obese.
– Among those without four-year college degrees, higher levels of education were not associated with lower levels of obesity in 2007–2010.
– Obesity rates increased dramatically from 1988–1994 to 2007–2010 for both men and women at all levels of education. The largest increases were for those with some college or an associate degree.
– In 2007–2010, 11% of boys and 7% of girls ages 2–19 whose household head had at least a bachelor’s degree were obese. Obesity rates were much higher for children whose parents had lower levels of education.
– The gap between the obesity rates of girls whose household head had a high school diploma and those whose household head had at least a bachelor’s degree increased from 7 percentage points (12% vs. 5%) in 1988–1994 to 14 percentage points (21% vs. 7%) in 2007–2010.
ALSO IMPORTANT:
– At least a portion of the correlation between obesity and education levels is likely due to income and the prices of different types of food. Differences in exercise patterns and in dietary knowledge and choices are also relevant.
– Some estimates suggest the additional health care cost attributable to obesity was about $361 per adult in 2008; the total cost could increase fourfold by 2018 if the current rate of increase in obesity continues. (United Health Foundation, 2009)
– More sophisticated statistical estimates of the health care costs of obesity are higher. Cawley and Meyerhoefer (2012) find that obesity raises annual medical costs by an average of $2,826 (in 2005 dollars). They estimate the annual cost of treating obesity in the adult population as $168.4 billion, or 16.5% of national spending on medical care.
– Research indicates that disparities in obesity by socioeconomic status increase with age. One estimate suggests that an additional year of maternal education reduces obesity by an average of 1.2 percentage points and that this effect increases by 0.07 points per year of age. (Baum & Ruhm, 2009)
FIGURE 1.18A Age-Adjusted Obesity Rates Among Adults Ages 25 and Older, by Gender and Education Level, 1988–1994 and 2007–2010
NOTE: Data from 1988 to 1994 were combined to generate estimates for 1988–1994; data from 2007 to 2010 were combined to generate estimates for 2007–2010. Obesity is defined as body mass index (BMI) of 30 or higher, equivalent to being at least about 30 pounds overweight at average heights.
SOURCE: National Center for Health Statistics, 2011a, Figure 37.
* For boys from households with at least a bachelor’s degree, the variation within the group in 1988–1994 is too large to generate a reliable estimate.
NOTE: Obesity is defined as a BMI at or above the 95th percentile for children of the same gender and age in months, based on the 2000 CDC growth charts for the United States.
SOURCE: National Center for Health Statistics, 2011a, Figure 25.
FIGURE 1.18B Obesity Rates Among Children and Adolescents Ages 2 to 19, by Gender and Highest Household Education Level, 1988–1994 and 2007–2010
15%
11%
9%
11%
12%
9%
5%
24%
19%
18%
11%
7%
14%
22%
21%
Obesity Rate
Bachelor’s Degreeor Higher *
Some College orAssociate Degree
High SchoolDiploma
Less than a HighSchool Diploma
Bachelor’s Degreeor Higher
Some College orAssociate Degree
High SchoolDiploma
Less than a HighSchool Diploma
1988–19942007–2010
Gen
der a
nd H
ouse
hold
Edu
catio
n Le
vel
0% 10% 20% 30% 40% 50%
Gir
lsB
oys
23%33%
22%37%
22%42%
16%28%
21%35%
33%44%
28%39%
25%40%
17%26%
27%36%
Obesity Rate
All
Bachelor’s Degreeor Higher
Some College orAssociate Degree
High SchoolDiploma
Less than a HighSchool Diploma
All
Bachelor’s Degreeor Higher
Some College orAssociate Degree
High SchoolDiploma
Less than a HighSchool Diploma
1988–19942007–2010
Gen
der a
nd E
duca
tion
Leve
l
0% 10% 20% 30% 40% 50%
Wom
enM
en
Health Benefits

Part 1: Individual and Societal Benefits30 EDUCATION PAYS 2013
Other Individual and Societal Benefits
NOTE: Figures 1.19A, 1.19B and the table are based on the 2003–2012 American Time Use Surveys (ATUS) and include mothers ages 25 and older who have at least one “own child” in the household. “Play activities” include sports, arts and crafts, and general play with household children. “Management activities” include attending events, traveling, planning activities for children, picking up/dropping off children, and waiting for/with household children.
SOURCES: Bureau of Labor Statistics, 2013; calculations by the authors.
Parents and Children
FIGURE 1.19A Total Amount of Time (in Minutes) Mothers Spend per Day on Children Under the Age of 18, by Employment Status and Education Level, 2003–2012
FIGURE 1.19BTotal Amount of Time (in Minutes) Mothers Spend per Day on Children’s Activities, by Type of Activity, Age of Youngest Child, Mother’s Employment Status and Education Level, 2003–2012
Among both those who are employed and those who are not, the amount of time mothers spend on their children’s activities increases with levels of education.
– Employed mothers with four-year college degrees report spending about 51% more time (113 minutes vs. 75 minutes per day) on their children’s activities than employed mothers who are high school graduates. Among those who are not employed, the difference is about 42% (188 minutes vs. 132 minutes per day).
– The amount of time mothers with children under the age of 3 report
playing with their children increases with level of education. When children are between the ages of 3 and 5, mothers with bachelor’s degrees report more play time, but those with some college or an associate degree spend about the same amount of time as high school graduates playing with their children.
– For older children, mothers spend more time facilitating children’s outside and enrichment activities than on other
child-related activities. Differences between those with bachelor’s degrees and those without are large, especially among mothers who are not employed.
ALSO IMPORTANT:
– Kalil, Ryan, and Corey (2012) find that “highly educated mothers not only spend more time in active child care than less educated mothers, but that they alter the composition of that time to suit children’s developmental needs more than less educated mothers.”
Percentage of Mothers Who Are Employed, by Age of Youngest Child and Mother’s Education Level, 2003–2012
Age of Youngest Child
Mother’s Education Level
Under 18
Under 3
Between 3 and 5
Between 6 and 13
Between 14 and 17
Less than a High School Diploma
43% 32% 41% 48% 53%
High School Diploma 65% 51% 59% 70% 76%
Some College or Associate Degree
72% 61% 72% 76% 80%
Bachelor’s Degree or Higher
75% 67% 75% 79% 82%
6175
87
113124 132 141
188
97 95 102
132
Less than a High School Diploma
High School Diploma
Some College orAssociate Degree
Bachelor’s Degree or Higher
Employment Status
AllUnemployed or Not in the Labor Force
Employed
Am
ount
of T
ime
(in M
inut
es)
0
40
80
120
160
200
Employed Unemployedor Not in theLabor Force
All Employed Unemployedor Not in theLabor Force
All Employed Unemployedor Not in theLabor Force
All
3930
11
50
36
52 55
88
28
41 45
63
6
18 18 21 2429 30
38
1622 21 25
20 24 29
3930 29
32
54
26 26 30
42
0
20
40
60
80
100
Am
ount
of T
ime
(in M
inut
es)
Age of Youngest Child and Mother’s Employment Status
Between 6 and 13, Management ActivitiesBetween 3 and 5, Play ActivitiesUnder 3, Play Activities
Less than a High School Diploma
High School Diploma
Some College or Associate Degree
Bachelor’s Degree or Higher

EDUCATION PAYS 2013 31 For detailed data, see: trends.collegeboard.org.
Civic Involvement
FIGURE 1.20B Percentage of Individuals Ages 25 and Older Who Volunteered and the Median Number of Hours Volunteered, by Education Level, 2012
FIGURE 1.20A Understanding of Political Issues Among Individuals Ages 25 and Older, 2012
NOTE: Volunteers are defined as individuals who performed unpaid volunteer activities for organizations during the year ending September 2012.
SOURCE: Bureau of Labor Statistics, 2013c, Tables 1 and 2.
9%(52 hours)
17%(50 hours)
29%(50 hours)
42%(52 hours)
Perc
enta
ge V
olun
teer
ing
Education Level
Bachelor’s Degree and Higher
Some College or Associate Degree
High School Diploma
Less than a High School Diploma
0%
10%
20%
30%
40%
50%
– Among those with a high school diploma, 30% of adults reported understanding nothing or only a little about political issues. Fourteen percent of those with some college or an associate degree and 11% of four-year college graduates gave this response.
– The percentage of four-year college graduates who donate their time to organizations is over twice as high as the percentage of high school graduates who volunteer.
– Among adults with at least a bachelor’s degree, 42% volunteered from Sept. 1, 2011, through Sept. 1, 2012, and the median amount of time they spent volunteering was 52 hours. The 29% of adults with some college or an associate degree, the 17% of high school graduates, and the 9% of adults without a high school diploma who volunteered gave similar amounts of their time.
ALSO IMPORTANT:
– As is the case with most of the indicators included in this report, the correlation seen here should not necessarily be interpreted as causation. Personal characteristics may make people more likely both to pursue higher education and to volunteer. However, statistical analysis suggests that the actual increments in volunteer activity attributable to increased education are similar to those described here. Enrolling in college significantly increases the likelihood of volunteering, controlling for other demographic characteristics. (Dee, 2004; Oreopoulos & Salvanes, 2011)
– At each education level, within each age group, and within each employment category, higher percentages of women than of men volunteered. Overall, 24% of men and 30% of women ages 25 and older volunteered in 2011–2012. (Bureau of Labor Statistics, 2013c, Table 1)
– Volunteering was most common among the 35–44 age group (32%), and least common among those ages 20 to 24 (19%). (Bureau of Labor Statistics, 2013c, Table 1)
NOTE: Figure 1.20A reports on responses to the following question: “How good is your understanding of the important political issues facing our country?” Percentages may not sum to 100 because of rounding.
SOURCE: National Opinion Research Center, 2013, 2012 Experiment Topic Module.
Among adults ages 25 and older, 45% of those with at least a bachelor’s degree, 34% of those with some college or an associate degree, 21% of high school graduates and only 15% of those without a high school diploma reported understanding quite a bit or a great deal about the political issues facing our country.
Other Individual and Societal Benefits
46% 32% 13%
9%
22% 49% 18%
52% 25% 9%5%
3%
2%
8%
8%
10%
1%
44% 35% 10%
Percentage of Individuals
0% 20% 40% 60% 80% 100%
Bachelor’s Degreeor Higher
Some College or Associate Degree
High School Diploma
Less than a HighSchool Diploma
None A Little Some Quite a Bit A Great Deal
Educ
atio
n Le
vel

32 EDUCATION PAYS 2013 Part 1: Individual and Societal Benefits
Voting
FIGURE 1.21A Voting Rates Among U.S. Citizens, by Age and Education Level, 2010 and 2012
FIGURE 1.21B Percentage Distribution of Voting Patterns of U.S. Citizens in the 2012 Presidential Election, by Age and Education Level
NOTE: “Not registered” includes both those who reported that they were not registered and those who did not respond to the registration question. Percentages may not sum to 100 because of rounding.
SOURCES: U.S. Census Bureau, 2010d, 2012i, Table 5; calculations by the authors.
In the 2012 presidential election, the voting rate of 25- to 44-year-old four-year college graduates (73%) was 1.7 times as high as the voting rate of high school graduates (42%) in the same age group. In the 2010 election, 25- to 44-year-old four-year college graduates were twice as likely to vote as high school graduates in the same age group.
– At all levels of education, voting rates increase with age, but the increase is generally greater for those with lower levels of education. In 2012, the voting rate for 65- to 74-year-old high school graduates was 1.6 times the rate for 25- to 44-year-old high school graduates. For four-year college graduates, the voting rate was 1.2 times as high for the older group as for the younger group.
– In 2012, the percentage of citizens who were registered but did not vote ranged from 3% to 4% for four-year
college graduates ages 45 and older to 15% for those ages 75 and older without a high school diploma.
– Within each age group, registration rates increase with education level. In 2012, the percentage of citizens not registered to vote (or not responding to the registration question) ranged from 13% for four-year college graduates between the ages of 65 and 74 to 69% for those between the ages of 18 and 24 without a high school diploma.
ALSO IMPORTANT:
– The highest overall voting rate in presidential elections since 1972 was 65% in 1992. In 2008 and 2012, 64% and 62% of citizens ages 18 and older voted, respectively. The highest voting rate among four-year college graduates was in 1992 (85%), but the 1972 presidential election saw the highest voting rates for those without a bachelor’s degree. (U.S. Census Bureau, 2012i, Historical CPS Time Series Tables, Table A-2)
Bachelor’s Degree or HigherSome College or Associate Degree
High School DiplomaLess than a High School Diploma
Bachelor’s Degree or HigherSome College or Associate Degree
High School DiplomaLess than a High School Diploma
Bachelor’s Degree or HigherSome College or Associate Degree
High School DiplomaLess than a High School Diploma
Bachelor’s Degree or HigherSome College or Associate Degree
High School DiplomaLess than a High School Diploma
Bachelor’s Degree or HigherSome College or Associate Degree
High School DiplomaLess than a High School Diploma9% 23%
15% 29%
27% 50%
33% 63%
15%
25% 42%
38% 58%
51% 73%
26% 39%
44% 59%
58%
69%
72%
80%
39% 53%
54%
69%78%
80%
69%
78%
84%
58%
26%
68%
75%
40%
58%
67%
77%
18 to
24
25 to
44
45 to
64
65 to
74
75 a
nd O
ver
0% 20% 40% 60% 80% 100%
Age
and
Edu
catio
n Le
vel
20122010
Voting Rate
23% 69%8%
29% 58%13%
50% 36%14%
63% 26%12%
26% 60%14%
42% 44%14%
58% 29%13%
73% 19%8%
39% 48%13%
59% 31%10%
72% 20%7%
80% 15%4%
53% 35%12%
69% 24%7%
78% 17%5%
84% 13%
54% 31%15%
69% 21%10%
78% 15%7%
80% 15%
3%
4%
Voted Registered, No Vote Not Registered
0% 20% 40% 60% 80% 100%
Age
and
Edu
catio
n Le
vel
Percentage of U.S. Citizens
18 to
24
25 to
44
45 to
64
65 to
74
75 a
nd O
ver
Other Individual and Societal Benefits

EDUCATION PAYS 2013 33 For detailed data, see: trends.collegeboard.org.
Part 2:The Distribution of the Benefits: Who Participates and Succeeds in Higher Education?
Participation and success rates in higher education differ considerably among demographic groups. Although the gaps in college enrollment rates across racial/ethnic groups have narrowed over time, the gaps between the least privileged youth and their more affluent peers have grown. The percentage of high school graduates from the lowest family income quintile enrolling immediately in college has been stagnant for over a decade, while participation rates for middle- and upper-income youth have continued to increase.
When they do enroll in college, students from low-income families are less likely than others to enroll in four-year institutions and particularly unlikely to enroll in the selective institutions for which they would likely qualify. Moreover, outcomes are highly correlated with family incomes. The percentage of enrolling students from the highest family income quintile earning bachelor’s degrees within six years is twice as high as the percentage from the lowest family income quintile achieving this outcome. And the percentage of those from the least affluent families leaving school without a credential is over twice as high as the percentage of those from the most affluent families experiencing this outcome.
While international comparisons receive more attention, there is considerable variation in educational attainment across states in the U.S. These differences are likely explained by a combination of factors, including demographics and financing patterns. Financing patterns are also important to international comparisons. As Figure 2.12 indicates, the United States relies relatively less on public financing and more on household financing than most other developed countries.
Documenting the different patterns observed among segments of the population is an important first step toward generating awareness that a problem exists and finding solutions. But careful interpretation of the evidence and in-depth analysis of the causes of differences in educational attainment are prerequisites to real progress. A shortage of money may interfere with educational opportunities, but money cannot remove all the barriers faced by many individuals.
As the data reported in Part 1 of Education Pays reveal, adults with some college but no degree earn more and have different life experiences than high school graduates. They do not, however, fare as well as those who earn degrees. There is a growing and valid concern about the detrimental effect on individuals and the wasted resources resulting from low degree completion rates. The indicators that follow rely on a variety of sources to provide multiple views of the educational experiences of different groups of students.
The number of postsecondary certificates awarded doubled between 2001 and 2011, and over 40% of the credentials awarded in 2011 were associate degrees or short-term certificates, as opposed to bachelor’s degrees. Our goal in highlighting gaps in educational attainment is not to suggest that everyone needs a bachelor’s degree or that success in life should be defined by education level.
Individual preferences, goals, and capabilities differ. However, the differences across demographic groups documented here are unsettling. The gap between students from high- and low-income backgrounds in degree attainment is much larger than the gap in college enrollment. The enrollment and degree attainment rates of women have far outpaced those of men in recent years, and black and Hispanic students have not caught up with white students.
The data on college enrollment and completion reported in the following pages are more disturbing in light of the benefits for individuals and for society documented in Part 1 of Education Pays. Limited participation in postsecondary education seriously constrains individual opportunities and living standards. Society as a whole suffers from lower levels of civic engagement and from unnecessary barriers to the success of the next generation, in addition to a loss of productivity and output, when individuals miss out on educational opportunities.
The indicators on the following pages describe pressing problems for our nation. We hope readers will use this information to work toward constructive solutions.
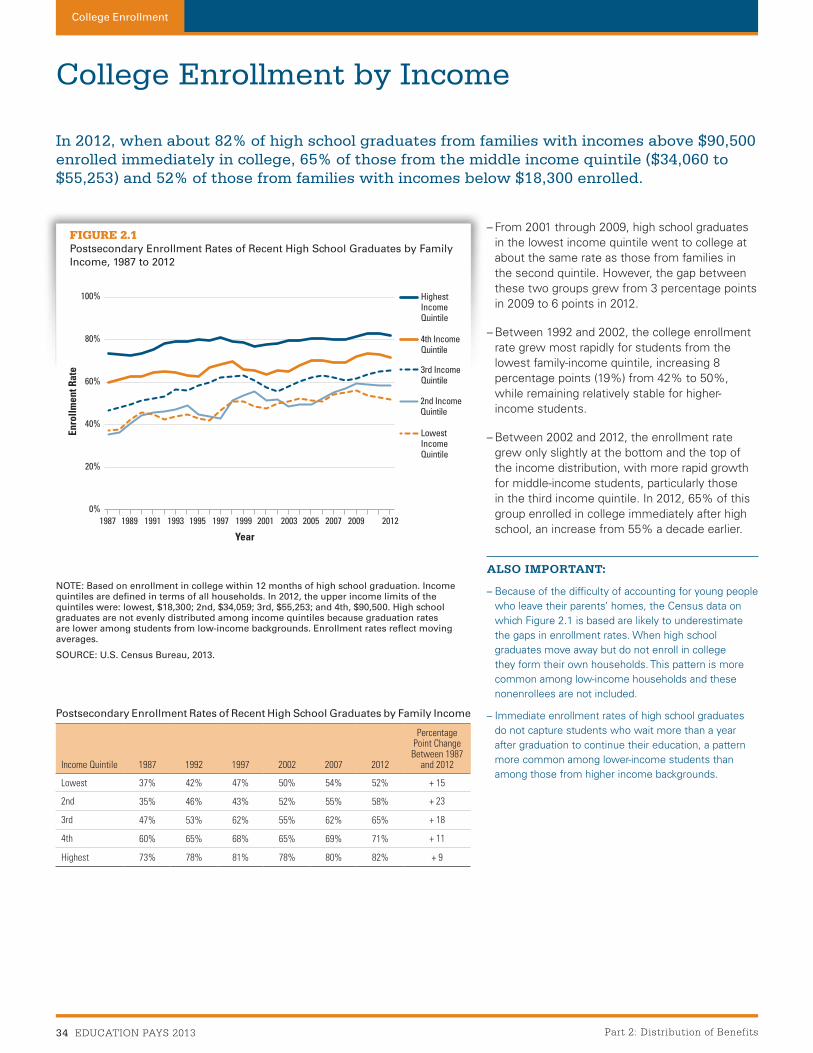
34 EDUCATION PAYS 2013 Part 2: Distribution of Benefits
College Enrollment by Income
– From 2001 through 2009, high school graduates in the lowest income quintile went to college at about the same rate as those from families in the second quintile. However, the gap between these two groups grew from 3 percentage points in 2009 to 6 points in 2012.
– Between 1992 and 2002, the college enrollment rate grew most rapidly for students from the lowest family-income quintile, increasing 8 percentage points (19%) from 42% to 50%, while remaining relatively stable for higher-income students.
– Between 2002 and 2012, the enrollment rate grew only slightly at the bottom and the top of the income distribution, with more rapid growth for middle-income students, particularly those in the third income quintile. In 2012, 65% of this group enrolled in college immediately after high school, an increase from 55% a decade earlier.
ALSO IMPORTANT:
– Because of the difficulty of accounting for young people who leave their parents’ homes, the Census data on which Figure 2.1 is based are likely to underestimate the gaps in enrollment rates. When high school graduates move away but do not enroll in college they form their own households. This pattern is more common among low-income households and these nonenrollees are not included.
– Immediate enrollment rates of high school graduates do not capture students who wait more than a year after graduation to continue their education, a pattern more common among lower-income students than among those from higher income backgrounds.
College Enrollment
FIGURE 2.1Postsecondary Enrollment Rates of Recent High School Graduates by Family Income, 1987 to 2012
NOTE: Based on enrollment in college within 12 months of high school graduation. Income quintiles are defined in terms of all households. In 2012, the upper income limits of the quintiles were: lowest, $18,300; 2nd, $34,059; 3rd, $55,253; and 4th, $90,500. High school graduates are not evenly distributed among income quintiles because graduation rates are lower among students from low-income backgrounds. Enrollment rates reflect moving averages.
SOURCE: U.S. Census Bureau, 2013.
Postsecondary Enrollment Rates of Recent High School Graduates by Family Income
In 2012, when about 82% of high school graduates from families with incomes above $90,500 enrolled immediately in college, 65% of those from the middle income quintile ($34,060 to $55,253) and 52% of those from families with incomes below $18,300 enrolled.
Income Quintile 1987 1992 1997 2002 2007 2012
Percentage Point Change
Between 1987 and 2012
Lowest 37% 42% 47% 50% 54% 52% + 15
2nd 35% 46% 43% 52% 55% 58% + 23
3rd 47% 53% 62% 55% 62% 65% + 18
4th 60% 65% 68% 65% 69% 71% + 11
Highest 73% 78% 81% 78% 80% 82% + 9
Enro
llmen
t Rat
e
Year
1987 1989 1991 1993 1995 1997 1999 2001 2003 2005 2007 2009 20120%
20%
40%
60%
80%
100%
Lowest Income Quintile
3rd Income Quintile
4th Income Quintile
Highest Income Quintile
2nd Income Quintile

EDUCATION PAYS 2013 35 For detailed data, see: trends.collegeboard.org.
College Enrollment by Race/Ethnicity
The gaps between the college enrollment rates of black and Hispanic high school graduates and white high school graduates narrowed considerably between 2001 and 2011. In 2011, 70% of white, 66% of black, and 62% of Hispanic high school graduates enrolled in college within a year of completing high school.
– In 2001, when 65% of white recent high school graduates enrolled in college, only 56% of black students and 49% of Hispanic students followed this path within one year.
– Although these gaps have also narrowed over the past decade, 44% of all white 18- to 24-year-olds were postsecondary students in 2011, while only 36% of blacks and 31% of Hispanics in this age range were enrolled.
– Differences in high school graduation rates account for part of the difference between the enrollment rates graphed in Figure 2.2A and Figure 2.2B. In 2010, 89% of whites, 83% of blacks, and 73% of Hispanics between the ages of 18 and 24 were high school graduates (NCES 2012a, Table 213).
ALSO IMPORTANT:
– Blacks compose about 15% of the 18- to 24-year-old population, and Hispanics represent about 18%.
– About 1.9% of blacks, 1% of Hispanics, and 0.2% of whites between the ages of 18 and 24 are in prison. These individuals are excluded from the population reported on in Figures 2.2A and 2.2B. (SOURCES: Bureau of Justice Statistics, 2012, Table 7; U.S. Census Bureau, 2012c, Table 10.)
– Postsecondary enrollment rates are higher for Asians than for other racial/ethnic groups. In fall 2011, when 71% of white recent high school graduates enrolled immediately in college, 88% of Asians continued their education. Two-thirds of Asians ages 18 to 24 were enrolled in postsecondary institutions in 2011.Figure 2.2A shows the percentage of high school graduates who enrolled in
college within 12 months of high school graduation. Figure 2.2B shows the percentage of all 18- to 24-year-olds in the civilian noninstitutionalized population (i.e., not in the military or in prison) enrolled in college in the specified year. This population includes those who have not completed high school.
NOTE: Postsecondary enrollment includes undergraduate and graduate students. Enrollment rates are three-year moving averages. Because of small sample sizes for Hispanics and blacks, annual fluctuations in enrollment rates may not be significant.
SOURCES: National Center for Education Statistics, 2013a, Tables 235 and 239; calculations by the authors.
FIGURE 2.2A Postsecondary Enrollment Rates of Recent High School Graduates by Race/Ethnicity, 1974 to 2011
FIGURE 2.2B Postsecondary Enrollment Rates of All 18- to 24-Year-Olds by Race/Ethnicity, 1974 to 2011
College Enrollment
44%49%
56%
65%
49%
66%
62%
70%
63%
50%
52%52%49%
48%
41%
Black, Non-HispanicHispanicWhite, Non-Hispanic
Enro
llmen
t Rat
e
Year
1974 1977 1980 1983 1986 1989 1992 1995 1998 2001 2004 2007 20110%
20%
40%
60%
80%
16%
17%
31%
39%
21%
38%
31%
44%
35%
20%17%
16%
24%27%26%
Black, Non-HispanicHispanicWhite, Non-Hispanic
Enro
llmen
t Rat
e
Year
1974 1977 1980 1983 1986 1989 1992 1995 1998 2001 2004 2007 20110%
20%
40%
60%
80%

Part 2: Distribution of Benefits36 EDUCATION PAYS 2013
College Enrollment by Gender and Age
In 2001, 60% of males and 65% of females who had completed high school in the past year were enrolled in college. By 2011, those percentages had increased to 64% and 73%, respectively.
– As shown in Figure 2.3A, in 2011, 39% of males and 44% of females between the ages of 18 and 24 were enrolled in college.
– In 1971, males were 9 percentage points more likely than females to enroll in college immediately after completing high school. Between 2001 and 2011, the enrollment rate for recent female graduates exceeded the enrollment rate for recent male graduates by 5 percentage points, on average.
– In 1971, males between the ages of 18 and 24 were 13 percentage points more likely than females of the same ages to be enrolled in college. By 1981, the gap had narrowed to 2 percentage points. By 2001, the enrollment rate for females was 5 percentage points higher than the rate for males, and the gap has remained 6 to 7 percentage points since that time.
– The percentage of all 18- and 19-year-olds enrolled in postsecondary education increased from 38% in 1971 to 43% in 1991 and 44% in 2001. The enrollment rate for this age group had grown to 50% by 2011. The pattern for 20- and 21-year-olds was similar. The most rapid growth in enrollment rates for young people was in the 1980s and the 2000s.
ALSO IMPORTANT:
– In 2011, 7.7% of males and 6.5% of females between the ages of 16 and 24 had not completed high school and were not enrolled. (NCES, 2013a, Table 128)
– The percentage of all postsecondary students who were over the age of 30 rose from 15% in 1970 to 22% in 1980, and to 29% in 1990. From 2001 to 2011, 24% to 25% of students were in this age range.
– The percentage of all postsecondary students (including graduate students) who were age 21 or younger fell from 55% in 1970 to 40% in 1990. From 2001 to 2011, 44% to 45% of students were in this age range.
– In both 2001 and 2011, just over half of all undergraduate students were age 21 or younger, and between 21% and 22% were over the age of 30.
(NCES, 2013a, Table 225; NCES, 2004b, Table 177)
FIGURE 2.3APostsecondary Enrollment Rates of Recent High School Graduates and of All 18- to 24-Year-Olds by Gender, 1971 to 2011
NOTE: “Recent high school graduates” completed high school during the 12 months preceding postsecondary enrollment. “Postsecondary enrollment” includes both undergraduate and graduate students. Some 18- to 24-year-olds have completed college and are no longer enrolled. They are not included in enrollment rates. Enrollment rates are three-year moving averages.
SOURCES: National Center for Education Statistics, 2013a, Tables 234 and 239; calculations by the authors.
NOTE: Includes all 18- to 34-year-olds, whether or not they have graduated from high school. “Postsecondary enrollment” includes part-time and full-time enrollment in an institution with programs of at least two years. Enrollment rates are three-year moving averages.
SOURCES: National Center for Education Statistics, 2013a, Table 7; calculations by the authors.
FIGURE 2.3B Postsecondary Enrollment Rates of All 18- to 34-Year-Olds by Age, 1971 to 2011
5%
8%
15%
33%
38%
7% 6% 7% 8%
14%
30%
50%
52%
11%
25%
44%
45%
10%
21%
40%
43%
9%
16%
31%
36%
18–1920–2122–2425–2930–34
Enro
llmen
t Rat
e
Year
0%
20%
40%
60%
80%
1971 1975 1979 1983 1987 1991 1995 1999 2003 2007 2011
21%
33%
49%
58%
51% 58%60%
64%
44%
39%
73%
38%
33%
65%
32%
32%
64%
51%
26%
25%
Recent High School GraduatesFemale Male
All 18- to 24-Year-OldsFemale Male
Enro
llmen
t Rat
e
Year
1971 1975 1979 1983 1987 1991 1995 1999 2003 2007 20110%
20%
40%
60%
80%
College Enrollment

EDUCATION PAYS 2013 37 For detailed data, see: trends.collegeboard.org.
Stratification Within Higher Education
Lower-income students, who come from families with incomes less than $29,600, are overrepresented in the for-profit and two-year public sectors, but underrepresented in four-year public and private nonprofit institutions. The reverse is true for higher-income students, who come from families with incomes above $106,360.
– Among dependent students from the lowest family income quartile of undergraduate students, 38% were enrolled in public two-year colleges in 2011-12, while 44% attended four-year public or private nonprofit colleges.
– Among dependent students from the highest family income quartile of undergraduate students, 22% were enrolled in public two-year colleges, while 65% attended four-year public or private nonprofit colleges.
– Only 5% of dependent undergraduate students attended for-profit institutions, but 20% of independent students were enrolled in this sector. While 54% of dependent students attended four-year public and private nonprofit colleges and universities, only 27% of independent students were enrolled in these sectors.
ALSO IMPORTANT:
– In 2011-12, 51% of undergraduate students were independent and 49% were dependent. About two-thirds of the undergraduate students at both public four-year and private nonprofit four-year institutions were dependent. But only 40% of public two-year college students and 23% of undergraduates enrolled in for-profit institutions were dependent. (NCES, 2013b)
FIGURE 2.4AFamily Income Distribution of Dependent Students Within Postsecondary Sectors (with Percentage of Students Enrolled in Each Sector), 2011-12
NOTE: The income brackets in Figures 2.4A and 2.4B represent quartiles of family income for all dependent undergraduate students enrolled in 2011-12. The “Attended More than One Institution” category shown here includes the 9% of dependent students who were enrolled in more than one institution. Omitted here are a small number of students (about 1%) who were enrolled in less-than-two-year public and less-than-four-year private nonprofit institutions. Percentages may not sum to 100 because of rounding.
SOURCES: National Center for Education Statistics, 2013b; calculations by the authors.
SOURCE: NCES, 2013b.
2011-12 Undergraduate Enrollment by Dependency Status and Sector
Public Two-Year
Public Four-Year
Private Nonprofit Four-Year For-Profit
Attended More than
One institution
Dependent 32% 38% 16% 5% 9%
Independent 44% 20% 7% 20% 7%
FIGURE 2.4BDependent Students’ Postsecondary Sector by Family Income, 2011-12
College Enrollment
21% 23% 26% 30%
45% 27% 17% 11%
30% 29% 24% 17%
22% 23% 26% 29%
18% 23% 27% 33%
$106,361 or More$65,461 to $106,360$29,601 to $65,460Less than $29,600
Attended More thanOne Institution (9%)
For-Pro�t (5%)
Public Two-Year (32%)
Public Four-Year (38%)
Private Nonpro�t Four-Year (16%)
Percentage of Students
Post
seco
ndar
y Se
ctor
0% 20% 40% 60% 80% 100%
6%
4%
2%
44%
39%
35% 9%
10%
11%
10%32% 8%38% 12%
15%
17%
21%
36%
31%
22%
Attended More thanOne Institution
For-Pro�t Public Two-Year
Public Four-Year
Private Nonpro�t Four-Year
Percentage of Students
$106,361 and Higher
$65,461 to $106,360
$29,601 to $65,460
Less than $29,600
0% 20% 40% 60% 80% 100%
Fam
ily In
com
e

38 EDUCATION PAYS 2013 Part 2: Distribution of Benefits
Stratification Within Higher Education
FIGURE 2.5 Percentage of High School Seniors Not Enrolling in College or Enrolling in Less Selective Colleges than Those for Which They Qualify for Admission by Socioeconomic Status, 2004
Virtually all 2004 high school graduates eligible for very selective colleges enrolled immediately after high school. However, 53% of lower-SES and 40% of upper-SES students with these characteristics enrolled in either less selective four-year institutions or in two-year colleges.
– Among high school graduates eligible for somewhat selective colleges, 8% of lower-SES students did not enroll anywhere and another 42% “undermatched.” Among those from upper-SES families, only 3% did not enroll in college and 26% “undermatched.”
– Among students who had little chance of admission to any four-year college, 49% of lower-SES and 29% of upper-SES high school graduates did not enroll in college, passing up or postponing the opportunity to attend a community college.
– The percentage of lower-SES students not applying to any colleges declined from 40% in 1992 to 24% in 2004. For upper-SES students, the decline was from 13% to 7%.
– The percentage of lower-SES students applying to at least one school of the highest selectivity for which they qualified increased from 45% in 1992 to 67% in 2004. However, 69% of lower-SES students qualified only for public two-year colleges, while 12% qualified for very selective or selective colleges.
– The percentage of upper-SES students applying to at least one school of the highest selectivity for which they qualified increased from 65% in 1992 to 81% in 2004. Among upper-SES students, 35% qualified only for two-year public colleges and another 35% qualified for very selective or selective colleges.
Students are defined as “undermatching” if they enroll in institutions less selective than the most selective at which they would have an estimated probability of at least 90% of being admitted. Nonenrollment is reported separately from undermatching.
ALSO IMPORTANT:
– Numerous studies have shown that students who enroll in the most selective colleges for which they are qualified are more likely to earn bachelor’s degrees than similar students who attend colleges where most students are less well prepared academically. (Bowen, Chingos, & McPherson, 2009; Light & Strayer, 2000; Nagaoka, Roderick, & Coca, 2009)
Academic Undermatching of 1992 and 2004 High School Graduates
Lower SES Upper SES
Class of
1992Class of
2004Class of
1992Class of
2004
No applications 40% 24% 13% 7%
Applied to less selective schools only 16% 9% 23% 12%
Did not enroll 1% 1% 1% 0%
Enrolled in less selective school 15% 8% 23% 11%
Applied to match schools 45% 67% 65% 81%
Rejected, did not enroll 1% 2% 1% 1%
Rejected, enrolled in less selective school 1% 2% 2% 3%
Accepted, did not enroll 4% 9% 2% 4%
Accepted, enrolled in less selective school 4% 4% 8% 8%
Accepted, enrolled in match school 34% 50% 52% 66%
NOTE: Percentages may not sum to 100 because of rounding.
SOURCE: National Center for Education Statistics, 2000 and 2008.
NOTE: Lower-SES refers to the lower half of the socioeconomic distribution and higher-SES refers to the upper half. College selectivity levels are based on Barron’s categories and are determined by the SAT scores, GPA, and acceptance rates of applicants and enrollees. Students’ access to college selectivity levels is predicted by their academic credentials. Percentages on the horizontal axis show the percentage of students in the indicated SES category who qualified for admission to institutions in the specified selectivity category.
SOURCE: National Center for Education Statistics, 2008.
College Enrollment
29%1% <1%
30%25%8%
25%
2% 3%
31%12%
30% 30%
10% 8%8%
49%
21%
35%
15% 11%17%
5%
20%
Higher-SES Not Enrolled
Higher-SES Substantially Undermatched (by two or more levels)
Higher-SES Undermatched (by one level)
Lower-SES Not Enrolled
Lower-SES Substantially Undermatched (by two or more levels)
Lower-SES Undermatched (by one level)
0%
20%
40%
60%
80%
100%
Perc
enta
ge o
f Stu
dent
s
Socioeconomic Status (SES) and College Selectivity Category for Which Students Quali�ed
Very Selective
Lower-SES (1%)
Higher-SES (8%)
Lower-SES (11%)
Higher-SES (27%)
Lower-SES (11%)
Higher-SES (20%)
Lower-SES (9%)
Higher-SES (10%)
Lower-SES (69%)
Higher-SES (35%)
Selective Somewhat Selective Two-YearNonselective

EDUCATION PAYS 2013 39 For detailed data, see: trends.collegeboard.org.
Degrees and Certificates Awarded
In 2011-12, 58% of the 4.9 million postsecondary degrees and certificates awarded were bachelor’s or advanced degrees. The other 42% were certificates or associate degrees.
– Ninety-one percent of the credentials awarded by private nonprofit institutions, 90% of those awarded by public four-year institutions, and 58% of those awarded by four-year for-profit institutions were bachelor’s, master’s, or doctorate degrees. Almost no baccalaureate or advanced degrees were awarded by public two-year and for-profit two-year or less institutions.
– The number of postsecondary certificates awarded increased from 550,000 in 2001-02 to almost 1.1 million in 2011-12, an increase of 92%. The most rapid growth (114%) was for certificates requiring between one and two years of study.
– In 2011-12, 44% of the certificates awarded were for programs of less than one year in duration, while 46% were for programs requiring between one and two years of study.
FIGURE 2.6APostsecondary Degrees and Certificates Awarded, 2011-12
FIGURE 2.6BPercentage Distribution of Degrees and Certificates Awarded by Sector, 2011-12
FIGURE 2.6CNumber of Certificates Awarded by Type, 2001-02 and 2011-12
NOTE: Degrees reported in these figures were conferred during the 12-month period July 1, 2011, to June 30, 2012. The number of degrees includes those from U.S. institutions, Title IV and non-Title IV participating, and both degree-granting and non-degree-granting institutions. Percentages may not sum to 100 because of rounding.
SOURCES: National Center for Education Statistics, 2013c; calculations by the authors.
Educational Attainment
44% 46% 1,060,000
550,000
4%
5%
49% 42%
5%
4%
2001-02
2011-12
Number of Certi�cates Awarded
Certi�cates of One Year to Less than Two Years
Certi�cates of Two Years to Less than Four Years in Length
Post-Baccalaureateor Higher Certi�cates
Certi�cates of Less than One Year
0 200,000 400,000 600,000 800,000 1,000,000 1,200,000
11%
10%3%
16%
38%
21%
Master’s Degrees
Doctoral Degrees
Post-Baccalaureate or Higher Certi�cates
Bachelor’s Degrees
Associate Degrees
Certi�cates of One Year to Less than Four Years in Length
Certi�cates of Less than One Year
1%
Total4.9 Million
29%
35% 34% 21%
1%
2%
0%
0%
5%
25%
7% 65% 19%
5% 52% 30% 7%
18% 56%
2%
1% 1%
5%
2% 2%
1%2%
56% 15%For-Pro�tTwo-Year or Less
For-Pro�tFour-Year or More
Public Two-Yearor Less
Public Four-Yearor More
All PrivateNonpro�t
Percentage
Certi�cates of Less than One Year
Certi�cates of One Year to Less than Four Years in Length
Associate Degrees
Bachelor’s Degrees
Post-Baccalaureateor Higher Certi�cates
Master’s Degrees
Doctoral Degrees
0% 20% 40% 60% 80% 100%

40 EDUCATION PAYS 2013 Part 2: Distribution of Benefits
College Completion
Among students who began college in 2006 at age 24 or younger and enrolled exclusively full time, 78% had earned a degree or certificate six years later.
– Eleven percent of these traditional-age full-time students (15% of those who completed credentials) completed their studies at an institution other than the one at which they first enrolled.
– The 7% of students who enrolled exclusively part time had very low completion rates, with 77% of students ages 24 or younger and 62% of older students leaving college without a degree or certificate.
– Among students who began their postsecondary studies in 2003-04, 58% of dependent students from the highest family income quartile (with family incomes of $88,517 or more), 26% of those with family incomes below $30,489, and 6% of independent students had earned bachelor’s degrees by 2009.
– Twenty percent of dependent students from the highest income quartile, 38% from the lowest family income quartile, and 52% of independent students had not earned a credential and were no longer enrolled in 2009.
– The percentage of beginning postsecondary students from the lowest family income quartile who earned a credential in 5 or 6 years increased from 46% in 1989-90 to 52% in 1995-96, but declined to 46% for the 2003-04 cohort.
– For those from the highest income quartile, completion rates increased from 62% to 67% to 68% over these years. Credential completion rates were 37%, 40%, and 34%, respectively, for independent students.
ALSO IMPORTANT:
– Official college graduation rates include only first-time full-time students who complete their degrees or certificates at the same institution at which they first enrolled.
– The official six-year graduation rate for four-year institutions increased from 55% for the 1996 starting cohort to 58% for the 2005 cohort. The three-year completion rate for students enrolling full time in two-year institutions was between 28% and 31% for all cohorts from 2005 through 2008. (NCES, 2013a, Tables 376 and 377)
NOTE: The upper income limits of the 2003-04 cohort quartiles were: lowest, $30,489; 2nd, $56,068; 3rd, $88,516. Students classified as full time were enrolled full time throughout their studies.
SOURCES: National Center for Education Statistics, 1994, 2001, and 2009; calculations by the authors.
SOURCE: Shapiro et al., 2012, Table 7.
FIGURE 2.7APercentage Distribution of Outcomes for Students Beginning Postsecondary Study in 2006 (with Percentage of Students in Each Category)
FIGURE 2.7B Percentage Distribution of Outcomes by Dependency Status and Family Income, Students Enrolling in 1989-90, 1995-96, and 2003-04
Educational Attainment
67%
7%
25%
56%
24%
31% 9% 20% 40%
11% 62%
36%4%
4%
16% 28% 31%
13% 77%
11% 18%
4%
3%
3%
Percentage
No Degree,Not Enrolled
Still EnrolledCompleted at Different Institution
Completed at Starting Institution
0% 20% 40% 60% 80% 100%
Mixed FT/PT(8%)
Part-Time (4%)
Full-Time (5%)
Mixed FT/PT(43%)
Part-Time (3%)
Full-Time (37%)
24 o
r You
nger
(82%
)O
ver 2
4 (1
8%)
1989-90 17% 11% 18% 13% 42%
1995-96 26% 15% 11% 16% 33%
2003-04 26% 9% 11% 16% 38%
1995-96 32% 10% 9% 17% 32%
2003-04 35% 11% 6% 17% 31%
1989-90 26% 13% 11% 15% 35%
1989-90 35% 12% 10% 14% 30%
1995-96 40% 12% 4% 16% 28%
2003-04 44% 10% 5% 14% 27%
1989-90 43% 12% 7% 13% 25%
1995-96 57% 7% 14% 19%3%
2003-04 58% 8%2%12% 20%
1989-90 5% 8% 24% 11% 52%
2003-04 6% 10% 18% 15% 52%
1995-964%9% 27% 12% 48%
0% 20% 40% 60% 80% 100%
Percentage
Inde
pend
ent
Stud
ents
Hig
hest
Qua
rtile
3rd
Qua
rtile
Dep
ende
nt S
tude
nts’
Fam
ily In
com
e
2nd
Qua
rtile
Low
est Q
uart
ile
No Degree, Still Enrolled
No Degree, Left Without Returning
Attained Certi�cate
Attained Associate Degree
Attained Bachelor's Degree

EDUCATION PAYS 2013 41 For detailed data, see: trends.collegeboard.org.
Educational Attainment over Time
The percentage of adults in the U.S. between the ages of 25 and 34 with a four-year college degree grew from 6% in 1950 to 24% in 1980 and 1990. In 2012, 34% of adults in this age group had earned a bachelor’s degree or higher.
– The percentage of adults ages 25–34 with some college or an associate degree grew rapidly in the 1970s and again in the 1990s but has stabilized at 28% to 29% since 2000.
– In 1940, only 13% of adults in the U.S. ages 25–34 had any education beyond high school. That percentage had risen to 46% by 1980 and to 63% by 2012.
– In 2012, when 34% of adults ages 25–34 had a bachelor’s degree or higher and 63% had at least some college, 33% of those ages 35–54 had four-year degrees and 60% had at least some college. Attainment levels were lower for those ages 55 and older, among whom 28% had a bachelor’s degree or higher and 52% had at least some college.
ALSO IMPORTANT:
– The fact that the earnings differential between high school graduates and college graduates has increased over time despite the increasing prevalence of college degrees indicates that the demand for college-educated workers in the labor market has increased more rapidly than the supply. (See Goldin and Katz [2008] and Autor [2010] for discussion of the failure of the supply of college graduates to keep up with the demand.)
– According to the Organisation for Economic Co-operation and Development (OECD), in 2011, when 33% of adults ages 25–34 in the U.S. had four-year college degrees, the highest attainment rates were 46% in Norway and 39% in Korea, Poland, and the U.K. (OECD, 2013, Table A1.3a)
– In 2011, when 43% of adults ages 25–34 in the U.S. had either bachelor’s degrees or vocational associate degrees, the highest attainment rates for comparable degrees were 64% in Korea and 59% in Japan. (OECD, 2013, Table A1.3a)
FIGURE 2.8AEducation Level of Individuals Ages 25 to 34, 1940–2012
NOTE: Percentages may not sum to 100 because of rounding.
SOURCE: U.S. Census Bureau, 2012g, Table A-1.
NOTE: Percentages may not sum to 100 because of rounding.
SOURCE: U.S. Census Bureau, 2012g, Table A-1.
FIGURE 2.8BPercentage of Adults with Some College or an Associate Degree and with a Bachelor’s Degree or Higher, by Age Group, 2002 and 2012
Educational Attainment
1940
1950
1960
1970
1980
1990
2000
2010
2011
2012
0% 20% 40% 60% 80% 100%
Percentage of Individuals
Year
11% 27%
11% 27%
12% 27%
31%12%
14% 41%
15% 40%
26% 44%
42% 36%
51% 34%
64% 22%
29%
29%
28%
28%
22%
22%
14%
11%
10%
7%
34%
33%
33%
29%
24%
24%
16%
11%
6%
6%
Bachelor’s Degree or Higher
Some College or Associate Degree
High School Diploma
Less than a High School Diploma
31% 29%34%
28% 29% 28% 27%
20%
24%
33% 21% 28%
Some College or Associate DegreeBachelor’s Degree or Higher
60%
80%
100%
40%
20%
0%
Year and Age Group
Perc
enta
ge o
f Ind
ivid
uals
2002 2012
Ages 25−34 Ages 35−54 Ages 55 and older
2002 2012 2002 2012

42 EDUCATION PAYS 2013 Part 2: Distribution of Benefits
Educational Attainment by Race/Ethnicity and Gender
Among blacks, whites, and Hispanics, larger percentages of females than of males between the ages of 25 and 29 had completed high school, had completed some college, and had completed bachelor’s degrees in 2012.
– The percentage of black females ages 25 to 29 who had completed a bachelor’s degree doubled from 12% in 1982 to 24% in 2012, while the percentage of black males with four-year degrees rose from 11% to 16%.
– The percentage of Hispanic females ages 25 to 29 who had completed a bachelor’s degree more than doubled, from 7% in 1982 to 17% in 2012, while the percentage of Hispanic males with four-year degrees rose from 9% to 11%.
– The percentage of white females ages 25 to 29 who had completed a bachelor’s degree almost doubled, from 22% in 1982 to 43% in 2012, while the percentage of white males with four-year degrees rose from 26% to 35%.
– Over the decade from 1992 to 2002, most of the gaps in bachelor’s degree attainment across racial/ethnic groups remained stable, but the gap between white and black males grew from 13 percentage points in 2002 to 15 points in 2007 and to 19 points in 2012.
ALSO IMPORTANT:
– Educational attainment is higher for U.S.-born Hispanics than for Hispanic immigrants. Among Hispanic adults ages 25 and older in 2011, about 15% of those born outside the U.S. and 33% of those born in the U.S. to immigrant Hispanic mothers had some college experience but less than a bachelor’s degree. Seventeen percent of the second generation had at least a bachelor’s degree, compared to only 10% of Hispanic immigrants. (U.S. Census Bureau, 2012e)
– Hispanics include individuals from many different countries, with considerable variation in educational attainment rates. For example, both first- and second-generation Mexican immigrants are much less likely than immigrants from other Latin American countries to have completed college. (U.S. Census Bureau, 2012e)
FIGURE 2.9Percentage of 25- to 29-Year-Olds Who Have Completed High School, Some College, or a Bachelor’s Degree, by Race/Ethnicity and Gender, 1973–2012
NOTE: Enrollment rates are three-year moving averages.
SOURCES: National Center for Education Statistics, 2010; U.S. Census Bureau, 2009, 2010b, 2011b, and 2012c, Table 1; calculations by the authors.
79%
78%80%
83%87%
87%
90%
87%
60%
51%
54%
50%
18%18%
24%
16%
37%
34%
13%
11%
34%
35%
12%
11%
At Least a High School DiplomaAt Least Some College ExperienceAt Least a Bachelor’s Degree
At Least a High School DiplomaAt Least Some College ExperienceAt Least a Bachelor’s Degree
Females Males
0%
20%
40%
60%
80%
100%
Black, Non-Hispanic
Year
Perc
enta
ge
1973 1976 1979 1982 1985 1988 1991 1994 1997 2000 2003 2006 2009 2012
Hispanic
0%
20%
40%
60%
80%
100%
Year
Perc
enta
ge
1973 1976 1979 1982 1985 1988 1991 1994 1997 2000 2003 2006 2009 2012
60%
59%
59%
58%
75%
69%
44%
35%17%
11%
66%
60%
36%
29%11%
9%
26%24%
10%
8%
25%
22%9%
7%
89%
89%
91%
89%
94%
93%
95%
94%
75%
64%
43%
35%
69%
61%
37%
32%
51%
50%
27%
27%
49%
44%26%
22%
White, Non-Hispanic
0%
20%
40%
60%
80%
100%
Year
Perc
enta
ge
1973 1976 1979 1982 1985 1988 1991 1994 1997 2000 2003 2006 2009 2012
Educational Attainment

EDUCATION PAYS 2013 43 For detailed data, see: trends.collegeboard.org.
Science, Technology, Engineering, and Mathematics (STEM) Fields
– While 24% of 2004 high school graduates had earned bachelor’s degrees by 2009, only 4% (17% of those earning degrees) earned bachelor’s degrees in STEM fields. While 2.5% of high school graduates were employed in STEM fields a year after graduating from college, about 38% of the STEM graduates did not have STEM jobs.
– Many STEM jobs are filled by non-STEM majors. Only 53% of 2003-04 beginning postsecondary students who earned bachelor’s degrees by 2009 and were employed in computer- and
math-related jobs one year after graduation had majored in STEM fields. Twenty percent majored in social sciences, humanities, or education, and 21% majored in business.
FIGURE 2.10AOf 2003-04 Beginning Four-Year College Students Who Earned Bachelor’s Degrees, Percentage Persisting in the Fields They Entered
FIGURE 2.10CMajors of Bachelor’s Degree Recipients in Selected STEM Occupations One Year After Graduation (with Percentage of All Employed Graduates Working in Occupation), 2009
FIGURE 2.10BPercentage of High School Graduates Entering Four-Year Colleges, Graduating in STEM Fields, and Employed in STEM Fields
SOURCES: Chen & Ho, 2013, Table 2; calculations by the authors. NOTE: Based on 2003-04 beginning postsecondary students who complete a STEM degree within six years.
SOURCE: Salzman, Kuehn, & Lowell, 2013, Figure A.
NOTE: Percentages may not sum to totals because of rounding.
SOURCES: Woo, Green, & Matthews, 2013, Table 3.3; calculations by the authors.
Students who enter the fields of engineering and mathematics are more likely than other students to earn their bachelor’s degrees in the fields in which they began.
ALSO IMPORTANT:
– In 2008, 31% of bachelor’s degrees, 20% of master’s degrees, and 67% of doctoral degrees were in STEM fields. (National Science Foundation, 2013)
Eng
inee
ring/
Tech
nolo
gies
Soc
ial/
Beha
viora
lSc
ienc
es
Phy
sical
Scie
nces
Busin
ess
Biol
ogic
al/
Life
Scie
nces
Com
pute
r/In
form
atio
nSc
ienc
es
Hum
aniti
es
Heal
thSc
ienc
es
Educ
atio
n
Mat
hem
atic
s
73% 71% 67% 66% 65% 64% 59% 57% 55% 47%
Perc
enta
ge
0%
20%
40%
60%
80%STEM Major Non-STEM Major
Educational Attainment
77% 17% 6%
83% 6% 8%
15%
6%
85%
53%
96%
53% 27% 6%
20% 21%
11%
2%
2%
4%
1%
1%
2%
Percentage of Graduates
Social Sciences, Humanities, Education
Business Other Non-STEMSTEM
Other Health Care Occupations (4%)
Nurses (4%)
Computer/Information Services/Math-Related (5%)
Physical and Life Scientists (2%)
Engineers and Engineering Technicians (4%)
0% 20% 40% 60% 80% 100%
Occ
upat
ion
in 2
009
Major Field of Study
High School Graduates: 100%
Enter College (as Freshman at Four-Year College): 39%
Graduate Four-Year College: 24%
Graduate in STEM Field: 4%
Enter STEM Job One Year After Graduation: 2.5%

College Enrollment and Attainment by State
The percentage of young people enrolling in college within a year after they were scheduled to graduate from high school in 2007-08 ranged from 29% in Nevada and 30% in the District of Columbia to 61% in Massachusetts and South Dakota.
– Over the years from 2008 to 2010, the percentage of adults ages 25 and older with at least a bachelor’s degree ranged from 17% in West Virginia and 19% in Arkansas to 39% in Massachusetts and 50% in the District of Columbia.
– Arkansas and Mississippi have college enrollment rates close to the national average of 48%, but they have only 19% and 20%, respectively, of adults with bachelor’s degrees, compared to the national average of 28%.
– The District of Columbia has the highest attainment rate in the country, but the second lowest college enrollment rate — 30% of high school graduates.
– In South Carolina in 2007-08, 70% of recent public high school graduates enrolled in college, compared to the national average of 64%. However, because 38% did not graduate from high school (compared to the national average of 25%), only 44% of all young people enrolled in college — less than the national average of 48%.
ALSO IMPORTANT:
– About 78% of public high school 12th-graders graduate, compared to 98% of those enrolled in private high schools. (NCES, 2012a, Table 125; Broughman & Swain, 2013, Table 13)
NOTE: High school graduation rates are estimated based on data for public high schools. Actual graduation rates are slightly higher because 7% to 8% of students are enrolled in private high schools, which have higher graduation rates. Attainment data are estimates using three-year averages of 2008–2010 data. Use of a three-year average increases the sample size, thereby reducing the size of sampling errors and producing more stable estimates. Percentages may not sum to 100 because of rounding.
SOURCES: National Center for Education Statistics, 2012a, Tables 113, 212; NCES, 2013a, Table 16; calculations by the authors.
FIGURE 2.11Educational Attainment of Youth Scheduled to Graduate from High School in 2007-08
44 EDUCATION PAYS 2013 Part 2: Distribution of Benefits
Geographic Comparisons
39%
26%
35%
32%
27%
36%
25%
28%
33%
26%
27%
34%
32%
30%
30%
36%
24%
20%
25%
23%
26%
19%
27%
28%
29%
36%
30%
31%
23%
22%
25%
17%
27%
20%
25%
26%
24%
22%
24%
29%
34%
28%
26%
21%
26%
24%
31%
26%
29%
28%
50%
22%
0%
10%
20%
30%
40%
50%
Perc
enta
ge
State
Percentage of Adults Ages 25 and Older with at Least a Bachelor’s Degree, 2008–2010
MA
SD
NJ
MN
ND
C
T
IA
NE
N
H
WI
PA
V
A N
Y
KS
R
I
MA
O
H
MS
MO
IN
N
C
AR
D
E
US
H
I C
O
CA
IL
T
N
AL
M
I
WV
G
A
KY
NM
M
E W
Y
O
K
SC
U
T
VT
M
T
TX
LA
F
L
ID
WA
A
Z
OR
A
K
DC
NV
61%
61%
60%
60% 57%
56%
56%
55%
53%
53%
53%
53%
53%
52%
52%
51%
50%
49%
49%
49%
48%
48%
48%
48%
47%
47%
47%
46%
46%
46%
46%
46%
46%
45%
45%
45%
45%
44% 44%
43%
43%
43%
42%
41%
39%
39%
37%
36%
36%
32%
30%
29%
21%
24%
24%
27%
27%
26%
31%
29%
30%
37%
30%
2
4%
1
8%
27%
25%
30%
29%
14%
33%
2
5%
2
5%
29%
2
4%
27%
2
9%
28%
2
5%
34%
2
9%
2
3%
3
1%
3
2%
20%
29%
2
2%
34%
3
1%
34%
19%
31
%
46%
39
%
32%
22%
28%
41%
35%
34%
41%
38%
2
6%
28%
18%
16%
15%
14%
16%
18%
14%
16%
17%
10%
17%
23%
29%
21%
24%
20%
21%
36%
18%
26%
27%
24%
28%
25%
24%
25%
29%
20%
25%
31%
24%
23%
35%
26%
33%
21%
24%
22%
38%
26%
11%
18%
27%
36%
33%
20%
28%
29%
23%
31%
44%
44%
Percentage Graduating from High School, but Not Enrolling in Postsecondary EducationPercentage of Students Not Completing High School Diploma
Percentage of All Youths Enrolling in Postsecondary Education
(75%
) MA
(72%
) SD
(71%
) N
J(6
9%) M
N(6
8%)
ND
(6
8%)
CT
(64%
) IA
(65%
) N
E
(64%
) N
H
(59%
) W
I
(64%
) PA
(6
9%)
VA(7
4%)
NY
(6
5%)
KS
(67%
) RI
(6
3%)
MA
(6
3%)
OH
(77%
) M
S(6
0%)
MO
(66%
) IN
(6
6%)
NC
(6
3%)
AR
(66%
) DE
(64%
) US
(62%
) HI
(63%
) CO
(6
5%)
CA
(57%
) IL
(6
2%)
TN
(67%
) AL
(6
0%)
MI
(5
9%)
WV
(7
0%)
GA
(61%
) KY
(6
8%)
NM
(5
7%)
ME
(59%
) W
Y
(5
6%)
OK
(70%
) SC
(5
8%)
UT
(48%
) VT
(52%
) M
T
(57%
) TX
(65%
) LA
(5
9%)
FL
(49%
) ID
(5
1%)
WA
(5
1%)
AZ
(47%
) OR
(46%
) AK
(5
3%)
DC(5
1%)
NV
Perc
enta
ge
0%
20%
40%
60%
80%
100%
STATE (Percentage of Public High School Graduates Enrolling in College)
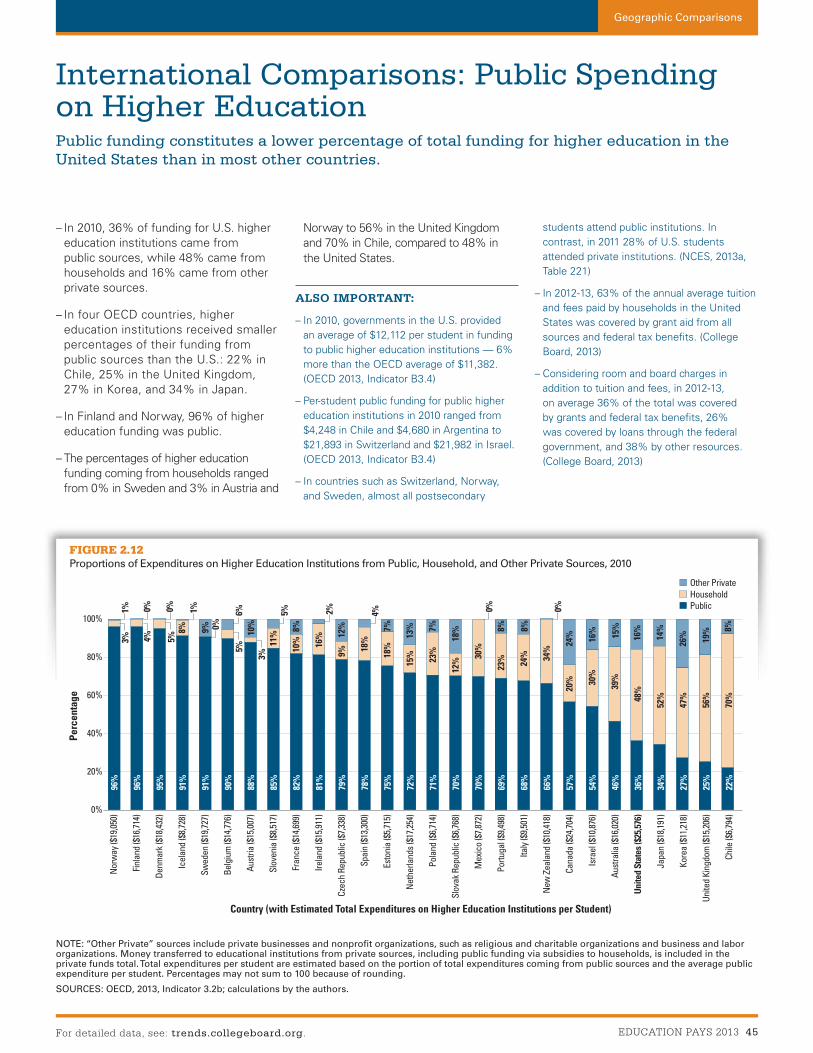
EDUCATION PAYS 2013 45 For detailed data, see: trends.collegeboard.org.
International Comparisons: Public Spending on Higher Education
FIGURE 2.12Proportions of Expenditures on Higher Education Institutions from Public, Household, and Other Private Sources, 2010
NOTE: “Other Private” sources include private businesses and nonprofit organizations, such as religious and charitable organizations and business and labor organizations. Money transferred to educational institutions from private sources, including public funding via subsidies to households, is included in the private funds total. Total expenditures per student are estimated based on the portion of total expenditures coming from public sources and the average public expenditure per student. Percentages may not sum to 100 because of rounding.
SOURCES: OECD, 2013, Indicator 3.2b; calculations by the authors.
Public funding constitutes a lower percentage of total funding for higher education in the United States than in most other countries.
– In 2010, 36% of funding for U.S. higher education institutions came from public sources, while 48% came from households and 16% came from other private sources.
– In four OECD countries, higher education institutions received smaller percentages of their funding from public sources than the U.S.: 22% in Chile, 25% in the United Kingdom, 27% in Korea, and 34% in Japan.
– In Finland and Norway, 96% of higher education funding was public.
– The percentages of higher education funding coming from households ranged from 0% in Sweden and 3% in Austria and
Norway to 56% in the United Kingdom and 70% in Chile, compared to 48% in the United States.
ALSO IMPORTANT:
– In 2010, governments in the U.S. provided an average of $12,112 per student in funding to public higher education institutions — 6% more than the OECD average of $11,382. (OECD 2013, Indicator B3.4)
– Per-student public funding for public higher education institutions in 2010 ranged from $4,248 in Chile and $4,680 in Argentina to $21,893 in Switzerland and $21,982 in Israel. (OECD 2013, Indicator B3.4)
– In countries such as Switzerland, Norway, and Sweden, almost all postsecondary
students attend public institutions. In contrast, in 2011 28% of U.S. students attended private institutions. (NCES, 2013a, Table 221)
– In 2012-13, 63% of the annual average tuition and fees paid by households in the United States was covered by grant aid from all sources and federal tax benefits. (College Board, 2013)
– Considering room and board charges in addition to tuition and fees, in 2012-13, on average 36% of the total was covered by grants and federal tax benefits, 26% was covered by loans through the federal government, and 38% by other resources. (College Board, 2013)
Geographic Comparisons
HouseholdOther Private
Public
96%
96%
95%
91%
91%
90%
88%
85%
82%
81%
79%
78%
75%
72%
71%
70%
70%
69%
68%
66%
57%
54%
46%
36%
34%
27%
25%
22%
3% 5%
5%
3%
0%
1%
8%1% 2% 4%
4%0% 0%
8%
0% 0%
9%
6% 5%
10%
12% 7%
13% 7% 8% 8%
18% 8%
24% 16% 15%
16%
14%
26% 19%
Chile
($6,7
94)
Unite
d Ki
ngdo
m ($
15,20
6)
Kore
a ($
11,21
8)
Japa
n ($
18,19
1)
Unite
d St
ates
($25
,576
)
Aust
ralia
($16
,020)
Isra
el ($
10,87
6)
Cana
da ($
24,70
4)
New
Zea
land
($10
,418)
Italy
($9,5
01)
Portu
gal (
$9,49
8)
Mex
ico
($7,8
72)
Slov
ak R
epub
lic ($
6,768
)
Pola
nd ($
6,714
)
Net
herla
nds (
$17,2
54)
Esto
nia
($5,7
15)
Spai
n ($
13,30
0)
Czec
h Re
publ
ic ($
7,338
)
Irela
nd ($
15,91
1)
Fran
ce ($
14,69
9)
Slov
enia
($8,5
17)
Aust
ria ($
15,00
7)
Belg
ium
($14
,776)
Swed
en ($
19,72
7)
Icel
and
($8,7
28)
Denm
ark (
$18,4
32)
Finla
nd ($
16,71
4)
Nor
way
($19
,050)
11%
10
%
1
6%
9
%
18%
18%
1
5%
2
3%
1
2%
3
0%
23%
2
4%
34
%
20%
3
0%
39
%
48
%
52%
47%
56%
70%
Country (with Estimated Total Expenditures on Higher Education Institutions per Student)
0%
20%
40%
60%
80%
100%
Perc
enta
ge

46 EDUCATION PAYS 2013
References
American Hospital Association. (2012, January). American Hospital Association Uncompensated Hospital Care Cost Fact Sheet. Retrieved from www.aha.org/content/12/11-uncompensated-care-fact-sheet.pdf
Autor, D. (2010). The polarization of job opportunities in the U.S. labor market: Implications for employment and earnings. Center for American Programs and the Hamilton Project. Retrieved from http://www.americanprogress.org/issues/labor/report/2010/04/30/7687/the-future-of-american-jobs/
Baum, C. L., & Ruhm, C. J. (2009). Age, socioeconomic status and obesity growth. Journal of Health Economics, 28 (3), 635–648.
Baum, S., & Ma, J. (2007). Education pays 2007: The benefits of higher education for individuals and society. New York: The College Board.
Baum, S. & Ma, J. (2012). Trends in college pricing 2012. New York: The College Board.
Baum, S., Ma, J., & Payea, K. (2010). Education pays 2010: The benefits of higher education for individuals and society. New York: The College Board.
Benson, A., Esteva, R., & Levy, F. (2013). The economics of BA ambivalence: The case of California higher education (Massachusetts Institute of Technology Working Paper).
Bowen, W. G., Chingos, M. M., & McPherson, M. S. (2009). Crossing the finish line: Completing college at America’s public universities. Princeton, NJ: Princeton University Press.
Brand, J. E., & Xie, Y. (2010). Evidence for negative selection in heterogeneous economic returns to higher education. American Sociological Review, 75 (2), 273–302.
Broughman, S. P., & Swaim, N. L. (2013). Characteristics of private schools in the United States: Results from the 2011-12 private school universe survey (NCES 2013-316). U.S. Department of Education. Washington, DC: National Center for Education Statistics.
Bureau of Justice Statistics. (2012). Prisoners in 2011. Retrieved from http://www.bjs.gov/ index.cfm?ty=pbdetail&iid=4559
Bureau of Labor Statistics. (2013). American time use survey, 2003–2012. Available from http://www.bls.gov/tus/datafiles_0312.htm
Bureau of Labor Statistics. (2013a). Consumer price index for all urban consumers (current series), U.S. city average. Retrieved from ftp://ftp.bls.gov/pub/ special.requests/cpi/cpiai.txt
Bureau of Labor Statistics. (2013b). Labor force statistics from the current population survey. Available from http://www.bls.gov/cps/data.htm
Bureau of Labor Statistics. (2013c). Volunteering in the United States, 2012. Retrieved from http://www.bls.gov/news.release/volun.nr0.htm
Card, D. (2001). Estimating the return to school: Progress on some persistent econometric problem. Econometrica, 69 (5), 1127–1160.
Carneiro, P., Heckman, J. J., & Vytlacil, E. (2003). Understanding what instrumental variables estimate: Estimating marginal and average returns to education (University of Chicago Working Paper).
Carroll, S., & Erkut, E. (2009). The benefits to taxpayers from students’ educational attainment. Santa Monica, CA: RAND Corporation.
Cawley, J., & Meyerhoefer, C. D. (2012). The medical care costs of obesity: An instrumental variables approach. Journal of Health Economics, 31 (1), 219–230.
Centers for Disease Control and Prevention. (2012, December). Summary health statistics for U.S. adults: National health interview survey, 2011. National Center for Health Statistics.
Chen, X. & Ho, P. (2013). STEM in postsecondary education: Entrance, attrition, and coursetaking among 2003-04 beginning postsecondary students (NCES 2013-152). U.S. Department of Education. Washington, DC: National Center for Education Statistics.
Chetty, R. Hendren, N., Kline, P., Saez, E. (2013). The economic impacts of tax expenditures: Evidence from spatial variation across the U.S. Retrieved from www.equality-of-opportunity.org
College Board. (2013). How students and parents pay for college. New York: The College Board. Retrieved from trends.collegeboard.org
Corak, M. (2013). Income inequality, equality of opportunity, and intergenerational mobility. Journal of Economic Perspectives, 27 (2), 79–102.
Cutler, D. M., & Lleras-Muney, A. (2006). Education and health: Evaluating theories and evidence (NBER Working Paper 12352).
Cutler, D. M., & Lleras-Muney, A. (2010). Understanding differences in health behaviors by education. Journal of Health Economics, 29 (1), 1–28.
Davis, C., Davis, K., Gardner, M., McIntyre, R., McLynch, J., & Sapozhnikova, A. (2013). Who pays? A distributional analysis of the tax systems in all 50 states (4th ed.). Washington, DC: Institute on Taxation and Economic Policy.
Dee, T. S. (2004). Are there civic returns to education? Journal of Public Economics, 88 (9–10), 1697–1720.
de Walque, D. (2004). Education, information, and smoking decisions: Evidence from smoking histories, 1940–2000 (World Bank Policy Research Working Paper 3362).
Duncan, G. J., & Murnane, R. J. (2011). Introduction: The American dream, then and now. In G. J. Duncan & R. J. Murnane (Eds.), Whither opportunity? Rising inequality and the uncertain life chances of low-income children. New York: Russell Sage Foundation Press.
Goldin, C., and Katz, L. F. (2008). The race between education and technology. Harvard University Press.
Greenstone, M., & Looney, A. (2011). Where is the best place to invest $102,000 — In stocks, bonds, or a college degree? Washington, DC: Hamilton Project, The Brookings Institution.
Greenstone, M., Looney, A., Patashnik, J., & Yu, M. (2013, June). Thirteen economic facts about social mobility and the role of education. Washington, DC: Hamilton Project, The Brookings Institution.
Grimard, F., & Parent, D. (2007). Education and smoking: Were Vietnam war draft avoiders also more likely to avoid smoking? Journal of Health Economics, 26 (5), 896–926.
Harmon, C. P., Oosterbeek, H., & Walker, I. (2003). The returns to education: Microeconomics. Journal of Economic Surveys, 17 (2), 115–156.
Hout, M. (2012). Social and economics returns to college education in the United States. Annual Review of Sociology, 38 (1), 379–400.
Hoxby, C., & Avery, C. (2012). The missing one-offs: The hidden supply of high-achieving, low-income students (NBER Working Paper 18586).
Internal Revenue Service. (2010). Statistics of income tax stats, 2010 tax year. Retrieved from http://www.irs.gov/uac/SOI-Tax-Stats---Individual-Statistical-Tables-by-Size-of-Adjusted-Gross-Income
Kalil, A., Ryan, R., & Corey, M. (2012). Diverging destinies: Maternal education and the developmental gradient in time with children. Demography, 49 (4), 1371–1383.
Krueger, A. B. (2012, January 12). The rise and consequences of inequality in the United States. Washington, DC: Council of Economic Advisers. Retrieved from http://www.whitehouse.gov/sites/default/files/krueger_cap_speech_final_remarks.pdf

EDUCATION PAYS 2013 47 For detailed data, see: trends.collegeboard.org.
References — Continued
Light, A., & Strayer, W. (2000). Determinants of college completion: School quality or student ability? Journal of Human Resources, 35 (2), 299–332.
Mirowsky, J., & Ross, C. E. (2003). Education, social status, and health. Somerset, NY: Aldine de Gruyter publisher.
Nagaoka, J., Roderick, M., & Coca, V. (2009). Barriers to college attainment, lessons from Chicago. Chicago: The Consortium on Chicago School Research. Retrieved from http://www.americanprogress.org/issues/2009/01/pdf/ChicagoSchools.pdf
National Center for Education Statistics. (1994, 2001, 2009). Beginning postsecondary students longitudinal study [Data file]. Available from http://nces.ed.gov/datalab/
National Center for Education Statistics. (2000). National education longitudinal study of 1988, third follow up (NELS 1988/2000) [Data file]. Available from http://nces.ed.gov/surveys/nels88/
National Center for Education Statistics. (2004a, 2010). The condition of education 2004 and 2010. Retrieved from http://nces.ed.gov/pubsearch/getpubcats.asp?sid=091#060
National Center for Education Statistics. (2004b, 2012a, 2013a). Digest of education statistics 2003, 2011, and 2012. Retrieved from http://nces.ed.gov/Programs/digest/
National Center for Education Statistics. (2008). Education longitudinal study of 2002, second follow up (ELS 2002/2006) [Data file]. Available from http://nces.ed.gov/surveys/els2002/
National Center for Education Statistics. (2013b). National postsecondary student aid study 2011-12 [Data file]. Available from http://nces.ed.gov/datalab/
National Center for Education Statistics. (2013c). Unpublished tabulation using data from Integrated Postsecondary Education Data System. Available from http://nces.ed.gov/ipeds/datacenter/
National Center for Health Statistics. (2011a). Health, United States, 2011. Retrieved from http://www.cdc.gov/nchs/hus.htm
National Center for Health Statistics. (2002–2013). National health interview survey, 2001 through 2012. Retrieved from http://www.cdc.gov/nchs/nhis.htm
National Opinion Research Center. (2013). General social survey, 1972–2012 [Cumulative data file]. Retrieved from http://sda.berkeley.edu/archive.htm
National Science Foundation. (2013). Science and engineering degrees: 1966–2010. Retrieved from http://www.nsf.gov/statistics/nsf13327/
Oreopoulos, P., & Salvanes, K. (2011). Priceless: The nonpecuniary benefits of schooling. Journal of Economic Literature, 25 (1), 159–184.
Organisation for Economic Co-operation and Development (OECD). (2013). Education at a glance 2013. Retrieved from http://www.oecd.org/edu/eag.htm
Pew Charitable Trusts. (2011). Does America promote mobility as well as other nations? Retrieved from http://www.pewstates.org/research/reports/does-america-promote-mobility-as-well-as-other-nations-85899380321
Pew Charitable Trusts. (2012). Pursuing the American dream: Economic mobility across generations. Retrieved from http://www.pewtrusts.org/our_work_report_detail.aspx?id=85899403846
Rouse, C. E. (2005). The labor market consequences of an inadequate education (Princeton University Working Paper).
Salzman, H., Kuehn, D., & Lowell, B. L. (2013). Guestworkers in the high-skill U.S. labor market. Washington, DC: Economic Policy Institute (EPI). Retrieved from http://www.epi.org/publication/bp359-guestworkers-high-skill-labor-market-analysis/
Sari, N. (2009). Physical inactivity and its impact on health care utilization. Health Economics, 18 (8), 885–901.
Shapiro, D., Dundar, A., Chen, J., Ziskin, M., Park, E., Torres, V., & Chiang, Y. (2012). Completing college: A national view of student attainment rates. Herndon, VA: National Student Clearinghouse Research Center.
United Health Foundation, American Public Health Association, & Partnership for Prevention. (2009).The future costs of obesity: National and state estimates of the impact of obesity on direct health care expenses. Retrieved from Partnership to Fight Chronic Disease website: http://www.fightchronicdisease.org/sites/fightchronicdisease.org/files/docs/CostofObesityReport-FINAL.pdf
U.S. Census Bureau. (1992, 2002a, 2010a, 2011a, 2012a). Current population survey, annual social and economic supplement. Available from http://dataferrett.census.gov
U.S. Census Bureau. (1995–2012). Income, poverty and health insurance in the United States, various years. Retrieved from http://www.census.gov/hhes/www/income/data/index.html
U.S. Census Bureau. (2002b, 2007a, 2012b). Basic monthly current population survey, January through December. Available from http://dataferrett.census.gov/
U.S. Census Bureau (2009, 2010b, 2011b, 2012c). Current population survey, annual social and economic supplement, table 1 [Table]. Retrieved from http://www.census.gov/hhes/socdemo/education/data/cps/2012/tables.html
U.S. Census Bureau. (2010c, 2012d). The statistical abstract of the United States, 2010 and 2012. Retrieved from http://www.census.gov/compendia/statab/
U.S. Census Bureau. (2010d). Voting and registration in the election of November 2010. Retrieved from http://www.census.gov/hhes/www/socdemo/voting/publications/p20/2010/tables.html
U.S. Census Bureau. (2011d). America’s families and living arrangements 2011. Retrieved from http://www.census.gov/population/www/socdemo/hh-fam/cps2011.html
U.S. Census Bureau. (2011e). Poverty thresholds. Retrieved from https://www.census.gov/hhes/www/poverty/data/threshld/index.html
U.S. Census Bureau. (2012e). 2011 American community survey (ACS) 1-year public use microdata sample (PUMS) [Data file]. Retrieved from http://www.census.gov/acs/www/
U.S. Census Bureau. (2012f). American community survey, 2009–2011 three-year data file [Data file]. Available from http://dataferrett.census.gov/
U.S. Census Bureau. (2012g). Educational attainment in the United States, 2012 [Data table]. Retrieved from http://www.census.gov/hhes/socdemo/education/data/cps/historical/index.html
U.S. Census Bureau. (2012h). Health insurance coverage status and type of coverage by selected characteristics: 2011. Retrieved from http://www.census.gov/hhes/www/cpstables/032012/health/h01_000.htm
U.S. Census Bureau. (2012i). Voting and registration in the election of November 2012. Retrieved from http://www.census.gov/hhes/www/socdemo/voting/publications/p20/2012/tables.html
U.S. Census Bureau. (2013). Current population survey, October 1975 through 2012 [Unpublished data].
U.S. Department of Health and Humans Services. (2011). The 2011 HHS poverty guidelines. Retrieved from http://aspe.hhs.gov/poverty/11poverty.shtml
Woo, J., Green, C., & Matthews, M. (2013). Profile of 2007-08 first-time bachelor’s degree recipients in 2009 (NCES 2013-150). U.S. Department of Education. Washington, DC: National Center for Education Statistics.

www.collegeboard.org
trends.collegeboard.org
12b-7104
130505555
ACKNOWLEDGMENTS
We are grateful to Charles Kurose for his invaluable input on this project and to Kathleen Little and Anne Sturtevant for their excellent editorial help. The publication would not have been possible without the cooperation and support of many people at the College Board, particularly Craig Jerald, Rohit Tandon, Silvia Ivanova, Marilyn Cushman, Jess Howell, Mike Hurwitz, Kathryn McGinley, Matea Pender, and Jonathan Smith. Barbara Kridl and her colleagues at RTI International provided expert graphic design work, as well as advice on content. Tom Snyder of the Department of Education provided valuable data.