Embed Size (px)
Citation preview
ISAAR Special Issue
Forward-Masked Frequency SelectivityImprovements in Simulated and ActualCochlear Implant Users Using aPreprocessing Algorithm
Florian Langner1,2,3 and Tim Jurgens1,2
Abstract
Frequency selectivity can be quantified using masking paradigms, such as psychophysical tuning curves (PTCs). Normal-
hearing (NH) listeners show sharp PTCs that are level- and frequency-dependent, whereas frequency selectivity is strongly
reduced in cochlear implant (CI) users. This study aims at (a) assessing individual shapes of PTCs in CI users, (b) comparing
these shapes to those of simulated CI listeners (NH listeners hearing through a CI simulation), and (c) increasing the
sharpness of PTCs using a biologically inspired dynamic compression algorithm, BioAid, which has been shown to sharpen
the PTC shape in hearing-impaired listeners. A three-alternative-forced-choice forward-masking technique was used to
assess PTCs in 8 CI users (with their own speech processor) and 11 NH listeners (with and without listening through a
vocoder to simulate electric hearing). CI users showed flat PTCs with large interindividual variability in shape, whereas
simulated CI listeners had PTCs of the same average flatness, but more homogeneous shapes across listeners. The algorithm
BioAid was used to process the stimuli before entering the CI users’ speech processor or the vocoder simulation. This
algorithm was able to partially restore frequency selectivity in both groups, particularly in seven out of eight CI users,
meaning significantly sharper PTCs than in the unprocessed condition. The results indicate that algorithms can improve the
large-scale sharpness of frequency selectivity in some CI users. This finding may be useful for the design of sound coding
strategies particularly for situations in which high frequency selectivity is desired, such as for music perception.
Keywords
cochlear implants, frequency selectivity, tuning curves, dynamic compression, vocoder
Date received: 2 December 2015; revised: 23 June 2016; accepted: 23 June 2016
Introduction
Frequency selectivity is an important characteristicdetermining the spectral resolution of the listener,which allows for the differentiation of spectral detailsin music and complex acoustic signals in everyday life.There are different psychoacoustic measures to assess thespectral resolution. For instance, auditory filter shapescan be determined using a notched-noise masking experi-ment (Patterson, Nimmo-Smith, Weber, & Milroy, 1982;Weber, 1977), or spectral resolution can be determinedusing spectral modulation thresholds (Litvak, Spahr,Saoji, & Fridman, 2007), which measure the smallestdetectable spectral contrast in a stimulus with spectralripples. A widely used technique to estimate frequencyselectivity in normal-hearing (NH) or hearing-impaired
(HI) listeners, however, is the use of psychophysicaltuning curves (PTCs). Pure-tone PTCs display themasked threshold—that is, the level of a pure-tonemasker that is necessary to render a specific target tone
1Medizinische Physik, Cluster of Excellence “Hearing4all,” Carl von
Ossietzky University, Oldenburg, Germany2Forschungszentrum Neurosensorik, Carl von Ossietzky University,
Oldenburg, Germany3Department of Otolaryngology, Medical University Hannover, Hannover,
Germany
Corresponding author:
Florian Langner, Department of Otolaryngology, Medical University
Hannover, 30625 Hannover, Germany.
Email: [email protected]
Creative Commons CC-BY-NC: This article is distributed under the terms of the Creative Commons Attribution-NonCommercial 3.0 License (http://www.
creativecommons.org/licenses/by-nc/3.0/) which permits non-commercial use, reproduction and distribution of the work without further permission provided the original
work is attributed as specified on the SAGE and Open Access pages (https://us.sagepub.com/en-us/nam/open-access-at-sage).
Trends in Hearing
2016, Vol. 20: 1–14
! The Author(s) 2016
Reprints and permissions:
sagepub.co.uk/journalsPermissions.nav
DOI: 10.1177/2331216516659632
tia.sagepub.com
inaudible—as a function of different masker frequencies.A PTC can be measured with simultaneous masking orforward-masking paradigms (see Moore, Glasberg, &Roberts, 1984), each of which has its advantages anddisadvantages and results in slightly different PTCshapes. Forward masking minimizes the possibility thatlateral suppression of the probe by the masker mayproduce a masking effect (Moore, 1978), whereas simul-taneous masking may produce a stimulus that is closer toecologically relevant stimuli, such as speech in noise.Forward masking has been widely used in the psychoa-coustic literature to estimate the auditory system’snonlinearity in the growth of masking experiments(e.g., Oxenham & Plack, 1997), for temporal maskingcurves (Nelson, Schroder, & Wojtczak, 2001), and fre-quency selectivity estimates, because it avoids problemsassociated with suppression. Therefore, a forward-masking paradigm was also chosen for the presentstudy to estimate frequency selectivity.
In general, NH listeners show sharp PTCs withslightly lower masker level at threshold in the low-frequency tail (cf. Moore, 1978), due to upward spreadof masking (cf. Nelson, 1991). PTCs are level-dependentwith broader tuning at higher stimulus levels (Nelson,1991). HI listeners show broader (shallower) PTCsthan NH listeners (Florentine, Buus, Scharf,& Zwicker, 1980). This has been attributed in some HIlisteners to the loss of outer hair cell function (Nelson,1991). A recent study of Jurgens, Clark, Lecluyse, andMeddis (2016) showed that the broad PTC shape of HIlisteners can be considerably sharpened when the psy-choacoustic stimuli are preprocessed by the dynamic com-pression algorithm BioAid (Meddis, Clark, Lecluyse,& Jurgens, 2013), reintroducing two biological principlesof the intact auditory system attributed to outer hair cells,that is, dynamic compression and frequency-selectivefeedback. This indicates that preprocessing algorithmsbased on biological principles can affect the PTC shapeand thus may improve apparent frequency selectivity, forbetter distinction between signals of different frequencycontent, and thus potentially better acoustic object separ-ation under certain circumstances.
In cochlear implant (CI) users, spatial tuning curves(Nelson, Donaldson, & Kreft, 2008; Nelson, Kreft,Anderson, & Donaldson, 2011) can be used to assessthe spatial selectivity of electric stimulation on singleelectrodes using a similar forward-masking paradigmas used for measuring PTCs in NH and HI listeners.These spatial tuning curves are not normally measuredusing the CI user’s personal speech processor, but with aresearch interface, which allows controlled stimulation ofsingle or multiple electrodes. Spatial tuning curve shapeswere found to be almost symmetric and highly individualacross CI users, as well as across different stimulatingelectrodes (Nelson et al., 2011).
A direct comparison of spatial tuning curves in CIlisteners to PTCs in NH and HI listeners is difficult,because such a comparison would require exactmappings of electric current to acoustic level and map-pings of electrode location to acoustic (best) frequency.Furthermore, spatial tuning curves (measured using aresearch interface) do not necessarily reflect the fre-quency selectivity of the CI users in their everyday life,because their speech processor and sound coding strat-egy are not used during the course of the measurement.Simulated CI listeners, that is, NH listeners listeningthrough a vocoder to simulate CI processing (Shannon,Zeng, Kamath, Wygonski, & Ekelid, 1995; Whitmal,Poissant, Freyman, & Helfer, 2007), could be used forfacilitating such a comparison, bridging the gap betweenfrequency selectivity measurements in CI and NHlisteners.
The aim of this study was twofold: The first goal wasto compare PTCs between simulated and actual CI users.Therefore, Experiment 1 of this study measured PTCs insimulated CI users with a vocoder, which contains real-istic signal processing used in current sound coding stra-tegies and mimics physiological details of actual CIusers. In Experiment 2, the same psychoacoustic meas-urements were then performed with individual CI users,which means that PTCs were measured with the sameacoustic stimuli (without vocoder processing), presentedvia the CI user’s own speech processor. This approachallowed a direct comparison across individual CI usersindependent of CI manufacturer and device and alsoallowed for comparisons with NH listeners and simu-lated CI users. The second goal of this study was totest whether sharpening of the PTC shape due to prepro-cessing with the dynamic compression algorithm BioAid(Meddis et al., 2013) was possible in both simulated andactual CI users. The effects of two algorithm settings onPTC shape were investigated; these involved mimicking(a) healthy basilar membrane (BM) compression and (b)the function of the medial olivocochlear complex(MOC), both of which are assumed to be absent in CIlisteners due to absence of outer hair cells. The hypoth-esis is that implementing these two biological principlesin a preprocessing algorithm can help to improve the CIuser’s relatively poor frequency resolution (Friesen,Shannon, Baskent, & Wang, 2001).
Methods
Subjects
Eleven NH listeners (age range 22–30 years, average ageof 26 years) acted as the simulated CI listeners listeningthrough a software-implemented vocoder (adaptedfrom Bracker, Hohmann, Kollmeier, & Schulte, 2009,see below). The NH listeners had pure-tone thresholds
2 Trends in Hearing
of less than 20dB HL measured using standard audiometry(sinusoids with frequencies between 125Hz and 8kHz).
Eight actual CI listeners (postlingually deafened, seeTable 1, average age of 42 years) participated in thestudy. These CI users were presented with acousticsounds generated on a standard computer using anaudio cable connected directly from the sound card tothe input of their sound processor. Participants wereoffered regular breaks and were free to pause at anytime during the experiment. All participants gave writtenconsent prior to the experiment and were paid monetarycompensation. Ethical consent was granted by theUniversity of Oldenburg Ethical Committee.
Seven of the eight participants use CI devices by themanufacturer Cochlear Ltd., whereas one participantuses a MED-EL system. All Cochlear CI users used theAdvanced Combinational Encoder (ACE) strategy, anNofM strategy stimulating only those N of the M¼ 22electrodes with the highest amplitude within a stimulationframe. CI4 used MED-EL’s Fine Structure Processing,which aims to implement the temporal fine structure of asignal by delivering bursts of stimulus pulses on the elec-trodes delivering low frequencies. These bursts are deter-mined by the band-limited acoustic signal and cover arange of up to 950Hz (Wouters et al., 2015).
Apparatus and Calibration
All listeners were seated in a sound-attenuating booth.The stimuli were generated on a standard PC withMATLAB (The MathWorks, Inc.) using customizedscripts and were converted from digital to analog usingan RME Fireface UC soundcard. The NH listeners werepresented with stimuli via Sennheiser HDA 200 circu-maural headphones. Stimulus levels were calibrated todB SPL using a Bruel & Kjaer (B&K) 4153 artificialear with a B&K ½ in. microphone type 4231, whichwas attached to a B&K 2610 measurement amplifier.CI listeners received the stimuli via the auxiliary inputof their own CI speech processor and were asked to
choose the CI program that they mostly used in everydaylife (if a program choice was possible).
The first stimulus presented via the auxiliary input(for the target threshold measurements) was set to�35 dB FS. Subsequent psychoacoustic testing was per-formed in relation to the measured absolute threshold ofthe target (i.e., in dB sensation level, SL). Absolute levelsfor the auxiliary input (e.g., in dB FS) were meaningless,because each device and each participant produced dif-ferent digital levels (in dB FS) for the absolute targetthreshold.
Procedure
A three-interval-forced-choice (Levitt, 1971) one-up-two-down forward-masking paradigm was used to determinethe individual masked thresholds for pure-tone maskerswith seven frequencies relative (0.5, 0.7, 0.9, 1.0, 1.1, 1.3,and 1.7 times) to the fixed frequency of the 2-kHz pure-tone target. The target level was fixed at 10 dB SL, whichwas determined for each listener with an absolute thresh-old measurement of the pure-tone target beforehandusing the same three-interval-forced-choice method. The106-ms masker was followed by 10ms of silence and the16-ms target tone. Both stimuli were gated with 4-ms raised-cosine ramps. The masker was adaptively changed in levelstarting at a level of 10dB SL and 10dB level steps, reducedto 5dB after the third reversal and to 1dB after the sixthreversal. A measurement run was finished after the tenthreversal and the masked threshold of this run was definedas the average masker level at the last six reversals. Threemeasurement repetitions were averaged to obtain onemasked threshold. All participants finished one measure-ment run (on-frequency) for familiarization with the meas-urement procedure.A training periodwas not implemented.
CI Simulation
A vocoder mimicking details of the signal processing andthe physiology of CI users (Bracker et al., 2009, Williges et
Table 1. Demographic information about all participating CI listeners.
ID Age Sex Etiology
Duration of
deafness (years) CI usage (years) Device
CI1 25 M Ototoxic 17 8 Freedom
Hybrid
CI2 23 F Sudden hearing loss 0.5 3 CP810
CI3 45 M Lack of oxygen 44 0.6 CP910
CI4 19 F Unknown 8 12 OPUS 2
CI5 64 M Meningitis 49 1 CP810
CI6 46 F Sudden hearing loss 6 0.5 CP910
CI7 53 M Progressive hearing loss 7 6 CP910
CI8 63 M Sudden hearing loss 10 4 CP810
Langner and Jurgens 3
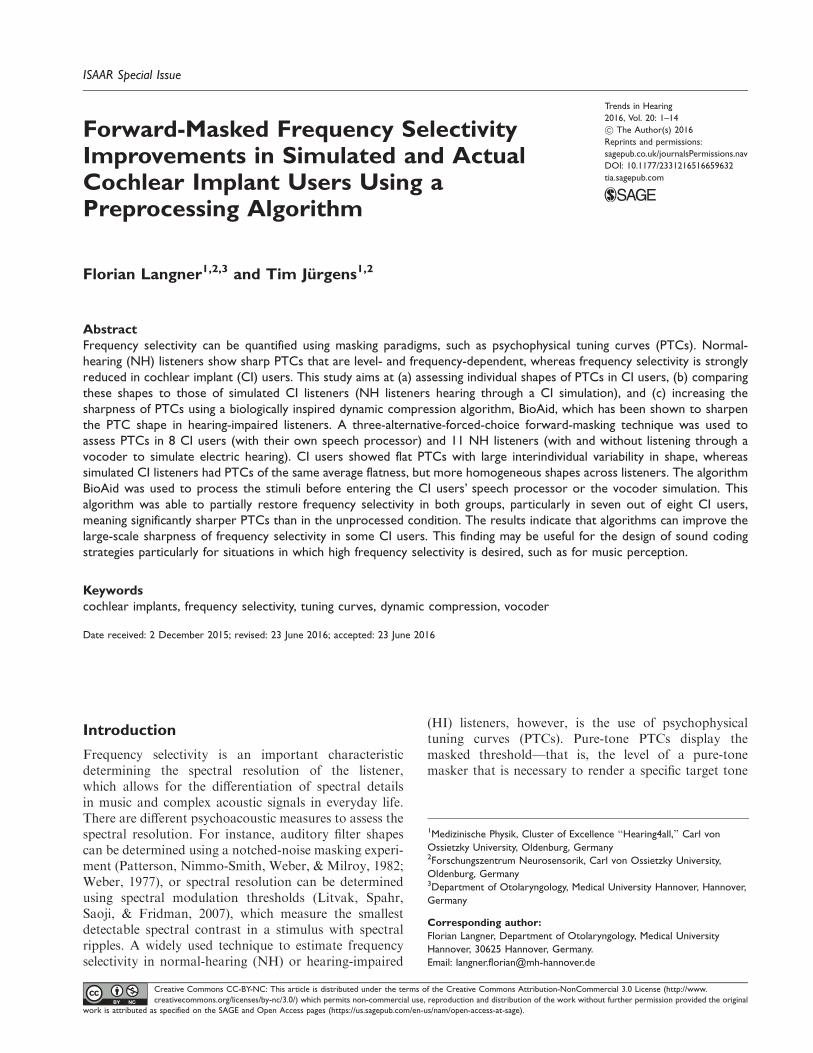
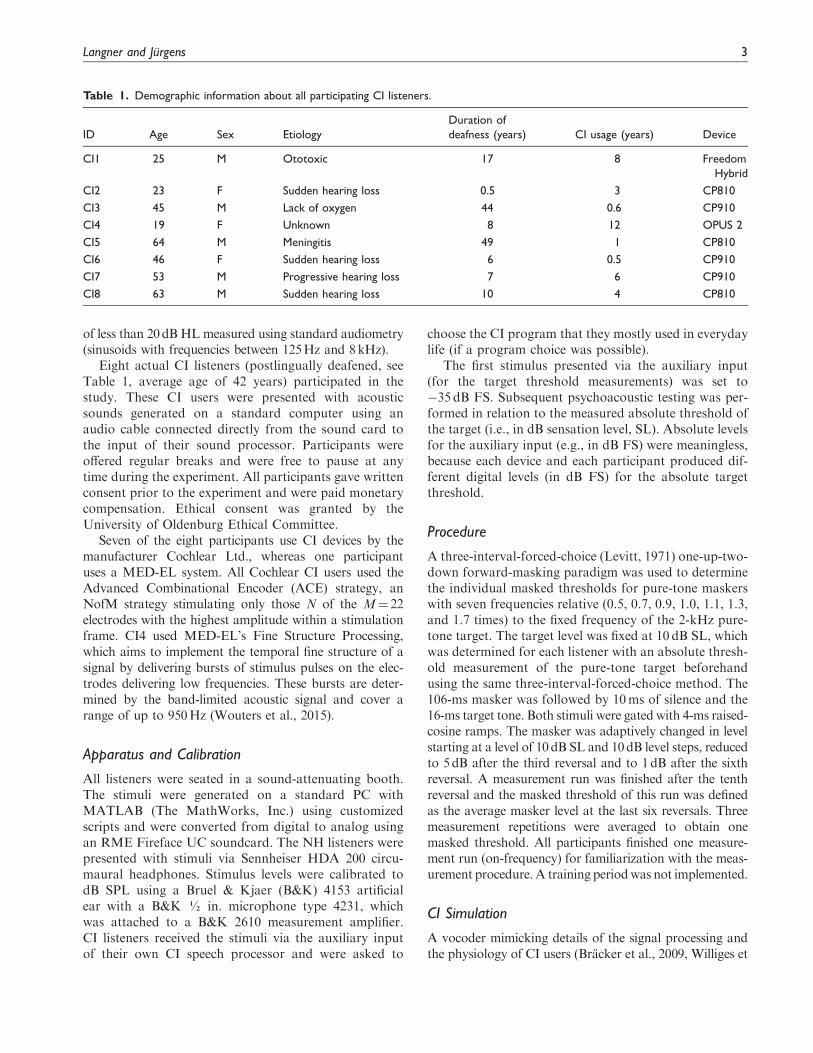
al. 2015) was used for simulating CI users with NH lis-teners. This vocoder was structured to resemble an implanttype of brand Cochlear Ltd. with a Contour Advance elec-trode array consisting of 22 electrodes. The signal process-ing flow of this vocoder is shown in Figure 1.
The input signal (sampled at a rate of 22 kHz) isdecomposed into 22 frequency channels using a third-order gammatone filterbank (Hohmann, 2002). Thecenter frequencies of this analysis filterbank rangedfrom 250Hz to 7438Hz (see CI simulation column ofTable 2) each with one equivalent rectangular band-width. These frequencies were chosen in agreementwith the center frequencies of the Fast FourierTransform bins used within Cochlear’s ACE soundcoding strategy (cf. Nogueira, Buchner, Lenarz,& Edler, 2005). The Hilbert envelope of the outputof each channel was sampled at an average pulse rateof 1,000 pulses per second (i.e., 1/22 of the audio signal’ssampling frequency), which is similar to the stimulationrate used in Cochlear devices. An 8-of-22 processing wasimplemented stimulating only the eight channels withhighest amplitudes within a stimulation time frame(frame length 1ms). The timing of this pulsatile sam-pling across electrodes was randomized within oneframe, such that the signal in each channel is an envel-ope-weighted pulse train with a stochastic sequence ofpulses. For simplicity, no amplitude compression wasused in the vocoder to compress the envelopes in thefrequency channels, in contrast to mappings of audiosignal amplitude on current amplitude used withinACE (cf. Nogueira et al., 2005). Each pulse is multipliedby a two-sided exponentially decaying function a acrossthe channels according to Equation (1) to simulate thespatial spread of the electric field in the perilymph. Thedecaying factor (denominator of the exponent inEquation (1)) was chosen to be 9mm with nominator
jdj as the absolute distance in mm from the stimulatingelectrode.
� ¼ e �dj j
9 mmð Þ ð1Þ
Figure 1. Block diagram of the CI simulation/vocoder. CI¼cochlear implant.
Table 2. Center Frequencies of the Analysis Filterbank in the CI
simulation and auralization part of the vocoder.
Channel number CI simulation (Hz) Auralization (Hz)
1 250 664
2 375 775
3 500 902
4 625 1046
5 750 1210
6 875 1396
7 1000 1608
8 1125 1849
9 1250 2123
10 1438 2435
11 1688 2789
12 1938 3192
13 2188 3651
14 2500 4173
15 2875 4766
16 3313 5441
17 3813 6208
18 4375 7081
19 5000 8074
20 5688 9204
21 6500 10488
22 7438 11950
4 Trends in Hearing
In the auralization part, each channel is filtered againwith a third-order gammatone filterbank but with differentcenter frequencies (664 to 11950Hz, see auralizationcolumn of Table 2) in order to simulate the mapping ofeach frequency channel to electrode location. The centerfrequencies of this second analysis filterbank were chosento be the best frequencies corresponding to the electrodepositions of the Cochlear Contour Advance electrodearray with an insertion depth of 24mm in a 32mmhuman cochlea, calculated using Greenwood’s (1990)place-frequency map. A synthesis filterbank with the samecenter frequencies as this second analysis filterbank com-pensates for filter group delays (Hohmann, 2002) and pro-duces the (mono) signal to be presented to theNH listeners.
In summary, the vocoder signal thus consists ofnarrow bandpass-filtered carriers (with a stochastic,noise-like fine structure), of envelopes corresponding tothe sampled envelopes that are spectrally smeared due tothe spatial spread function, and carriers that are shiftedin frequency according to the chosen electrode-to-best-frequency mapping.
BioAid Processing
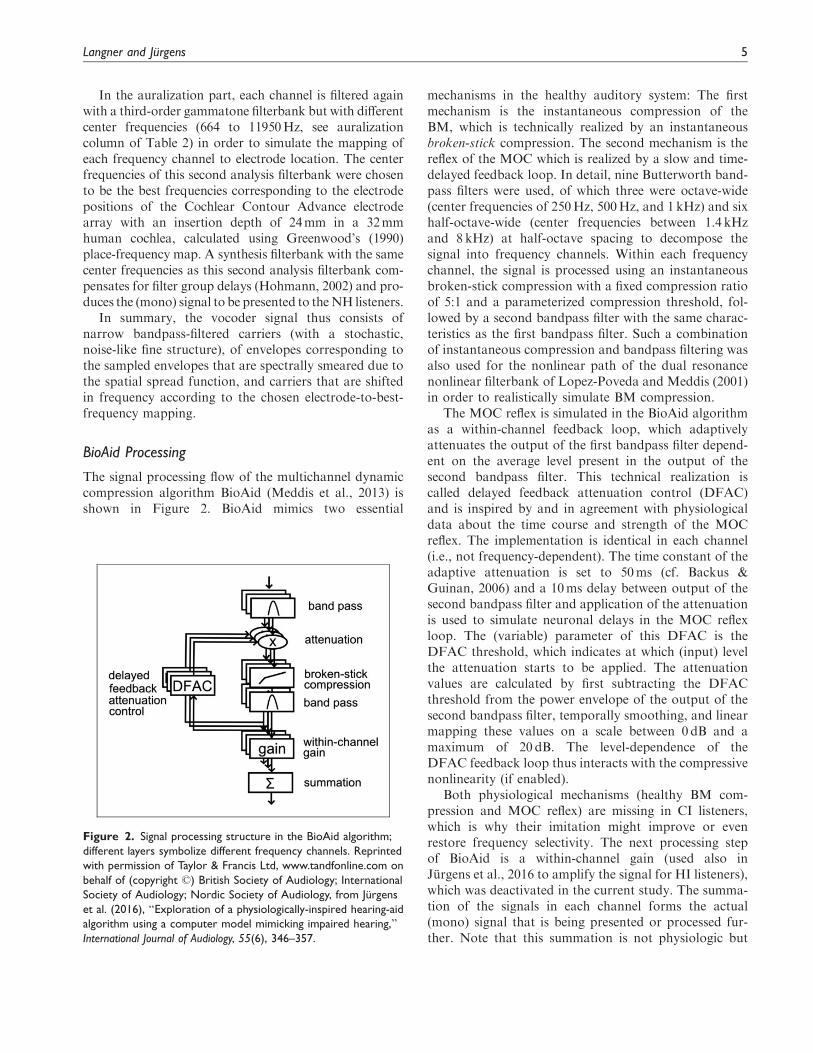
The signal processing flow of the multichannel dynamiccompression algorithm BioAid (Meddis et al., 2013) isshown in Figure 2. BioAid mimics two essential
mechanisms in the healthy auditory system: The firstmechanism is the instantaneous compression of theBM, which is technically realized by an instantaneousbroken-stick compression. The second mechanism is thereflex of the MOC which is realized by a slow and time-delayed feedback loop. In detail, nine Butterworth band-pass filters were used, of which three were octave-wide(center frequencies of 250Hz, 500Hz, and 1 kHz) and sixhalf-octave-wide (center frequencies between 1.4 kHzand 8 kHz) at half-octave spacing to decompose thesignal into frequency channels. Within each frequencychannel, the signal is processed using an instantaneousbroken-stick compression with a fixed compression ratioof 5:1 and a parameterized compression threshold, fol-lowed by a second bandpass filter with the same charac-teristics as the first bandpass filter. Such a combinationof instantaneous compression and bandpass filtering wasalso used for the nonlinear path of the dual resonancenonlinear filterbank of Lopez-Poveda and Meddis (2001)in order to realistically simulate BM compression.
The MOC reflex is simulated in the BioAid algorithmas a within-channel feedback loop, which adaptivelyattenuates the output of the first bandpass filter depend-ent on the average level present in the output of thesecond bandpass filter. This technical realization iscalled delayed feedback attenuation control (DFAC)and is inspired by and in agreement with physiologicaldata about the time course and strength of the MOCreflex. The implementation is identical in each channel(i.e., not frequency-dependent). The time constant of theadaptive attenuation is set to 50ms (cf. Backus &Guinan, 2006) and a 10ms delay between output of thesecond bandpass filter and application of the attenuationis used to simulate neuronal delays in the MOC reflexloop. The (variable) parameter of this DFAC is theDFAC threshold, which indicates at which (input) levelthe attenuation starts to be applied. The attenuationvalues are calculated by first subtracting the DFACthreshold from the power envelope of the output of thesecond bandpass filter, temporally smoothing, and linearmapping these values on a scale between 0 dB and amaximum of 20 dB. The level-dependence of theDFAC feedback loop thus interacts with the compressivenonlinearity (if enabled).
Both physiological mechanisms (healthy BM com-pression and MOC reflex) are missing in CI listeners,which is why their imitation might improve or evenrestore frequency selectivity. The next processing stepof BioAid is a within-channel gain (used also inJurgens et al., 2016 to amplify the signal for HI listeners),which was deactivated in the current study. The summa-tion of the signals in each channel forms the actual(mono) signal that is being presented or processed fur-ther. Note that this summation is not physiologic but
Figure 2. Signal processing structure in the BioAid algorithm;
different layers symbolize different frequency channels. Reprinted
with permission of Taylor & Francis Ltd, www.tandfonline.com on
behalf of (copyright �) British Society of Audiology; International
Society of Audiology; Nordic Society of Audiology, from Jurgens
et al. (2016), “Exploration of a physiologically-inspired hearing-aid
algorithm using a computer model mimicking impaired hearing,”
International Journal of Audiology, 55(6), 346–357.
Langner and Jurgens 5
was done in this study to test the same algorithm as inJurgens et al. (2016) with CI listeners for comparisonaspects.
The parameters for both the instantaneous compres-sion and the DFAC are individually set for each NH andCI listener. The hearing threshold of the 16ms targettone was measured beforehand to obtain these values.The DFAC threshold is set to the same dB SPL valueas the target tone during the PTC experiment (i.e., 10 dBSL), while the threshold for the instantaneous compres-sion was set 5 dB above this value (therefore at 15 dBSL). These settings are in rough agreement with physio-logical observations (Russell & Murugasu, 1997) show-ing that the DFAC’s physiological counterpart MOC isstrongest close to absolute threshold, whereas theinstantaneous compression is active at levels abovethreshold (Ruggero et al. 1997; Russell & Murugasu,1997). The exact values in humans are not known and,for example, the compression threshold may be highlyindividual even across NH listeners (Plack, Drga, &Lopez-Poveda, 2004).
PTCs were measured for simulated and actual CIusers in three conditions: unprocessed (i.e., vocoder-only for simulated CI listeners), BioAid without
instantaneous compression, and BioAid with instantan-eous compression. These two BioAid conditions werechosen to investigate the effect of either mimickingMOC processing alone or mimicking the combinationof MOC processing and BM compression, as bothhave shown frequency selectivity improvements in HIlisteners (Jurgens et al., 2016). In addition, NH listener’sPTCs were measured without any processing (vocoder orBioAid) as a reference. The presentation order of theconditions was pseudorandomized for each listener. Allmeasurements in one condition were completed beforethe next condition was started. All three repetitions aswell as the order of masker frequencies in each conditionwere measured in an interleaved manner.
Results
Figures 3 and 4 show PTCs as masker threshold levelsin dB SL, which means that the 0 dB SL line indicatesthe absolute threshold of the target tone. This displaywas chosen, because absolute sound pressure level spe-cifications for CI listeners presented with stimuli viatheir auxiliary sound input were not possible and thedB SL allows for direct comparisons between simulated
1 1.4 1.8 2 2.2 2.6 3.20
20406080
100
NH1
1 1.4 1.8 2 2.2 2.6 3.20
20406080
100
NH2
1 1.4 1.8 2 2.2 2.6 3.20
20406080
100
NH3
1 1.4 1.8 2 2.2 2.6 3.20
20406080
100
NH4
Mas
ker
leve
l [dB
SL]
1 1.4 1.8 2 2.2 2.6 3.20
20406080
100
NH5
1 1.4 1.8 2 2.2 2.6 3.20
20406080
100
NH6
1 1.4 1.8 2 2.2 2.6 3.20
20406080
100
NH7
1 1.4 1.8 2 2.2 2.6 3.20
20406080
100
NH8
1 1.4 1.8 2 2.2 2.6 3.20
20406080
100
NH9
1 1.4 1.8 2 2.2 2.6 3.20
20406080
100
NH10
1 1.4 1.8 2 2.2 2.6 3.20
20406080
100
NH11
Masker frequency [kHz]1 1.4 1.8 2 2.2 2.6 3.2
0
20
40
60
80Averaged
NH Ref. Unproc. BioAid BioAid + C
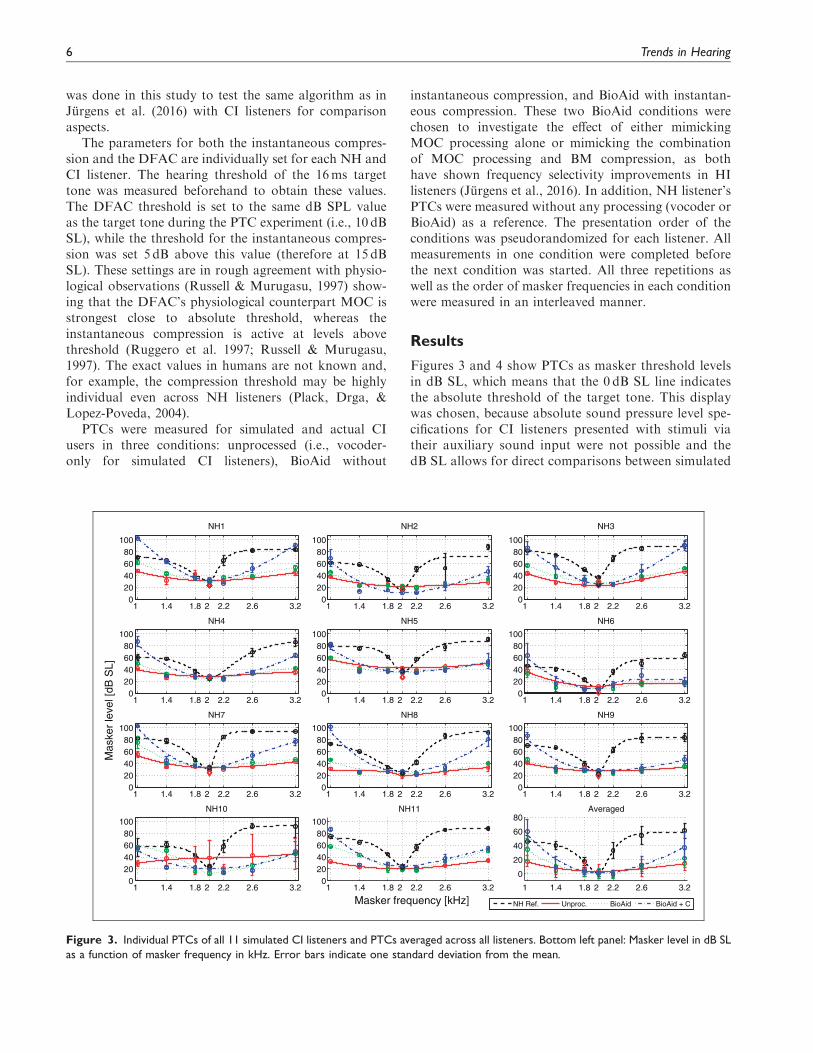
Figure 3. Individual PTCs of all 11 simulated CI listeners and PTCs averaged across all listeners. Bottom left panel: Masker level in dB SL
as a function of masker frequency in kHz. Error bars indicate one standard deviation from the mean.
6 Trends in Hearing
and actual CI listeners. Circles indicate the averagesover all three measurement repetitions for a masker fre-quency, while error bars indicate one standard devi-ation over the three repetitions. PTCs were fittedusing a second-order rounded exponential fit(Patterson et al., 1982).
Experiment 1—Simulated CI Listeners
Figure 3 shows individual PTCs (masked thresholds as afunction of masker frequency) averaged over the threemeasurement runs. In addition, the PTC averaged acrossall participants is shown in the bottom right panel. Foreach individual listener, a similar pattern can beobserved. The NH reference PTC (black dashed line) isrelatively sharp with high masked thresholds (around40 dB to 60 dB SL) at the outer frequencies (1, 1.4, 2.6,and 3.2 kHz). The unprocessed CI simulation (realizedusing the vocoder only, red continuous line) shows aflat shape in all listeners. BioAid without instantaneouscompression (i.e., with DFAC only, green dotted line)shows small improvements in frequency selectivity in
terms of a sharper PTC curve and higher masked thresh-olds at the outermost masker frequencies (1 and3.2 kHz). The improvement is stronger using BioAidwith instantaneous compression (blue dashed-dottedline), which is also evident at the outermost frequencies,whose average masker levels are about 20 dB higher thanin the PTC collected with BioAid without instantaneouscompression. Relatively large error bars in the averagedresults (bottom right panel) originate in interindividualdifferences and not in large error bars in individualPTCs.
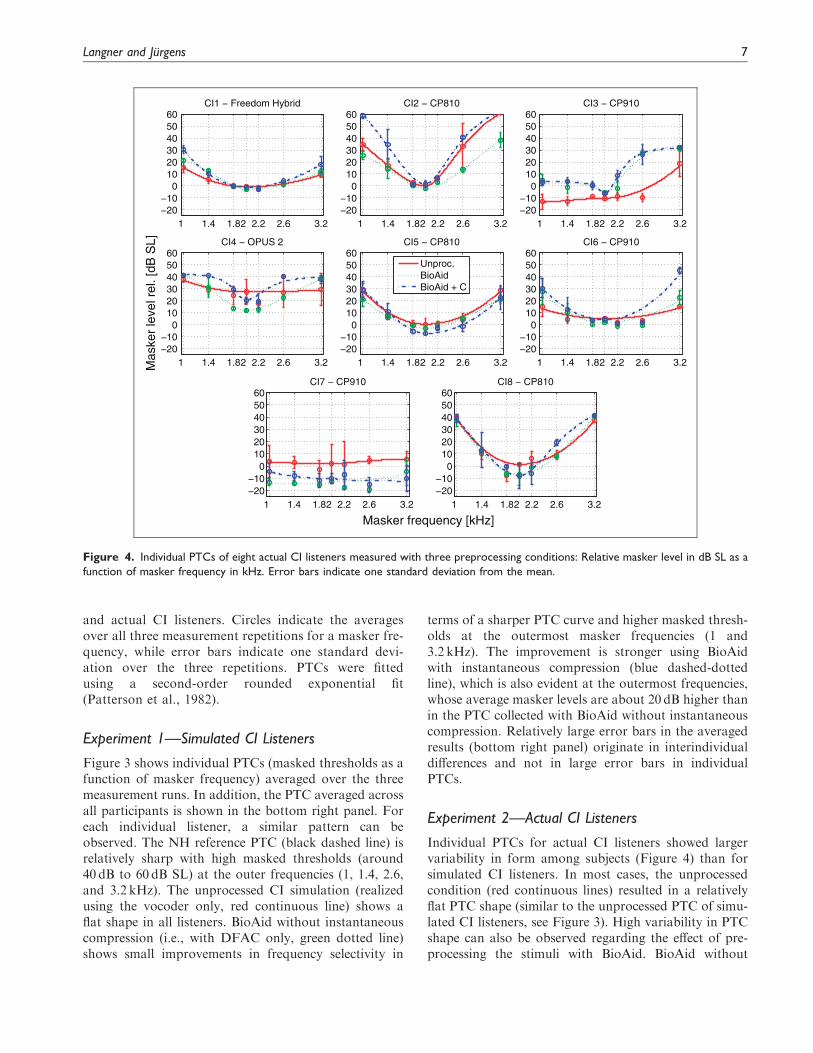
Experiment 2—Actual CI Listeners
Individual PTCs for actual CI listeners showed largervariability in form among subjects (Figure 4) than forsimulated CI listeners. In most cases, the unprocessedcondition (red continuous lines) resulted in a relativelyflat PTC shape (similar to the unprocessed PTC of simu-lated CI listeners, see Figure 3). High variability in PTCshape can also be observed regarding the effect of pre-processing the stimuli with BioAid. BioAid without
1 1.4 1.82 2.2 2.6 3.2−20−10
0102030405060
CI1 − Freedom Hybrid
1 1.4 1.82 2.2 2.6 3.2−20−10
0102030405060
CI2 − CP810
1 1.4 1.82 2.2 2.6 3.2−20−10
0102030405060
CI3 − CP910
1 1.4 1.82 2.2 2.6 3.2−20−10
0102030405060
CI4 − OPUS 2
Mas
ker
leve
l rel
. [dB
SL]
1 1.4 1.82 2.2 2.6 3.2−20−10
0102030405060
CI5 − CP810
1 1.4 1.82 2.2 2.6 3.2−20−10
0102030405060
CI6 − CP910
1 1.4 1.82 2.2 2.6 3.2−20−10
0102030405060
CI7 − CP910
Masker frequency [kHz]1 1.4 1.82 2.2 2.6 3.2
−20−10
0102030405060
CI8 − CP810
Unproc.BioAidBioAid + C
Figure 4. Individual PTCs of eight actual CI listeners measured with three preprocessing conditions: Relative masker level in dB SL as a
function of masker frequency in kHz. Error bars indicate one standard deviation from the mean.
Langner and Jurgens 7
instantaneous compression resulted in slightly sharperPTCs for some CI listeners (CI2, 3, 4, 6, and 8), whilePTCs in other CI listeners showed almost no change(CI1, 5, and 7). For BioAid with instantaneous com-pression (blue dashed-dotted line), the PTC shape wasstrongly (Q10dB improvement over unprocessed condi-tion greater than 1.5 like CI2, CI3, and CI4, seebelow), modestly (Q10dB improvement over unpro-cessed condition between 0.5 and 1.5 like CI1, CI5,CI6, and CI8), or not at all (CI7) affected by the algo-rithm. Thus, BioAid had a much stronger frequencyselectivity restoration effect with than without instant-aneous compression, especially in terms of highermasked thresholds at the outer masked frequencies(1, 1.4, 2.6, and 3.2 kHz).
Statistical Comparisons
Statistical comparisons were conducted to quantify thesharpness of PTC shape with two different measures:DPTC (cf. Lecluyse, Tan, McFerran, & Meddis, 2013)and Q10dB. DPTC is a depth measure, in dB, and isdefined as the difference between the average maskerlevels at all four outlying masker frequencies and theaverage of the masker levels at the three center masker
frequencies. This measure is suitable for capturing thelarge-scale shape of the PTC. Thus, PTC sharpness canbe classified as strong (above 20 dB), medium (10–20 dB),or low (below 10 dB). Q10dB is the ratio between thecenter frequency and the bandwidth 10 dB above thetip of the curve. For relatively flat PTCs, Q10dB capturesvariations more near the center frequencies and is there-fore a small-scale measure for PTC shape comparisons.For both DPTC and Q10dB, high values indicate sharperPTCs. The Friedman test with Bonferroni correctionapplied was used for statistical comparisons.
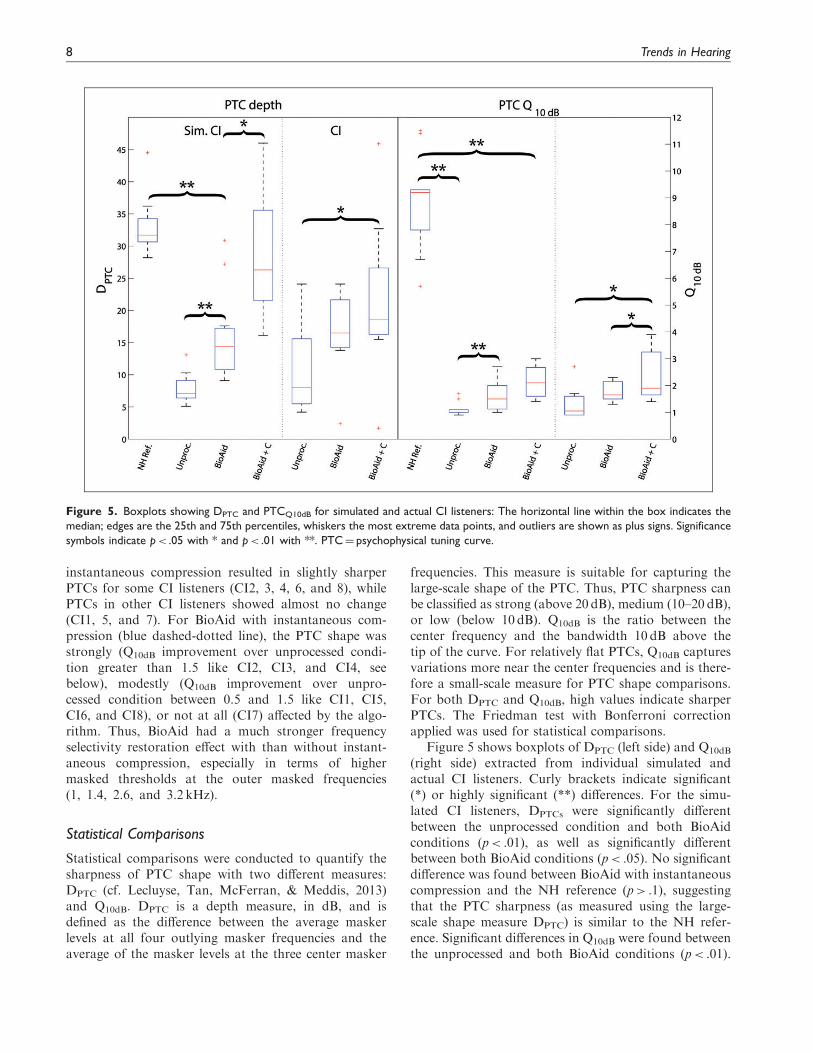
Figure 5 shows boxplots of DPTC (left side) and Q10dB
(right side) extracted from individual simulated andactual CI listeners. Curly brackets indicate significant(*) or highly significant (**) differences. For the simu-lated CI listeners, DPTCs were significantly differentbetween the unprocessed condition and both BioAidconditions (p< .01), as well as significantly differentbetween both BioAid conditions (p< .05). No significantdifference was found between BioAid with instantaneouscompression and the NH reference (p> .1), suggestingthat the PTC sharpness (as measured using the large-scale shape measure DPTC) is similar to the NH refer-ence. Significant differences in Q10dB were found betweenthe unprocessed and both BioAid conditions (p< .01).
Figure 5. Boxplots showing DPTC and PTCQ10dB for simulated and actual CI listeners: The horizontal line within the box indicates the
median; edges are the 25th and 75th percentiles, whiskers the most extreme data points, and outliers are shown as plus signs. Significance
symbols indicate p< .05 with * and p< .01 with **. PTC¼ psychophysical tuning curve.
8 Trends in Hearing
However, the NH reference condition showed a highlysignificant difference in Q10dB to all other conditions(p< .01) indicating that the small-scale shape of thePTC (as well as their visual form) is not restored.
The median DPTC and Q10dB of actual CI listenersmatch the respective median values of the simulated CIlisteners in the unprocessed condition. However, thelarger boxplots of actual CI listeners in the unprocessedcondition confirm a larger variability across actual CIlisteners compared with the simulated CI listeners(DPTC range of 2.7 dB for simulated and 10.1 dB foractual CI listeners of the 25th and 75th percentiles).A significant difference between the unprocessed conditionand BioAid with instantaneous compression was foundfor actual CI listeners both regarding DPTC and Q10dB
(p< .05). There was no statistical difference in DPTC orQ10dB between unprocessed and BioAid without instant-aneous compression in actual CI listeners. This indicatesthat frequency selectivity could be improved in actual CIlisteners by using BioAid with instantaneous compres-sion but not without.
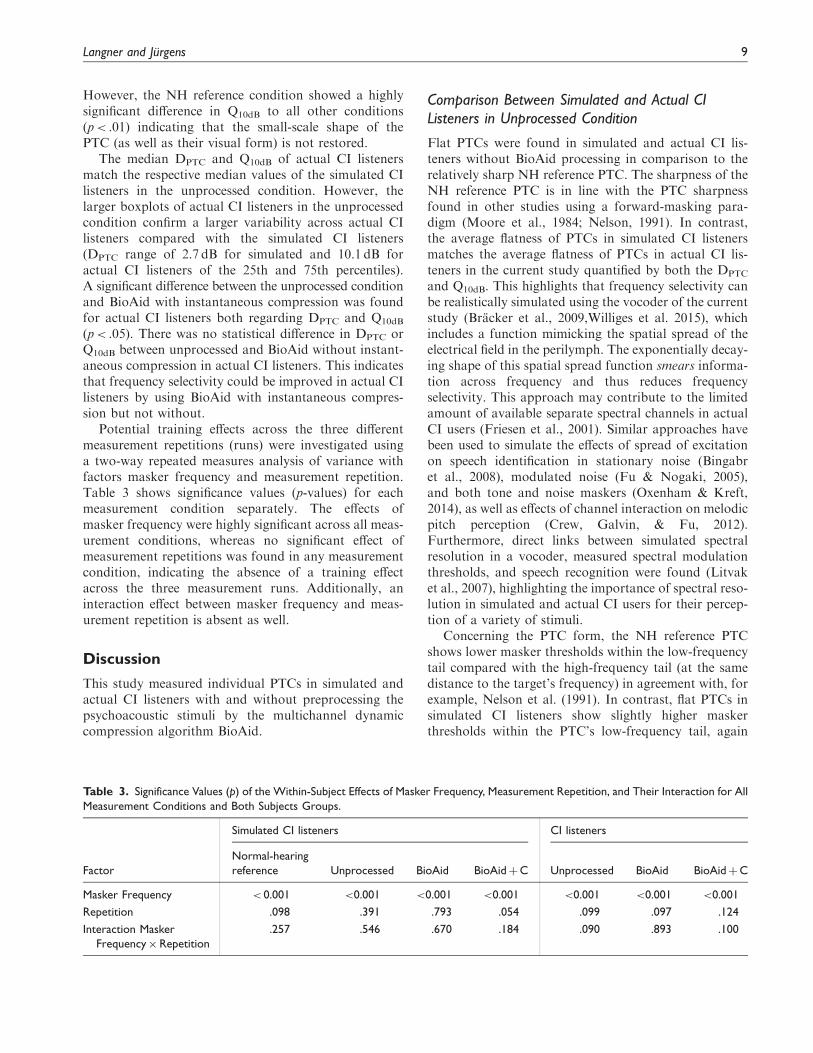
Potential training effects across the three differentmeasurement repetitions (runs) were investigated usinga two-way repeated measures analysis of variance withfactors masker frequency and measurement repetition.Table 3 shows significance values (p-values) for eachmeasurement condition separately. The effects ofmasker frequency were highly significant across all meas-urement conditions, whereas no significant effect ofmeasurement repetitions was found in any measurementcondition, indicating the absence of a training effectacross the three measurement runs. Additionally, aninteraction effect between masker frequency and meas-urement repetition is absent as well.
Discussion
This study measured individual PTCs in simulated andactual CI listeners with and without preprocessing thepsychoacoustic stimuli by the multichannel dynamiccompression algorithm BioAid.
Comparison Between Simulated and Actual CIListeners in Unprocessed Condition
Flat PTCs were found in simulated and actual CI lis-teners without BioAid processing in comparison to therelatively sharp NH reference PTC. The sharpness of theNH reference PTC is in line with the PTC sharpnessfound in other studies using a forward-masking para-digm (Moore et al., 1984; Nelson, 1991). In contrast,the average flatness of PTCs in simulated CI listenersmatches the average flatness of PTCs in actual CI lis-teners in the current study quantified by both the DPTC
and Q10dB. This highlights that frequency selectivity canbe realistically simulated using the vocoder of the currentstudy (Bracker et al., 2009,Williges et al. 2015), whichincludes a function mimicking the spatial spread of theelectrical field in the perilymph. The exponentially decay-ing shape of this spatial spread function smears informa-tion across frequency and thus reduces frequencyselectivity. This approach may contribute to the limitedamount of available separate spectral channels in actualCI users (Friesen et al., 2001). Similar approaches havebeen used to simulate the effects of spread of excitationon speech identification in stationary noise (Bingabret al., 2008), modulated noise (Fu & Nogaki, 2005),and both tone and noise maskers (Oxenham & Kreft,2014), as well as effects of channel interaction on melodicpitch perception (Crew, Galvin, & Fu, 2012).Furthermore, direct links between simulated spectralresolution in a vocoder, measured spectral modulationthresholds, and speech recognition were found (Litvaket al., 2007), highlighting the importance of spectral reso-lution in simulated and actual CI users for their percep-tion of a variety of stimuli.
Concerning the PTC form, the NH reference PTCshows lower masker thresholds within the low-frequencytail compared with the high-frequency tail (at the samedistance to the target’s frequency) in agreement with, forexample, Nelson et al. (1991). In contrast, flat PTCs insimulated CI listeners show slightly higher maskerthresholds within the PTC’s low-frequency tail, again
Table 3. Significance Values (p) of the Within-Subject Effects of Masker Frequency, Measurement Repetition, and Their Interaction for All
Measurement Conditions and Both Subjects Groups.
Simulated CI listeners CI listeners
Factor
Normal-hearing
reference Unprocessed BioAid BioAidþC Unprocessed BioAid BioAidþC
Masker Frequency < 0.001 <0.001 <0.001 <0.001 <0.001 <0.001 <0.001
Repetition .098 .391 .793 .054 .099 .097 .124
Interaction Masker
Frequency�Repetition
.257 .546 .670 .184 .090 .893 .100
Langner and Jurgens 9
due to the spatial spread function used within theCI simulation. The spatial spread function is symmetricalong the cochlear partition, that is, symmetric on a loga-rithmic frequency scale, which explains its slight asym-metry on the linear frequency scale in the average data ofFigure 3. PTCs in actual CI listeners without BioAidprocessing show flat but nonsystematic shapes acrossindividuals.
Sources of Individual Differences in CI Listeners
The similarity of PTC shapes across simulated CI listenerscontrasts with the very individual PTC shapes across theactual CI listeners. This large variability (see Figure 4) isin line with variability in CI listener’s spatial tuning curvesreported in Nelson et al. (2008, 2011). Anderson, Nelson,Kreft, Nelson, and Oxenham (2011) showed that this vari-ability in spatial tuning curves correlates also with anothermeasure of spectral resolution in CI users, namely spectralripple discrimination. Different physiological factors mayhave contributed to this high degree of variability. Thesefactors could be the individual spatial spread of the elec-tric field in the perilymph, which may occur due to differ-ent distances between electrode and auditory nerve tissuein individuals, number and distribution of auditory nervefibers (Fayad & Linthicum, 2006; Zhu, Tang, Zeng,Guan, & Ye, 2012), differences in electrode-nerve interface(Bierer & Nye, 2014), and the individual and electrode-dependent electric dynamic range (Chatterjee, Fu,& Shannon, 2000). However, also two different signal pro-cessing schemes (as well as four different devices andimplant types from two different manufacturers) mayhave contributed to this variability as well. These factorscan, in principle, be implemented also in the vocoderbeing used in this study (Bracker et al., 2009, Willigeset al. 2015) for a systematic investigation of how strongthe influence of these factors is on the PTC shape.
PTC sharpening was also observed in two differentforms, one which lowered the tip but left the sides almostunchanged (as in CI8) and the more common case, whichleft the tip unchanged and increased the sides (as in CI2).The former case may be interpreted as that CI8 benefitsmore from the temporal mechanism of the DFAC, redu-cing the masker’s amplitude in the on-frequency condition,but not so much from the frequency-selective mechanism,which mostly affects the remote off-frequency maskers(details see below). A possible (hypothetical) reason couldbe a greater spread of the electric field in this listener, whichlimits spectral resolution and which may limit possiblebenefits in tolerating off-frequency maskers.
Effect of BioAid Algorithm on PTCs
In line with earlier findings in HI listeners (Jurgens et al.,2016), the PTC shape was sharpened in all simulated CI
listeners and in seven out of eight actual CI listeners dueto the algorithm BioAid. This indicates that frequencyselectivity as measured in the current study can beimproved for all those CI devices tested in this studyby an algorithm processing the stimuli before enteringthe CI sound coding strategy. The introduction of theDPTC measure revealed that predominantly the large-scale shape of the PTC was affected, that is, maskedthreshold increases were mainly present at remotemasker frequencies. Frequency selectivity changes atnearby masker frequencies were limited, as the Q10dB
measure showed. Listener CI7 showed the shallowestunprocessed PTCs, which indicated that for this listener,even remote off-frequency maskers were as effective inmasking the target as on-frequency maskers.Interestingly, this listener also showed relatively poorspeech intelligibility. PTCs stay flat also with preprocess-ing using BioAid. The reason for the lack of frequencyselectivity improvement in this listener (CI7) is currentlynot clear. It is, however, likely that the unprocessed off-frequency masker levels are so low that they are situatedat or below the DFAC threshold and that the BioAidprocessing thus has virtually no effect on the masker aswell as on the target. This indicates that a slight increasein masker level with distance from the target frequency inthe unprocessed condition is necessary in order to see theimprovement effect.
Mechanisms Responsible for the Effect on PTCs
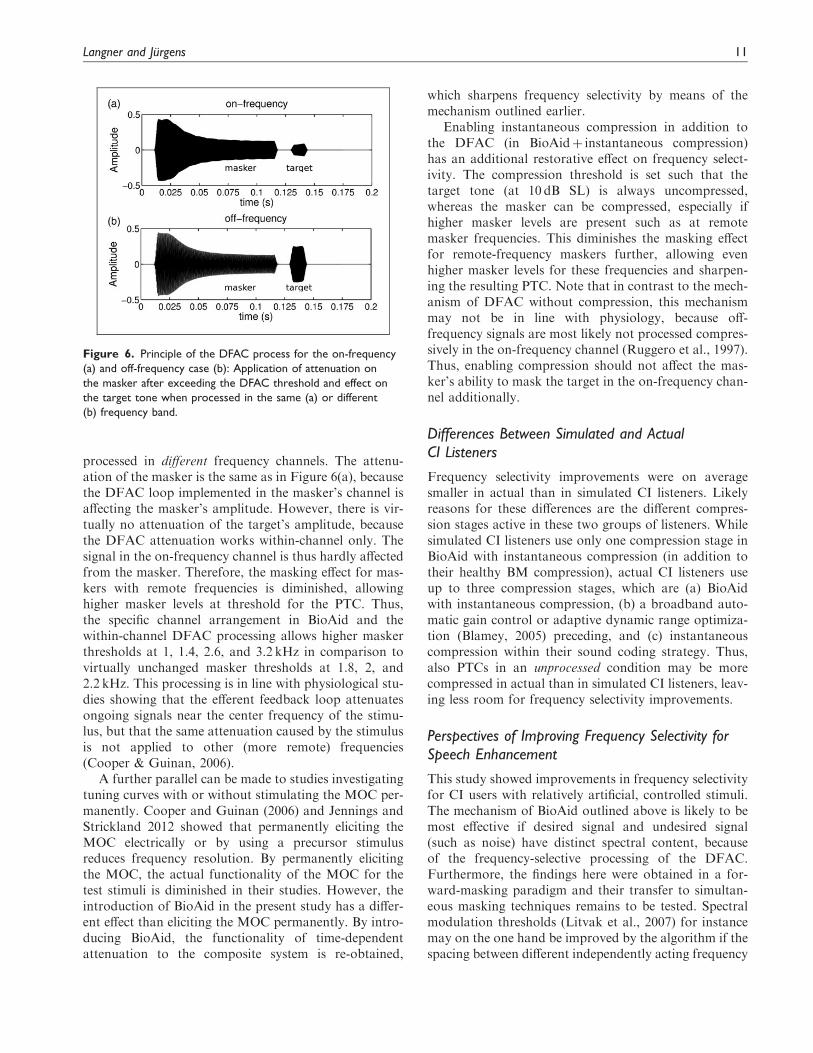
Two different mechanisms in BioAid are responsible forthe improvements in frequency selectivity (as measuredusing PTCs), which can be separated by the two BioAidprocessing conditions tested in this study. The effect ofBioAid’s DFAC is outlined in Figure 6, which showstypical composite output signals of BioAid (i.e., addedacross bands) to the masker and probe sequence used formeasuring the on-frequency masker threshold of a PTC(Figure 6(a)), and for measuring the off-frequencymasker threshold (Figure 6(b), with masker frequencyone octave below the target frequency). Note that theinput level of the target tone is the same across Figure6(a) and (b), although the target’s output amplitude dif-fers visibly. In the on-frequency case, both the maskerand target tone are processed in the same frequencychannel. The within-channel DFAC feedback loopattenuates the masker increasingly during its timecourse and also attenuates the target tone, because thetarget tone follows after a 10ms gap, which is too shortto reduce the DFAC’s attenuative function. Thus,masker and target are equally affected due to theDFAC and masker thresholds are virtually unchangedin comparison to the unprocessed condition. In the off-frequency case (Figure 6(b), i.e., for remote masker fre-quencies), however, masker and target tone are
10 Trends in Hearing
processed in different frequency channels. The attenu-ation of the masker is the same as in Figure 6(a), becausethe DFAC loop implemented in the masker’s channel isaffecting the masker’s amplitude. However, there is vir-tually no attenuation of the target’s amplitude, becausethe DFAC attenuation works within-channel only. Thesignal in the on-frequency channel is thus hardly affectedfrom the masker. Therefore, the masking effect for mas-kers with remote frequencies is diminished, allowinghigher masker levels at threshold for the PTC. Thus,the specific channel arrangement in BioAid and thewithin-channel DFAC processing allows higher maskerthresholds at 1, 1.4, 2.6, and 3.2 kHz in comparison tovirtually unchanged masker thresholds at 1.8, 2, and2.2 kHz. This processing is in line with physiological stu-dies showing that the efferent feedback loop attenuatesongoing signals near the center frequency of the stimu-lus, but that the same attenuation caused by the stimulusis not applied to other (more remote) frequencies(Cooper & Guinan, 2006).
A further parallel can be made to studies investigatingtuning curves with or without stimulating the MOC per-manently. Cooper and Guinan (2006) and Jennings andStrickland 2012 showed that permanently eliciting theMOC electrically or by using a precursor stimulusreduces frequency resolution. By permanently elicitingthe MOC, the actual functionality of the MOC for thetest stimuli is diminished in their studies. However, theintroduction of BioAid in the present study has a differ-ent effect than eliciting the MOC permanently. By intro-ducing BioAid, the functionality of time-dependentattenuation to the composite system is re-obtained,
which sharpens frequency selectivity by means of themechanism outlined earlier.
Enabling instantaneous compression in addition tothe DFAC (in BioAidþ instantaneous compression)has an additional restorative effect on frequency select-ivity. The compression threshold is set such that thetarget tone (at 10 dB SL) is always uncompressed,whereas the masker can be compressed, especially ifhigher masker levels are present such as at remotemasker frequencies. This diminishes the masking effectfor remote-frequency maskers further, allowing evenhigher masker levels for these frequencies and sharpen-ing the resulting PTC. Note that in contrast to the mech-anism of DFAC without compression, this mechanismmay not be in line with physiology, because off-frequency signals are most likely not processed compres-sively in the on-frequency channel (Ruggero et al., 1997).Thus, enabling compression should not affect the mas-ker’s ability to mask the target in the on-frequency chan-nel additionally.
Differences Between Simulated and ActualCI Listeners
Frequency selectivity improvements were on averagesmaller in actual than in simulated CI listeners. Likelyreasons for these differences are the different compres-sion stages active in these two groups of listeners. Whilesimulated CI listeners use only one compression stage inBioAid with instantaneous compression (in addition totheir healthy BM compression), actual CI listeners useup to three compression stages, which are (a) BioAidwith instantaneous compression, (b) a broadband auto-matic gain control or adaptive dynamic range optimiza-tion (Blamey, 2005) preceding, and (c) instantaneouscompression within their sound coding strategy. Thus,also PTCs in an unprocessed condition may be morecompressed in actual than in simulated CI listeners, leav-ing less room for frequency selectivity improvements.
Perspectives of Improving Frequency Selectivity forSpeech Enhancement
This study showed improvements in frequency selectivityfor CI users with relatively artificial, controlled stimuli.The mechanism of BioAid outlined above is likely to bemost effective if desired signal and undesired signal(such as noise) have distinct spectral content, becauseof the frequency-selective processing of the DFAC.Furthermore, the findings here were obtained in a for-ward-masking paradigm and their transfer to simultan-eous masking techniques remains to be tested. Spectralmodulation thresholds (Litvak et al., 2007) for instancemay on the one hand be improved by the algorithm if thespacing between different independently acting frequency
Figure 6. Principle of the DFAC process for the on-frequency
(a) and off-frequency case (b): Application of attenuation on
the masker after exceeding the DFAC threshold and effect on
the target tone when processed in the same (a) or different
(b) frequency band.
Langner and Jurgens 11
bands of BioAid is dense enough to allow frequency-specific processing for the spectral ripple stimuli. On theother hand, there may also be a detrimental effect onspectral modulation thresholds due to the compressionintroduced with BioAid (similar as the effect in multichan-nel hearing aids, Plomp, 1988). Frequency selectivity usingnotched-noise paradigms (e.g., Patterson et al., 1982) maybe improved by the BioAid algorithm, particularly if aforward-masking paradigm is used. Thus, future studiesshould investigate if the improvements in frequency select-ivity in HI (Jurgens et al., 2016) and CI listeners (currentstudy) will persist also with other techniques, particularly insimultaneous masking paradigms, to measure frequencyselectivity.
Improvements in frequency resolution for more com-plex stimuli remain also to be tested both in CI and HIlisteners. Speech and babble noise, for example, havesimilar spectral content, which could mean that theirseparation may not be particularly improved by the out-lined mechanism. However, an improvement of speechand noise separation (especially at positive signal-to-noise ratios) is still possible, because the auditory modelused as a blueprint for the DFAC has shown better speechdiscriminability with than without efferent processingenabled (Clark et al., 2012). It is, nevertheless, importantto note that other studies that aimed at improving thespectral contrast for CI users have shown only limited(Bhattacharya & Zeng, 2007; Nogueira, Rode, &Buchner, 2016; Oxenham, Simonson, Turicchia, &Sarpeshkar, 2007) improvements for speech in noise per-formance for CI listeners. It should thus also be tested ifthe improvements in frequency selectivity by BioAid alsogo along with better speech intelligibility in noise for CIusers.
Perspectives for BioAid’s Principles in a SoundCoding Strategy
We were able to acquire participants using devices fromtwo of the main CI manufacturers: Cochlear and MED-EL. Both manufacturers use a different sound codingstrategy, resulting in potentially different effects ofBioAid’s processing. We suspect that effects of thesound coding strategies on the PTC measurement withand without BioAid are small, since only pure tones wereused in the experiments, which were presented subse-quently. For the types of narrow-band stimuli usedhere, both ACE (picking spectral peaks and disregardingspectral valleys) and CIS (stimulating in a round-robinmanner) should produce very similar outputs, however,potentially differing in their stimulation rate.
It is conceivable that the direct implementation ofBioAid’s mechanisms into a CI sound coding strategywill avoid the unphysiologic summing of the signalacross bands, because the signal within a frequency
band can be transmitted directly to one electrode. Thismay enlarge BioAid’s frequency selectivity restorationeffect, because the compressive processing within thestrategy can be synchronized with the compressive andfeedback characteristics of BioAid. This might be usefulfor alleviating the distinction of frequencies in tone com-plexes, which may improve CI listener’s relatively poorpitch perception (Geurts & Wouters, 2001), leading inturn also to improved music perception (cf. Laneau,Wouters, & Moonen, 2006). However, it is importantto also consider the simultaneous effects on speechperception. While improved frequency selectivity, andthus access to more spectral channels, in principleshould be advantageous for speech-in-noise performancein CI listeners (Friesen et al., 2001), compressive process-ing itself might be disadvantageous for speech recogni-tion (cf. Jurgens, Ewert, Kollmeier, & Brand, 2014) byreducing the contrast between peaks and troughs in thespeech’s modulation. Thus, further studies are needed inorder to explore the optimal settings of this compressiveprocessing and their effect on frequency selectivity andspeech intelligibility within a CI sound coding strategy.
Conclusions
This study assessed and compared PTCs of simulatedand actual CI users. Furthermore, the dynamic compres-sion algorithm BioAid was used to preprocess acousticstimuli before entering the vocoder used for the CI simu-lation or the CI user’s own speech processor. The follow-ing conclusions can be drawn.
1. Unprocessed PTCs of simulated CI users were foundto be broader than the NH reference PTC.Unprocessed PTCs of actual CI users were foundon average as broad as in simulated CI users, butthe variation of PTC shape across actual CI userswas much higher.
2. In both groups, the algorithm BioAid was able topartially restore the sharpness of PTCs, except forone CI user (CI7). Particularly the large-scale shapeof the PTCs was affected, that is, remote maskerthresholds were much higher than unprocessed.This indicates that frequency selectivity (as measuredusing PTCs in a forward-masking paradigm) can beimproved using a compressive processing precedingthe CI speech processor.
Future research should investigate the implementa-tion of BioAid’s algorithm structure directly into asound coding strategy for CIs (rather than preprocessingthe acoustic stimuli). It will be important to find outwhether the improvement in PTC shape has other bene-fits, even in other measures of frequency selectivity.Thus, it remains an open question whether this approach
12 Trends in Hearing
could help in speech perception, although the resultsfrom earlier work showed limited improvements.
Acknowledgments
Special thanks to Ray Meddis for fruitful discussions andTorsten Dau, Andrew Oxenham, and two anonymous
reviewers for helpful comments on an earlier version of themanuscript.
Declaration of Conflicting Interests
The authors declared no potential conflicts of interest with
respect to the research, authorship, and/or publication of thisarticle.
Funding
The authors disclosed receipt of the following financial support
for the research, authorship, and/or publication of this article:This study was financed by DFG cluster of Excellence EXC1077/1 “Hearing4all.” Conference attendance at the 5th
International Symposium on Auditory and AudiologicalResearch (ISAAR) in Nyborg Strand, Denmark was supportedby a scholarship of the ISAAR organization committee.
References
Anderson, E. S., Nelson, D. A., Kreft, H., Nelson, P. B., &Oxenham, A. J. (2011). Comparing spatial tuning curves,spectral ripple resolution, and speech perception in cochlearimplant users. The Journal of the Acoustical Society of
America, 130(1), 364–375.Backus, B. C., & Guinan, J. (2006). Time-course of the human
medial olivocochlear reflex. Journal of the Acoustical Society
of America, 119(5), 2889–2904.Bierer, J. A., & Nye, A. D. (2014). Comparisons between detec-
tion threshold and loudness perception for individual coch-
lear implant channels. Ear & Hearing, 35(6), 641–651.Bingabr, M., Espinoza-Varas, B., & Loizou, P. C. (2008).
Simulating the effect of spread of excitation in cochlear
implants. Hearing Research, 241(1–2), 73–79.Bhattacharya, A., & Zeng, F. G. (2007). Companding to
improve cochlear-implant speech recognition in speech-shaped noise. The Journal of the Acoustical Society of
America, 122(2), 1079–1089.Blamey, P. J. (2005). Adaptive dynamic range optimization
(ADRO): A digital amplification strategy for hearing aids
and cochlear implants. Trends in Amplification, 9(2), 77–98.Bracker, T., Hohmann, V., Kollmeier, B., & Schulte, M.
(2009). Simulation und Vergleich von
Sprachkodierungsstrategien in Cochlea-Implantaten[Simulation and comparison of speech coding strategies incochlear implants]. Zeitschrift der Audiologie /AudiologicalAcoustics, 48(4), 158–169.
Chatterjee, M., Fu, Q. J., & Shannon, R. V. (2000). Effects ofphase duration and electrode separation on loudness growthin cochlear implant listeners. Journal of the Acoustical
Society of America, 107(3), 1637–1644.Clark, N. R., Brown, G. J., Jurgens, T., & Meddis, R. (2012). A
frequency-selective feedback model of auditory efferent sup-
pression and its implications for the recognition of speech in
noise. Journal of the Acoustical Society of America, 132,1535–1541.
Cooper, N. P., & Guinan, J. J. Jr (2006). Efferent-mediated
control of basilar membrane motion. The Journal ofPhysiology, 576, 49–54.
Crew, J. D., Galvin, J. J. III, & Fu, Q.-J. (2012). Channel
interaction limits melodic pitch perception in simulatedcochlear implants. Journal of the Acoustical Society ofAmerica, 132(5), 429–435.
Fayad, J. N., & Linthicum, F. H. Jr (2006). Multichannel coch-lear implants: Relation of histopathology to performance.The Laryngoscope, 116(8), 1310–1320.
Florentine, M., Buus, S., Scharf, B., & Zwicker, E. (1980).Frequency selectivity in normally-hearing and hearing-impaired observers. Journal of Speech Language andHearing Research, 23(3), 646–669.
Friesen, L. M., Shannon, R. V., Baskent, D., & Wang, X.(2001). Speech recognition in noise as a function of thenumber of spectral channels: Comparison of acoustic hear-
ing and cochlear implants. Journal of the Acoustical Societyof America, 110(2), 1150–1163.
Fu, Q. J., & Nogaki, G. (2005). Noise susceptibility of cochlear
implant users: The role of spectral resolution and smearing.Journal of the Association for Research in Otolaryngology, 6,19–27.
Geurts, L., & Wouters, J. (2001). Coding of the fundamental
frequency in continuous interleaved sampling processors forcochlear implants. Journal of the Acoustical Society ofAmerica, 109(2), 713–726.
Greenwood, D. (1990). A cochlear frequency-position functionfor several species - 29 years later. Journal of the AcousticalSociety of America, 87(6), 2592–2605.
Hohmann, V. (2002). Frequency analysis and synthesis using aGammatone filterbank. Acta Acoustica, 88(3), 433–442.
Jennings, S. G. & Strickland, E. A. (2012). Evaluating the
effects of olivocochlear feedback on psychophysical mea-sures of frequency selectivity. Journal of the AcousticalSociety of America, 132(4), 2483–2496.
Jennings, S. G., Heinz, M. G., & Strickland, E. A. (2011).
Evaluating adaptation and olivocochlear efferent feedbackas potential explanations of psychophysical overshoot.Journal of the Association for Research in Otolaryngology,
12(3), 345–360.Jurgens, T., Clark, N. R., Lecluyse, W., & Meddis, R. (2016).
Exploration of a physiologically-inspired hearing-aid algo-
rithm using a computer model mimicking impaired hearing.International Journal of Audiology, 55(6), 346–357.
Jurgens, T., Ewert, S. D., Kollmeier, B., & Brand, T. (2014).Prediction of consonant recognition in quiet for listeners with
normal and impaired hearing using an auditory model. Journalof the Acoustical Society of America, 135(3), 1506–1517.
Lopez-Poveda, E. A. & Meddis, R. (2001). A human nonlinear
cochlear filterbank. Journal of the Acoustical Society ofAmerica, 110(6), 3107–3118.
Laneau, J., Wouters, J., & Moonen, M. (2006). Improved
music perception with explicit pitch coding in cochlearimplants. Audiology and Neurotology, 11(1), 38–52.
Lecluyse, W., Tan, C. M., McFerran, D., & Meddis, R. (2013).
Acquisition of auditory profiles for good and impairedhearing. International Journal of Audiology, 52(9), 596–605.
Langner and Jurgens 13
Levitt, H. (1971). Transformed up-down methods in psycho-acoustics. Journal of the Acoustical Society of America, 49(2Suppl 2), 467–477.
Litvak, L. M., Spahr, A. J., Saoji, A. A., & Fridman, G. Y.(2007). Relationship between perception of spectral rippleand speech recognition in cochlear implant and vocoder lis-
teners. The Journal of the Acoustical Society of America,122(2), 982–991.
Meddis, R., Clark, N. R., Lecluyse, W., & Jurgens, T. (2013).
BioAid—Ein biologisch inspiriertes Horgerat [BioAid—Abiologically inspired hearing]. Zeitschrift der Audiologie/Audiological Acoustics, 52(4), 148–152.
Moore, B. C. J. (1978). Psychophysical tuning curves measuredin simultaneous and forward masking. Journal of theAcoustical Society of America, 63(2), 524–532.
Moore, B. C. J., Glasberg, B. R., & Roberts, B. (1984).
Refining the measurement of psychophysical tuningcurves. Journal of the Acoustical Society of America, 76(4),1057–1066.
Nelson, D. A. (1991). High-level psychophysical tuning curves:Forward masking in normal-hearing and hearing-impairedlisteners. Journal of Speech and Hearing Research, 34(6),
1233–1249.Nelson, D. A., Donaldson, G. S., & Kreft, H. (2008). Forward-
masked spatial tuning curves in cochlear implant users. TheJournal of the Acoustical Society of America, 123,
1522–1543.Nelson, D., Kreft, H. A., Anderson, E. S., & Donaldson, G. S.
(2011). Spatial tuning curves from apical, middle, and basal
electrodes in cochlear implant users. Journal of theAcoustical Society of America, 129(6), 3916–3933.
Nelson, D. A., Schroder, A. C., & Wojtczak, M. (2001). A new
procedure for measuring peripheral compression in normal-hearing and hearing-impaired listeners. Journal of Speechand Hearing Research, 110(6), 2045–2064.
Nogueira, W., Buchner, A., Lenarz, T., & Edler, B. (2005). Apsychoacoustic ‘NofM’-type speech coding strategy forcochlear implants. EURASIP Journal on Applied SignalProcessing, 2005, 3044–3059.
Nogueira, W., Rode, T., & Buchner, A. (2016). Spectral con-trast enhancement improves speech intelligibility in noisefor cochlear implants. The Journal of the Acoustical
Society of America, 139(2), 728–739.Oxenham, A. J., & Kreft, H. A. (2014). Speech perception in
tones and noise via cochlear implants reveals influence of
spectral resolution on temporal processing. Trends inHearing, 18, 1–14.
Oxenham, A. J., & Plack, C. J. (1997). A behavioral measure ofbasilar-membrane nonlinearity in listeners with normal and
impaired hearing. Journal of the Acoustical Society ofAmerica, 101(6), 1788–1803.
Oxenham, A. J., Simonson, A. M., Turicchia, L., &Sarpeshkar, R. (2007). Evaluation of companding-basedspectral enhancement using simulated cochlear-implant pro-
cessing. The Journal of the Acoustical Society of America,121(3), 1709–1716.
Patterson, R. D., Nimmo-Smith, I., Weber, D. L., & Milroy, R.
(1982). The deterioration of hearing with age: Frequencyselectivity, the critical ratio, the audiogram, and speechthreshold. Journal of the Acoustical Society of America,
72(6), 1788–1803.Plack, C. J., Drga, V., & Lopez-Poveda, E. A. (2004). Inferred
basilar-membrane response functions for listeners with mild
to moderate sensorineural hearing loss. Journal of theAcoustical Society of America, 115, 1684–1695.
Plomp, R. (1988). The negative effect of amplitude compres-sion in multichannel hearing aids in the light of the modula-
tion-transfer function. Journal of the Acoustical Society ofAmerica, 83, 2322–2327.
Ruggero, M. A., Rich, N. C., Recio, A., Narayan, S. S., &
Robles, L. (1997). Basilar-membrane responses to tones atthe base of the chinchilla cochlea. Journal of the AcousticalSociety of America, 101, 2151–2163.
Russell, I. J., & Murugasu, E. (1997). Medial efferent inhibitionsuppresses basilar membrane responses to near characteris-tic frequency tones of moderate to high intensities. Journalof the Acoustical Society of America, 102(3), 1734–1738.
Shannon, R. V., Zeng, F.-G., Kamath, V., Wygonski, J., &Ekelid, M. (1995). Speech recognition with primarily tem-poral cues. Science, 270, 303–304.
Wouter, J., McDermott, H. J. & Francart, T. (2015). SoundCoding in Cochlear Implants: From electric pulses to hear-ing. IEEE Signal Processing Magazine, 32(2), 67–80.
Weber, D. L. (1977). Growth of masking and the auditoryfilter. Journal of the Acoustical Society of America, 62(2),424–429.
Williges, B., Dietz, M., Hohmann, V. & Jurgens, T. (2015).Spatial Release From Masking in Simulated CochlearImplant Users With and Without Access to Low-Frequency Acoustic Hearing. Trends in Hearing, 19(1–4),
1–14.Whitmal, N. A. III, Poissant, S. F., Freyman, R. L., & Helfer,
K. S. (2007). Speech intelligibility in cochlear implant simu-
lations: Effects of carrier type, interfering noise, and subjectexperience. Journal of the Acoustical Society of America,122(4), 2376–2388.
Zhu, Z., Tang, Q., Zeng, F.-G., Guan, T., & Ye, D. (2012).Cochlear-implant spatial selectivity with monopolar, bipo-lar and tripolar stimulation. Hearing Research, 283(1–2),45–58.
14 Trends in Hearing


![Quantitative and Structural Analysis of Real-Time and ...oops.uni-oldenburg.de/2816/1/swaqua15.pdf · ties [Sha15], thus demonstrating the “design meets verification” paradigm](https://img.pdfslide.us/doc/110x75/5d53f7d688c993d7398ba713/quantitative-and-structural-analysis-of-real-time-and-oopsuni-ties-sha15.jpg)