Embed Size (px)
Citation preview
Trends in Healthcare Investments and Exits 2019
Record Investments and Fundraising Continue:
UPDATED MEDTECH DECK 5.9.19
ANNUAL REPORT 2019Jonathan Norris, Managing Director, [email protected] @jonnysvbFollow @SVB_Financial Engage #SVBHealthcare
SVB General Business2
Healthcare Sector Investment
Trends in Healthcare Investments and Exits 2019
SVB General Business
0
100
200
300
$0
$3
$6
$9
2017Q1 2017Q2 2017Q3 2017Q4 2018Q1 2018Q2 2018Q3 2018Q4
VC
Do
llars
Inve
sted
($
B)
Biopharma Medical Device Dx/Tools Total Deals
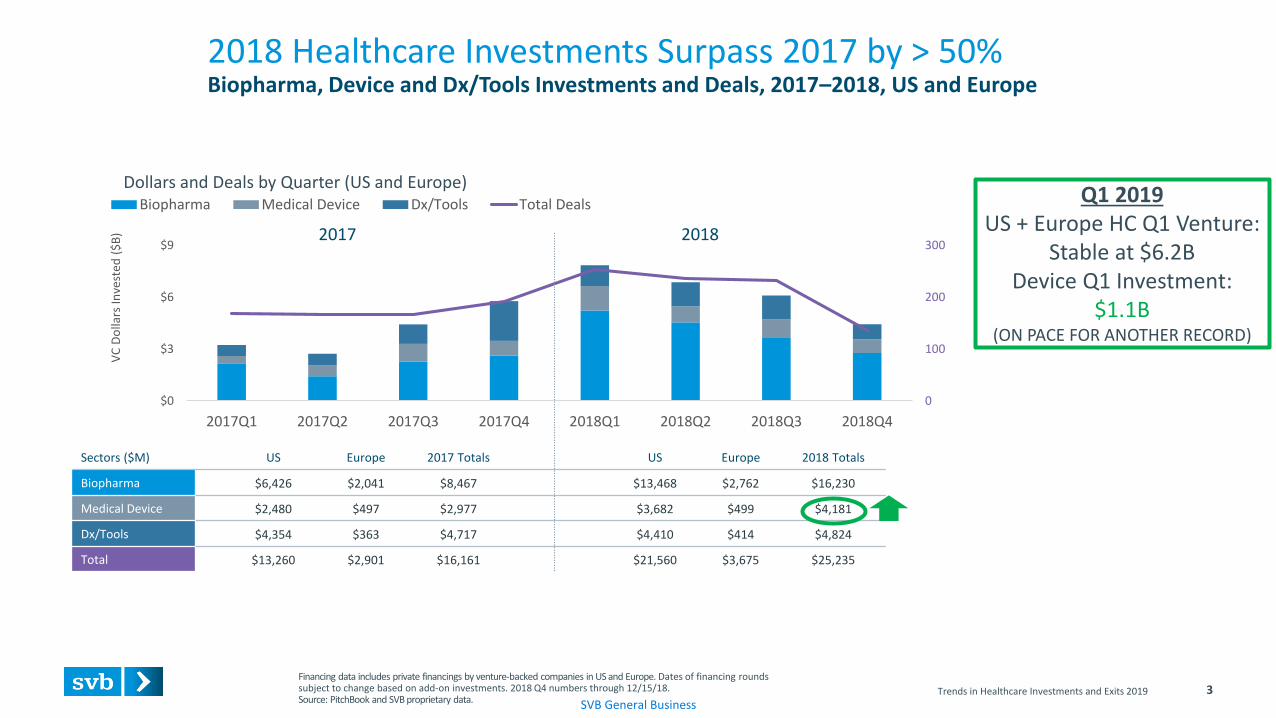
2018 Healthcare Investments Surpass 2017 by > 50%Biopharma, Device and Dx/Tools Investments and Deals, 2017–2018, US and Europe
Trends in Healthcare Investments and Exits 2019
Sectors ($M) US Europe 2017 Totals US Europe 2018 Totals
Biopharma $6,426 $2,041 $8,467 $13,468 $2,762 $16,230
Medical Device $2,480 $497 $2,977 $3,682 $499 $4,181
Dx/Tools $4,354 $363 $4,717 $4,410 $414 $4,824
Total $13,260 $2,901 $16,161 $21,560 $3,675 $25,235
Financing data includes private financings by venture-backed companies in US and Europe. Dates of financing rounds subject to change based on add-on investments. 2018 Q4 numbers through 12/15/18.Source: PitchBook and SVB proprietary data.
2017 2018
3
Dollars and Deals by Quarter (US and Europe)Q1 2019
US + Europe HC Q1 Venture:Stable at $6.2B
Device Q1 Investment: $1.1B
(ON PACE FOR ANOTHER RECORD)
SVB General Business4
Medical Device Venture Investment
Trends in Healthcare Investments and Exits 2019
SVB General Business
7
8
8
3
5
5
1
9
11
9
10
2
2
5
14
7
9
7
8
6
6
Cardiovascular
Orthopedic
Neurology
Surgical
Ophthalmology
Non-InvasiveMonitoring
Oncology
2016 2017 2018
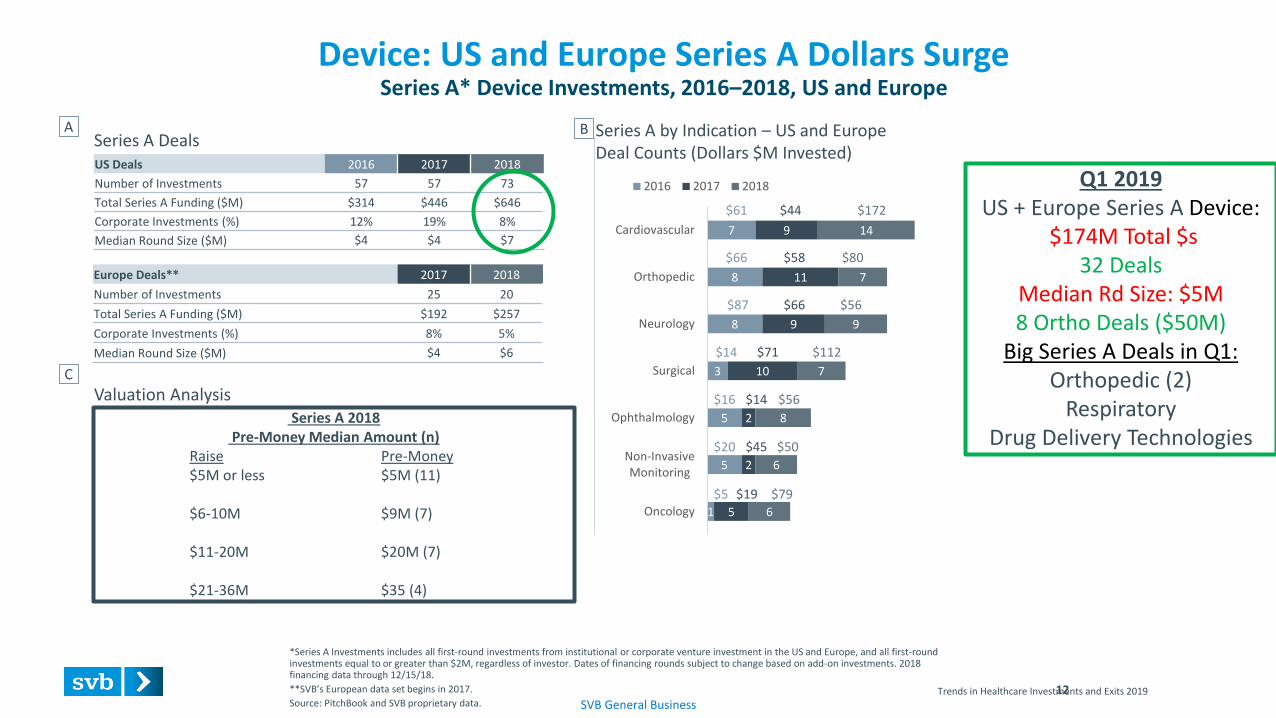
Device: US and Europe Series A Dollars SurgeSeries A* Device Investments, 2016–2018, US and Europe
12Trends in Healthcare Investments and Exits 2019
$61 $44 $172
US Deals 2016 2017 2018
Number of Investments 57 57 73
Total Series A Funding ($M) $314 $446 $646
Corporate Investments (%) 12% 19% 8%
Median Round Size ($M) $4 $4 $7
$66 $58 $80
$87 $66 $56
$14 $71 $112
$16 $14 $56
Europe Deals** 2017 2018
Number of Investments 25 20
Total Series A Funding ($M) $192 $257
Corporate Investments (%) 8% 5%
Median Round Size ($M) $4 $6
*Series A Investments includes all first-round investments from institutional or corporate venture investment in the US and Europe, and all first-round investments equal to or greater than $2M, regardless of investor. Dates of financing rounds subject to change based on add-on investments. 2018 financing data through 12/15/18.
**SVB’s European data set begins in 2017.
Source: PitchBook and SVB proprietary data.
Series A DealsSeries A by Indication – US and EuropeDeal Counts (Dollars $M Invested)
Valuation Analysis
$20 $45 $50
$5 $19 $79
A
C
B
Q1 2019 US + Europe Series A Device:
$174M Total $s32 Deals
Median Rd Size: $5M8 Ortho Deals ($50M)
Big Series A Deals in Q1:Orthopedic (2)
RespiratoryDrug Delivery Technologies
Series A 2018Pre-Money Median Amount (n)
Raise Pre-Money$5M or less $5M (11)
$6-10M $9M (7)
$11-20M $20M (7)
$21-36M $35 (4)
SVB General Business
8
6
5
4
3
6
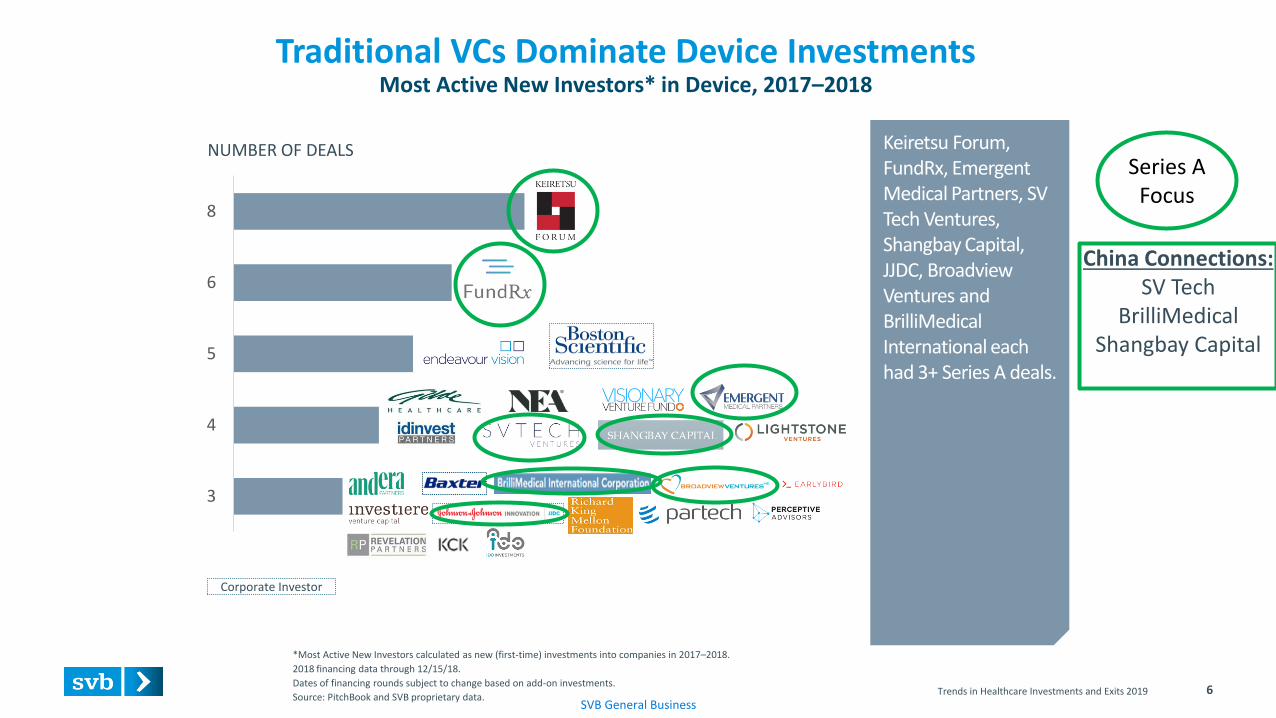
Traditional VCs Dominate Device InvestmentsMost Active New Investors* in Device, 2017–2018
*Most Active New Investors calculated as new (first-time) investments into companies in 2017–2018.
2018 financing data through 12/15/18.
Dates of financing rounds subject to change based on add-on investments.
Source: PitchBook and SVB proprietary data.
NUMBER OF DEALS
Trends in Healthcare Investments and Exits 2019
Corporate Investor
Keiretsu Forum, FundRx, Emergent Medical Partners, SV Tech Ventures, Shangbay Capital, JJDC, Broadview Ventures and BrilliMedicalInternational each had 3+ Series A deals.
Series A Focus
China Connections:SV Tech
BrilliMedicalShangbay Capital
SVB General Business
28
21
21
20
15
8
9
34
24
24
22
13
14
10
Cardiovascular
Neurology
Orthopedic
Surgical
Vascular
Ophthalmology
Oncology
2017 2018
Trends in Healthcare Investments and Exits 2019
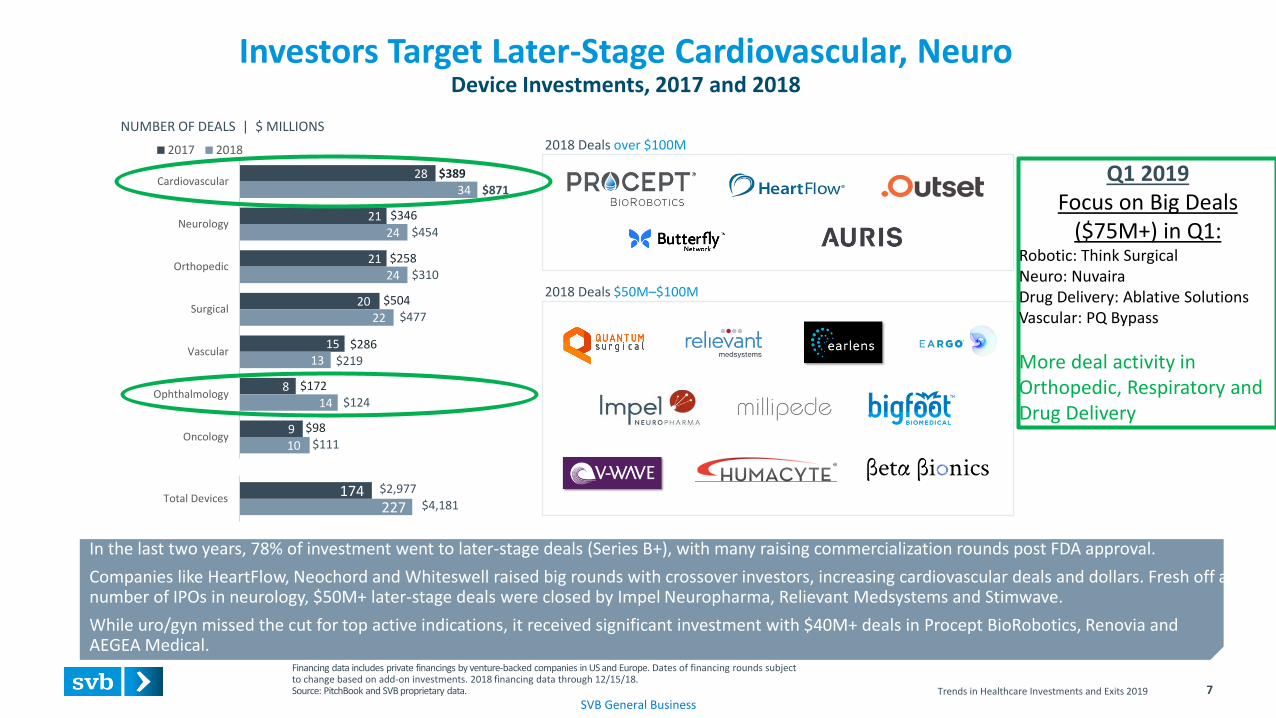
Investors Target Later-Stage Cardiovascular, NeuroDevice Investments, 2017 and 2018
7
Financing data includes private financings by venture-backed companies in US and Europe. Dates of financing rounds subject to change based on add-on investments. 2018 financing data through 12/15/18.Source: PitchBook and SVB proprietary data.
227174
Total Devices
NUMBER OF DEALS | $ MILLIONS
$4,181$2,977
$454
$346
$310$258
$477
$504
$219$286
$871$389
In the last two years, 78% of investment went to later-stage deals (Series B+), with many raising commercialization rounds post FDA approval.
Companies like HeartFlow, Neochord and Whiteswell raised big rounds with crossover investors, increasing cardiovascular deals and dollars. Fresh off a number of IPOs in neurology, $50M+ later-stage deals were closed by Impel Neuropharma, Relievant Medsystems and Stimwave.
While uro/gyn missed the cut for top active indications, it received significant investment with $40M+ deals in Procept BioRobotics, Renovia and AEGEA Medical.
$124$172
$111$98
2018 Deals over $100M
2018 Deals $50M–$100M
Q1 2019Focus on Big Deals
($75M+) in Q1:Robotic: Think SurgicalNeuro: NuvairaDrug Delivery: Ablative SolutionsVascular: PQ Bypass
More deal activity in Orthopedic, Respiratory and Drug Delivery
Trends in Healthcare Investments and Exits 2019 8
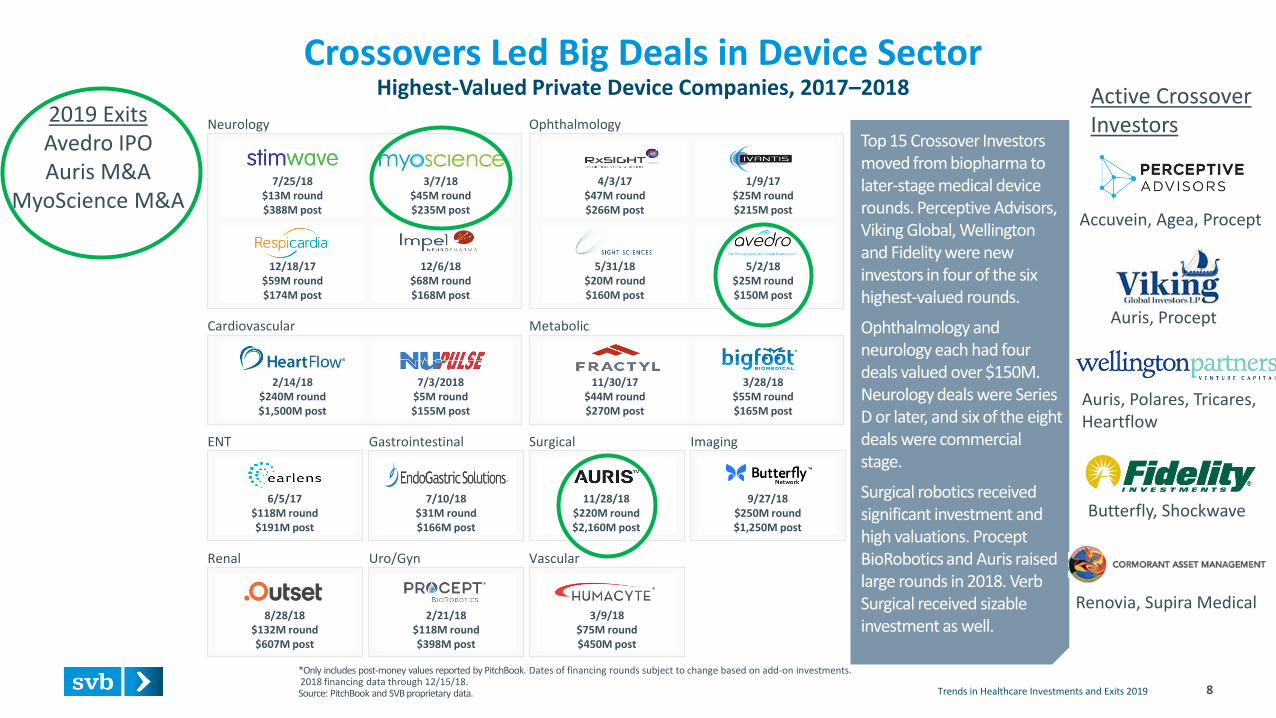
Crossovers Led Big Deals in Device SectorHighest-Valued Private Device Companies, 2017–2018
*Only includes post-money values reported by PitchBook. Dates of financing rounds subject to change based on add-on investments. 2018 financing data through 12/15/18.Source: PitchBook and SVB proprietary data.
Top 15 Crossover Investors moved from biopharma to later-stage medical device rounds. Perceptive Advisors, Viking Global, Wellington and Fidelity were new investors in four of the six highest-valued rounds.
Ophthalmology and neurology each had four deals valued over $150M. Neurology deals were Series D or later, and six of the eight deals were commercial stage.
Surgical robotics received significant investment and high valuations. ProceptBioRobotics and Auris raised large rounds in 2018. Verb Surgical received sizable investment as well.
Neurology
7/25/18$13M round$388M post
3/7/18$45M round$235M post
12/18/17$59M round$174M post
12/6/18$68M round$168M post
4/3/17$47M round$266M post
1/9/17$25M round$215M post
5/31/18$20M round$160M post
5/2/18$25M round$150M post
Cardiovascular
6/5/17$118M round$191M post
ENT
2/14/18$240M round$1,500M post
7/3/2018$5M round$155M post
11/30/17$44M round$270M post
3/28/18$55M round$165M post
7/10/18$31M round$166M post
Gastrointestinal
11/28/18$220M round$2,160M post
Surgical
9/27/18$250M round$1,250M post
Imaging
8/28/18$132M round$607M post
Renal
2/21/18$118M round$398M post
Uro/Gyn
3/9/18$75M round$450M post
Vascular
Ophthalmology
Metabolic
Active Crossover Investors2019 Exits
Avedro IPOAuris M&A
MyoScience M&A
Renovia, Supira Medical
Butterfly, Shockwave
Auris, Polares, Tricares, Heartflow
Auris, Procept
Accuvein, Agea, Procept

SVB General Business9
Medical Device Venture Backed Exits
Trends in Healthcare Investments and Exits 2019
SVB General Business
Exit Values by Year$ BILLIONS
$0
$1
$2
$3
$4
$5
$6
$7
$8
$9
2013 2014 2015 2016 2017 2018
M&A Upfront M&A Milestones IPO Market Cap
2
10
11
3
3
8
12
18
19
13
14
19
2013
2014
2015
2016
2017
2018
IPO M&A
10
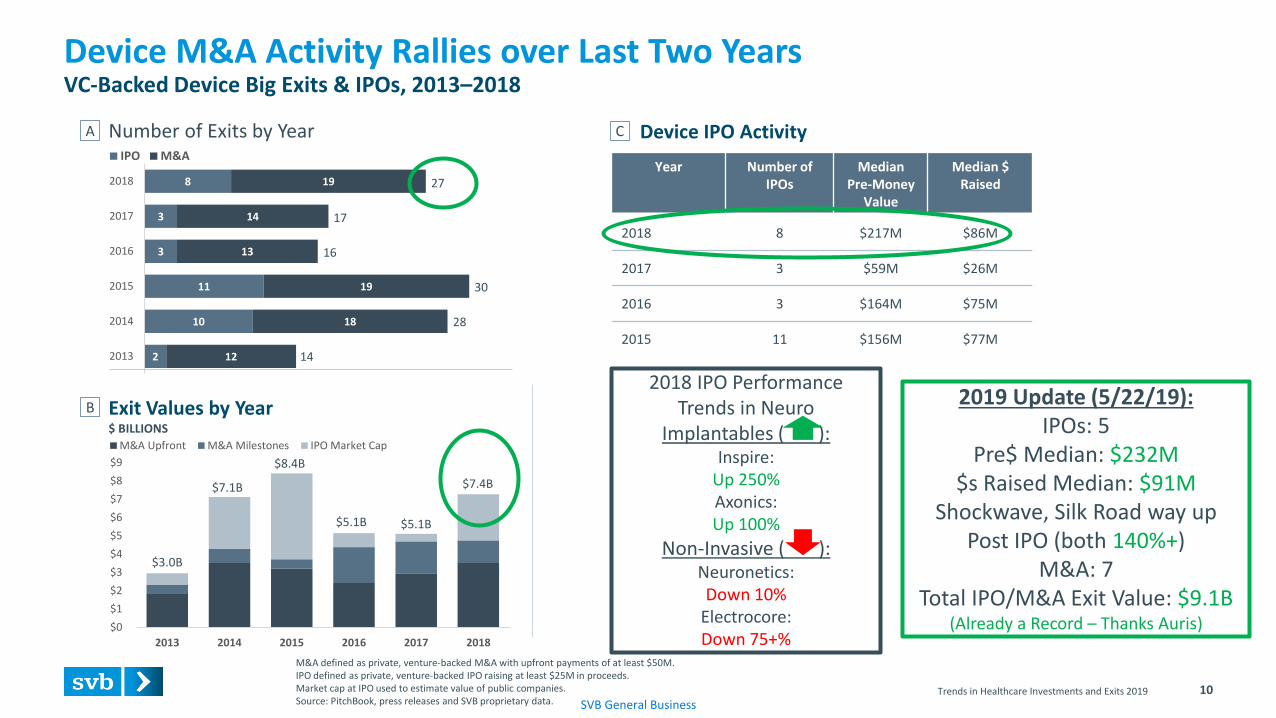
Device M&A Activity Rallies over Last Two YearsVC-Backed Device Big Exits & IPOs, 2013–2018
M&A defined as private, venture-backed M&A with upfront payments of at least $50M. IPO defined as private, venture-backed IPO raising at least $25M in proceeds.Market cap at IPO used to estimate value of public companies.Source: PitchBook, press releases and SVB proprietary data.
Trends in Healthcare Investments and Exits 2019
$3.0B
$7.1B
$8.4B
$5.1B $5.1B
$7.4B
27
17
16
30
28
14
Year Number of IPOs
Median Pre-Money
Value
Median $ Raised
2018 8 $217M $86M
2017 3 $59M $26M
2016 3 $164M $75M
2015 11 $156M $77M
A
B
Number of Exits by Year Device IPO Activity C
2019 Update (5/22/19): IPOs: 5
Pre$ Median: $232M$s Raised Median: $91M
Shockwave, Silk Road way up Post IPO (both 140%+)
M&A: 7Total IPO/M&A Exit Value: $9.1B
(Already a Record – Thanks Auris)
2018 IPO Performance Trends in Neuro
Implantables ( ):Inspire:
Up 250%Axonics: Up 100%
Non-Invasive ( ):Neuronetics:Down 10%
Electrocore:Down 75+%
SVB General Business
1 1
4
23
2
3
1
5
43
2
8
15
10
78
15
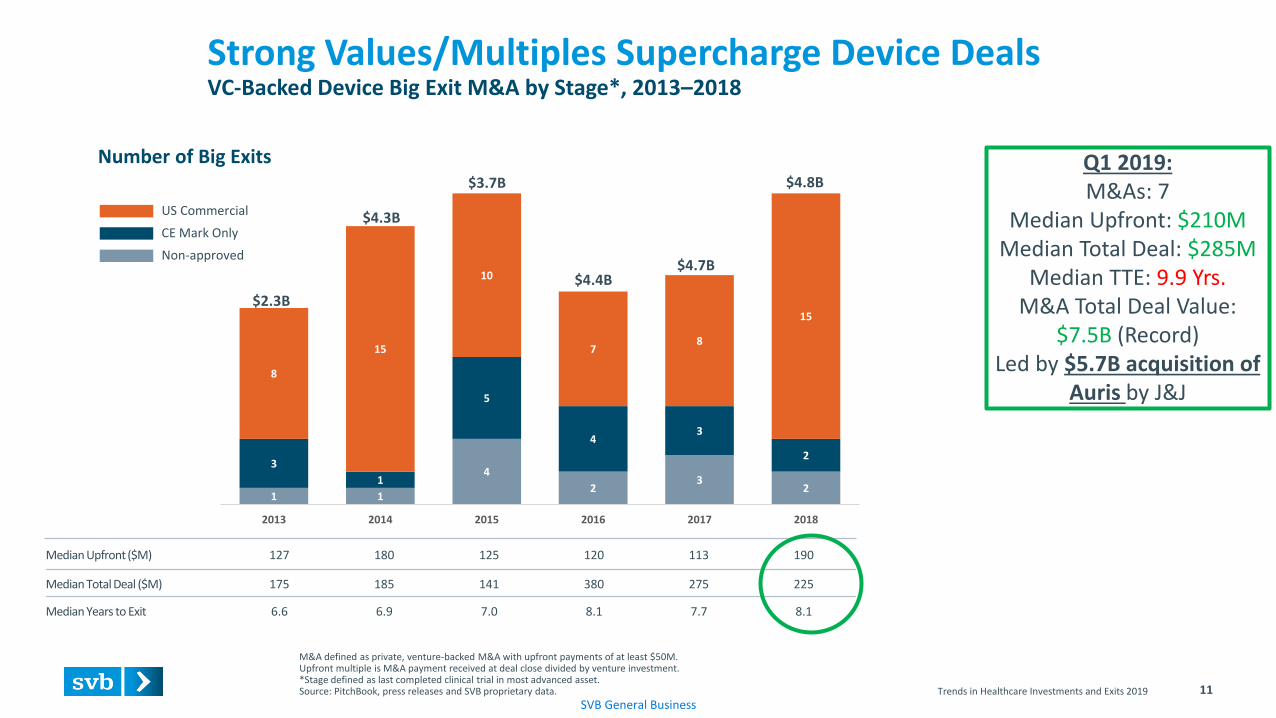
2013 2014 2015 2016 2017 2018
Median Upfront ($M) 127 180 125 120 113 190
Median Total Deal ($M) 175 185 141 380 275 225
Median Years to Exit 6.6 6.9 7.0 8.1 7.7 8.1
US Commercial
CE Mark Only
Non-approved
11
Strong Values/Multiples Supercharge Device DealsVC-Backed Device Big Exit M&A by Stage*, 2013–2018
M&A defined as private, venture-backed M&A with upfront payments of at least $50M. Upfront multiple is M&A payment received at deal close divided by venture investment. *Stage defined as last completed clinical trial in most advanced asset.Source: PitchBook, press releases and SVB proprietary data.
Number of Big Exits
Trends in Healthcare Investments and Exits 2019
$2.3B
$4.3B
$3.7B
$4.4B$4.7B
$4.8BQ1 2019:M&As: 7
Median Upfront: $210MMedian Total Deal: $285M
Median TTE: 9.9 Yrs.M&A Total Deal Value:
$7.5B (Record)Led by $5.7B acquisition of
Auris by J&J
SVB General BusinessTrends in Healthcare Investments and Exits Device Update 12
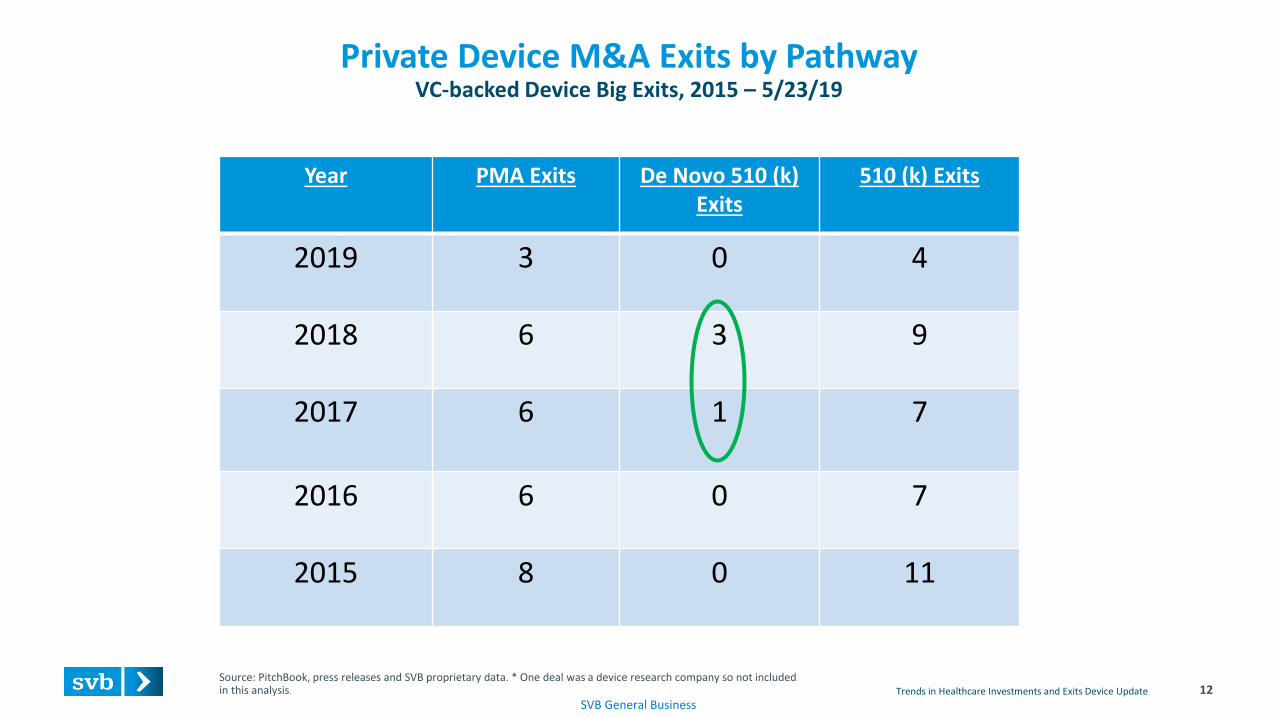
Private Device M&A Exits by Pathway VC-backed Device Big Exits, 2015 – 5/23/19
Year PMA Exits De Novo 510 (k) Exits
510 (k) Exits
2019 3 0 4
2018 6 3 9
2017 6 1 7
2016 6 0 7
2015 8 0 11
Source: PitchBook, press releases and SVB proprietary data. * One deal was a device research company so not included in this analysis.
SVB General Business
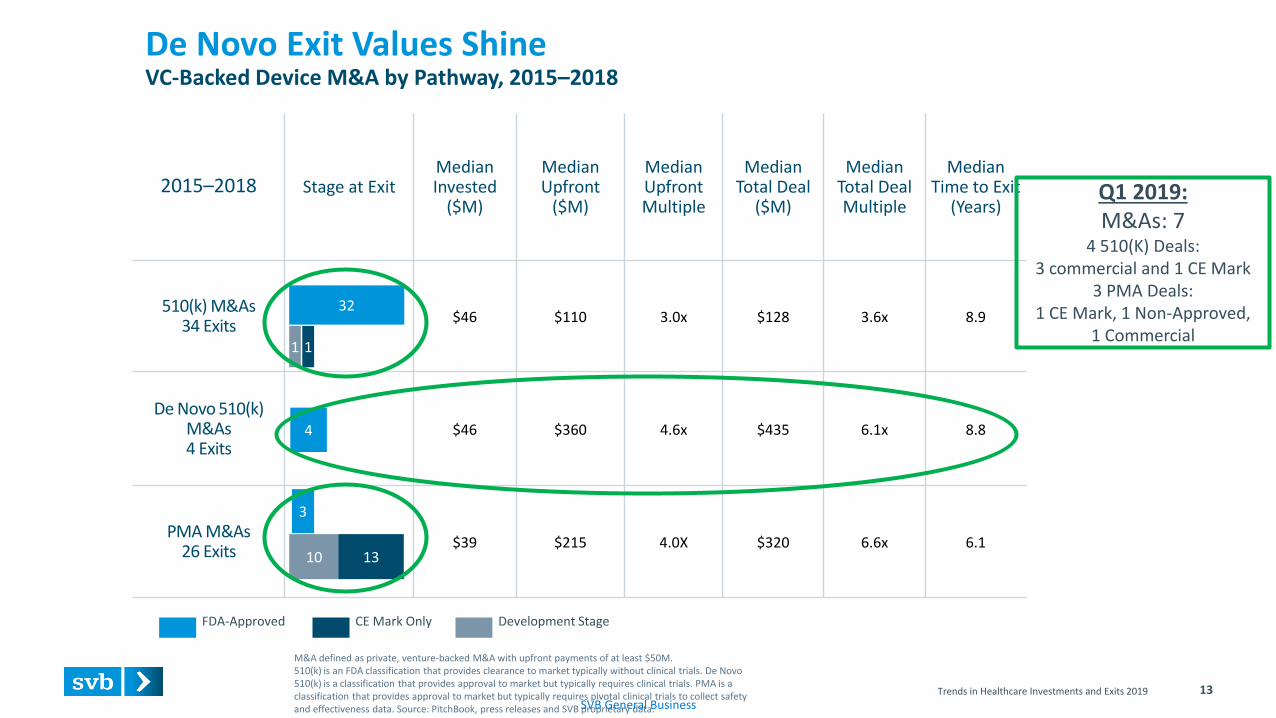
2015–2018 Stage at ExitMedianInvested
($M)
Median Upfront
($M)
MedianUpfrontMultiple
Median Total Deal
($M)
Median Total Deal Multiple
Median Time to Exit
(Years)
510(k) M&As34 Exits
$46 $110 3.0x $128 3.6x 8.9
De Novo 510(k) M&As4 Exits
$46 $360 4.6x $435 6.1x 8.8
PMA M&As26 Exits
$39 $215 4.0X $320 6.6x 6.1
Trends in Healthcare Investments and Exits 2019 13
De Novo Exit Values ShineVC-Backed Device M&A by Pathway, 2015–2018
1
4
32
1
Development StageCE Mark OnlyFDA-Approved
3
10 13
M&A defined as private, venture-backed M&A with upfront payments of at least $50M.510(k) is an FDA classification that provides clearance to market typically without clinical trials. De Novo 510(k) is a classification that provides approval to market but typically requires clinical trials. PMA is a classification that provides approval to market but typically requires pivotal clinical trials to collect safety and effectiveness data. Source: PitchBook, press releases and SVB proprietary data.
Q1 2019:M&As: 7
4 510(K) Deals: 3 commercial and 1 CE Mark
3 PMA Deals:1 CE Mark, 1 Non-Approved,
1 Commercial
Trends in Healthcare Investments and Exits Device Update 14
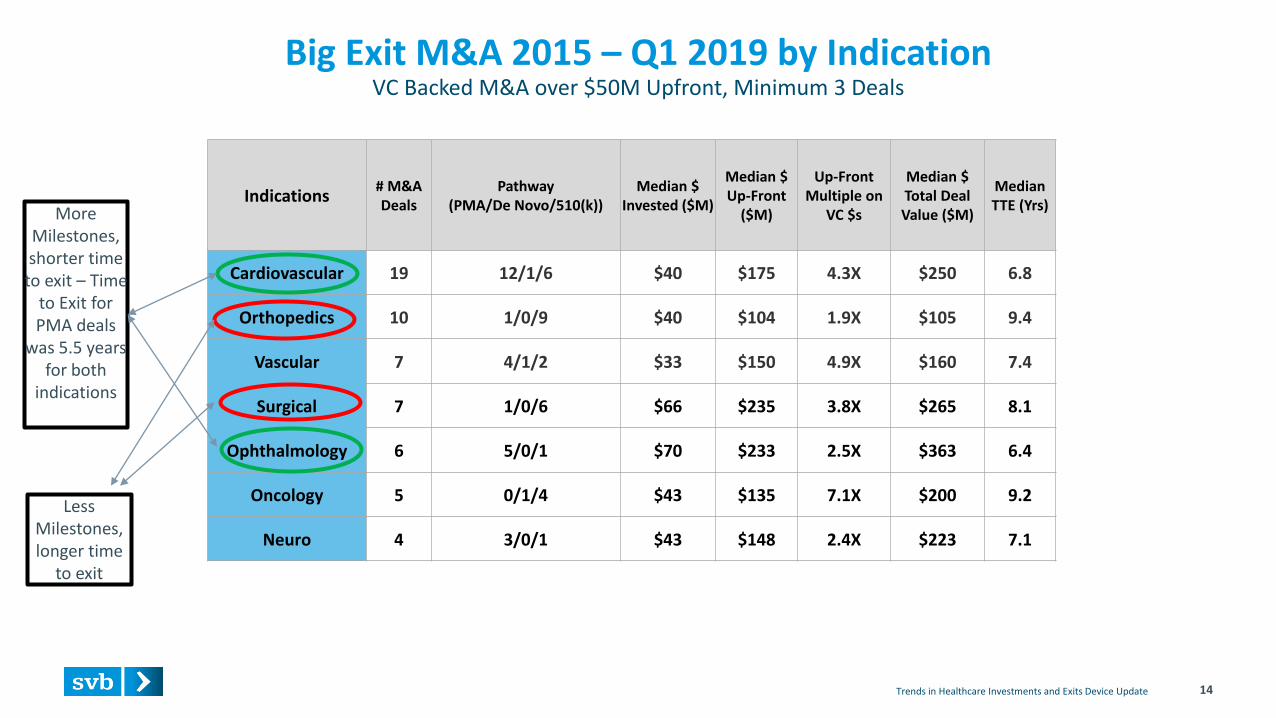
Big Exit M&A 2015 – Q1 2019 by IndicationVC Backed M&A over $50M Upfront, Minimum 3 Deals
Indications# M&A Deals
Pathway (PMA/De Novo/510(k))
Median $Invested ($M)
Median $ Up-Front
($M)
Up-Front Multiple on
VC $s
Median $ Total Deal Value ($M)
Median TTE (Yrs)
Cardiovascular 19 12/1/6 $40 $175 4.3X $250 6.8
Orthopedics 10 1/0/9 $40 $104 1.9X $105 9.4
Vascular 7 4/1/2 $33 $150 4.9X $160 7.4
Surgical 7 1/0/6 $66 $235 3.8X $265 8.1
Ophthalmology 6 5/0/1 $70 $233 2.5X $363 6.4
Oncology 5 0/1/4 $43 $135 7.1X $200 9.2
Neuro 4 3/0/1 $43 $148 2.4X $223 7.1
Less Milestones, longer time
to exit
More Milestones, shorter time
to exit – Time to Exit for PMA deals
was 5.5 years for both
indications
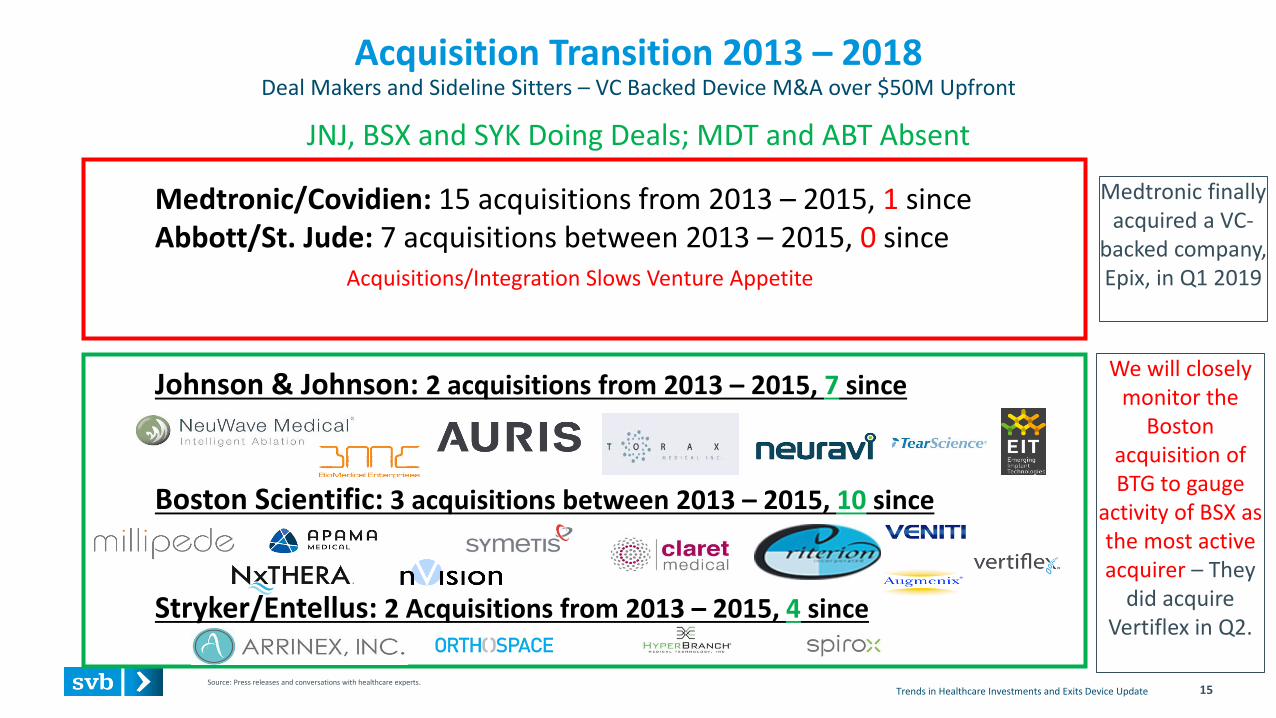
Medtronic/Covidien: 15 acquisitions from 2013 – 2015, 1 sinceAbbott/St. Jude: 7 acquisitions between 2013 – 2015, 0 since
Acquisitions/Integration Slows Venture Appetite
Johnson & Johnson: 2 acquisitions from 2013 – 2015, 7 since
Boston Scientific: 3 acquisitions between 2013 – 2015, 10 since
Stryker/Entellus: 2 Acquisitions from 2013 – 2015, 4 since
Trends in Healthcare Investments and Exits Device Update 15
Acquisition Transition 2013 – 2018Deal Makers and Sideline Sitters – VC Backed Device M&A over $50M Upfront
JNJ, BSX and SYK Doing Deals; MDT and ABT Absent
Source: Press releases and conversations with healthcare experts.
Medtronic finally acquired a VC-
backed company, Epix, in Q1 2019
We will closely monitor the
Boston acquisition of BTG to gauge
activity of BSX as the most active acquirer – They
did acquire Vertiflex in Q2.
SVB General Business
See complete disclaimers on previous page.
©2019 SVB Financial Group. All rights reserved. SVB, SVB FINANCIAL GROUP, SILICON VALLEY BANK, MAKE NEXT HAPPEN NOW and the chevron device are trademarks of SVB Financial Group, used under license. Silicon Valley Bank is a member of the FDIC and the Federal Reserve System. Silicon Valley Bank is the California bank subsidiary of SVB Financial Group (Nasdaq: SIVB).
About Silicon Valley BankFor more than 35 years, Silicon Valley Bank has helped innovative companies and their investors move bold ideas forward, fast. SVB provides targeted financial services and expertise through its offices in innovation centers around the world. With commercial, international and private banking services, SVB helps address the unique needs of innovators.
#SVBHealthcare
www.svb.com
@SVB_Financial
Silicon Valley Bank
@SVBFinancialGroup


![Trends in Healthcare Investments and Exits 2018...Sep 30, 2017 · [B]: Non-invasive monitoring, orthopedic and neuro companies made up 68% of all Series A funding over the past two](https://img.pdfslide.us/doc/110x75/5f83d011bac08b18f36030df/trends-in-healthcare-investments-and-exits-sep-30-2017-b-non-invasive.jpg)