Embed Size (px)
Citation preview

- 4 0 -
Trends in fínancial market volatility in the G-7 countries
John E. Morton1
Introduction
Several prominent financial market episodes of recent years have involved volatile movements of financial variables, including the ERM crises of 1992 and 1993, the widespread and sharp drop in bond prices in 1994, and the wide swings in the foreign exchange value of the dollar, especially against the yen, this year. These developments have coincided with a greater international integration of financial markets, reflecting further deregulation, advances in computer and communications technology, development of new financial instruments and techniques, such as swaps and options, and diversification of portfolio holdings across national borders. Some observers have suggested a causal link between these two sets of developments. The latest BIS Annual Report states:
"In the financial landscape which has been emerging over the past two decades, the likelihood of extreme price movements may well be greater ... It is now possible for market participants to trade larger amounts more frequently through more highly leveraged positions in a greater number of markets and across a larger set of national borders."2
In order to investigate the possible link between greater financial market integration and financial market volatility, this paper focuses on three questions. First, has there been a general increase in the volatility of financial market variables in recent years? Second, have the movements of financial variables recently become more synchronous, with fluctuations in different markets tending to coincide? Third, has the general decline in inflation in the industrial countries since the early 1980s tended to reduce financial market volatility? The paper concentrates on movements in long-term interest rates, stock market prices, and exchange rates in the G-7 countries over the past 25 years. The evidence presented suggests that, while financial market variables in different countries have shown a tendency to move more closely together in recent years, there has not been any general increase in the volatility of financial market fluctuations. In addition, there is only limited evidence that the general reduction in inflation since 1980 has significantly depressed the volatility of movements in financial variables, although it appears that, at any moment in time, countries with relatively high inflation and/or budget deficit rates tend to have relatively more volatile financial markets.
The paper proceeds as follows. Section 1 discusses some of the possible ways that greater international integration of financial markets might affect financial market volatility. Section 2 presents evidence on trends in the variability of major financial variables in the G-7 countries over the last 25 years, along with changes in the degree to which financial variables in different countries tend to move together. Section 3 investigates the relationship between inflation and government budget deficits and financial market volatility.
1 The author is a Senior Economist in the Division of International Finance, Board of Governors of the Federal Reserve System. Helpful comments were received from Ralph Smith, Linda Kole, Michael Leahy, David Bowman and Neil Ericsson. Kris Huennekens provided exemplary research assistance. The views expressed in this paper are those of the author and should not be attributed to the Federal Reserve System.
2 Bank for International Settlements, 65th Annual Report, June 1995, p. 116.

- 4 1 -
1. Volatility and the international integration of fínancial markets
A move to greater international diversification of asset holdings and increased cross-border flows of capital might or might not be expected to increase financial market volatility, depending on a number of factors, in particular, the relative asset preferences of investors in different countries and the sources of financial market shocks. Consider a "home" country in which domestic investors hold no foreign assets. Suppose that there is a financial market shock in the home country, for example, a decline in expected dividends. This should lead to a decline in stock market prices in the home country. Now assume, alternatively, that when the shock takes place domestic investors own foreign assets. Assuming for the moment that there is no shock abroad, so that expected dividends on foreign stocks remain unchanged, there should be some switch in demand from domestic to foreign equities, leading to a somewhat greater decline in domestic equity prices - in this sense, greater volatility - than in the case where there were no foreign stock holdings. The shift in demand towards foreign stocks should cause a rise in foreign stock prices.
Next assume that there is a simultaneous shock to dividend expectations in the foreign country. If this shock takes the form of an increase in expected dividends, this will tend to reinforce the effects on stock prices in both countries from the original home-country shock, further lowering stock prices in the home country and further raising stock prices in the foreign country. If, alternatively, the foreign country experiences the same type of shock as the home country, i.e. a lowering of expected dividends, this would tend to moderate the stock price movements generated by the home country shock, reducing the decline in home country stock prices and the rise in foreign country stock prices. Indeed, if the drop in expected dividends in the foreign country were sufficiently large and home and foreign-country stocks were sufficiently close substitutes, there might be a net rise in home country stock prices, despite the decline in home country expected dividends.
The potential outcomes expand even further when the possibility of differing asset preferences and investor behavior in the different countries is considered. Suppose, for example, that home-country investors consider foreign assets inherently risky, and become especially concerned about this risk when there is a general heightening of uncertainty, associated, for example, with a general fall in asset prices. In this case, a decline in expected dividends in both the home and the foreign countries might lead home-country investors to switch demand out of foreign stocks and into domestic stocks, moderating any decline in home-country stock prices but exacerbating downward pressure on foreign stock prices. In a world of many such "home" countries, a general downward shock to expected dividends might lead to relatively larger stock price declines - and, in this sense, greater volatility - in countries where foreign investment in their domestic markets was most pronounced. In some sense the opposite case would be a situation where home-country investors had an inherent distrust of domestic assets. In this case, a general downward shock to expected returns at home and abroad might lead to "capital flight" and an intensification of downward pressure on domestic asset prices as home-country investors attempted to switch into foreign assets.
A further complication arises from the fact that the "shocks" causing financial market variability often take the form of changes in macroeconomic policies, and these policies can be influenced in a variety of ways by the degree of openness and interconnectedness of financial markets. The ERM crises of 1992 and 1993 have often been portrayed as resulting in large part from the greater potential for capital to flow across borders. In this view, these large flows made it impossible for countries such as the United Kingdom to maintain relatively fixed exchange rates with their ERM partners because of the unacceptably large changes in short-term interest rates and/or exchange market intervention that would have been required. The result was a greater fluctuation of exchange rates -more volatility. However, the European experience of recent years with respect to financial market integration could be interpreted quite differently. The greater openness and interconnectedness of markets - particularly financial markets - in Europe appears to have raised both the difficulty and opportunity cost of individual European countries maintaining independent macroeconomic policies, particularly monetary policies. It could be argued that this has led countries to tie their monetary policies more closely to each other. Furthermore, this pressure has not been symmetrical. Exchange

- 4 2 -
market pressures have normally compelled smaller, higher inflation countries to align their polices with larger, lower inflation Germany, thus possibly contributing to a more stable and less volatile financial environment in Europe. It might be argued that a similar process, in a much earlier stage, is under way in North America, with a number of Latin American countries with historically relatively high inflation rates and volatile financial markets being compelled or induced to bring their macroeconomic policies more in line with those of the lower inflation and more financially stable United States.
The above analysis, while by no means exhaustive, suggests that a trend toward greater internationalization of financial markets might plausibly influence financial market volatility in a number of ways, depending in a complicated manner on the nature and source of financial market shocks, private investors' preferences and behavior, and governments' macroeconomic policy reactions. While instances can be cited where greater financial market integration and the greater potential for capital to flows across borders has seemed to contribute to heightened financial market volatility, it would be dangerous to attempt to extrapolate an overall influence from this anecdotal evidence.
2. Historical trends in fínancial market volatility
There are several possible ways to measure financial market volatility or variability. One way is to focus on short-run fluctuations, as measured by average day-to-day, week-to-week, or month-to-month changes over some period. Alternatively, it is possible to look at longer-run deviations from some base or equilibrium value. Either measure of volatility might be of interest, with their likely impacts and possible costs differing. This paper focuses only on short-term volatility. More specifically, the main measure of volatility used is the standard deviation of weekly changes calculated over a period of one year.3 In order to put recent changes in volatility in a longer-term perspective, the standard deviations are calculated from 1971 to the present. The financial variables covered are dollar exchange rates, stock market prices, long-term and short-term interest rates, and the dollar price of gold. The country coverage is the G-7. This information is shown in Charts 1-5.
Chart 1 gives the variability of exchange rates of the dollar against the currencies of the other G-7 countries. Several periods appear notable for heightened volatility - the early 1970s, at the start of the floating rate period, and, for dollar exchange rates against European currencies, the early 1990s, a time of turbulence within the EMS. Volatility has increased this year for each of the dollar exchange rates, but is at historically high levels only for the US dollar/yen rate. There appears to be a slight rising trend in volatility over the whole period for each of the series. This is confirmed by fitting time trends; the trends are significantly positive at the 5% level for each of the dollar exchange rate series.4 However, these trends do not appear to be very pronounced, and there are substantial year-to-year variations. In addition, there does not appear to have been any tendency for exchange rate volatility to have risen in recent years; dummy variables for the period of the 1990s are all negative, although not significantly so.
3 The weekly observations are for the last day of the week, rather than weekly averages. Using day-to-day changes or month-to-month changes (measuring from the end of the month to the end of the month) appears to yield quite similar patterns of overall movements. For example, for the US dollar/Deutsche Mark exchange rate, calculating yearly standard deviations over the period 1971-95, the series using weekly data has a correlation coefficient of 0.84 with the series using monthly data and a correlation of 0.95 with the series using daily data. As would be expected, the standard deviation series using monthly data is uniformly higher than the standard deviation series using weekly data, while the standard deviations series using daily data is uniformly below the weekly data series.
4 Looking just at the floating rate period, the evidence for significant upward time trends is slightly weaker. Eliminating observations for 1971 and 1972 and fitting time trends to the variability series over the period 1973-95, the time trend coefficients all remain positive, but the size of the t-statistics is reduced for four of the six series, and for two of the series - the US dollar/Italian lira and the US dollar/pound sterling - the t-statistics fall below the level needed for significance at the 5% level.

- 4 3 -
Chart 1
Variability of dollar exchange rates (standard deviations o f weekly percentage changes)
Percent
Annual
Germany J a p a n
— C a n a d a
X /
0 1971 1 9 7 5 1 9 7 9 1 9 8 3 1 9 8 7 1991 1 9 9 5
Percent
Annual
United Kingdom France Italy
J I I I I I I I i i ' J I L 1971 1 9 7 5 1 9 7 9 1 9 8 3 1 9 8 7 1991 1 9 9 5

- 4 4 -
Chart 2
Variability of stock prices in major industrial countries (standard deviations of weekly percentage changes)
Percent
Annual
United States Germany Japan Canada
/ / / A \ \
A
V
1971 1975 1979 1983 1987 1991 1995
Percent
Annual
United Kingdom
6
5
4
3
2
1
0
6
5
4
3
2
1
I I I I I I I I I I I I I I I I I I 1 1 1 1 1 1 o 1971 1 9 7 5 1979 1983 1987 1991 1995

- 4 5 -
Chart 3
Variability of long-term interest rates in major industrial countries (standard deviations of weekly percentage changes)
Percentage points
Annual
United States Germany Japan Canada
0.8
- 0 .6
0.4
0 .2
1975 1971 1979 1987 1991 1995 1983
Percentage points
Annual
United Kingdom France
— Italy 0.8
0.6
0.4
0 .2
1995 1987 1991 1971 1975 1979 1983
Note: The long-term interest rates used are 10-year government bonds or the closest available equivalent.

- 4 6 -
Chart 4
Variability of short-term interest rates in major industrial countries (standard deviations of weekly percentage changes)
Percentage points
Annual
United States Germany Japan Canada
0 .8
0 .6
0 .4
0 .2
0 1971 1975 1979 1987 1991 1983 1995
Percentage points
Annual
- United Kingdom • • France - Italy i 0 .8
0 .6
0 .4
0 . 2
1971 1991 1995 1975 1979 1987 1983

- 4 7 -
Chart 5
Variability of the dollar gold price (standard deviations of weekly changes)
Percent Percent 18
Annual
15
12
Variability 9
6
Average Inflation' 3
0 0 1971 1975 1979 1983 1987 1991 1995
Dispersion of inflation (standard deviations, yearly, for the G-7 countries)
Percent
\ Dispersion
\ A
\ / \ / \
A v . 7 \
\ / \ /
\ /
\ \ _ .
Average Inflation* \
J I I I I ' I ' L I I I I I L
Percent
1971 1975 1979 1983 1987
* Weighted-average CPI inflation in the G-7 countries using 1980-85 GDP weights.
1991 1995

- 4 8 -
Chart 2 shows the variability of stock market prices in the G-7 countries over this period.5 The chart indicates that there was a general surge of variability in 1987. Variability has come down this year in all of the countries, in the United States declining to its lowest level over the whole period. There does not appear to be any general secular trend in volatility over the period. Fitting time trends to the series, only three are significantly different from zero at the 5% level, with uptrends for Germany and Japan and a downtrend for the United Kingdom. There is also no evidence of a rise in volatility in recent years, with dummy variables for the 1990s being insignificantly different from zero and about evenly split between positive and negative.
Chart 3 shows the variability of long-term interest rates in the G-7 countries since 1971.6
Bond yield variability for the United States and several other countries reached a peak at the beginning of the 1980s, when inflation also peaked and the Federal Reserve adopted a new operating procedure associated with much more variability of short-term interest rates. Long-term interest rate variability increased in 1994 in each of the countries, but only slightly and to levels that were generally low by historical standards. There is little evidence of a general upward trend in the series. Of the two time trends which are significantly different from zero, one is positive (Italy) and one is negative (the United Kingdom). Dummy variables for the 1990s are also generally insignificantly different from zero, the only exception being a significant downward shift in variability in the United States.
Chart 4 shows the variability of short-term interest rates over this period.7 As would be expected, the variability of short-term interest rates is almost always greater than the corresponding variability of long-term interest rates for each country. The most notable feature of the series is the marked upsurge in variability in the early 1980s in the United States and most other countries. There is again no general secular uptrend in variability. The only significant time trend variable shows a declining trend of variability in the United Kingdom. Several countries, including the United States, have significantly negative coefficients on dummy variables for the 1990s.
The top panel of Chart 5 shows the variability of the dollar price of gold since 1971. This series exhibits a clear downward trend in variability since the early 1980s, with variability this year being the lowest over the whole period.8 As can be seen, movements in gold price variability correspond quite closely with movements of average inflation in the G-7 countries, rising with surges in inflation in the 1970s and declining since then.9 As indicated in the bottom panel of the chart, as the average level of inflation in the G-7 countries has decreased in recent years, the dispersion of inflation rates among these countries has also come down.
On balance, the evidence from the standard deviation data just discussed suggests a negative conclusion - any influence on financial market volatility from the various developments related to the greater international integration of financial markets has not been strong enough to cause a significant general rise in volatility. While the various phenomena which can be grouped under the general rubric of greater international integration of financial markets are difficult to measure exactly, there appears to be a widespread feeling that this process has been increasing over time, with the pace of change probably accelerating in recent years. If greater international integration tended to push up financial market volatility - a proposition which the discussion in the previous section suggests is by no means self-evident - and if it was the dominant factor influencing financial market volatility, there
5 For several countries, data on stock market prices are available only back to 1976.
6 The interest rates used are ten-year bellwether government bond yields. Data for Japan are available only back to 1982 and for Italy only back to 1976. Ideally, information on the variability of bond prices, rather than bond yields, would be used. However, information needed to construct such price series could only be obtained for the most recent years.
7 Data for France and Italy are available only back to 1975, and for the United Kingdom there are no data for 1971 and 1972.
8 A time trend fitted to the series yields a negative coefficient that is significant at the 5% level.
9 The correlation between the two series is 0.85.

- 4 9 -
should be evidence of a rising secular trend in volatility, with this rise accelerating in recent years. In fact, the evidence just presented does not support this hypothesis. There has been no general uptrend in the volatility of fínancial market variables in the major industrial countries over the past 25 years, and volatility so far in the 1990s has, if anything, been somewhat lower than average. This does not, of course, mean that increased international integration has not, other things being equal, tended to raise financial market variability. Changes in other factors influencing financial market volatility may have acted to depress volatility recently, offsetting any upward pressure on volatility arising from greater international integration.10
Whatever its impact on financial market volatility, greater international integration of financial markets might be expected to cause movements of financial variables to become more synchronous across countries. There might be two types of pressure for such a change. First, a shock affecting financial markets in one country might be expected to have a relatively greater impact on financial variables in another country - a greater spillover effect - the more closely financial markets in the two countries are integrated. Second, to the extent that greater international integration of markets induces macroeconomic policy-makers to more closely coordinate their policies, some of the financial shocks which trigger volatility should become more synchronous.
Table 1
Correlations between weekly basis point changes in long-term interest rates in the G-7 countries
(a) 1972-95
Germany Japan Italy United
Kingdom France Canada
United States
Germany 1.00 0.34 0.19 0.26 0.32 0.24 0.34 Japan 1.00 0.06 0.19 0.19 0.20 0.23 Italy 1.00 0.09 0.04 0.04 0.01 United Kingdom 1.00 0.22 0.17 0.12 France 1.00 0.12 0.11 Canada 1.00 0.46 United States 1.00
(b) 1990-95
Germany Japan Italy United
Kingdom France Canada
United States
Germany 1.00 0.31 0.36 0.57 0.81 0.29 0.39 Japan 1.00 0.08 0.28 0.24 0.27 0.32 Italy 1.00 0.38 0.45 0.11 0.10 United Kingdom 1.00 0.63 0.30 0.37 France 1.00 0.27 0.42 Canada 1.00 0.53 United States 1.00
10 This possibility is discussed more fully in Section 3.

- 5 0 -
Some evidence in this regard is presented in Tables 1-6. For long-term interest rates, stock market prices and dollar exchange rates, the tables show correlations among the G-7 countries of week-to-week changes (Tables 1-3) and volatilities (Tables 4-6) over the whole period since 1972 and just in the 1990s. This evidence suggests that on balance there has been an increased tendency for long-term interest rates and stock prices to both move more closely together and experience periods of increased or reduced volatility at the same time. The evidence for exchange rate changes is more mixed.
Table 1 shows correlations between week-to-week changes in long-term interest rates in the G-7 counties. The top panel shows average correlations over the whole period since 1972 and the bottom panel shows average correlations during the 1990s. As indicated in the upper panel, for the whole period, all of the 21 cross-country correlations are positive, suggesting a general tendency for long-term interest rates in the G-7 countries to move together. Some of the correlations are barely positive, while the highest (for the United States and Canada) is just under 0.5. The average correlation is 0.19. A comparison of the top panel with the bottom panel, showing correlations in the 1990s only, shows a general increase in correlations in the more recent period. Of the 21 correlations, 20 show an increase in the 1990s, and the average correlation rises to 0.36.
Table 2, showing correlations between week-to-week changes in stock prices, shows a similar but less pronounced pattern. Again, all of the whole-period correlations are positive, with an average value of 0.31, higher than the corresponding average correlation for long-term interest rates. For the 1990s, 19 of the 21 individual correlations increase, with the average rising to 0.41.
Table 2
Correlations between weekly percentage changes in stock market indices in the G-7 countries
(a) 1972-95
Germany Japan Italy United
Kingdom France Canada
United States
Germany 1.00 0.26 0.28 0.33 0.41 0.30 0.36 Japan 1.00 0.20 0.21 0.24 0.26 0.31 Italy 1.00 0.24 0.27 0.19 0.20 United Kingdom 1.00 0.33 0.38 0.42 France 1.00 0.29 0.37 Canada 1.00 0.71 United States 1.00
(b) 1990-95
Germany Japan Italy United
Kingdom France Canada
United States
Germany 1.00 0.22 0.50 0.54 0.70 0.40 0.49 Japan 1.00 0.26 0.25 0.26 0.29 0.31 Italy 1.00 0.35 0.53 0.22 0.28 United Kingdom 1.00 0.57 0.41 0.52 France 1.00 0.37 0.48 Canada 1.00 0.68 United States 1.00
- 51 -
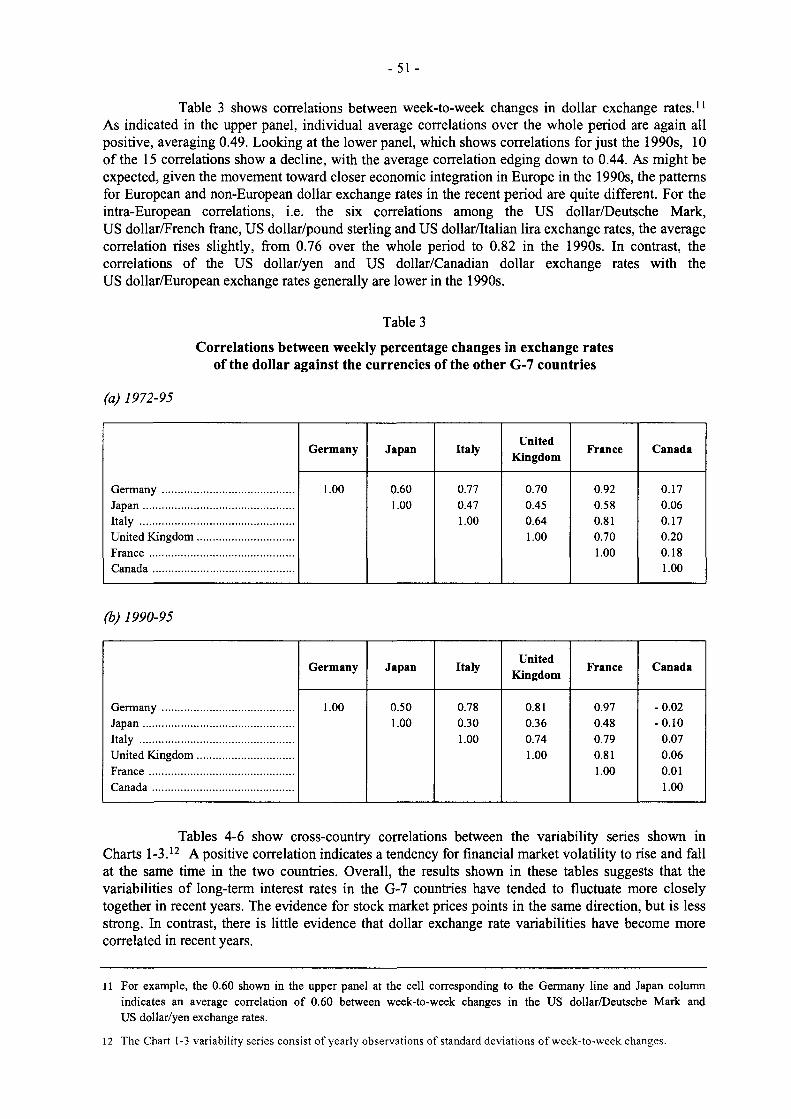
Table 3 shows correlations between week-to-week changes in dollar exchange rates.11
As indicated in the upper panel, individual average correlations over the whole period are again all positive, averaging 0.49. Looking at the lower panel, which shows correlations for just the 1990s, 10 of the 15 correlations show a decline, with the average correlation edging down to 0.44. As might be expected, given the movement toward closer economic integration in Europe in the 1990s, the patterns for European and non-European dollar exchange rates in the recent period are quite different. For the intra-European correlations, i.e. the six correlations among the US dollar/Deutsche Mark, US dollar/French franc, US dollar/pound sterling and US dollar/Italian lira exchange rates, the average correlation rises slightly, from 0.76 over the whole period to 0.82 in the 1990s. In contrast, the correlations of the US dollar/yen and US dollar/Canadian dollar exchange rates with the US dollar/European exchange rates generally are lower in the 1990s.
Table 3
Correlations between weekly percentage changes in exchange rates of the dollar against the currencies of the other G-7 countries
(a) 1972-95
United Germany Japan Italy
Kingdom France Canada
Germany 1.00 0.60 0.77 0.70 0.92 0.17 Japan 1.00 0.47 0.45 0.58 0.06 Italy 1.00 0.64 0.81 0.17 United Kingdom 1.00 0.70 0.20 France 1.00 0.18 Canada 1.00
(b) 1990-95
United Germany Japan Italy
Kingdom France Canada
Germany 1.00 0.50 0.78 0.81 0.97 -0.02 Japan 1.00 0.30 0.36 0.48 -0 .10 Italy 1.00 0.74 0.79 0.07 United Kingdom 1.00 0.81 0.06 France 1.00 0.01 Canada 1.00
Tables 4-6 show cross-country correlations between the variability series shown in Charts 1-3.12 A positive correlation indicates a tendency for financial market volatility to rise and fall at the same time in the two countries. Overall, the results shown in these tables suggests that the variabilities of long-term interest rates in the G-7 countries have tended to fluctuate more closely together in recent years. The evidence for stock market prices points in the same direction, but is less strong. In contrast, there is little evidence that dollar exchange rate variabilities have become more correlated in recent years.
11 For example, the 0.60 shown in the upper panel at the cell corresponding to the Germany line and Japan column indicates an average correlation of 0.60 between week-to-week changes in the US dollar/Deutsche Mark and US dollar/yen exchange rates.
12 The Chart 1-3 variability series consist of yearly observations of standard deviations of week-to-week changes.

- 5 2 -
Table 4
Correlations between variability of long-term interest rate changes in the G-7 countries
(a) 1972-95
Germany Japan Italy United
Kingdom France Canada
United States
Germany 1.00 0.26 0.32 0.05 0.35 0.62 0.55 Japan 1.00 0.38 0.23 0.43 0.34 0.27 Italy 1.00 -0.31 0.08 0.34 0.06 United Kingdom 1.00 0.25 0.11 0.13 France 1.00 0.43 0.43 Canada 1.00 0.87 United States 1.00
(b) 1990-95
Germany Japan Italy United
Kingdom France Canada
United States
Germany 1.00 0.64 0.08 0.83 0.93 0.86 0.92 Japan 1.00 0.16 0.39 0.45 0.65 0.48 Italy 1.00 0.22 0.31 0.16 -0.14 United Kingdom 1.00 0.83 0.94 0.90 France 1.00 0.75 0.82 Canada 1.00 0.89 United States 1.00
Note: Variability is measured by the standard deviation each year of weekly basis point changes in long-term rates.
As shown in the top panel of Table 4, for long-term interest rates, all but one of the 21 correlations of variabilities between countries over the whole period are positive; the average correlation is 0.29. A comparison of the top and bottom panels reveals a general rise in these correlations in the 1990s, with 17 of the 21 correlations increasing and the average doubling to 0.58. A similar, but less pronounced, pattern is shown for correlations between stock price volatilities in Table 5. For the whole period, all but two of the correlations are positive, with the average being 0.27. For the 1990s, slightly over half of the correlations increase, with the average edging up to 0.34. The top panel of Table 6 shows that the correlations between volatilities of dollar exchange rates are all positive for the whole period and average 0.49. During the 1990s, this average correlation drops to 0.28, with most of the individual correlations showing declines. As was the case for the correlations between changes in exchange rates shown in Table 3, the situation in the 1990s is quite different for the European and non-European dollar exchange rates. Each of the six correlations among the US dollar/European exchange rate variabilities rises in the 1990s, with the average correlation increasing to 0.75 from 0.66 for the whole period.
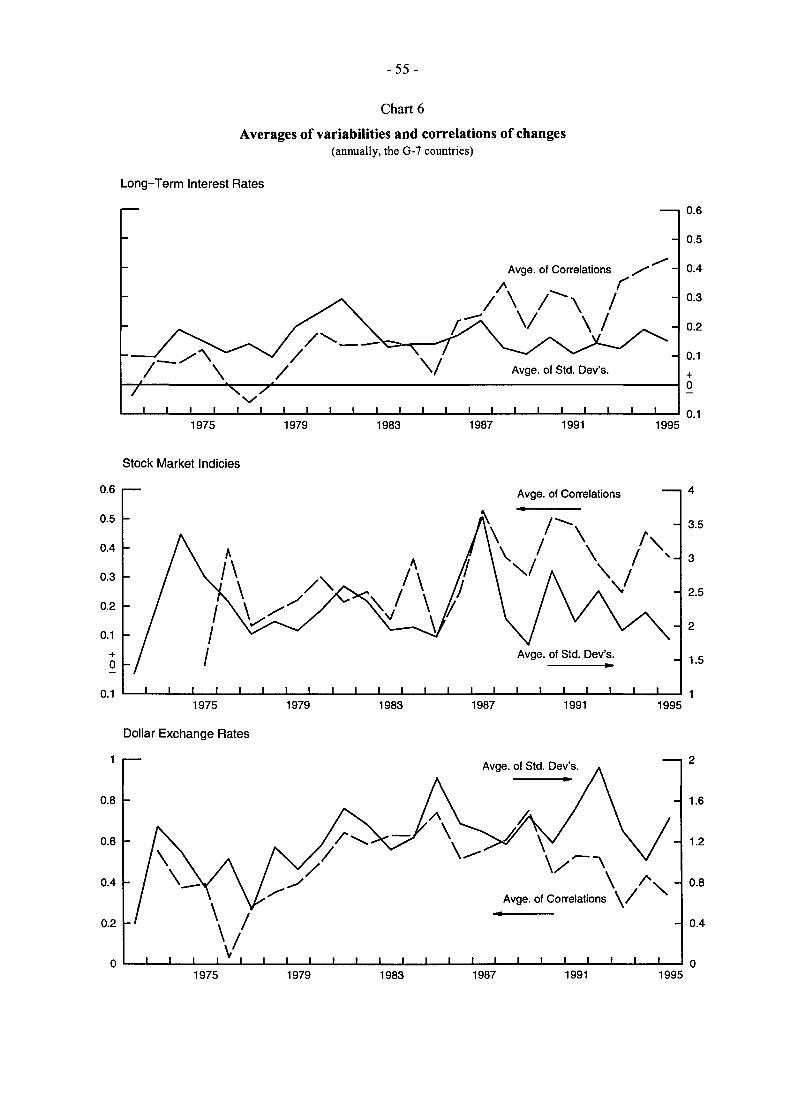
Chart 6 provides a summary description of some of the main findings of this section. The three panels show data for long-term interest rates (the top panel), stock prices (the middle panel), and dollar exchange rates (the bottom panel). The solid lines in each panel give the (unweighted) average among the G-7 countries of yearly variability, as measured by the standard deviation of weekly

- 5 3 -
changes during that year.13 As discussed previously, there is no evidence of a rising secular trend in the variability of either long-term interest rates or stock prices, but there is some uptrend in the average variability of dollar exchange rates. The dashed lines show the (unweighted) average each year of the cross-correlations among the G-7 countries of weekly changes.14 These average correlations are almost all positive, the only exception being a dip below zero in the late 1970s for long-term interest rates. For long-term interest rates and stock prices, average correlations are somewhat higher in recent years than earlier in the period, a reversal of the pattern for dollar exchange rates, where correlations on average have declined in recent years.
It has sometimes been asserted that at times of heightened fínancial market volatility there has been an increased tendency for financial market variables in different countries to move more closely together. If this were so, the solid and dashed lines in Chart 6 would be expected to move together. The chart suggests that there is some tendency in this direction, but that the relationship is not strong or consistent. The correlations between the variability series and correlations of changes series are higher for long-term interest rates and dollar exchange rates (0.51 and 0.53 respectively) than for stock prices (0.15). During episodes of extreme volatility - for example, 1979-82 for long-term interest rates and 1987 for stock prices - movements of financial market variables appears to become markedly more synchronous between countries.
Table 5
Correlations between variability of stock price changes in the G-7 countries
(a) 1972-95
Germany Japan Italy United
Kingdom France Canada United
States
Germany 1.00 0.68 0.04 -0.03 0.59 0.13 0.38 Japan 1.00 0.08 0.05 0.27 -0.03 0.10 Italy 1.00 0.20 0.42 0.24 0.18 United Kingdom 1.00 0.15 0.30 0.36 France 1.00 0.16 0.51 Canada 1.00 0.83 United States 1.00
(b) 1990-95
Germany Japan Italy United
Kingdom France Canada
United States
Germany 1.00 0.26 -0.04 0.31 0.97 0.54 0.67 Japan 1.00 0.06 0.62 0.24 -0.44 0.01 Italy 1.00 0.54 0.04 0.40 -0.17 United Kingdom 1.00 0.42 0.27 0.43 France 1.00 0.59 0.79 Canada 1.00 0.60 United States 1.00
Note: Variability is measured by the standard deviation each year of weekly percentage changes in stock price indices.
13 These lines thus average across countries the series shown in Charts 1-3.
14 These lines show, for each year, averages of the correlations shown in Tables 1-3 for longer periods.

- 5 4 -
Table 6
Correlations between variability of changes in the exchange rates of the dollar against the currencies of the other G-7 countries
(a) 1972-95
Italy United
Germany Japan Italy Kingdom
France Canada
Germany 1.00 0.59 0.58 0.59 0.94 0.10 Japan 1.00 0.12 0.19 0.51 0.32 Italy 1.00 0.82 0.71 0.50 United Kingdom 1.00 0.70 0.46 France 1.00 0.19 Canada 1.00
(b) 1990-95
United Germany Japan Italy
Kingdom France Canada
Germany 1.00 -0.11 0.81 0.75 0.99 -0.08 Japan 1.00 -0.51 -0.47 -0.24 0.41 Italy 1.00 0.95 0.87 0.11 United Kingdom 1.00 0.81 0.05 France 1.00 -0.11 Canada 1.00
Note: Variability is measured by the standard deviation each year of weekly percentage changes in dollar exchange rates.
3. Financial market volatility and macroeconomic imbalances
As pointed out in the last section, a number of factors other than the growing degree of international integration of financial markets could have influenced changes in financial market volatility in recent years. In general, the volatility of financial variables would be expected to be related to the volatility of the underlying determinants of these variables, with, for example, long-term interest rate volatility being influenced by short-term interest rate fluctuations, and stock price volatility varying with shifts in dividend prospects.15 Unexpected changes in other macroeconomic variables have also been suggested as sources of financial market variability.16 This section investigates the possible impact on financial market volatility of two particular macroeconomic variables - inflation rates and government budget deficits. The tentative hypothesis is that higher inflation and/or larger budget deficits tend to increase economic uncertainty, thus tending to raise financial market variability. Some have suggested that a more stable macroeconomic environment -and lower inflation rates in particular - in the 1990s has been important in holding down financial
15 For a discussion of these issues, see Robert J. Shiller, Market Volatility, MIT Press, 1993, especially Sections 2 and 3 on stock and bond markets respectively.
16 See, for example, Peter Fortune, "An Assessment of Financial Market Volatility: Bills, Bonds, and Stocks", New England Economic Review, November/December 1989, pp. 14-28, and Nai-Fu Chen, Richard Roll and Stephen A. Ross, "Economic Forces and the Stock Market," Journal of Business, 1986, Vol. 59, No. 3, pp. 383-403.
- 55 -
Chart 6
Averages of variabilities and correlations of changes (annually, the G-7 countries)
Long-Term Interest R a t e s
0.6
0.5
0.4 Avge. of Correlations
0.3
0.2
0.1 Avge. of Std. Dev's.
0.1 1979 1987 1991 1975 1983 1995
Stock Market Indicies
0.6 Avge. of Correlations
0.5 3.5
0.4 \ _
0.3 2.5
0.2
0.1
Avge. of Std. Dev's.
0.1 1975 1979 1987 1991 1983 1995
Dollar Exchange Rates
Avge. of Std. Dev's.
0.8
0.6
0.4 \ / \ - 0.8 Avge. of Correlations \ /
- 0.4 0.2
1991 1995 1975 1979 1987 1983

- 5 6 -
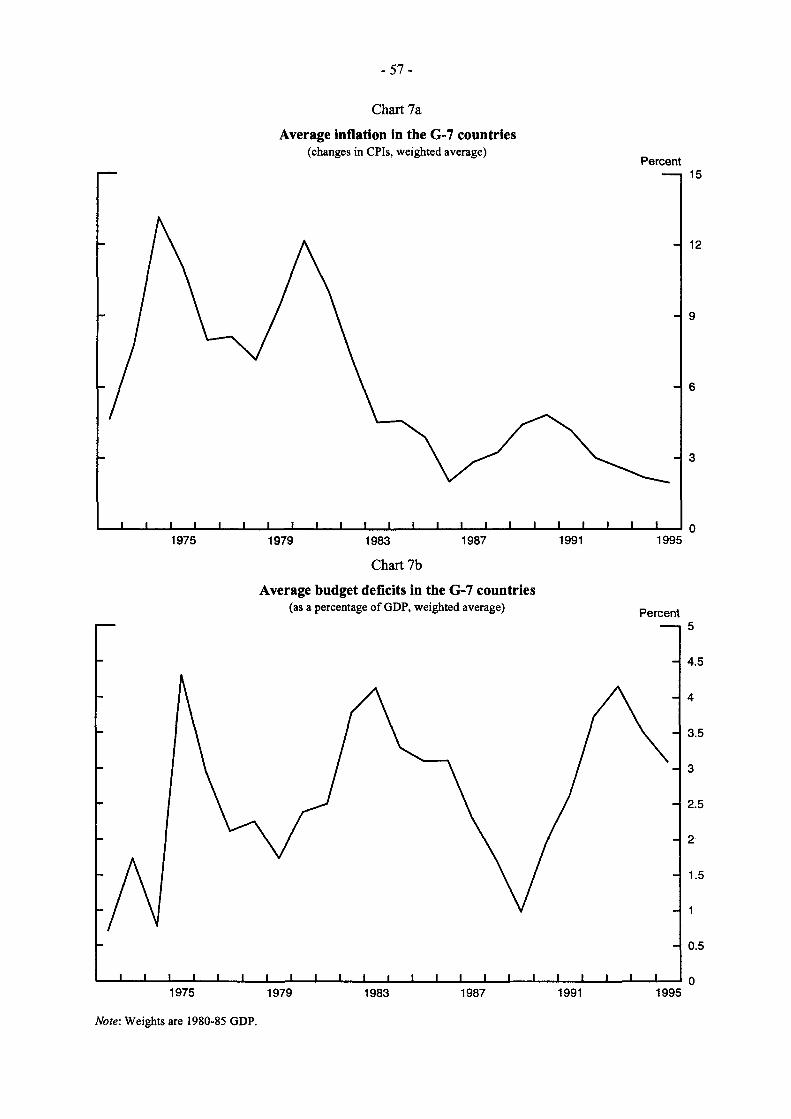
market volatility in recent years, offsetting any tendency of greater financial market integration to raise volatility. As shown in the top panel of Chart 7, on average inflation rates in the G-7 countries have been much lower since the mid-1980s than in the 1970s and earlier in the 1980s. Average government budget deficits, shown in the bottom panel of the chart, have shown no such trend, with average deficit levels actually increasing on balance during the 1990s.
There are several ways to test for a relationship between financial market variability and inflation and/or budget deficits. Cross-country data can be used to see if, at any moment in time, countries with relatively higher inflation rates or budget deficits tend to have relatively greater financial market variability. Time series data may also be used to see if, for any given country over time, increases or decreases in inflation or budget deficits tend to raise or lower financial market volatility. Finally, cross-country and time series data can be pooled. Results of each of these tests are reported below. In general it appears that, while there does seem to be a tendency for countries with relatively higher inflation rates, and - somewhat less clearly - budget deficits, to have relatively more volatile movements of long-term interest rates and stock prices, there is much less evidence of any systematic relationship within a given country between changes in inflation rates or budget deficits and financial market variability over time.17
Chart 8 shows correlations across the G-7 countries each year between inflation (the solid lines) or budget deficits (the dashed lines) and financial market variability. Correlations are given for long-term interest rates (the top panel), stock prices (the middle panel), and dollar exchange rates (the bottom panel).18 For long-term interest rates, the correlation series for both inflation and budget deficits are generally positive but quite variable from year to year, and, given the small size of the samples, seldom significantly different from zero. Correlations between long-term interest rate variability and both inflation and budget deficits have been quite high in the 1990s, and were quite low at the beginning of the 1980s, when inflation rates were on average high and interest rates - both short-term and long-term - were quite variable. Over the whole period, the average correlation between long-term interest rate variability and inflation is 0.45, while the corresponding average correlation for budget deficits is 0.27. The middle panel, displaying correlations involving stock price variability, again shows generally positive but quite unstable values. The correlations rose sharply in the early 1990s, but have dropped sharply this year. Over the whole period, the average correlation between stock price variability and inflation is 0.39, and that between stock price variability and budget deficits is 0.31. The bottom panel shows correlations involving dollar exchange rates. Here, the inflation rates and budget deficits are measured as the absolute values of differences between the United States and the appropriate foreign country - for example, the absolute value of differences between US and German inflation and budget deficits for the US dollar/Deutsche Mark rate. These correlations also fluctuate quite sharply from year to year. The average over the whole period of correlations between dollar exchange rate variability and inflation differences is 0.29, while the average exchange rate/budget deficit correlation is -0.04.
One reason that the correlations shown in Chart 8 exhibit such variability from year to year may be that market participants' views as to inflation or budget deficit risks in a particular country are formed only slowly over a relatively long period of time, and are thus fairly impervious to one year's change - even a large change - in actual inflation rates or budget deficits. Thus, France may
17 A similar pattern of cross-country and time series results are obtained when testing for a relationship between the level of long-term interest rates and government budget deficit levels, as discussed in David Bowman, Sean Craig, Dale Henderson, John Morton, Karen Johnson, Ralph Smith and Peter Hooper, "The Relationship between Interest Rates and Government Debt," Federal Reserve Board, December 1994.
18 The variability measures used are those shown in Charts 1-3, i.e. standard deviations of week-to-week changes calculated over a year.
- 5 7 -
Chart 7a
Average inflation in the G-7 countries (changes in CPIs, weighted average)
Percent
0 1995 1975 1991 1979 1987 1983
Chart 7b
Average budget deficits in the G-7 countries (as a percentage of GDP, weighted average)
4.5
3.5
2.5
0.5
1975 1979 1987 1991 1995 1983
Note: Weights are 1980-85 GDP.

- 5 8 -
Chart 8
Correlations between financial market variability, inflation and budget deficits in the G-7 countries
Long-Term Interest R a t e s Correlation
Inflation 0 .8
0 .6
0 .4
0 .2 j Budget Deficits
0.2
0 .4
0.6
0.8
1975 1979 1987 1983 1991 1995
Stock Market Indices Correlation
0.8 k Budget Deficits / \ i V Inflation
0 .6
0.4
0.2
0 .2
0.4
0.6
0.8
1979 1987 1991 1995 1975 1983
Dollar E x c h a n g e R a t e s Correlation
0 .8
0 .6 Inflation Rate
0 .4
0.2
0 .2
0.4 Budget Deficits 0.6
0 .8
1995 1979 1987 1991 1975 1983
Note: Variability is measured by standard deviations of weekly changes. Exchange rate variability is correlated with the absolute difference between US and foreign inflation and budget deficits.

- 5 9 -
well still be judged a relatively higher inflation risk country than Germany even if, as has happened recently, the French inflation rate temporarily falls below the German inflation rate.19
Some support for this hypothesis can be gained by looking at correlations calculated across countries between average financial market variability and inflation rates and budget deficits averaged over the whole period. These are almost uniformly substantially higher than the corresponding averages of the yearly correlations shown in Chart 8 - i.e. the correlation of the means is higher than the mean of the correlations. For example, the correlation among the G-7 countries between their average inflation rates over the past 24 years and their average variabilities of long-term interest rates over the past 24 years is 0.75, compared with 0.45 for the average of the 24 yearly correlations given by the solid line in the top panel of Chart 7. Similarly, the correlation of the averages over the whole period (with the average of the yearly correlations in parentheses) for long-term interest rates and budget deficits is 0.44 (0.27), for stock prices and inflation is 0.91 (0.39), and for stock prices and budget deficits is 0.85 (0.31).20 It appears that very long-run average inflation rates or budget deficits are better indicators of perceived risks - and actual financial market volatility -than are levels of inflation or budget deficit during a particular year.
Chart 9 shows scatter diagrams, based on yearly observations averaged over the whole period, with the variability of long-term interest rates (the top panels) or stock prices (the bottom panels) on the vertical axes and inflation (the left panels) or budget deficits (the right panels) on the horizontal axes.21 The chart shows an overall positive relationship between average variability and average inflation or budget deficits, with this relationship being somewhat stronger for inflation than for budget deficits and stronger for stock prices than for long-term interest rates. The chart also demonstrates the clustering of average inflation and - especially - budget deficit rates in a relatively narrow range for all of the G-7 countries except Italy and the United Kingdom, making it more difficult to detect an influence of these variables on financial market variability. There may be a kind of threshold effect in this relationship, such that countries with relatively wide differences in inflation rates exhibit significantly different financial market volatilities, while for relatively marginal differences in inflation there is no detectable differentiation in financial market volatility. Expanding the sample of countries beyond the G-7 to include countries with significantly higher inflation rates would probably significantly improve the tightness of fit in the scatter diagrams shown in Chart 9.22
In order to test for evidence of systematic relationships between changes in financial market variability and inflation rates or budget deficits over time, regressions were run for each of the G-7 countries using the time series of long-term interest rate, stock market price, or exchange rate variability as the dependent variable and the time series of inflation, budget deficits, or inflation and budget deficits as the independent variable or variables. The results provide little evidence of any consistent relationships between the variables; for long-term interest rate, stock price, and exchange rate equations, few of the coefficients on either the inflation or budget deficit variables were
19 An argument for such "sticky" expectations behavior with regard to inflation can be found in the recently released G-10 Deputies study, Savings, Investment and Real Interest Rates, October 1995, pp. 28-30.
20 The correlation across the G-7 countries between average inflation rates and average budget deficits is a high 0.86. This suggests that market participants may look at some countries, such as Italy, as relatively high overall macroeconomic risk countries, with expectations of relatively high inflation rates and budget deficits, and other countries, such as Germany, as relatively low overall macroeconomic risk countries, with relatively low expected inflation rates and budget deficits.
21 Scatter diagrams plotting the variability of dollar exchange rates against inflation rates or budget deficits show a lack of any relationship between the variables.
22 For example, over the 12 months between November 1994 and November 1995, when the Mexican inflation rate approached 50%, the standard deviation of week-to-week changes in the US dollar/peso exchange rate was about four times as large as the average comparable measure of volatility of dollar exchange rates against the other G-7 currencies.

- 6 0 -
Chart 9
Scatter diagrams of average financial market variabilities, average inflation and budget deficit rates
0.25 Variability
T
Long-term Interest Rates
U.K. 0.225
0.175
Canada o
France 0.125
Germany
0.075 8 10 12
Inflation R a t e s (%)
Variability I I I
— e U.K.
1
_ U.S. o — o Italy
— Canada —
® France
0 Japan
— « Germany
1 1 1 1 5 7 9 11 B u d g e t Defic i ts (% of G D P )
0.25
0.225
0.2
0.175
0.15
0.125
0.1
0.075
Stock Prices 3.25
Variability
2.75
2.5
2.25
1.75
1 1 1 1
Italy e y
' • U.K. _
France / e /
Japan /
- ® 5 / 0 u s - —
Germany / ^ C a n a d a
A 1 1 1 8 10 12
Inflation R a t e s (%)
Variability
1 1 I I
Italy
U.K.
—
« France / e /
Japan Germany
G' m / «r U.S. Canada
O 1 1 I 1
1 3 5 7 9 1
B u d g e t Def ic i ts ( % of G D P )
3.25
2.75
2.5
2.25
1.75

- 6 1 -
significantly different from zero, with about half being positive and half being negative. Also the R-squares on the fitted equations were uniformly quite low.23
Regressions using panel data, combining the cross-country and time series information, yielded somewhat mixed results. Panel data regressions were run using long-term interest rate variability or stock price variability as the dependent variable, and inflation and/or budget deficits as independent variables, along with dummy variables for the individual G-7 countries. For the long-term interest rate equation, the inflation variable had a positive coefficient significantly different from zero at the 5% level, while the budget deficit variable had an insignificant negative coefficient. For the stock price equation, the inflation variable was again positive, but this time insignificant, while the budget deficit variable was again negative, but this time significantly so at the 5% level.24
The results reported in this section, taken in their entirety, are not inconsistent with - but are not strongly supportive of - the view that lower overall inflation rates since the early 1980s may have tended to reduce the variability of movements in long-term interest rates and stock prices in thè G-7 countries.
23 Time trend variables were also included in these equations. These also had coefficients that were seldom significantly different from zero. The variability of short-term interest rates was also added as an independent variable in the long-term interest rate equations without significantly improving the results.
24 For both equations, the same general pattern of results was obtained using the inflation and budget deficit variables either separately or together in the same equation. Dummy variables for the 1990s were also added to each equation, yielding positive but non-significant coefficients.