Embed Size (px)
Citation preview
Trends in Emergency
Admissions in England
2004–2009
Ian Blunt, Martin Bardsley and Jennifer Dixon
Efficiency in healthcare
Trends in emergency admissions in England 2004–2009
1
Trends in emergency admissions in England 2004–2009 Ian Blunt, Martin Bardsley and Jennifer Dixon
Approximately 35 per cent of all hospital admissions in the NHS in England are classified as emergency admissions, costing about £11 billion a year. Emergency admissions are costly and frequently preventable yet every year more patients are being admitted in this way. This report examines the rise in emergency hospital admissions in England from 2004/05 to 2008/09 and tries to identify the possible explanations. Key points • The number of emergency admissions in England rose by 11.8 per cent over the five-year period
2004/05 to 2008/09 – a total of approximately 1.35 million extra admissions. • Older people are more likely to have an emergency admission. However, at most, 40 per cent of the
increased number of emergency admissions over the period under study can be explained by the effects of population aging.
• The rise in emergency admissions is not associated with any one particular type of illness or age group and levels of self-reported ill health do not appear to be rising.
• The increases have been associated with a large rise in short-stay admissions. The short length of stay of these additional admissions implies less severe cases are being admitted to hospital, which suggests that the clinical thresholds for acute admission have reduced. The number of admissions that end with the death of a patient has also reduced.
• Central policy initiatives and targets (such as the central target which mandates all patients are to be seen within four hours of arrival at A&E, the introduction of Payment by Results (PbR) as a new way of reimbursing hospitals for inpatient care, and the introduction of NHS foundation trusts) do not seem to have had an obvious effect in accelerating the rate of emergency admissions in England – though for some individual trusts an association with the A&E target is apparent.
• While the number of attendances at major (type 1) A&E units – the main source of emergency admissions to hospital – grew by 1.2 per cent between 2004/05 and 2008/09, the proportion admitted from these A&E units as emergencies over this period grew by 14.3 per cent – equivalent to 449,078 additional admissions in 2008/09.
• Within England there is a significant variation between NHS trusts – in some, emergency admissions declined by up to a third, while in others they almost doubled between 2004/05 and 2008/09.
• There is also a significant variation between primary care trusts (PCTs). Although admission rates are known to be higher in more deprived areas, there is no clear link between deprivation and the rise in emergency admissions.
The potential reasons for the rise can be roughly divided into ‘demand’ factors (such as England’s aging population) and ‘supply’ factors. Supply factors include: the financial incentives on hospitals to admit patients; policies to promote – and advances in clinical practice that allow – faster discharge from hospital, which increases the availability of beds; inadequate health and social care outside hospital; and the adequacy of clinical decisions to admit patients. Together these factors can create a cycle of rising
Trends in emergency admissions in England 2004–2009
2
admissions where more discharges have meant more admissions, and paradoxically greater efficiency (shorter days in hospital for each admitted patient) has probably led to more ‘inefficiency’ (greater number of avoidable emergency admissions). Of all the possible supply-side factors that are contributing to the increase, we suggest that the most significant is that advances in medical care and management have reduced the length of stay that admitted patients have in hospitals, which in turn has freed up more available beds and allows doctors to admit more patients. This cycle is reinforced when services across hospital, primary, community and social care providers are fragmented, which can lead to miscommunication delays in care and avoidable ill health and costs. Though recent policies such as PbR and the four-hour waiting target in A&E may together have exacerbated some of the problems, their impact is likely to be marginal relative to the longstanding underlying trend. Given the financial squeeze on the NHS, it is critical that future reforms should focus on how to reduce hospital care where it is preventable and avoidable. There are many different service innovations aimed at improving managing of demand and some can have short-term local impacts. However putting in place better out-of-hospital care and closing hospitals beds is unlikely to be enough – there needs to be a more fundamental reshaping and incentives in the health system towards robustly managed coordinated care. Policy-makers should: • Continue to scrutinise and reform the system for reimbursing hospitals and general practices for
care so that avoidable admissions are discouraged. This could mean the encouragement of risk-adjusted capitated payments to primary and hospital providers for each patient per year, with financial risk borne by the provider and savings from averted emergency admissions to be shared between both types of provider.
• Understand more fully the contribution of inadequate out-of-hospital care to the rise in admissions and what can be done to improve it. In particular pilot attempts to improve links between hospital care and out-of-hospital care providers (primary care, community services and social care) that promote more coordinated care.
• Craft financial incentives, or allow the local NHS to craft them, which encourage providers to keep people well so that admission is avoided and at the same time discourage admission to hospital unless absolutely necessary.
• Ensure that the definitions, data recording and reimbursement in this area adequately reflect emerging models of urgent care provision.
Regulators should:
• Develop ways of assessing the quality of care across different providers. • Consider using avoidable emergency admissions as an undesirable outcome measure to indicate
adequacy of coordinated care across providers. Local clinicians (including GPs as commissioners) and managers should:
Trends in emergency admissions in England 2004–2009
3
• Review how clinical decisions to admit patients to hospital are made and improve them, for example through greater use of primary care physicians in A&E and/or greater use of consultants to decide on admission, or not.
• Ensure that shorter stays for admitted patients, which free up beds available for care, are translated into reducing the number of hospital beds, rather than further lowering the threshold for hospital admission.
• Develop higher-quality out-of-hospital care for patients to reduce the need for emergency admissions, and in doing so create: more coordinated care between hospital and out-of-hospital settings, for example through clearer direction for patients to the most appropriate urgent care service; easier lines of communication between admitting clinicians; better management of care pathways between hospitals and general practices; shared information and peer reviews between providers on the use, cost and outcomes of care for individual patients.
• Work with patients to identify how they could be better supported to reduce the risk of ill health and admission. Identify the patients at high risk of future admission, using risk-stratification techniques,47 to target personalised support.
• Learn from NHS trusts where emergency admissions have declined, as well as from those where admissions have been far higher than the national average.
Without such change, future rises in emergency admissions – with all the avoidable human and financial cost they represent – are guaranteed.
Trends in emergency admissions in England 2004–2009
4
Contents
1. Introduction
Methods used in this analysis
2. Describing the national trends How have emergency admissions changed?
Has there been an increase in new patients or are we admitting the same patients more frequently? What are the estimated additional costs of the rise in admissions? Has the number of emergency bed-days increased? Has the case fatality rate changed?
What is the effect of changes in the population?
Increasing numbers of older people Differences by level of change in deprivation
Have there been changes in the type of case admitted? Changes in source of admission Changes in primary diagnostic codes Changes in case mix by treatment group
3. Differences at provider trust level? Do all trust types show the same changes? Do all trusts show a similar increase in short-stay emergency admissions? Are foundation trusts any different? Are changes linked to the use of A&E targets?
4. Differences between PCT area level? Five-year trend in number of admissions
Are changes greatest in areas with lower absolute admission rates? Do integrated care organisations behave any differently? A study of two areas
5. Discussion
References
Appendices
Trends in emergency admissions in England 2004–2009
5
1. Introduction Admitting a patient to hospital as an emergency is costly and frequently preventable, yet the number of emergency admissions to hospital has been known to be rising for some time.1, 2, 3, 4, 5, 6, 7 These admissions are just one part of a wide range of urgent and emergency care services in the NHS, including work by local GPs, out-of-hours care, minor injuries units, ambulance services and acute hospitals. This report focuses on emergency hospital admissions because they are undesirable, expensive, recorded in routine data and known to be increasing in number. The trend for rising emergency admissions could have profound implications, particularly heading into a period of constrained funding, and many commentators have expressed concern that, if it is allowed to continue, the rise ‘threatens the future of the NHS’. 1, 2, 8 It is therefore important that we fully understand the patterns of emergency care and that the driving factors behind it are explored. It is important to note that the data sets available to study and the techniques to analyse are improving all the time. Many reasons for the rise in emergency admissions have been proposed: • increased illness and frailty linked to an increasingly aging population2,8 • increased public expectations leading to more self-referral to NHS care3 9 • the effects of incentives in the NHS such as central targets and new ways of paying hospitals10,11 • changes in clinical decision-making and more ‘defensive’ medicine8,12 • increased ability to detect and treat illness3 • changes in data collection and recording13 • changes in care outside hospital such as general practice and social care.14,7,15,16 While these various causes have been proposed, the debate remains very much open.17 Table 1 summarises some of the more common reasons and the type of evidence linked with them.
Possible reason Evidence for Evidence against
Aging population Unplanned admissions increase with age
Living longer, but healthier longer
Public expectations Increased demand across health services
Objective thresholds for admission
More treatable illness Higher admission rates; falling mortality
Or an example of Roemer’s law that a hospital bed built is a hospital bed filled
Defensive medicine Increased litigation; anecdotal evidence
Central targets/Payment by Results
Gains to trusts from admission Rising trend pre-dates policy initiatives
Changes in other linked Situation with out-of-hours care; Extra alternative urgent care
Trends in emergency admissions in England 2004–2009
6
services 10%–30% admitted cases could be treated elsewhere
services launched
Over reliance on A&E for urgent care
Increased self-referrals to A&E Primary care interface with A&E to redirect
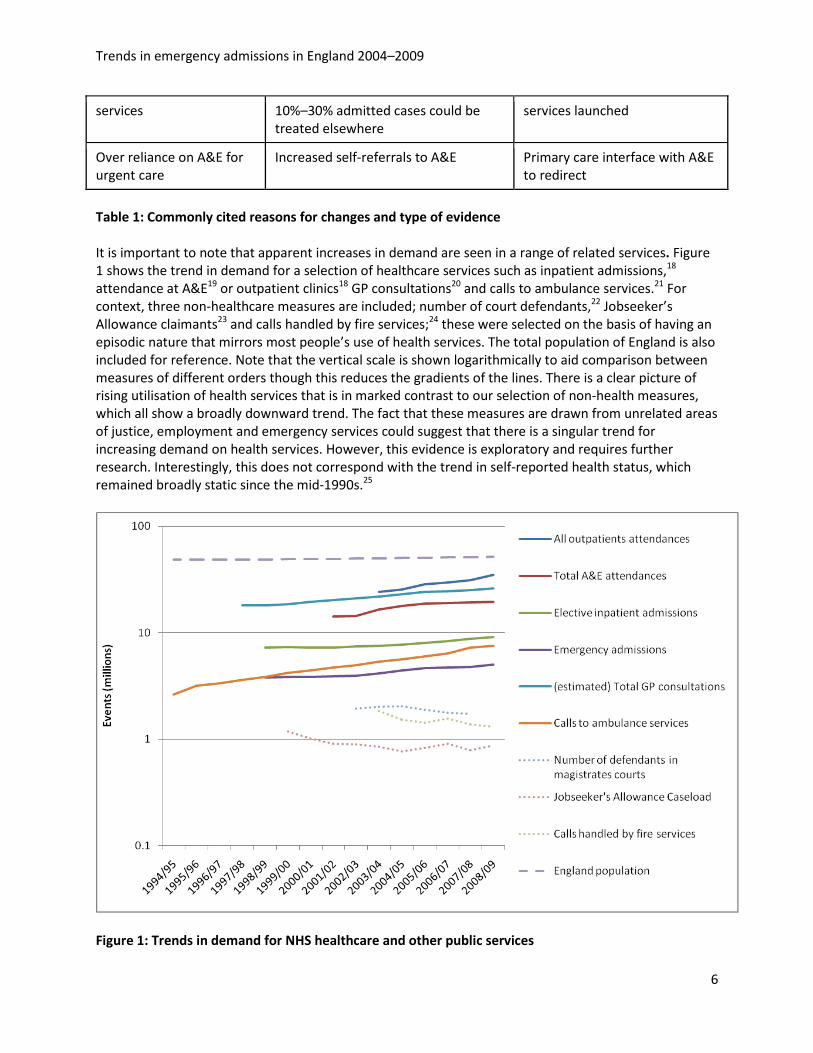
Table 1: Commonly cited reasons for changes and type of evidence It is important to note that apparent increases in demand are seen in a range of related services. Figure 1 shows the trend in demand for a selection of healthcare services such as inpatient admissions,18 attendance at A&E19 or outpatient clinics18 GP consultations20 and calls to ambulance services.21 For context, three non-healthcare measures are included; number of court defendants,22 Jobseeker’s Allowance claimants23 and calls handled by fire services;24 these were selected on the basis of having an episodic nature that mirrors most people’s use of health services. The total population of England is also included for reference. Note that the vertical scale is shown logarithmically to aid comparison between measures of different orders though this reduces the gradients of the lines. There is a clear picture of rising utilisation of health services that is in marked contrast to our selection of non-health measures, which all show a broadly downward trend. The fact that these measures are drawn from unrelated areas of justice, employment and emergency services could suggest that there is a singular trend for increasing demand on health services. However, this evidence is exploratory and requires further research. Interestingly, this does not correspond with the trend in self-reported health status, which remained broadly static since the mid-1990s.25
Figure 1: Trends in demand for NHS healthcare and other public services
Trends in emergency admissions in England 2004–2009
7
Several strategies have been proposed to address the rise in admissions, such as focusing on demand management in primary care,2,14 encouraging commissioners to challenge providers on the appropriateness of short-stay emergency admissions,26,27 considering integrated care structures2 and encouraging alternative responses to urgent situations.14,28,15,29 To encourage NHS organisations to shift care out of hospital settings and keep the number of emergency admissions to a minimum, the Department of Health has introduced a ‘marginal’ rate tariff for 2010/11 which will limit payments on emergency admissions in excess of the 2008/09 baseline activity to 30 per cent of the published tariff.30 This report explores recent trends in emergency admissions with a focus on change over the five-year period 2004/05 to 2008/09. Section 2 looks at the results on a national level and considers the characteristics of the emergency admissions. Sections 3 and 4 analyse the data at an organisational level and explore variations between trusts and PCTs. Our findings are summarised and discussed in Section 5. Methods used in this analysis Despite the rise in emergency admissions being widely acknowledged, much of the evidence that underpins the suggested causes is anecdotal. The aim of this work was to conduct a systematic quantitative analysis of admissions over a recent five-year period to explore various questions about changes in the patterns of admissions. Describing trends and testing associations with a range of possible explanatory factors. This work used the Hospital Episodes Statistics (HES) dataset18 to examine monthly emergency admissions over the five-year period from April 2004 to March 2009. The HES are released annually, and we have used a common patient ID (preserving anonymity) to link together all five years to ensure that admissions around the turn of the financial year are assigned to the correct month with a correct length of stay, regardless of in which HES data year they appear. It allows us to explore patient-level tracking on factors such as readmission. Emergency admission is defined as any spell (continuous stay) with admission methods via A&E, GP, Bed Bureau, consultant OP clinic or NHS Direct. Certain admissions (such as in mental health, those for which no diagnosis was recorded or those occurring in merged NHS trusts) were excluded as appropriate to each analysis. The full methodology for defining spells and calculating length of stay is set out in Appendix 1. This report also draws on pre-2004 HES and other data sources as appropriate.
Trends in emergency admissions in England 2004–2009
8
2. Describing the national trends
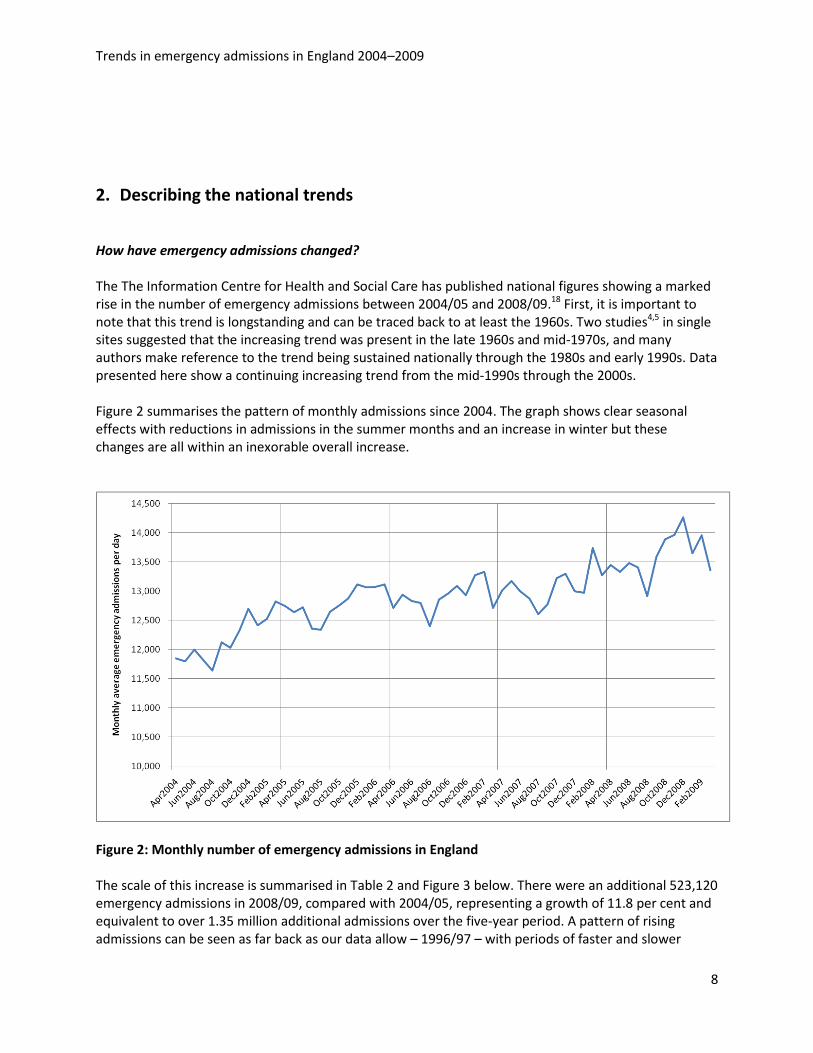
How have emergency admissions changed? The The Information Centre for Health and Social Care has published national figures showing a marked rise in the number of emergency admissions between 2004/05 and 2008/09.18 First, it is important to note that this trend is longstanding and can be traced back to at least the 1960s. Two studies4,5 in single sites suggested that the increasing trend was present in the late 1960s and mid-1970s, and many authors make reference to the trend being sustained nationally through the 1980s and early 1990s. Data presented here show a continuing increasing trend from the mid-1990s through the 2000s. Figure 2 summarises the pattern of monthly admissions since 2004. The graph shows clear seasonal effects with reductions in admissions in the summer months and an increase in winter but these changes are all within an inexorable overall increase.
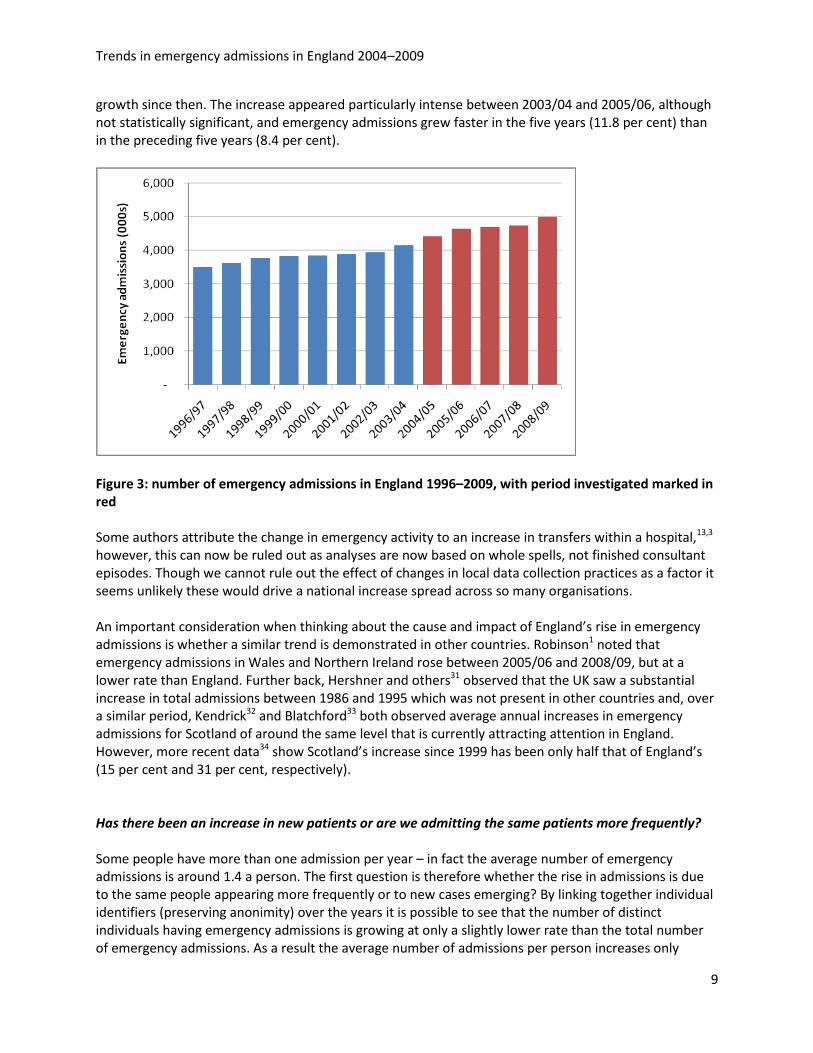
Figure 2: Monthly number of emergency admissions in England The scale of this increase is summarised in Table 2 and Figure 3 below. There were an additional 523,120 emergency admissions in 2008/09, compared with 2004/05, representing a growth of 11.8 per cent and equivalent to over 1.35 million additional admissions over the five-year period. A pattern of rising admissions can be seen as far back as our data allow – 1996/97 – with periods of faster and slower
Trends in emergency admissions in England 2004–2009
9
growth since then. The increase appeared particularly intense between 2003/04 and 2005/06, although not statistically significant, and emergency admissions grew faster in the five years (11.8 per cent) than in the preceding five years (8.4 per cent).
Figure 3: number of emergency admissions in England 1996–2009, with period investigated marked in red Some authors attribute the change in emergency activity to an increase in transfers within a hospital,13,3 however, this can now be ruled out as analyses are now based on whole spells, not finished consultant episodes. Though we cannot rule out the effect of changes in local data collection practices as a factor it seems unlikely these would drive a national increase spread across so many organisations.
An important consideration when thinking about the cause and impact of England’s rise in emergency admissions is whether a similar trend is demonstrated in other countries. Robinson1 noted that emergency admissions in Wales and Northern Ireland rose between 2005/06 and 2008/09, but at a lower rate than England. Further back, Hershner and others31 observed that the UK saw a substantial increase in total admissions between 1986 and 1995 which was not present in other countries and, over a similar period, Kendrick32 and Blatchford33 both observed average annual increases in emergency admissions for Scotland of around the same level that is currently attracting attention in England. However, more recent data34 show Scotland’s increase since 1999 has been only half that of England’s (15 per cent and 31 per cent, respectively).
Has there been an increase in new patients or are we admitting the same patients more frequently? Some people have more than one admission per year – in fact the average number of emergency admissions is around 1.4 a person. The first question is therefore whether the rise in admissions is due to the same people appearing more frequently or to new cases emerging? By linking together individual identifiers (preserving anonimity) over the years it is possible to see that the number of distinct individuals having emergency admissions is growing at only a slightly lower rate than the total number of emergency admissions. As a result the average number of admissions per person increases only
Trends in emergency admissions in England 2004–2009
10
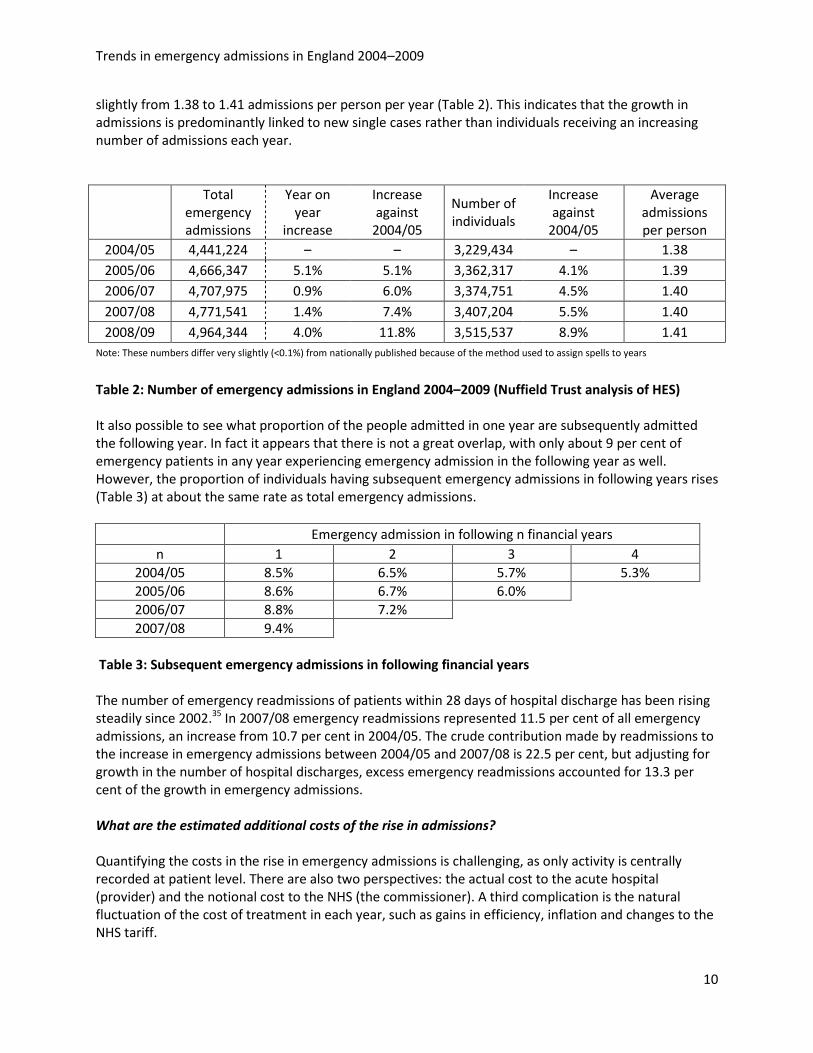
slightly from 1.38 to 1.41 admissions per person per year (Table 2). This indicates that the growth in admissions is predominantly linked to new single cases rather than individuals receiving an increasing number of admissions each year.
Total emergency admissions
Year on year
increase
Increase against
2004/05
Number of individuals
Increase against
2004/05
Average admissions per person
2004/05 4,441,224 – – 3,229,434 – 1.38 2005/06 4,666,347 5.1% 5.1% 3,362,317 4.1% 1.39 2006/07 4,707,975 0.9% 6.0% 3,374,751 4.5% 1.40 2007/08 4,771,541 1.4% 7.4% 3,407,204 5.5% 1.40 2008/09 4,964,344 4.0% 11.8% 3,515,537 8.9% 1.41
Note: These numbers differ very slightly (<0.1%) from nationally published because of the method used to assign spells to years
Table 2: Number of emergency admissions in England 2004–2009 (Nuffield Trust analysis of HES)
It also possible to see what proportion of the people admitted in one year are subsequently admitted the following year. In fact it appears that there is not a great overlap, with only about 9 per cent of emergency patients in any year experiencing emergency admission in the following year as well. However, the proportion of individuals having subsequent emergency admissions in following years rises (Table 3) at about the same rate as total emergency admissions.
Emergency admission in following n financial years
n 1 2 3 4 2004/05 8.5% 6.5% 5.7% 5.3% 2005/06 8.6% 6.7% 6.0%
2006/07 8.8% 7.2%
2007/08 9.4%
Table 3: Subsequent emergency admissions in following financial years The number of emergency readmissions of patients within 28 days of hospital discharge has been rising steadily since 2002.35 In 2007/08 emergency readmissions represented 11.5 per cent of all emergency admissions, an increase from 10.7 per cent in 2004/05. The crude contribution made by readmissions to the increase in emergency admissions between 2004/05 and 2007/08 is 22.5 per cent, but adjusting for growth in the number of hospital discharges, excess emergency readmissions accounted for 13.3 per cent of the growth in emergency admissions. What are the estimated additional costs of the rise in admissions? Quantifying the costs in the rise in emergency admissions is challenging, as only activity is centrally recorded at patient level. There are also two perspectives: the actual cost to the acute hospital (provider) and the notional cost to the NHS (the commissioner). A third complication is the natural fluctuation of the cost of treatment in each year, such as gains in efficiency, inflation and changes to the NHS tariff.
Trends in emergency admissions in England 2004–2009
11
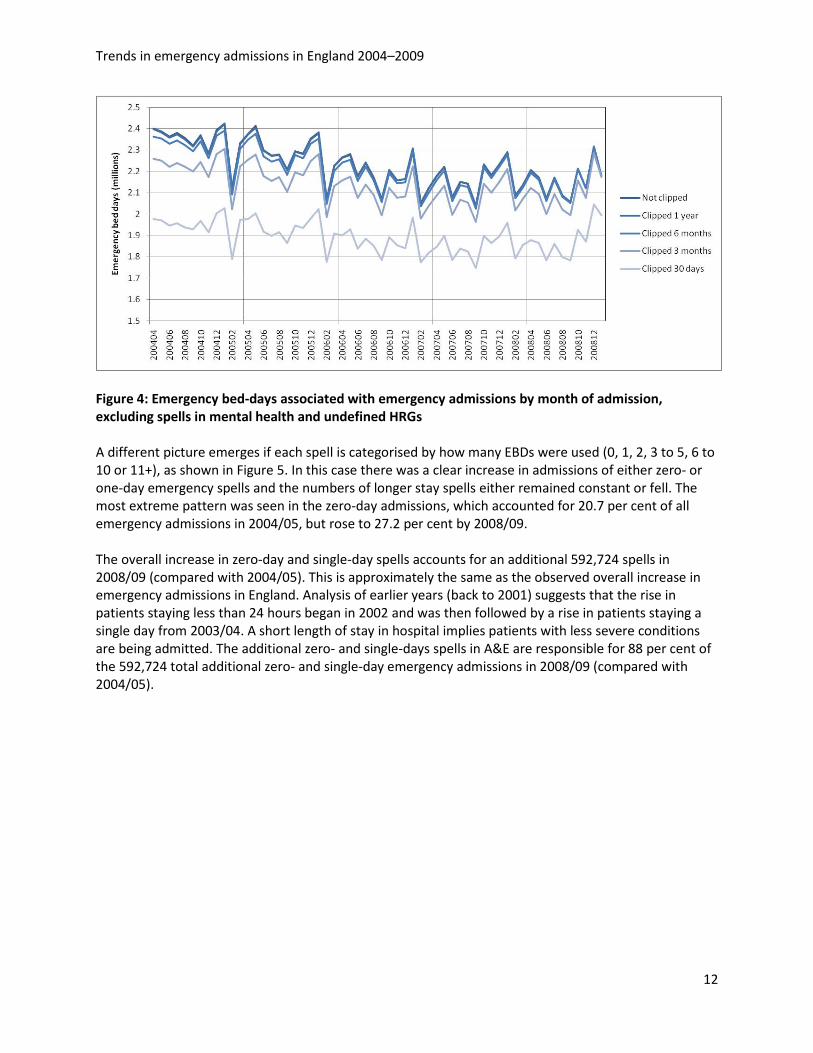
Based on the National Reference Costs,36 we can estimate that the cost to acute trusts of providing emergency inpatient care was somewhere in the region of £11 billion in 2008/09. However, because of changes in the way the information was collected it is not appropriate to compare them over time to derive an estimated additional cost of the extra admissions. A more reliable way to estimate the notional cost increase due to emergency admissions is to use the National Tariff prices (the set amounts that acute providers can charge their commissioning primary care trusts (PCTs)) to cost the activity in 2004/05 and 2008/09 using the same (2008/09) tariff. While this moves further away from what was actually charged in 2004/05, it allows like-for-like cost comparison without distortion from inflation or changes to tariff. It also excludes costs of non-tariff work and extra costs associated with augmented care. Based on this approach, the extra admissions in 2008/09 alone cost NHS commissioners the equivalent of somewhere in the region of £330 million, compared to 2004/05 activity costed at 2008/09 payment levels. Has the number of emergency bed-days increased? Despite rising emergency admissions, the number of emergency bed-days (EBDs) – and so length of stay – actually fell over the five years. Figure 4 shows the total number of EBDs consumed by spells admitted in each month. The highest lines represent values for the total bed-days which have gradually fallen – albeit with strong seasonal fluctuations. Measures of bed-days are sensitive to the presence of a very few cases staying for long periods of time so it may be that some of this change is due to a few very long-stay cases. Therefore the calculations were repeated but excluding cases staying over a threshold. The thresholds for clipping were set at stays over 66, 133 and 365 days per spell and the trends of each level of clipping are shown as additional lines in Figure 4. Patients still to be discharged, and those with Healthcare Resource Groups (HRGs) in the mental health and undefined chapters were excluded. Whatever the level of clipping, EBDs have been falling and so by implication the length of stay of admitted cases has shortened. The clear downward trend coincided with the emergence of the Department of Health target for trusts to reduce EBDs by 5 per cent by 2008 (against a baseline in 2003/04). The target was achieved37, 38 and the indicator was downgraded in 2008 from a ‘national requirement’ to an optional measure for ‘local action’ in the Vital Signs framework.39 Interestingly, the downward trend appeared not to be sustained in 2008/09 following this decision, although further monitoring is needed to properly assess this effect.
Trends in emergency admissions in England 2004–2009
12
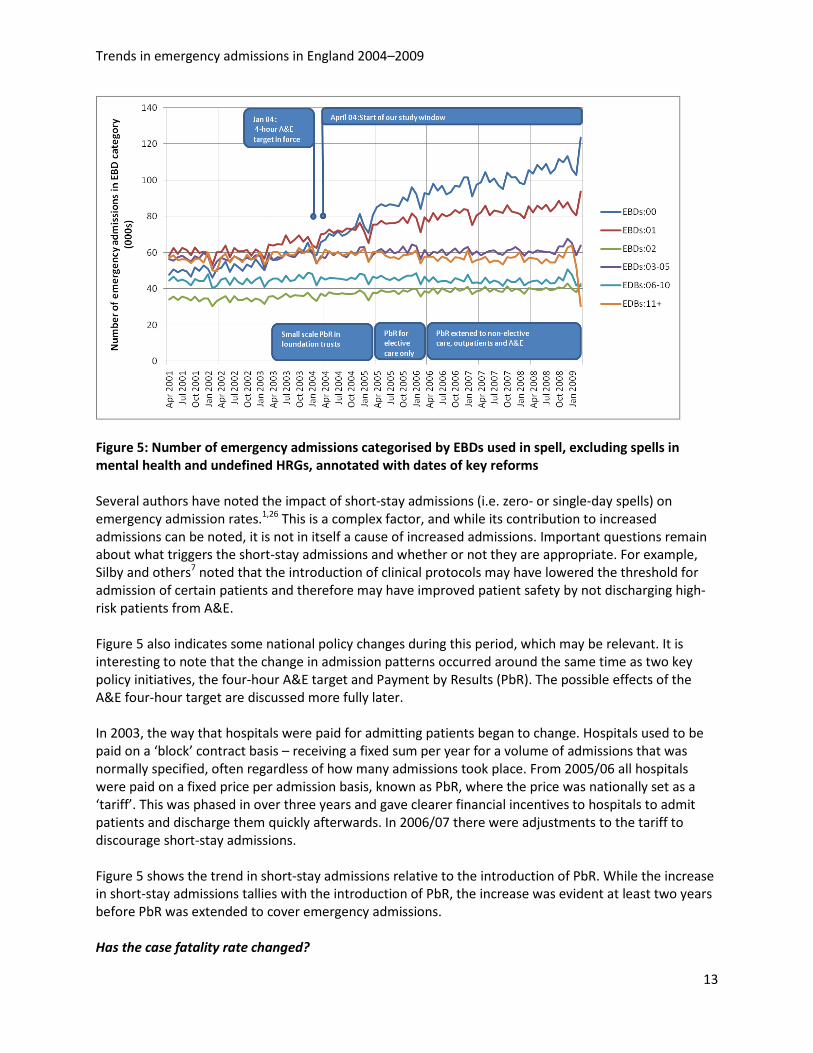
Figure 4: Emergency bed-days associated with emergency admissions by month of admission, excluding spells in mental health and undefined HRGs A different picture emerges if each spell is categorised by how many EBDs were used (0, 1, 2, 3 to 5, 6 to 10 or 11+), as shown in Figure 5. In this case there was a clear increase in admissions of either zero- or one-day emergency spells and the numbers of longer stay spells either remained constant or fell. The most extreme pattern was seen in the zero-day admissions, which accounted for 20.7 per cent of all emergency admissions in 2004/05, but rose to 27.2 per cent by 2008/09. The overall increase in zero-day and single-day spells accounts for an additional 592,724 spells in 2008/09 (compared with 2004/05). This is approximately the same as the observed overall increase in emergency admissions in England. Analysis of earlier years (back to 2001) suggests that the rise in patients staying less than 24 hours began in 2002 and was then followed by a rise in patients staying a single day from 2003/04. A short length of stay in hospital implies patients with less severe conditions are being admitted. The additional zero- and single-days spells in A&E are responsible for 88 per cent of the 592,724 total additional zero- and single-day emergency admissions in 2008/09 (compared with 2004/05).
Trends in emergency admissions in England 2004–2009
13
Figure 5: Number of emergency admissions categorised by EBDs used in spell, excluding spells in mental health and undefined HRGs, annotated with dates of key reforms Several authors have noted the impact of short-stay admissions (i.e. zero- or single-day spells) on emergency admission rates.1,26 This is a complex factor, and while its contribution to increased admissions can be noted, it is not in itself a cause of increased admissions. Important questions remain about what triggers the short-stay admissions and whether or not they are appropriate. For example, Silby and others7 noted that the introduction of clinical protocols may have lowered the threshold for admission of certain patients and therefore may have improved patient safety by not discharging high-risk patients from A&E. Figure 5 also indicates some national policy changes during this period, which may be relevant. It is interesting to note that the change in admission patterns occurred around the same time as two key policy initiatives, the four-hour A&E target and Payment by Results (PbR). The possible effects of the A&E four-hour target are discussed more fully later. In 2003, the way that hospitals were paid for admitting patients began to change. Hospitals used to be paid on a ‘block’ contract basis – receiving a fixed sum per year for a volume of admissions that was normally specified, often regardless of how many admissions took place. From 2005/06 all hospitals were paid on a fixed price per admission basis, known as PbR, where the price was nationally set as a ‘tariff’. This was phased in over three years and gave clearer financial incentives to hospitals to admit patients and discharge them quickly afterwards. In 2006/07 there were adjustments to the tariff to discourage short-stay admissions. Figure 5 shows the trend in short-stay admissions relative to the introduction of PbR. While the increase in short-stay admissions tallies with the introduction of PbR, the increase was evident at least two years before PbR was extended to cover emergency admissions. Has the case fatality rate changed?
Trends in emergency admissions in England 2004–2009
14
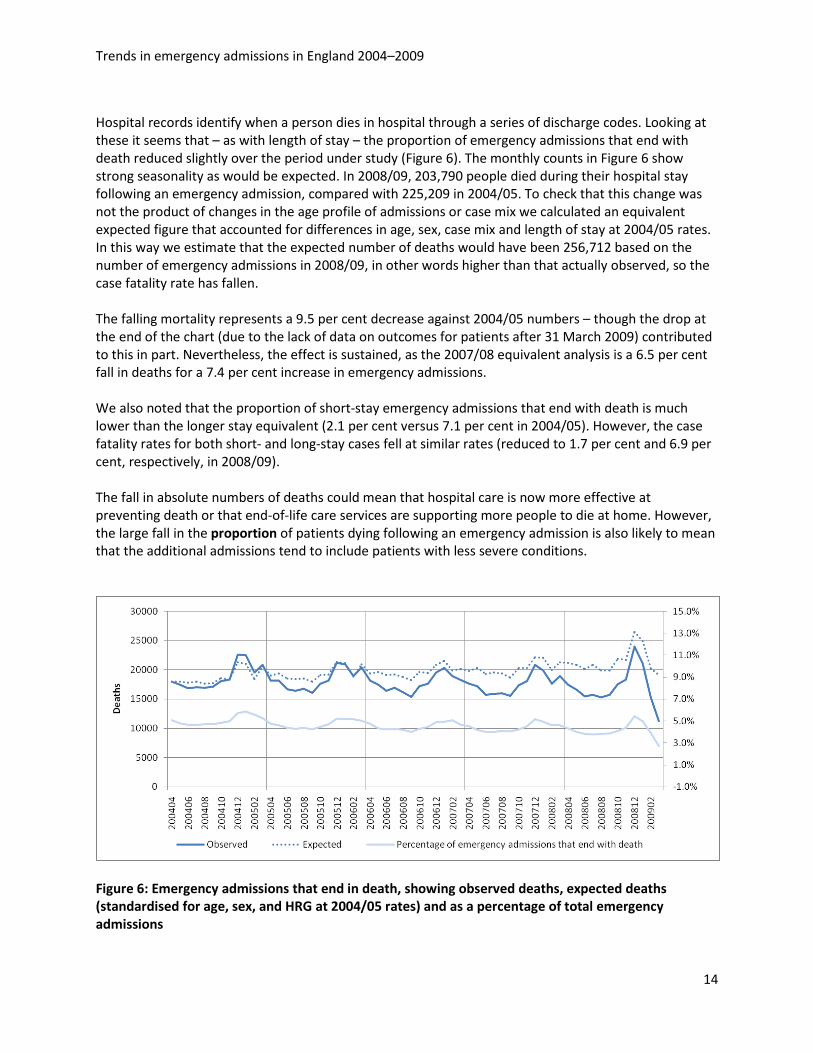
Hospital records identify when a person dies in hospital through a series of discharge codes. Looking at these it seems that – as with length of stay – the proportion of emergency admissions that end with death reduced slightly over the period under study (Figure 6). The monthly counts in Figure 6 show strong seasonality as would be expected. In 2008/09, 203,790 people died during their hospital stay following an emergency admission, compared with 225,209 in 2004/05. To check that this change was not the product of changes in the age profile of admissions or case mix we calculated an equivalent expected figure that accounted for differences in age, sex, case mix and length of stay at 2004/05 rates. In this way we estimate that the expected number of deaths would have been 256,712 based on the number of emergency admissions in 2008/09, in other words higher than that actually observed, so the case fatality rate has fallen. The falling mortality represents a 9.5 per cent decrease against 2004/05 numbers – though the drop at the end of the chart (due to the lack of data on outcomes for patients after 31 March 2009) contributed to this in part. Nevertheless, the effect is sustained, as the 2007/08 equivalent analysis is a 6.5 per cent fall in deaths for a 7.4 per cent increase in emergency admissions. We also noted that the proportion of short-stay emergency admissions that end with death is much lower than the longer stay equivalent (2.1 per cent versus 7.1 per cent in 2004/05). However, the case fatality rates for both short- and long-stay cases fell at similar rates (reduced to 1.7 per cent and 6.9 per cent, respectively, in 2008/09). The fall in absolute numbers of deaths could mean that hospital care is now more effective at preventing death or that end-of-life care services are supporting more people to die at home. However, the large fall in the proportion of patients dying following an emergency admission is also likely to mean that the additional admissions tend to include patients with less severe conditions.
Figure 6: Emergency admissions that end in death, showing observed deaths, expected deaths (standardised for age, sex, and HRG at 2004/05 rates) and as a percentage of total emergency admissions
Trends in emergency admissions in England 2004–2009
15
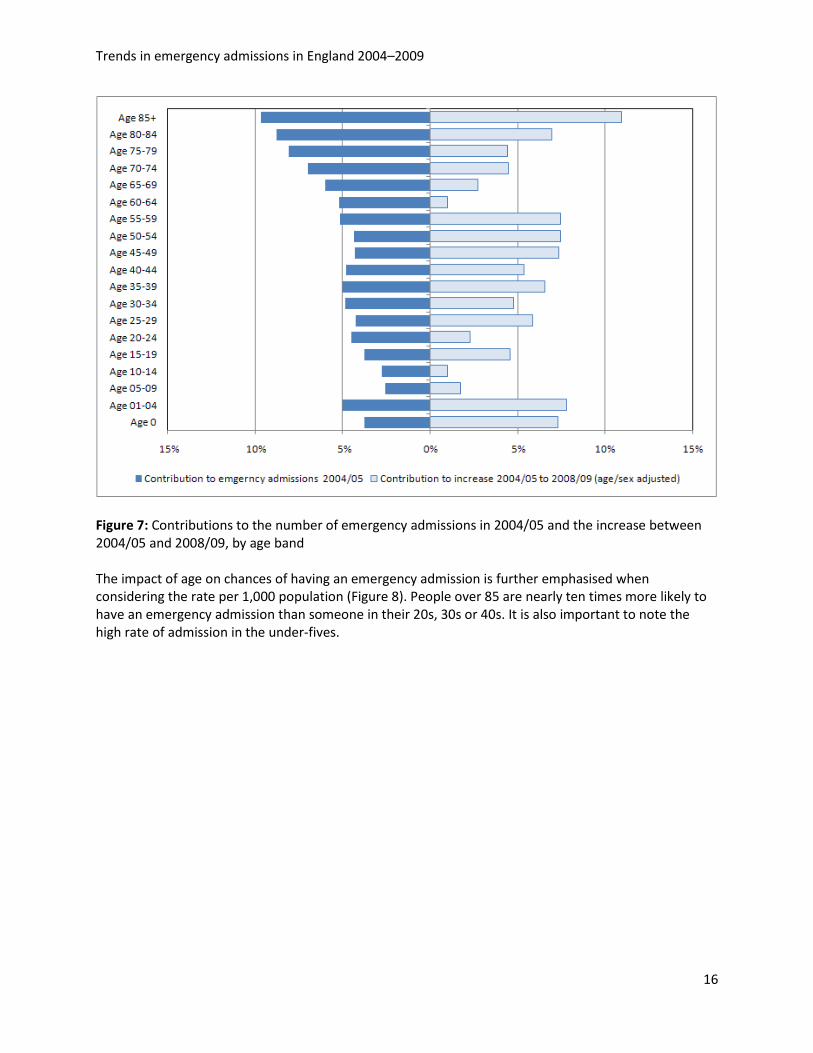
What is the effect of changes in the population? Increasing numbers of older people There are increasing numbers of older people in the population and older people are more likely to have emergency admissions. This may account for the observed increase, so the effects of differences in the age profile over the five years were tested. The emergency spells for England 2004/05 to 2008/09 were broken into five-year age bands, with separate categories for under-ones and people aged 85 years and above. The underlying admission rates are strongly related to age with nearly 40 per cent of all admissions being for the over 65s and 10 per cent of all admissions associated with people aged 85 and above. Figure 7 shows the 2004/05 baseline emergency admissions by age band of patient admitted (columns on the left), and the contribution to the overall increase in admissions over the five years to 2008/09 beyond the expected amount (columns on the right). The contribution to the overall increase is variable between the age bands and does not appear to be significantly related to the overall proportion of admissions by age band in 2004/05.
Summary points • Emergency admissions rose by 11.8 per cent over the five-year period – this was a greater rate
of increase than the previous five years. • Emergency admissions have shown a continuously increasing trend since the mid-1990s (when
our data began). • Most of the increase appears to have been in new cases, rather than the same set of
individuals being admitted more frequently. • Length of stay and case fatality rates fell over the period under study, both relative to
admissions and in absolute terms. • There was a dramatic increase in the number of short-stay emergency admissions and this
appeared to be driving the overall increase • The estimated cost of the rise in emergency admissions was at least an additional £330 million
in 2008/09.
Trends in emergency admissions in England 2004–2009
16
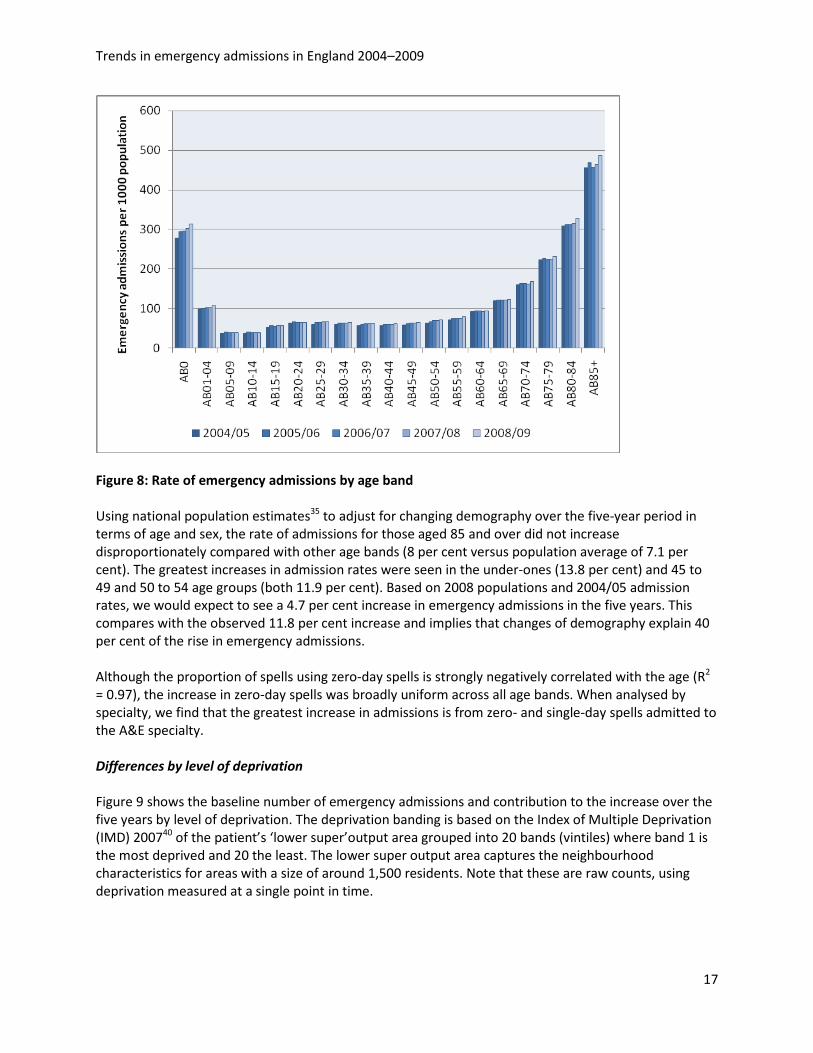
Figure 7: Contributions to the number of emergency admissions in 2004/05 and the increase between 2004/05 and 2008/09, by age band The impact of age on chances of having an emergency admission is further emphasised when considering the rate per 1,000 population (Figure 8). People over 85 are nearly ten times more likely to have an emergency admission than someone in their 20s, 30s or 40s. It is also important to note the high rate of admission in the under-fives.
Trends in emergency admissions in England 2004–2009
17
Figure 8: Rate of emergency admissions by age band
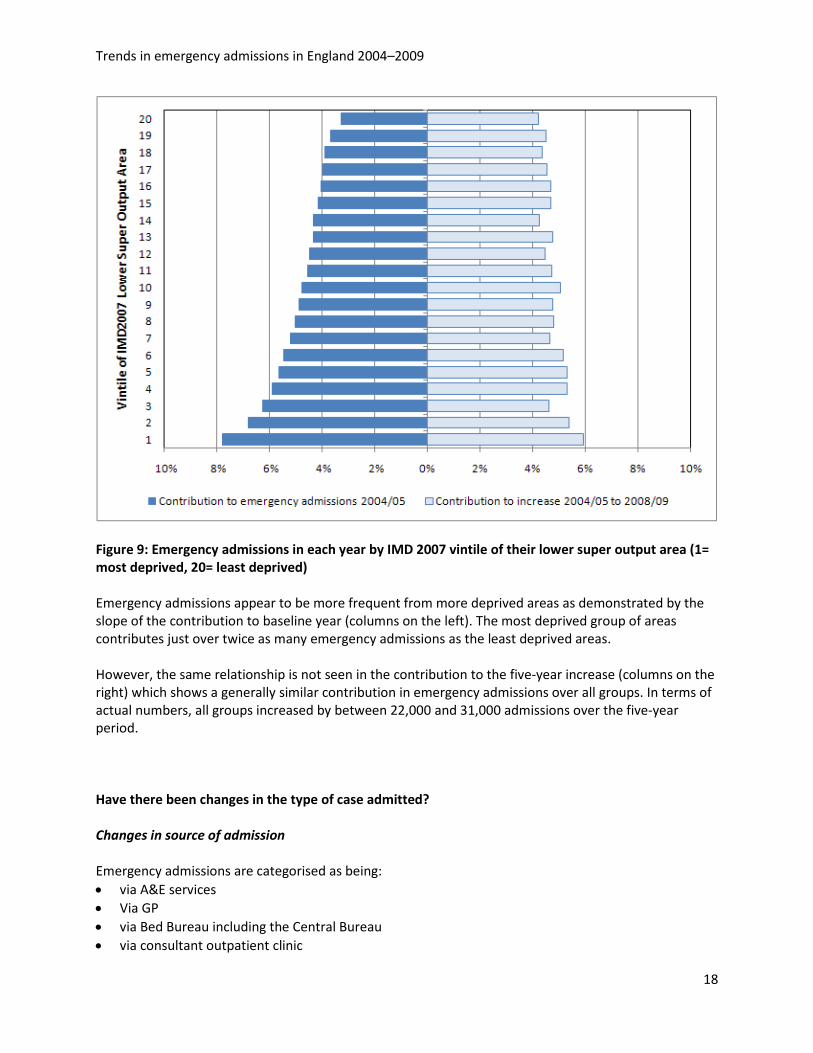
Using national population estimates35 to adjust for changing demography over the five-year period in terms of age and sex, the rate of admissions for those aged 85 and over did not increase disproportionately compared with other age bands (8 per cent versus population average of 7.1 per cent). The greatest increases in admission rates were seen in the under-ones (13.8 per cent) and 45 to 49 and 50 to 54 age groups (both 11.9 per cent). Based on 2008 populations and 2004/05 admission rates, we would expect to see a 4.7 per cent increase in emergency admissions in the five years. This compares with the observed 11.8 per cent increase and implies that changes of demography explain 40 per cent of the rise in emergency admissions. Although the proportion of spells using zero-day spells is strongly negatively correlated with the age (R2 = 0.97), the increase in zero-day spells was broadly uniform across all age bands. When analysed by specialty, we find that the greatest increase in admissions is from zero- and single-day spells admitted to the A&E specialty. Differences by level of deprivation Figure 9 shows the baseline number of emergency admissions and contribution to the increase over the five years by level of deprivation. The deprivation banding is based on the Index of Multiple Deprivation (IMD) 200740 of the patient’s ‘lower super’output area grouped into 20 bands (vintiles) where band 1 is the most deprived and 20 the least. The lower super output area captures the neighbourhood characteristics for areas with a size of around 1,500 residents. Note that these are raw counts, using deprivation measured at a single point in time.
Trends in emergency admissions in England 2004–2009
18
Figure 9: Emergency admissions in each year by IMD 2007 vintile of their lower super output area (1= most deprived, 20= least deprived)
Emergency admissions appear to be more frequent from more deprived areas as demonstrated by the slope of the contribution to baseline year (columns on the left). The most deprived group of areas contributes just over twice as many emergency admissions as the least deprived areas. However, the same relationship is not seen in the contribution to the five-year increase (columns on the right) which shows a generally similar contribution in emergency admissions over all groups. In terms of actual numbers, all groups increased by between 22,000 and 31,000 admissions over the five-year period. Have there been changes in the type of case admitted? Changes in source of admission Emergency admissions are categorised as being: • via A&E services • Via GP • via Bed Bureau including the Central Bureau • via consultant outpatient clinic
Trends in emergency admissions in England 2004–2009
19
• via other means, including patients who arrive via the A&E department of another healthcare provider.
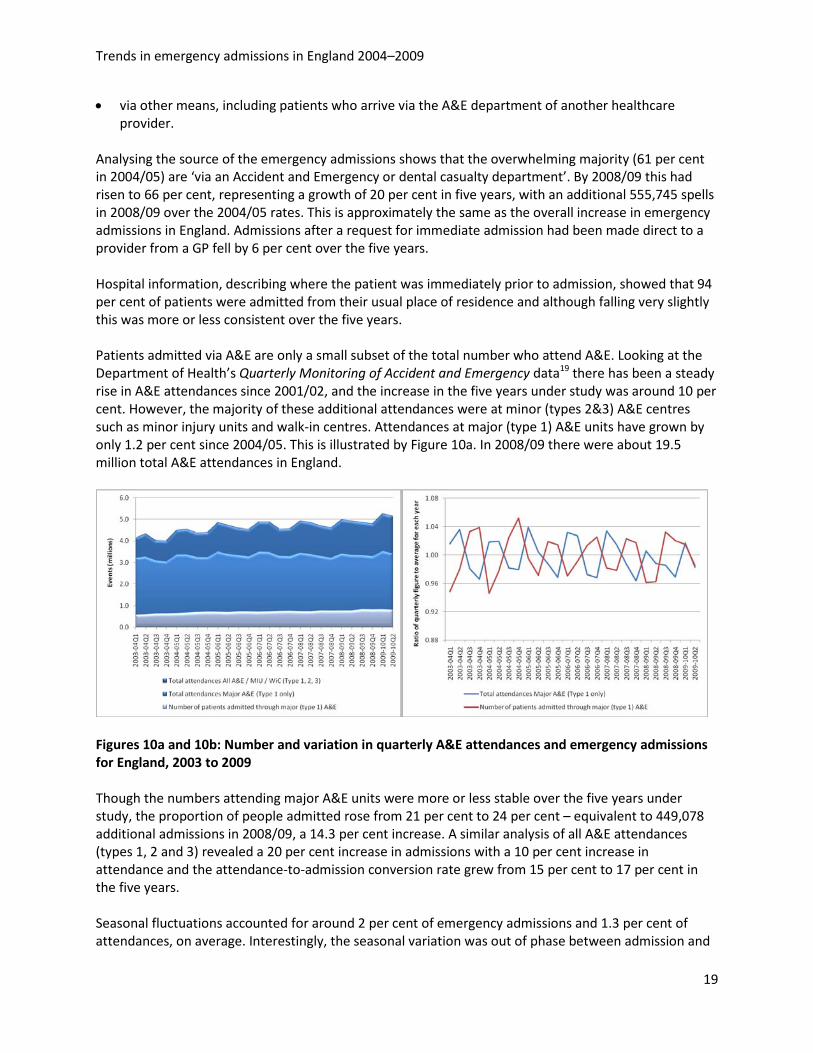
Analysing the source of the emergency admissions shows that the overwhelming majority (61 per cent in 2004/05) are ‘via an Accident and Emergency or dental casualty department’. By 2008/09 this had risen to 66 per cent, representing a growth of 20 per cent in five years, with an additional 555,745 spells in 2008/09 over the 2004/05 rates. This is approximately the same as the overall increase in emergency admissions in England. Admissions after a request for immediate admission had been made direct to a provider from a GP fell by 6 per cent over the five years. Hospital information, describing where the patient was immediately prior to admission, showed that 94 per cent of patients were admitted from their usual place of residence and although falling very slightly this was more or less consistent over the five years. Patients admitted via A&E are only a small subset of the total number who attend A&E. Looking at the Department of Health’s Quarterly Monitoring of Accident and Emergency data19 there has been a steady rise in A&E attendances since 2001/02, and the increase in the five years under study was around 10 per cent. However, the majority of these additional attendances were at minor (types 2&3) A&E centres such as minor injury units and walk-in centres. Attendances at major (type 1) A&E units have grown by only 1.2 per cent since 2004/05. This is illustrated by Figure 10a. In 2008/09 there were about 19.5 million total A&E attendances in England.
Figures 10a and 10b: Number and variation in quarterly A&E attendances and emergency admissions for England, 2003 to 2009
Though the numbers attending major A&E units were more or less stable over the five years under study, the proportion of people admitted rose from 21 per cent to 24 per cent – equivalent to 449,078 additional admissions in 2008/09, a 14.3 per cent increase. A similar analysis of all A&E attendances (types 1, 2 and 3) revealed a 20 per cent increase in admissions with a 10 per cent increase in attendance and the attendance-to-admission conversion rate grew from 15 per cent to 17 per cent in the five years. Seasonal fluctuations accounted for around 2 per cent of emergency admissions and 1.3 per cent of attendances, on average. Interestingly, the seasonal variation was out of phase between admission and
Trends in emergency admissions in England 2004–2009
20
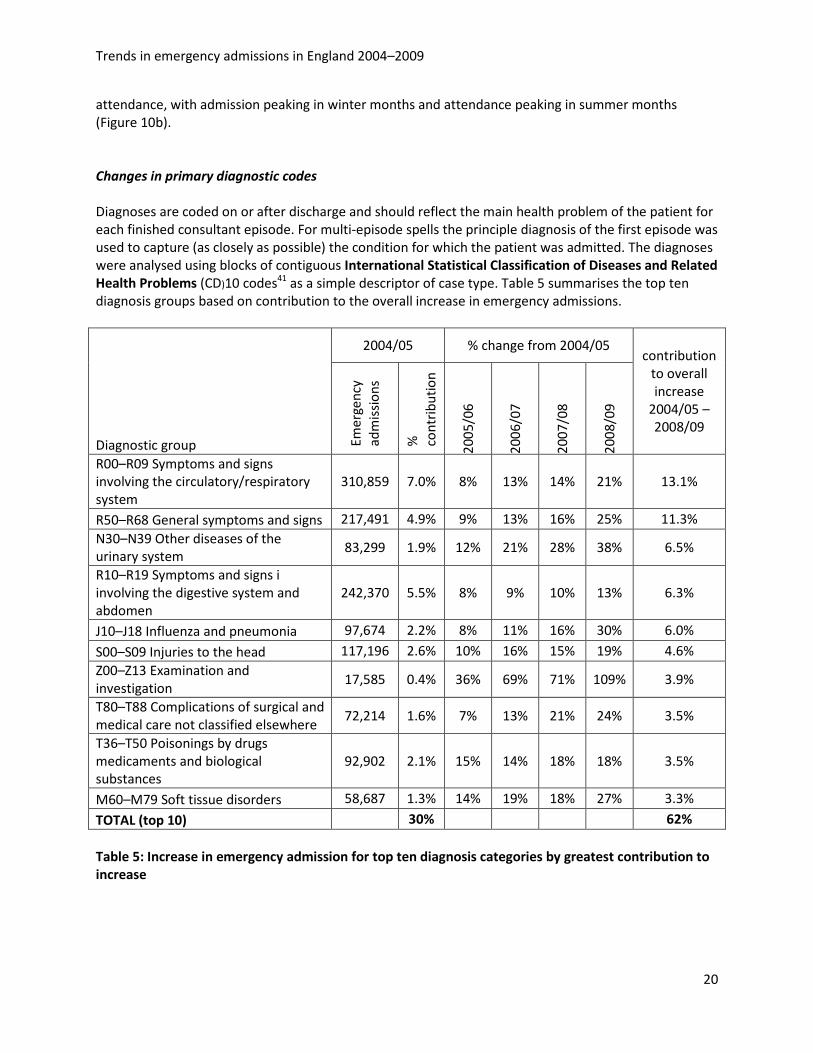
attendance, with admission peaking in winter months and attendance peaking in summer months (Figure 10b). Changes in primary diagnostic codes Diagnoses are coded on or after discharge and should reflect the main health problem of the patient for each finished consultant episode. For multi-episode spells the principle diagnosis of the first episode was used to capture (as closely as possible) the condition for which the patient was admitted. The diagnoses were analysed using blocks of contiguous International Statistical Classification of Diseases and Related Health Problems (CD)10 codes41 as a simple descriptor of case type. Table 5 summarises the top ten diagnosis groups based on contribution to the overall increase in emergency admissions.
Diagnostic group
2004/05 % change from 2004/05 contribution
to overall increase
2004/05 – 2008/09
Emer
genc
y ad
mis
sion
s
%
cont
ribu
tion
2005
/06
2006
/07
2007
/08
2008
/09
R00–R09 Symptoms and signs involving the circulatory/respiratory system
310,859 7.0% 8% 13% 14% 21% 13.1%
R50–R68 General symptoms and signs 217,491 4.9% 9% 13% 16% 25% 11.3% N30–N39 Other diseases of the urinary system
83,299 1.9% 12% 21% 28% 38% 6.5%
R10–R19 Symptoms and signs i involving the digestive system and abdomen
242,370 5.5% 8% 9% 10% 13% 6.3%
J10–J18 Influenza and pneumonia 97,674 2.2% 8% 11% 16% 30% 6.0%
S00–S09 Injuries to the head 117,196 2.6% 10% 16% 15% 19% 4.6% Z00–Z13 Examination and investigation
17,585 0.4% 36% 69% 71% 109% 3.9%
T80–T88 Complications of surgical and medical care not classified elsewhere
72,214 1.6% 7% 13% 21% 24% 3.5%
T36–T50 Poisonings by drugs medicaments and biological substances
92,902 2.1% 15% 14% 18% 18% 3.5%
M60–M79 Soft tissue disorders 58,687 1.3% 14% 19% 18% 27% 3.3%
TOTAL (top 10) 30%
62%
Table 5: Increase in emergency admission for top ten diagnosis categories by greatest contribution to increase
Trends in emergency admissions in England 2004–2009
21
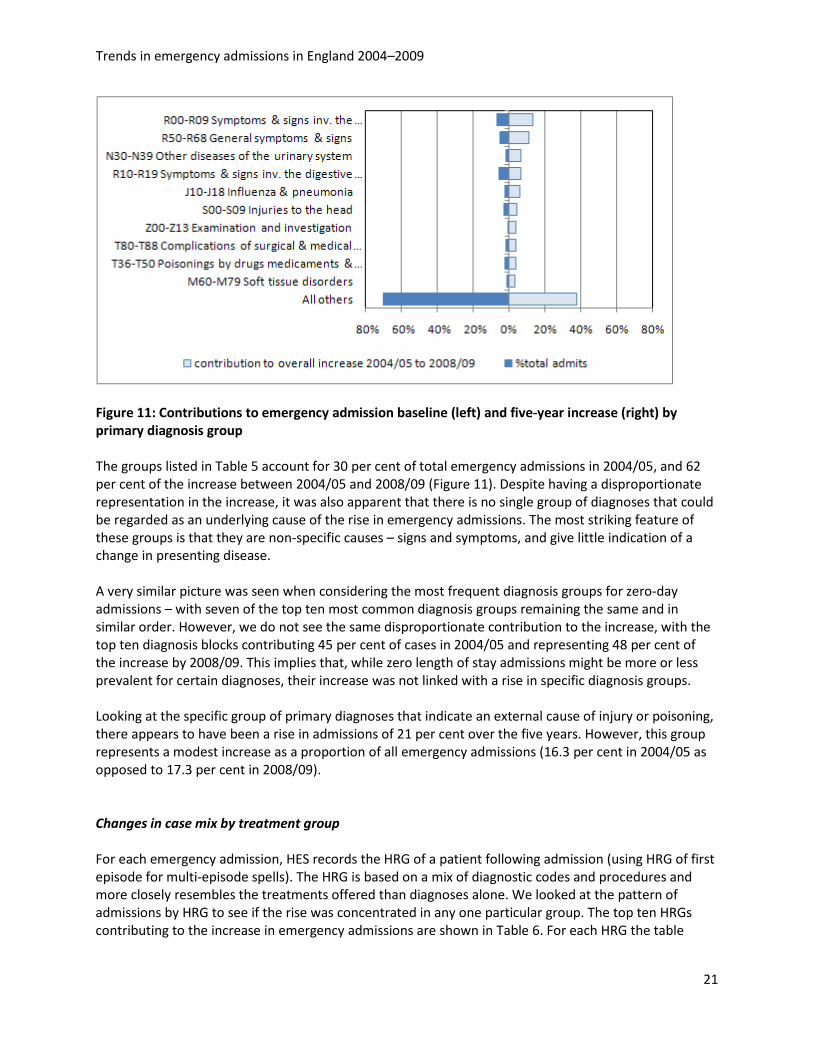
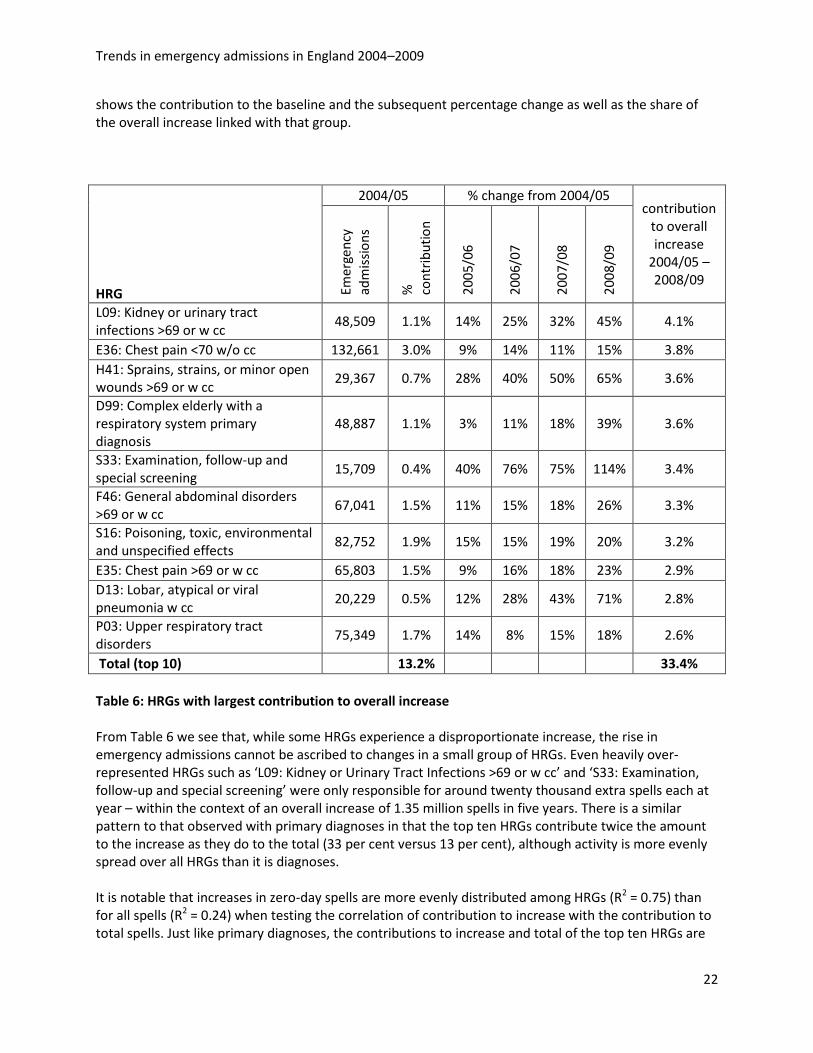
Figure 11: Contributions to emergency admission baseline (left) and five-year increase (right) by primary diagnosis group The groups listed in Table 5 account for 30 per cent of total emergency admissions in 2004/05, and 62 per cent of the increase between 2004/05 and 2008/09 (Figure 11). Despite having a disproportionate representation in the increase, it was also apparent that there is no single group of diagnoses that could be regarded as an underlying cause of the rise in emergency admissions. The most striking feature of these groups is that they are non-specific causes – signs and symptoms, and give little indication of a change in presenting disease. A very similar picture was seen when considering the most frequent diagnosis groups for zero-day admissions – with seven of the top ten most common diagnosis groups remaining the same and in similar order. However, we do not see the same disproportionate contribution to the increase, with the top ten diagnosis blocks contributing 45 per cent of cases in 2004/05 and representing 48 per cent of the increase by 2008/09. This implies that, while zero length of stay admissions might be more or less prevalent for certain diagnoses, their increase was not linked with a rise in specific diagnosis groups. Looking at the specific group of primary diagnoses that indicate an external cause of injury or poisoning, there appears to have been a rise in admissions of 21 per cent over the five years. However, this group represents a modest increase as a proportion of all emergency admissions (16.3 per cent in 2004/05 as opposed to 17.3 per cent in 2008/09). Changes in case mix by treatment group For each emergency admission, HES records the HRG of a patient following admission (using HRG of first episode for multi-episode spells). The HRG is based on a mix of diagnostic codes and procedures and more closely resembles the treatments offered than diagnoses alone. We looked at the pattern of admissions by HRG to see if the rise was concentrated in any one particular group. The top ten HRGs contributing to the increase in emergency admissions are shown in Table 6. For each HRG the table
Trends in emergency admissions in England 2004–2009
22
shows the contribution to the baseline and the subsequent percentage change as well as the share of the overall increase linked with that group.
HRG
2004/05 % change from 2004/05 contribution
to overall increase
2004/05 – 2008/09
Emer
genc
y ad
mis
sion
s
%
cont
ribu
tion
2005
/06
2006
/07
2007
/08
2008
/09
L09: Kidney or urinary tract infections >69 or w cc
48,509 1.1% 14% 25% 32% 45% 4.1%
E36: Chest pain <70 w/o cc 132,661 3.0% 9% 14% 11% 15% 3.8% H41: Sprains, strains, or minor open wounds >69 or w cc
29,367 0.7% 28% 40% 50% 65% 3.6%
D99: Complex elderly with a respiratory system primary diagnosis
48,887 1.1% 3% 11% 18% 39% 3.6%
S33: Examination, follow-up and special screening
15,709 0.4% 40% 76% 75% 114% 3.4%
F46: General abdominal disorders >69 or w cc
67,041 1.5% 11% 15% 18% 26% 3.3%
S16: Poisoning, toxic, environmental and unspecified effects
82,752 1.9% 15% 15% 19% 20% 3.2%
E35: Chest pain >69 or w cc 65,803 1.5% 9% 16% 18% 23% 2.9% D13: Lobar, atypical or viral pneumonia w cc
20,229 0.5% 12% 28% 43% 71% 2.8%
P03: Upper respiratory tract disorders
75,349 1.7% 14% 8% 15% 18% 2.6%
Total (top 10)
13.2%
33.4% Table 6: HRGs with largest contribution to overall increase From Table 6 we see that, while some HRGs experience a disproportionate increase, the rise in emergency admissions cannot be ascribed to changes in a small group of HRGs. Even heavily over-represented HRGs such as ‘L09: Kidney or Urinary Tract Infections >69 or w cc’ and ‘S33: Examination, follow-up and special screening’ were only responsible for around twenty thousand extra spells each at year – within the context of an overall increase of 1.35 million spells in five years. There is a similar pattern to that observed with primary diagnoses in that the top ten HRGs contribute twice the amount to the increase as they do to the total (33 per cent versus 13 per cent), although activity is more evenly spread over all HRGs than it is diagnoses. It is notable that increases in zero-day spells are more evenly distributed among HRGs (R2 = 0.75) than for all spells (R2 = 0.24) when testing the correlation of contribution to increase with the contribution to total spells. Just like primary diagnoses, the contributions to increase and total of the top ten HRGs are
Trends in emergency admissions in England 2004–2009
23
very similar (29 per cent versus 27 per cent) and six of the most common HRGs overall appear in the top ten for zero-day spells only.
Summary points • The changing demography over the five years (towards an aging population) explains 40 per
cent of the increase in emergency admissions. • The increase in emergency admissions was not concentrated in any particular age groups or
deprivation levels. • The majority of the increase came from admissions via A&E, and the conversion rate in major
(type 1) A&E departments rose from 21 to 24 per cent. • The overall increase was not concentrated in any particular diagnosis or treatment group.
However, the most common diagnosis and treatment groups were over represented in the terms of the increase. This pattern was not reflected in zero-day admissions, whose increases appeared evenly spread across most diagnosis and treatment groups.
Trends in emergency admissions in England 2004–2009
24
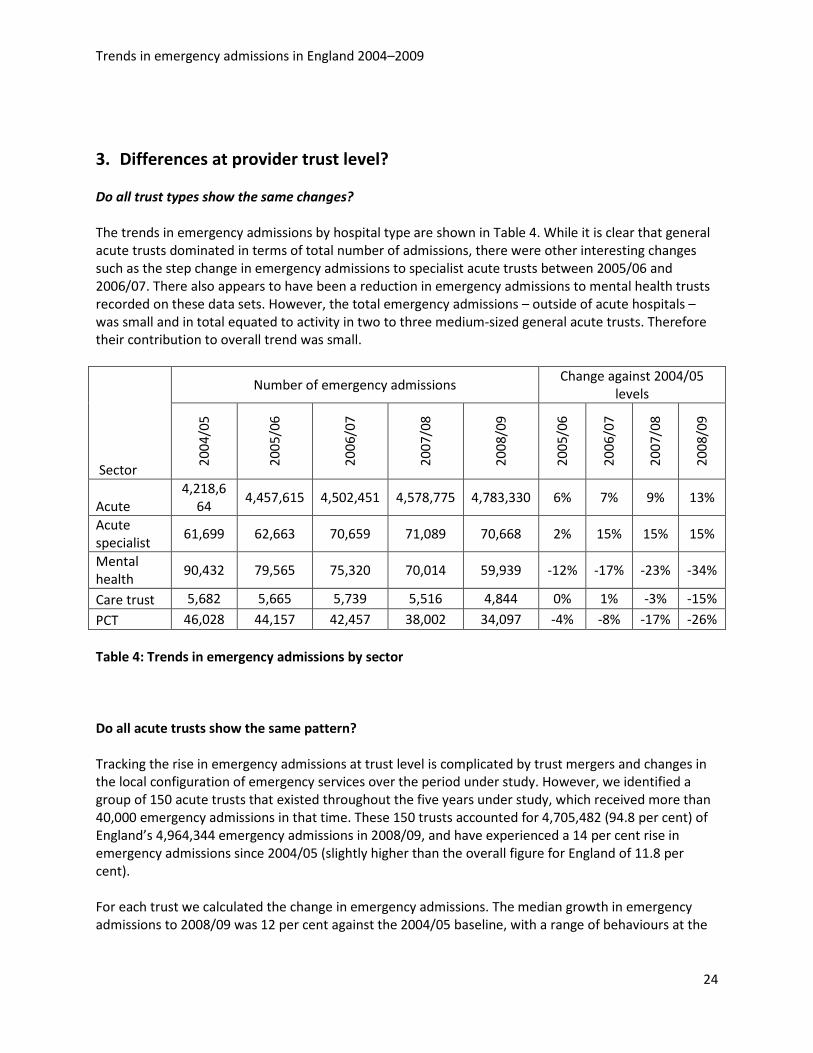
3. Differences at provider trust level? Do all trust types show the same changes? The trends in emergency admissions by hospital type are shown in Table 4. While it is clear that general acute trusts dominated in terms of total number of admissions, there were other interesting changes such as the step change in emergency admissions to specialist acute trusts between 2005/06 and 2006/07. There also appears to have been a reduction in emergency admissions to mental health trusts recorded on these data sets. However, the total emergency admissions – outside of acute hospitals – was small and in total equated to activity in two to three medium-sized general acute trusts. Therefore their contribution to overall trend was small.
Sector
Number of emergency admissions Change against 2004/05
levels
2004
/05
2005
/06
2006
/07
2007
/08
2008
/09
2005
/06
2006
/07
2007
/08
2008
/09
Acute 4,218,6
64 4,457,615 4,502,451 4,578,775 4,783,330 6% 7% 9% 13%
Acute specialist
61,699 62,663 70,659 71,089 70,668 2% 15% 15% 15%
Mental health
90,432 79,565 75,320 70,014 59,939 -12% -17% -23% -34%
Care trust 5,682 5,665 5,739 5,516 4,844 0% 1% -3% -15%
PCT 46,028 44,157 42,457 38,002 34,097 -4% -8% -17% -26% Table 4: Trends in emergency admissions by sector
Do all acute trusts show the same pattern? Tracking the rise in emergency admissions at trust level is complicated by trust mergers and changes in the local configuration of emergency services over the period under study. However, we identified a group of 150 acute trusts that existed throughout the five years under study, which received more than 40,000 emergency admissions in that time. These 150 trusts accounted for 4,705,482 (94.8 per cent) of England’s 4,964,344 emergency admissions in 2008/09, and have experienced a 14 per cent rise in emergency admissions since 2004/05 (slightly higher than the overall figure for England of 11.8 per cent). For each trust we calculated the change in emergency admissions. The median growth in emergency admissions to 2008/09 was 12 per cent against the 2004/05 baseline, with a range of behaviours at the
Trends in emergency admissions in England 2004–2009
25
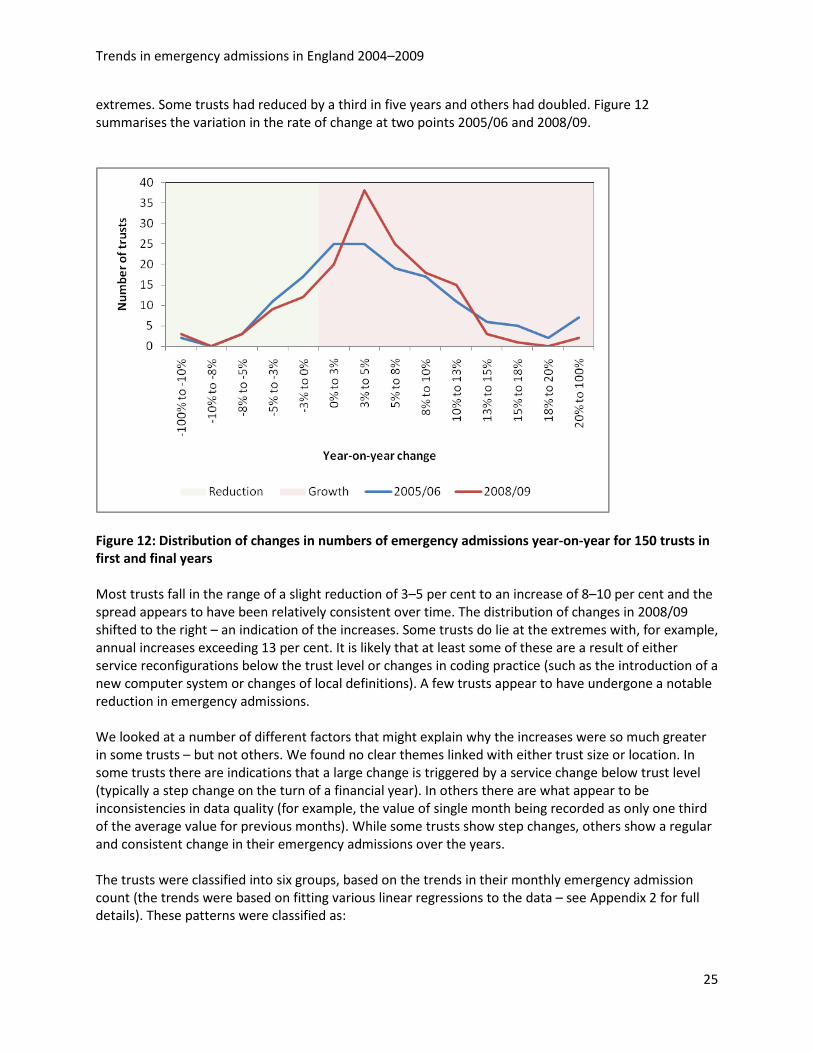
extremes. Some trusts had reduced by a third in five years and others had doubled. Figure 12 summarises the variation in the rate of change at two points 2005/06 and 2008/09.
Figure 12: Distribution of changes in numbers of emergency admissions year-on-year for 150 trusts in first and final years Most trusts fall in the range of a slight reduction of 3–5 per cent to an increase of 8–10 per cent and the spread appears to have been relatively consistent over time. The distribution of changes in 2008/09 shifted to the right – an indication of the increases. Some trusts do lie at the extremes with, for example, annual increases exceeding 13 per cent. It is likely that at least some of these are a result of either service reconfigurations below the trust level or changes in coding practice (such as the introduction of a new computer system or changes of local definitions). A few trusts appear to have undergone a notable reduction in emergency admissions. We looked at a number of different factors that might explain why the increases were so much greater in some trusts – but not others. We found no clear themes linked with either trust size or location. In some trusts there are indications that a large change is triggered by a service change below trust level (typically a step change on the turn of a financial year). In others there are what appear to be inconsistencies in data quality (for example, the value of single month being recorded as only one third of the average value for previous months). While some trusts show step changes, others show a regular and consistent change in their emergency admissions over the years. The trusts were classified into six groups, based on the trends in their monthly emergency admission count (the trends were based on fitting various linear regressions to the data – see Appendix 2 for full details). These patterns were classified as:
Trends in emergency admissions in England 2004–2009
26
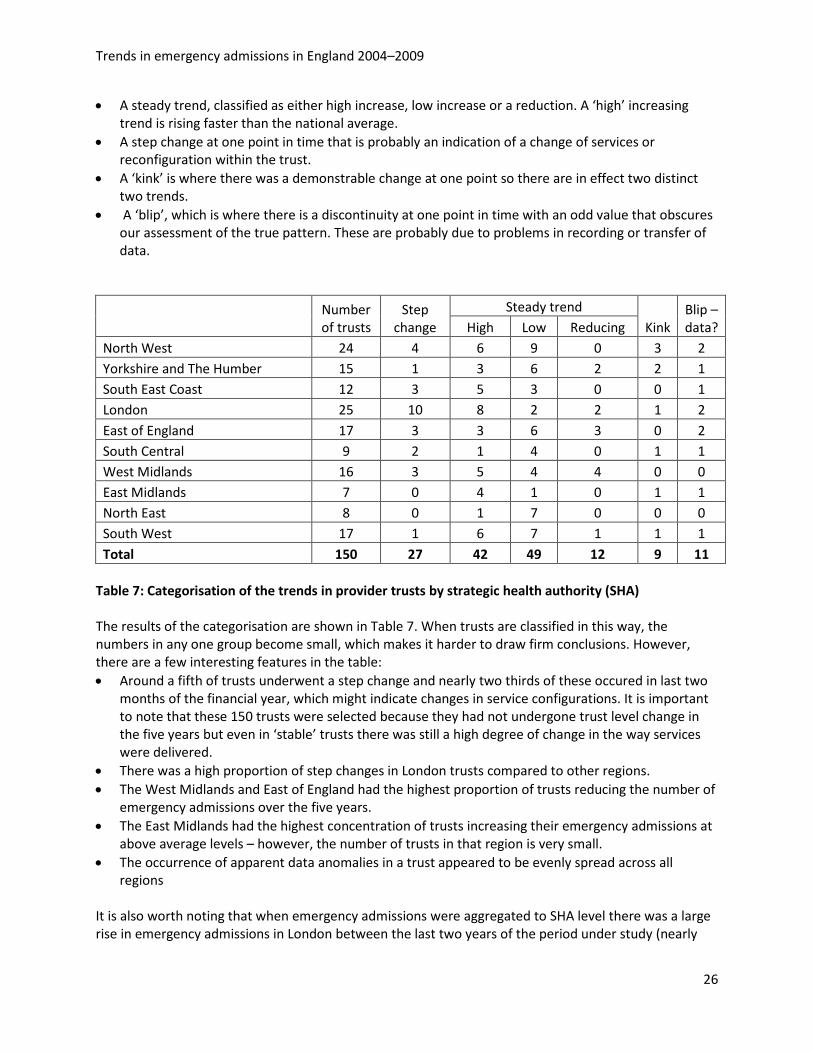
• A steady trend, classified as either high increase, low increase or a reduction. A ‘high’ increasing trend is rising faster than the national average.
• A step change at one point in time that is probably an indication of a change of services or reconfiguration within the trust.
• A ‘kink’ is where there was a demonstrable change at one point so there are in effect two distinct two trends.
• A ‘blip’, which is where there is a discontinuity at one point in time with an odd value that obscures our assessment of the true pattern. These are probably due to problems in recording or transfer of data.
Number of trusts
Step change
Steady trend Kink
Blip – data? High Low Reducing
North West 24 4 6 9 0 3 2 Yorkshire and The Humber 15 1 3 6 2 2 1 South East Coast 12 3 5 3 0 0 1 London 25 10 8 2 2 1 2 East of England 17 3 3 6 3 0 2 South Central 9 2 1 4 0 1 1 West Midlands 16 3 5 4 4 0 0 East Midlands 7 0 4 1 0 1 1 North East 8 0 1 7 0 0 0 South West 17 1 6 7 1 1 1 Total 150 27 42 49 12 9 11
Table 7: Categorisation of the trends in provider trusts by strategic health authority (SHA) The results of the categorisation are shown in Table 7. When trusts are classified in this way, the numbers in any one group become small, which makes it harder to draw firm conclusions. However, there are a few interesting features in the table: • Around a fifth of trusts underwent a step change and nearly two thirds of these occured in last two
months of the financial year, which might indicate changes in service configurations. It is important to note that these 150 trusts were selected because they had not undergone trust level change in the five years but even in ‘stable’ trusts there was still a high degree of change in the way services were delivered.
• There was a high proportion of step changes in London trusts compared to other regions. • The West Midlands and East of England had the highest proportion of trusts reducing the number of
emergency admissions over the five years. • The East Midlands had the highest concentration of trusts increasing their emergency admissions at
above average levels – however, the number of trusts in that region is very small. • The occurrence of apparent data anomalies in a trust appeared to be evenly spread across all
regions It is also worth noting that when emergency admissions were aggregated to SHA level there was a large rise in emergency admissions in London between the last two years of the period under study (nearly
Trends in emergency admissions in England 2004–2009
27
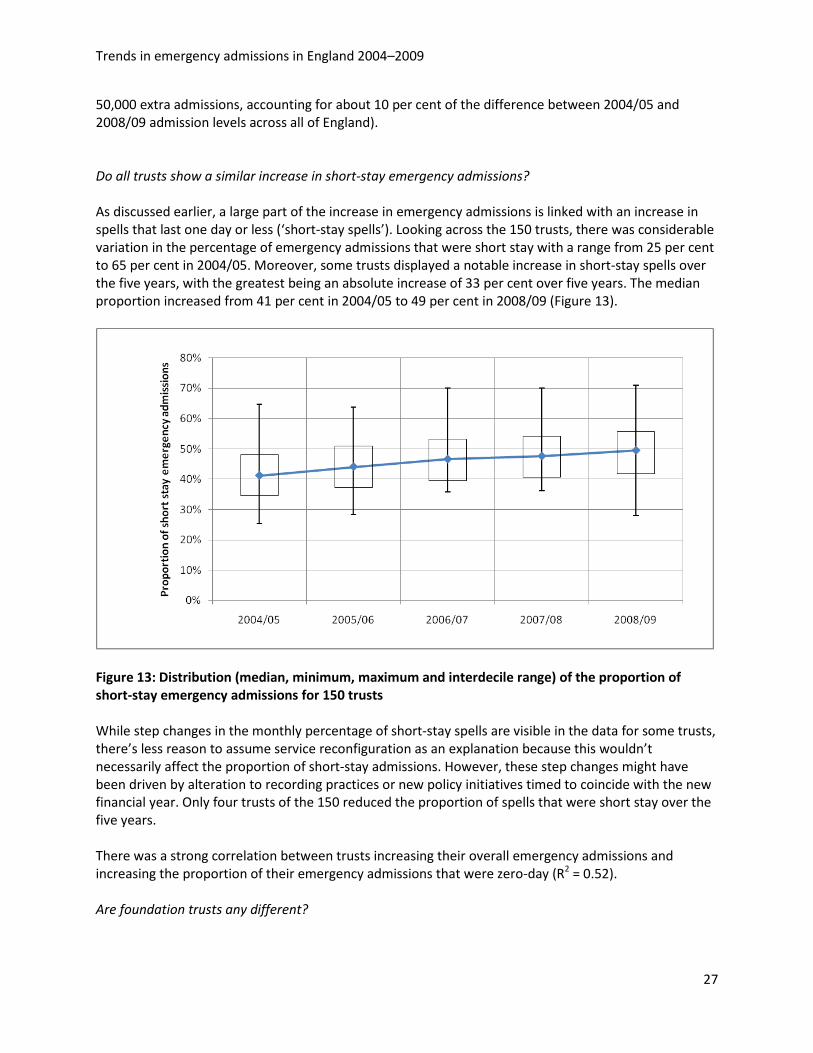
50,000 extra admissions, accounting for about 10 per cent of the difference between 2004/05 and 2008/09 admission levels across all of England). Do all trusts show a similar increase in short-stay emergency admissions? As discussed earlier, a large part of the increase in emergency admissions is linked with an increase in spells that last one day or less (‘short-stay spells’). Looking across the 150 trusts, there was considerable variation in the percentage of emergency admissions that were short stay with a range from 25 per cent to 65 per cent in 2004/05. Moreover, some trusts displayed a notable increase in short-stay spells over the five years, with the greatest being an absolute increase of 33 per cent over five years. The median proportion increased from 41 per cent in 2004/05 to 49 per cent in 2008/09 (Figure 13).
Figure 13: Distribution (median, minimum, maximum and interdecile range) of the proportion of short-stay emergency admissions for 150 trusts While step changes in the monthly percentage of short-stay spells are visible in the data for some trusts, there’s less reason to assume service reconfiguration as an explanation because this wouldn’t necessarily affect the proportion of short-stay admissions. However, these step changes might have been driven by alteration to recording practices or new policy initiatives timed to coincide with the new financial year. Only four trusts of the 150 reduced the proportion of spells that were short stay over the five years. There was a strong correlation between trusts increasing their overall emergency admissions and increasing the proportion of their emergency admissions that were zero-day (R2 = 0.52). Are foundation trusts any different?
Trends in emergency admissions in England 2004–2009
28
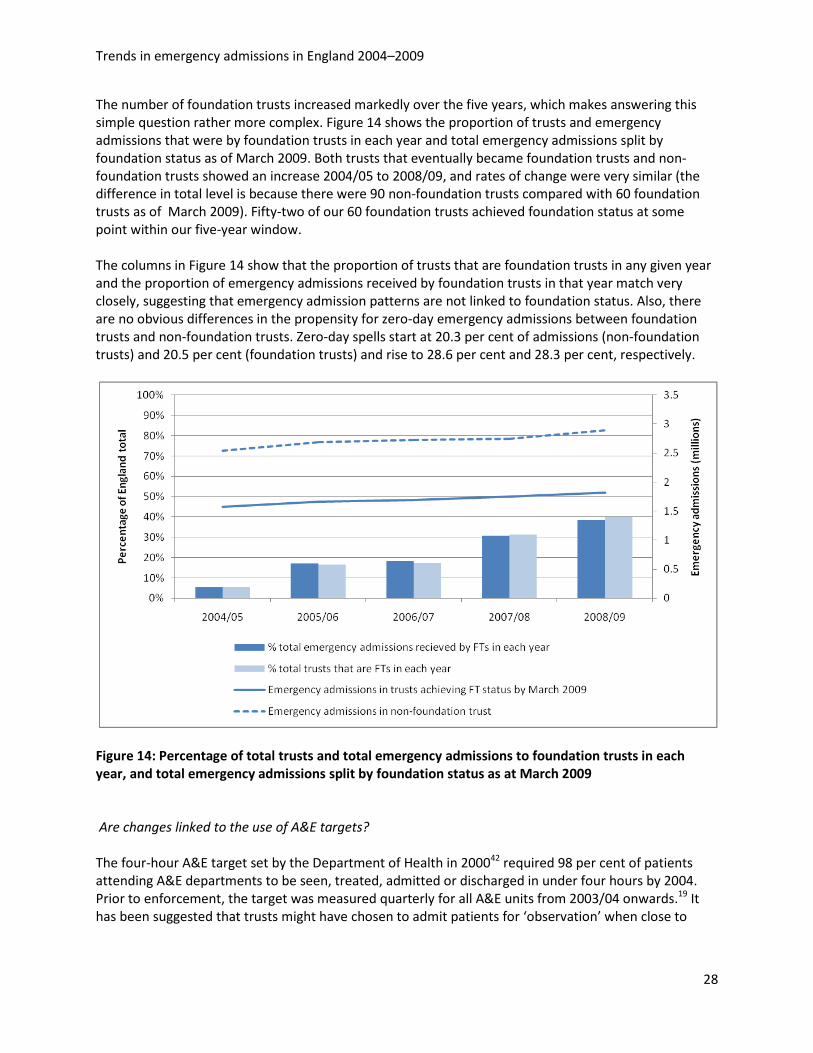
The number of foundation trusts increased markedly over the five years, which makes answering this simple question rather more complex. Figure 14 shows the proportion of trusts and emergency admissions that were by foundation trusts in each year and total emergency admissions split by foundation status as of March 2009. Both trusts that eventually became foundation trusts and non-foundation trusts showed an increase 2004/05 to 2008/09, and rates of change were very similar (the difference in total level is because there were 90 non-foundation trusts compared with 60 foundation trusts as of March 2009). Fifty-two of our 60 foundation trusts achieved foundation status at some point within our five-year window. The columns in Figure 14 show that the proportion of trusts that are foundation trusts in any given year and the proportion of emergency admissions received by foundation trusts in that year match very closely, suggesting that emergency admission patterns are not linked to foundation status. Also, there are no obvious differences in the propensity for zero-day emergency admissions between foundation trusts and non-foundation trusts. Zero-day spells start at 20.3 per cent of admissions (non-foundation trusts) and 20.5 per cent (foundation trusts) and rise to 28.6 per cent and 28.3 per cent, respectively.
Figure 14: Percentage of total trusts and total emergency admissions to foundation trusts in each year, and total emergency admissions split by foundation status as at March 2009
Are changes linked to the use of A&E targets? The four-hour A&E target set by the Department of Health in 200042 required 98 per cent of patients attending A&E departments to be seen, treated, admitted or discharged in under four hours by 2004. Prior to enforcement, the target was measured quarterly for all A&E units from 2003/04 onwards.19 It has been suggested that trusts might have chosen to admit patients for ‘observation’ when close to
Trends in emergency admissions in England 2004–2009
29
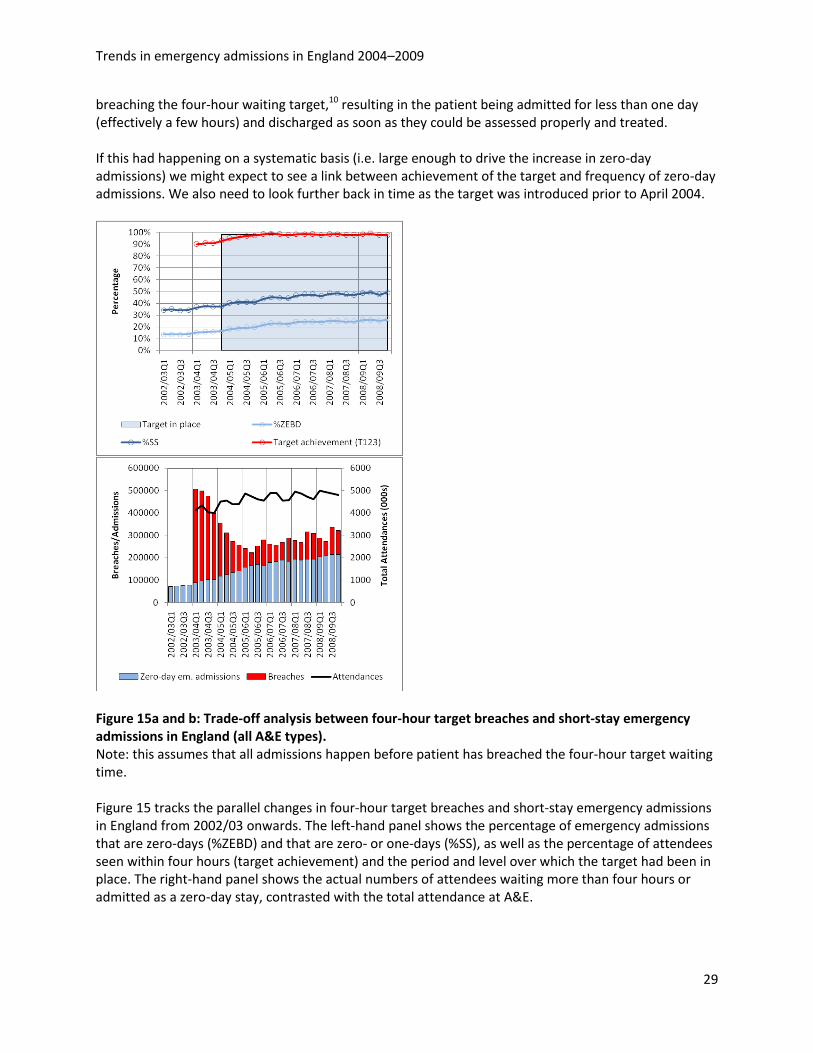
breaching the four-hour waiting target,10 resulting in the patient being admitted for less than one day (effectively a few hours) and discharged as soon as they could be assessed properly and treated. If this had happening on a systematic basis (i.e. large enough to drive the increase in zero-day admissions) we might expect to see a link between achievement of the target and frequency of zero-day admissions. We also need to look further back in time as the target was introduced prior to April 2004.
Figure 15a and b: Trade-off analysis between four-hour target breaches and short-stay emergency admissions in England (all A&E types). Note: this assumes that all admissions happen before patient has breached the four-hour target waiting time. Figure 15 tracks the parallel changes in four-hour target breaches and short-stay emergency admissions in England from 2002/03 onwards. The left-hand panel shows the percentage of emergency admissions that are zero-days (%ZEBD) and that are zero- or one-days (%SS), as well as the percentage of attendees seen within four hours (target achievement) and the period and level over which the target had been in place. The right-hand panel shows the actual numbers of attendees waiting more than four hours or admitted as a zero-day stay, contrasted with the total attendance at A&E.
Trends in emergency admissions in England 2004–2009
30
In the left-hand panel, we see that the increase in the proportion of zero-day and short-stay emergency admissions has been steady, and was not disrupted by the introduction of the four-hour target. The right-hand panel shows a dramatic fall in breaches of the four-hour target between Q1 2003/04 and Q2 2005/06, accompanied by a rise in zero-day admissions. However, this does not appear to be a substitution as the number of combined events is also falling sharply. The level of breaches then remained more or less consistent to the end of the data in March 2009, while the steady rise in zero-day admissions continued and was mirrored by a rise in attendees. There was no national-level correlation between the percentage of patients seen in four hours and the percentage of zero-day spells (R2 never more than 0.02) in any one quarter. Nor was there any apparent correlation between quarter-on-quarter change in those two measures (R2 never greater than 0.15, and only exceeds 0.05 in three quarters). While there is no evidence of systematic use of zero-day admissions to manage the A&E target, this does not preclude these behaviours existing at trust level.
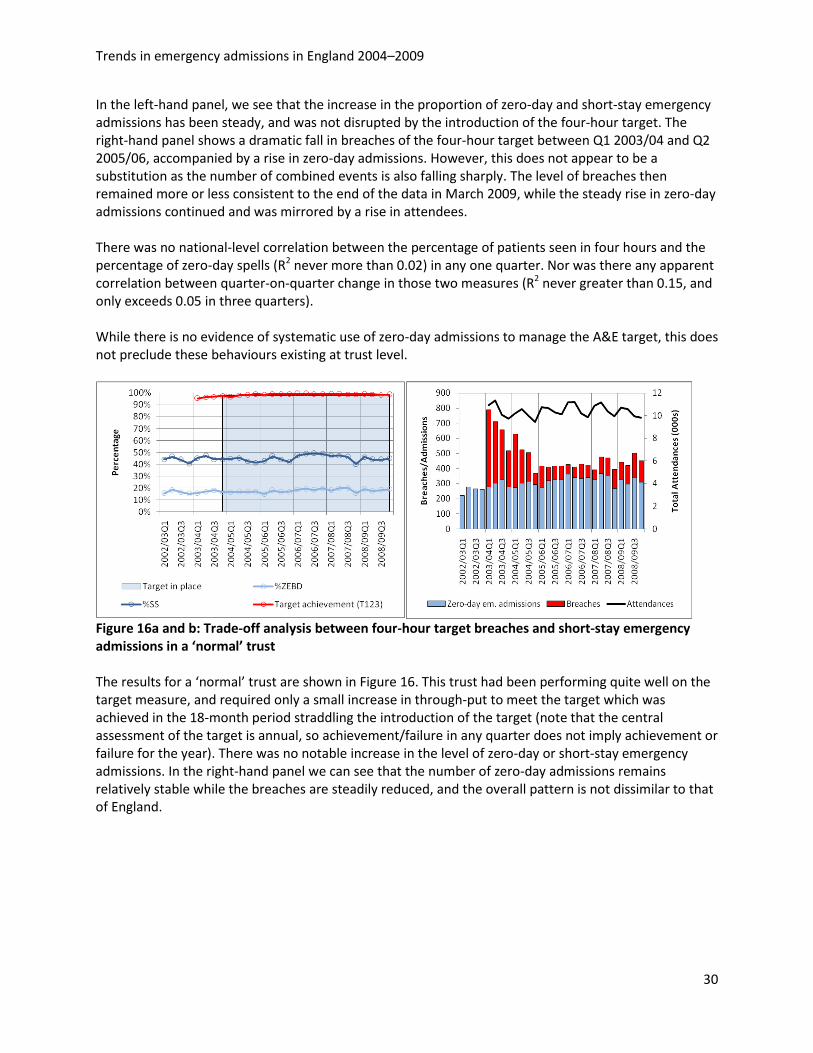
Figure 16a and b: Trade-off analysis between four-hour target breaches and short-stay emergency admissions in a ‘normal’ trust
The results for a ‘normal’ trust are shown in Figure 16. This trust had been performing quite well on the target measure, and required only a small increase in through-put to meet the target which was achieved in the 18-month period straddling the introduction of the target (note that the central assessment of the target is annual, so achievement/failure in any quarter does not imply achievement or failure for the year). There was no notable increase in the level of zero-day or short-stay emergency admissions. In the right-hand panel we can see that the number of zero-day admissions remains relatively stable while the breaches are steadily reduced, and the overall pattern is not dissimilar to that of England.
Trends in emergency admissions in England 2004–2009
31
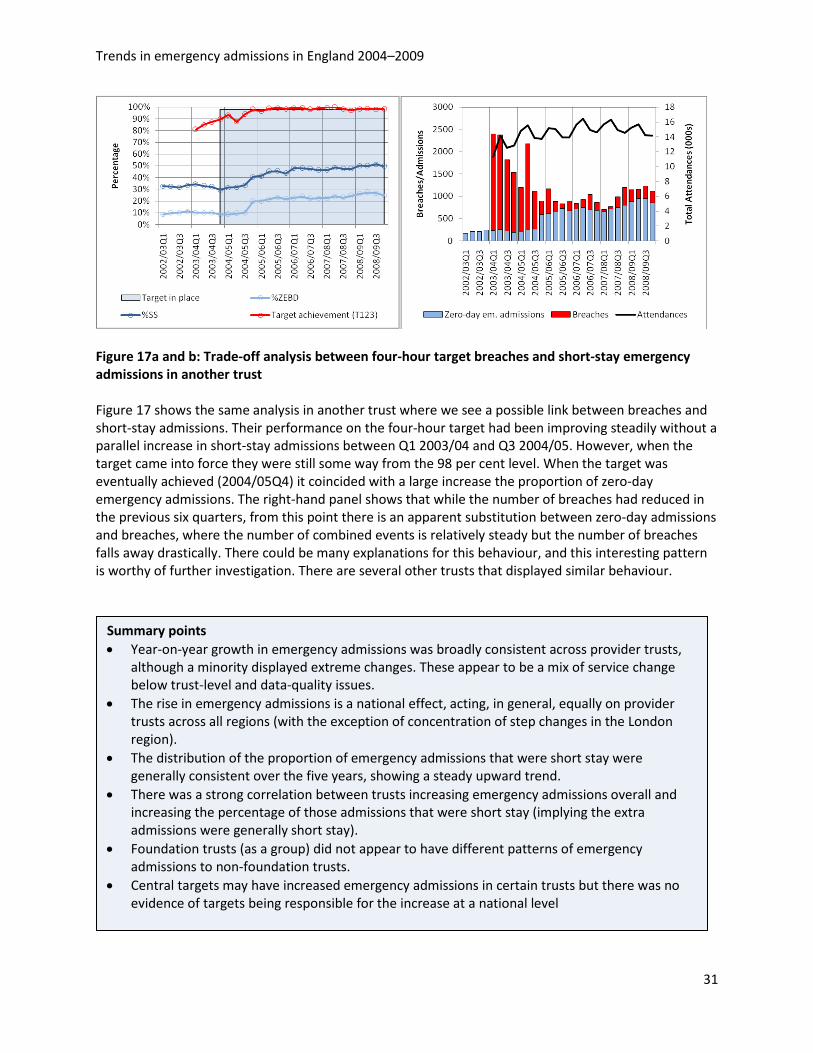
Figure 17a and b: Trade-off analysis between four-hour target breaches and short-stay emergency admissions in another trust
Figure 17 shows the same analysis in another trust where we see a possible link between breaches and short-stay admissions. Their performance on the four-hour target had been improving steadily without a parallel increase in short-stay admissions between Q1 2003/04 and Q3 2004/05. However, when the target came into force they were still some way from the 98 per cent level. When the target was eventually achieved (2004/05Q4) it coincided with a large increase the proportion of zero-day emergency admissions. The right-hand panel shows that while the number of breaches had reduced in the previous six quarters, from this point there is an apparent substitution between zero-day admissions and breaches, where the number of combined events is relatively steady but the number of breaches falls away drastically. There could be many explanations for this behaviour, and this interesting pattern is worthy of further investigation. There are several other trusts that displayed similar behaviour.
Summary points • Year-on-year growth in emergency admissions was broadly consistent across provider trusts,
although a minority displayed extreme changes. These appear to be a mix of service change below trust-level and data-quality issues.
• The rise in emergency admissions is a national effect, acting, in general, equally on provider trusts across all regions (with the exception of concentration of step changes in the London region).
• The distribution of the proportion of emergency admissions that were short stay were generally consistent over the five years, showing a steady upward trend.
• There was a strong correlation between trusts increasing emergency admissions overall and increasing the percentage of those admissions that were short stay (implying the extra admissions were generally short stay).
• Foundation trusts (as a group) did not appear to have different patterns of emergency admissions to non-foundation trusts.
• Central targets may have increased emergency admissions in certain trusts but there was no evidence of targets being responsible for the increase at a national level

Trends in emergency admissions in England 2004–2009
32
Trends in emergency admissions in England 2004–2009
33
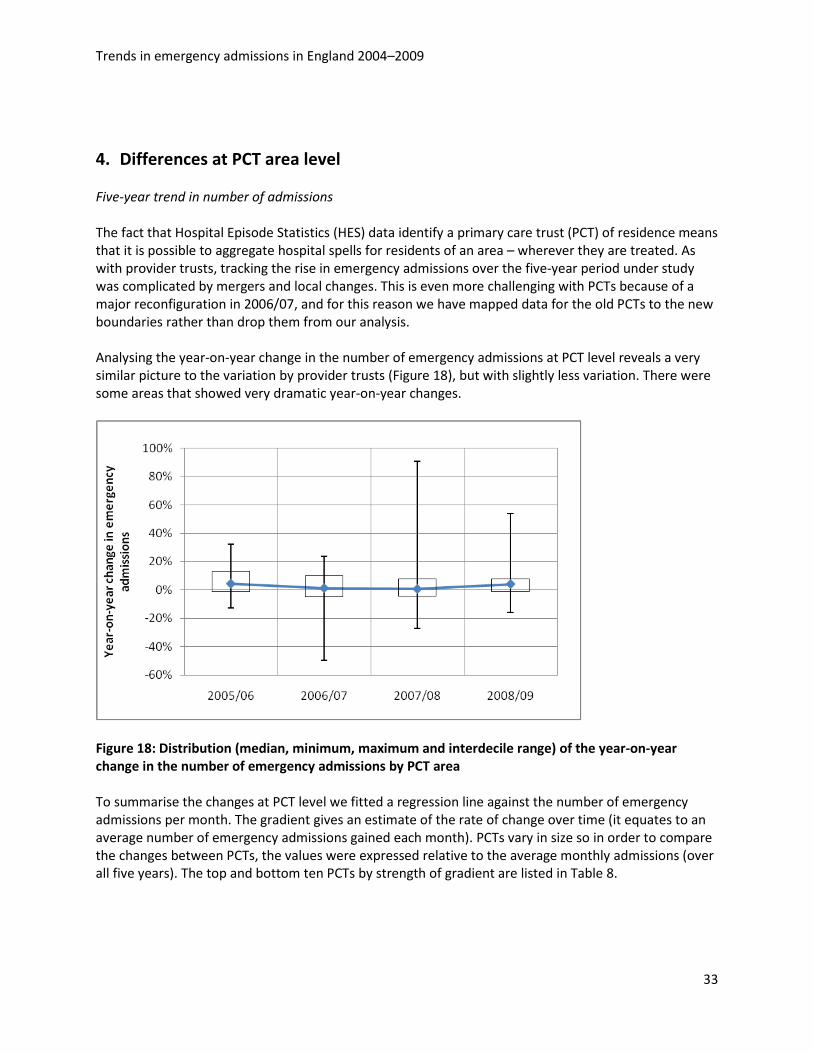
4. Differences at PCT area level Five-year trend in number of admissions The fact that Hospital Episode Statistics (HES) data identify a primary care trust (PCT) of residence means that it is possible to aggregate hospital spells for residents of an area – wherever they are treated. As with provider trusts, tracking the rise in emergency admissions over the five-year period under study was complicated by mergers and local changes. This is even more challenging with PCTs because of a major reconfiguration in 2006/07, and for this reason we have mapped data for the old PCTs to the new boundaries rather than drop them from our analysis. Analysing the year-on-year change in the number of emergency admissions at PCT level reveals a very similar picture to the variation by provider trusts (Figure 18), but with slightly less variation. There were some areas that showed very dramatic year-on-year changes.
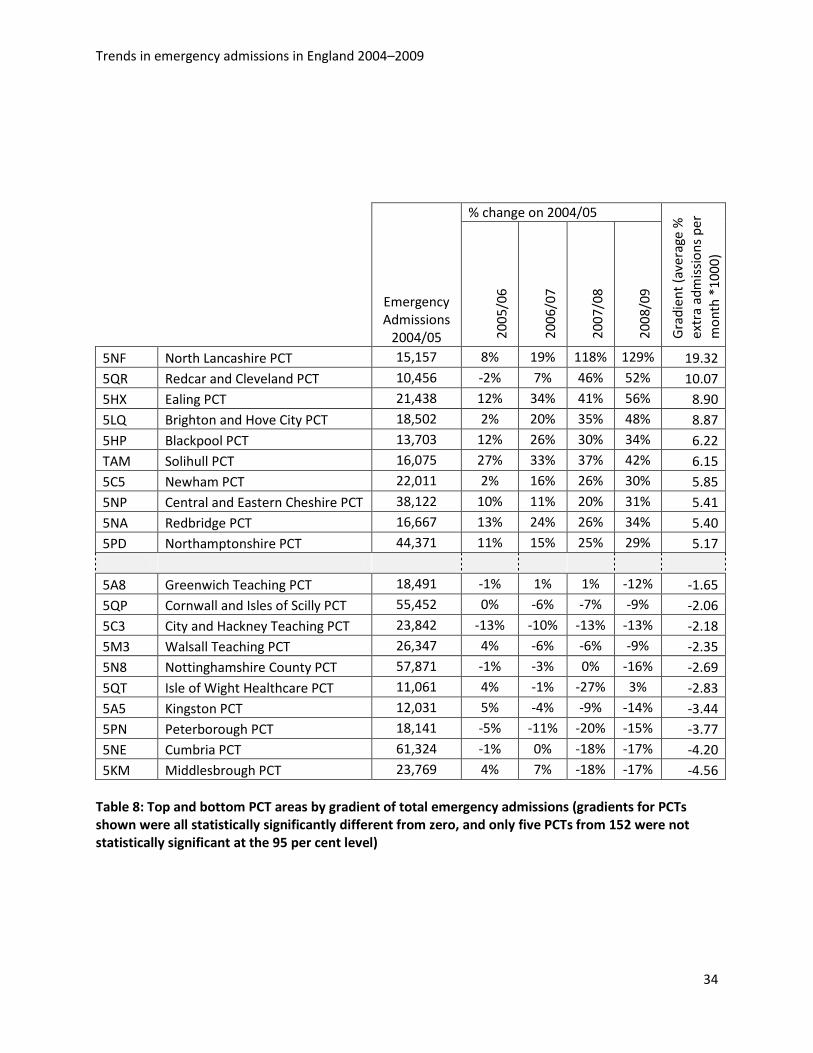
Figure 18: Distribution (median, minimum, maximum and interdecile range) of the year-on-year change in the number of emergency admissions by PCT area To summarise the changes at PCT level we fitted a regression line against the number of emergency admissions per month. The gradient gives an estimate of the rate of change over time (it equates to an average number of emergency admissions gained each month). PCTs vary in size so in order to compare the changes between PCTs, the values were expressed relative to the average monthly admissions (over all five years). The top and bottom ten PCTs by strength of gradient are listed in Table 8.
Trends in emergency admissions in England 2004–2009
34
Emergency Admissions
2004/05
% change on 2004/05
Gra
dien
t (av
erag
e %
ex
tra
adm
issi
ons
per
mon
th *
1000
)
2005
/06
2006
/07
2007
/08
2008
/09
5NF North Lancashire PCT 15,157 8% 19% 118% 129% 19.32 5QR Redcar and Cleveland PCT 10,456 -2% 7% 46% 52% 10.07 5HX Ealing PCT 21,438 12% 34% 41% 56% 8.90 5LQ Brighton and Hove City PCT 18,502 2% 20% 35% 48% 8.87 5HP Blackpool PCT 13,703 12% 26% 30% 34% 6.22 TAM Solihull PCT 16,075 27% 33% 37% 42% 6.15 5C5 Newham PCT 22,011 2% 16% 26% 30% 5.85 5NP Central and Eastern Cheshire PCT 38,122 10% 11% 20% 31% 5.41 5NA Redbridge PCT 16,667 13% 24% 26% 34% 5.40 5PD Northamptonshire PCT 44,371 11% 15% 25% 29% 5.17
5A8 Greenwich Teaching PCT 18,491 -1% 1% 1% -12% -1.65 5QP Cornwall and Isles of Scilly PCT 55,452 0% -6% -7% -9% -2.06 5C3 City and Hackney Teaching PCT 23,842 -13% -10% -13% -13% -2.18 5M3 Walsall Teaching PCT 26,347 4% -6% -6% -9% -2.35 5N8 Nottinghamshire County PCT 57,871 -1% -3% 0% -16% -2.69 5QT Isle of Wight Healthcare PCT 11,061 4% -1% -27% 3% -2.83 5A5 Kingston PCT 12,031 5% -4% -9% -14% -3.44 5PN Peterborough PCT 18,141 -5% -11% -20% -15% -3.77 5NE Cumbria PCT 61,324 -1% 0% -18% -17% -4.20 5KM Middlesbrough PCT 23,769 4% 7% -18% -17% -4.56
Table 8: Top and bottom PCT areas by gradient of total emergency admissions (gradients for PCTs shown were all statistically significantly different from zero, and only five PCTs from 152 were not statistically significant at the 95 per cent level)
Trends in emergency admissions in England 2004–2009
35
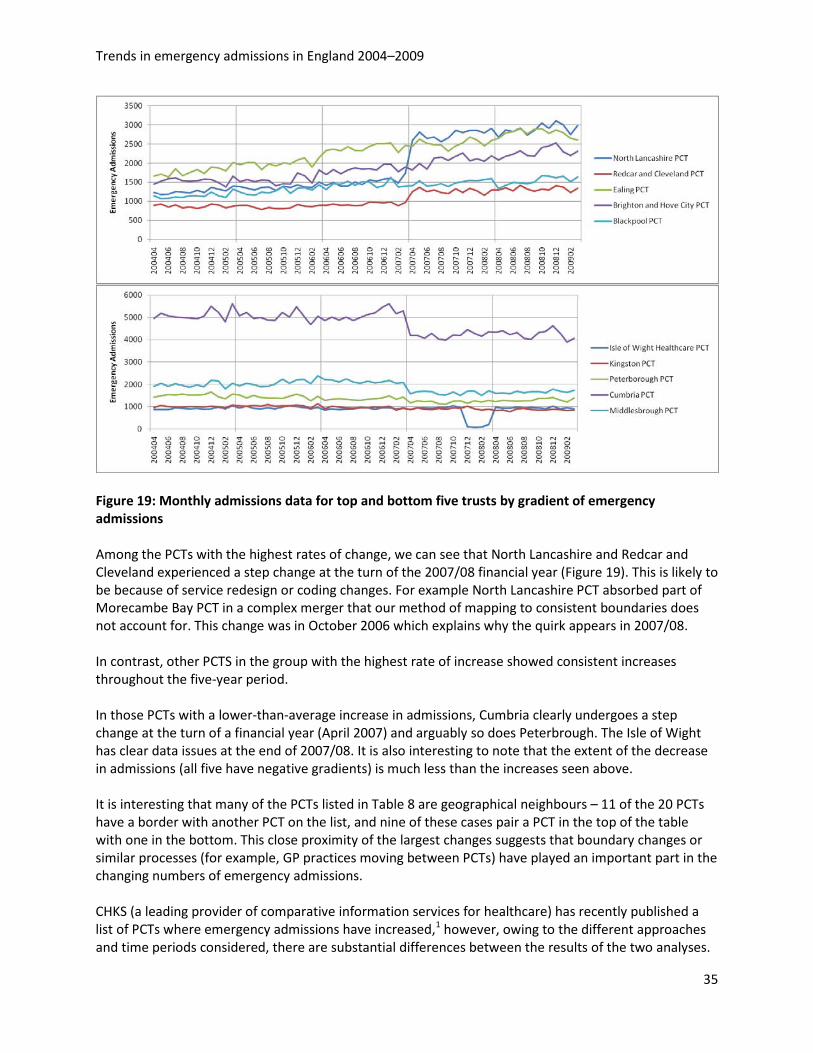
Figure 19: Monthly admissions data for top and bottom five trusts by gradient of emergency admissions Among the PCTs with the highest rates of change, we can see that North Lancashire and Redcar and Cleveland experienced a step change at the turn of the 2007/08 financial year (Figure 19). This is likely to be because of service redesign or coding changes. For example North Lancashire PCT absorbed part of Morecambe Bay PCT in a complex merger that our method of mapping to consistent boundaries does not account for. This change was in October 2006 which explains why the quirk appears in 2007/08. In contrast, other PCTS in the group with the highest rate of increase showed consistent increases throughout the five-year period. In those PCTs with a lower-than-average increase in admissions, Cumbria clearly undergoes a step change at the turn of a financial year (April 2007) and arguably so does Peterbrough. The Isle of Wight has clear data issues at the end of 2007/08. It is also interesting to note that the extent of the decrease in admissions (all five have negative gradients) is much less than the increases seen above. It is interesting that many of the PCTs listed in Table 8 are geographical neighbours – 11 of the 20 PCTs have a border with another PCT on the list, and nine of these cases pair a PCT in the top of the table with one in the bottom. This close proximity of the largest changes suggests that boundary changes or similar processes (for example, GP practices moving between PCTs) have played an important part in the changing numbers of emergency admissions. CHKS (a leading provider of comparative information services for healthcare) has recently published a list of PCTs where emergency admissions have increased,1 however, owing to the different approaches and time periods considered, there are substantial differences between the results of the two analyses.
Trends in emergency admissions in England 2004–2009
36
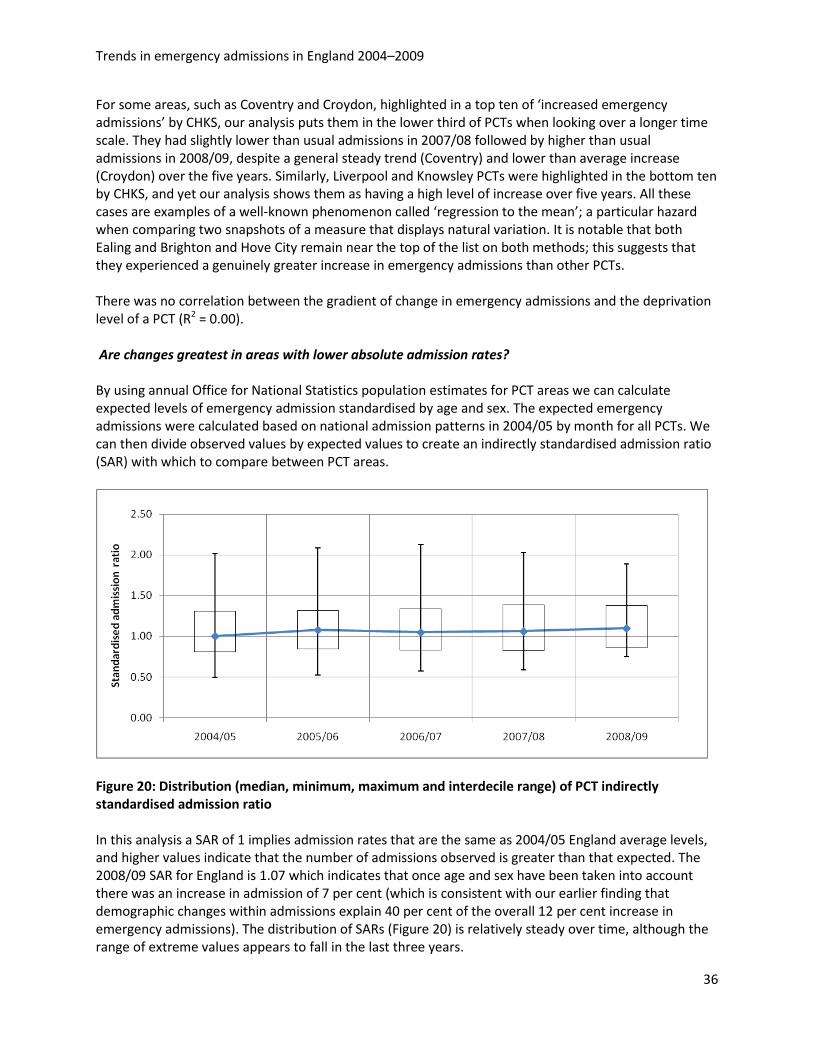
For some areas, such as Coventry and Croydon, highlighted in a top ten of ‘increased emergency admissions’ by CHKS, our analysis puts them in the lower third of PCTs when looking over a longer time scale. They had slightly lower than usual admissions in 2007/08 followed by higher than usual admissions in 2008/09, despite a general steady trend (Coventry) and lower than average increase (Croydon) over the five years. Similarly, Liverpool and Knowsley PCTs were highlighted in the bottom ten by CHKS, and yet our analysis shows them as having a high level of increase over five years. All these cases are examples of a well-known phenomenon called ‘regression to the mean’; a particular hazard when comparing two snapshots of a measure that displays natural variation. It is notable that both Ealing and Brighton and Hove City remain near the top of the list on both methods; this suggests that they experienced a genuinely greater increase in emergency admissions than other PCTs. There was no correlation between the gradient of change in emergency admissions and the deprivation level of a PCT (R2 = 0.00). Are changes greatest in areas with lower absolute admission rates? By using annual Office for National Statistics population estimates for PCT areas we can calculate expected levels of emergency admission standardised by age and sex. The expected emergency admissions were calculated based on national admission patterns in 2004/05 by month for all PCTs. We can then divide observed values by expected values to create an indirectly standardised admission ratio (SAR) with which to compare between PCT areas.
Figure 20: Distribution (median, minimum, maximum and interdecile range) of PCT indirectly standardised admission ratio In this analysis a SAR of 1 implies admission rates that are the same as 2004/05 England average levels, and higher values indicate that the number of admissions observed is greater than that expected. The 2008/09 SAR for England is 1.07 which indicates that once age and sex have been taken into account there was an increase in admission of 7 per cent (which is consistent with our earlier finding that demographic changes within admissions explain 40 per cent of the overall 12 per cent increase in emergency admissions). The distribution of SARs (Figure 20) is relatively steady over time, although the range of extreme values appears to fall in the last three years.
Trends in emergency admissions in England 2004–2009
37
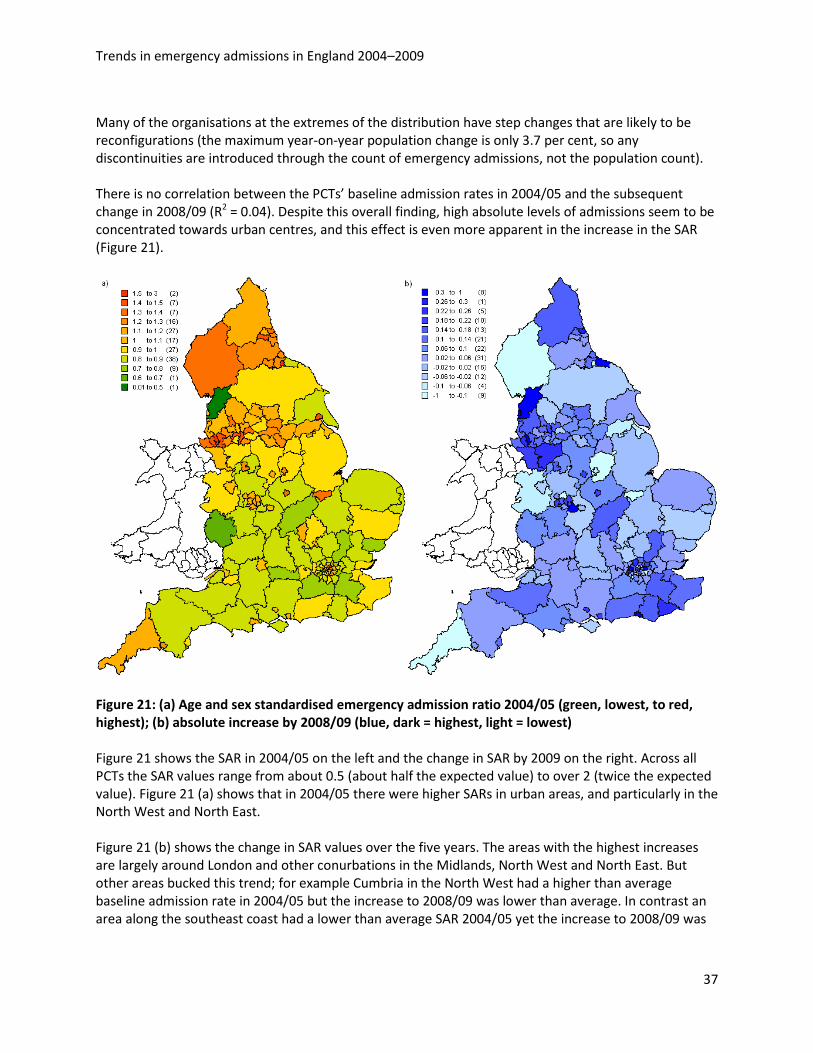
Many of the organisations at the extremes of the distribution have step changes that are likely to be reconfigurations (the maximum year-on-year population change is only 3.7 per cent, so any discontinuities are introduced through the count of emergency admissions, not the population count). There is no correlation between the PCTs’ baseline admission rates in 2004/05 and the subsequent change in 2008/09 (R2 = 0.04). Despite this overall finding, high absolute levels of admissions seem to be concentrated towards urban centres, and this effect is even more apparent in the increase in the SAR (Figure 21).
Figure 21: (a) Age and sex standardised emergency admission ratio 2004/05 (green, lowest, to red, highest); (b) absolute increase by 2008/09 (blue, dark = highest, light = lowest) Figure 21 shows the SAR in 2004/05 on the left and the change in SAR by 2009 on the right. Across all PCTs the SAR values range from about 0.5 (about half the expected value) to over 2 (twice the expected value). Figure 21 (a) shows that in 2004/05 there were higher SARs in urban areas, and particularly in the North West and North East. Figure 21 (b) shows the change in SAR values over the five years. The areas with the highest increases are largely around London and other conurbations in the Midlands, North West and North East. But other areas bucked this trend; for example Cumbria in the North West had a higher than average baseline admission rate in 2004/05 but the increase to 2008/09 was lower than average. In contrast an area along the southeast coast had a lower than average SAR 2004/05 yet the increase to 2008/09 was
Trends in emergency admissions in England 2004–2009
38
relatively large. As mentioned earlier, some of these cases are likely to have been influenced by regression to the mean. The SARs are strongly linked to deprivation as measured at PCT level by the Index of Multiple Deprivation 200740 (R2 = between 0.47 and 0.56, depending on year). Areas with higher levels of deprivation have on average higher levels of emergency admissions per head of population. However, there is no link between the change in standardised emergency admission rates and deprivation at the PCT level (R2 = 0.02). There is a weak negative correlation between population turnover (as measured by net internal migration flows43 and SAR (R2 between 0.11 and 0.16). This implies that there is a slight tendency for areas with low inward migration (or net outward migration) to have higher SARs. There was no correlation between population turnover and change in SAR (R2 = 0.03). Do integrated care organisations behave any differently? A study of two areas One question is whether organisations that integrate either primary, secondary health or social care demonstrate similar changes to the pattern of emergency admissions. This section explores two organisations with differing models of integrated care. The Isle of Wight NHS Primary Care Trust is in the unique position in England of being both a combined primary and secondary care organisation and having a naturally contained population. The PCT operates a single A&E unit on the island, and there are no additional minor incident units.44 Their total population is around 140,000. Despite being naturally contained as an island, 6.8 per cent of emergency admissions for residents are to hospitals other than the Isle of Wight (mainly Southampton or Portsmouth). Torbay Care Trust is an example of an integrated health and social care organisation, as opposed to vertical integration of primary and secondary care like the Isle of Wight PCT. Torbay’s majority provider of emergency hospital admissions is South Devon Healthcare, accounting for 91 per cent of emergency admissions that happen to Torbay residents. In both cases we compared the integrated care organisations to their top ten nearest neighbours using the Chartered Institute of Public Finance and Accountancy nearest neighbour methodology for comparing local authorities.45 The results are shown at PCT level, and although most LAs and PCTs are coterminous, one of the Isle of Wight’s and two of Torbay’s nearest neighbour local authorities have been excluded because they represent less than 95 per cent of the associated PCT.
Trends in emergency admissions in England 2004–2009
39
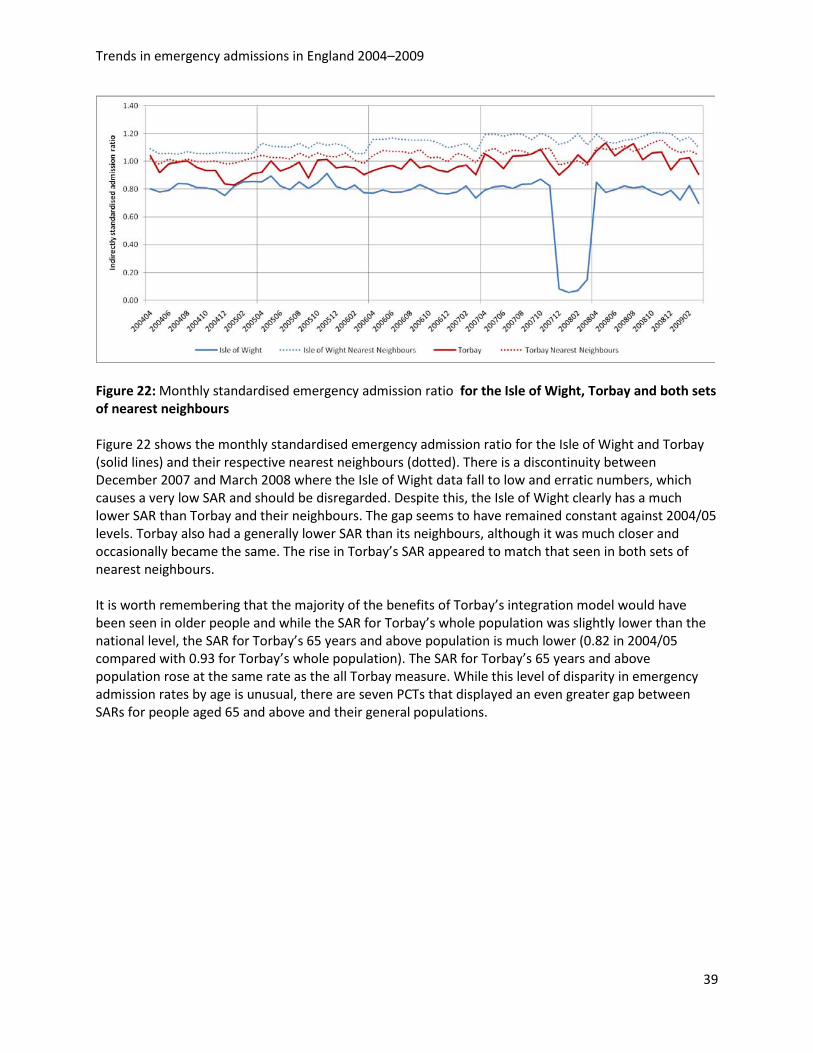
Figure 22: Monthly standardised emergency admission ratio for the Isle of Wight, Torbay and both sets of nearest neighbours Figure 22 shows the monthly standardised emergency admission ratio for the Isle of Wight and Torbay (solid lines) and their respective nearest neighbours (dotted). There is a discontinuity between December 2007 and March 2008 where the Isle of Wight data fall to low and erratic numbers, which causes a very low SAR and should be disregarded. Despite this, the Isle of Wight clearly has a much lower SAR than Torbay and their neighbours. The gap seems to have remained constant against 2004/05 levels. Torbay also had a generally lower SAR than its neighbours, although it was much closer and occasionally became the same. The rise in Torbay’s SAR appeared to match that seen in both sets of nearest neighbours. It is worth remembering that the majority of the benefits of Torbay’s integration model would have been seen in older people and while the SAR for Torbay’s whole population was slightly lower than the national level, the SAR for Torbay’s 65 years and above population is much lower (0.82 in 2004/05 compared with 0.93 for Torbay’s whole population). The SAR for Torbay’s 65 years and above population rose at the same rate as the all Torbay measure. While this level of disparity in emergency admission rates by age is unusual, there are seven PCTs that displayed an even greater gap between SARs for people aged 65 and above and their general populations.
Trends in emergency admissions in England 2004–2009
40
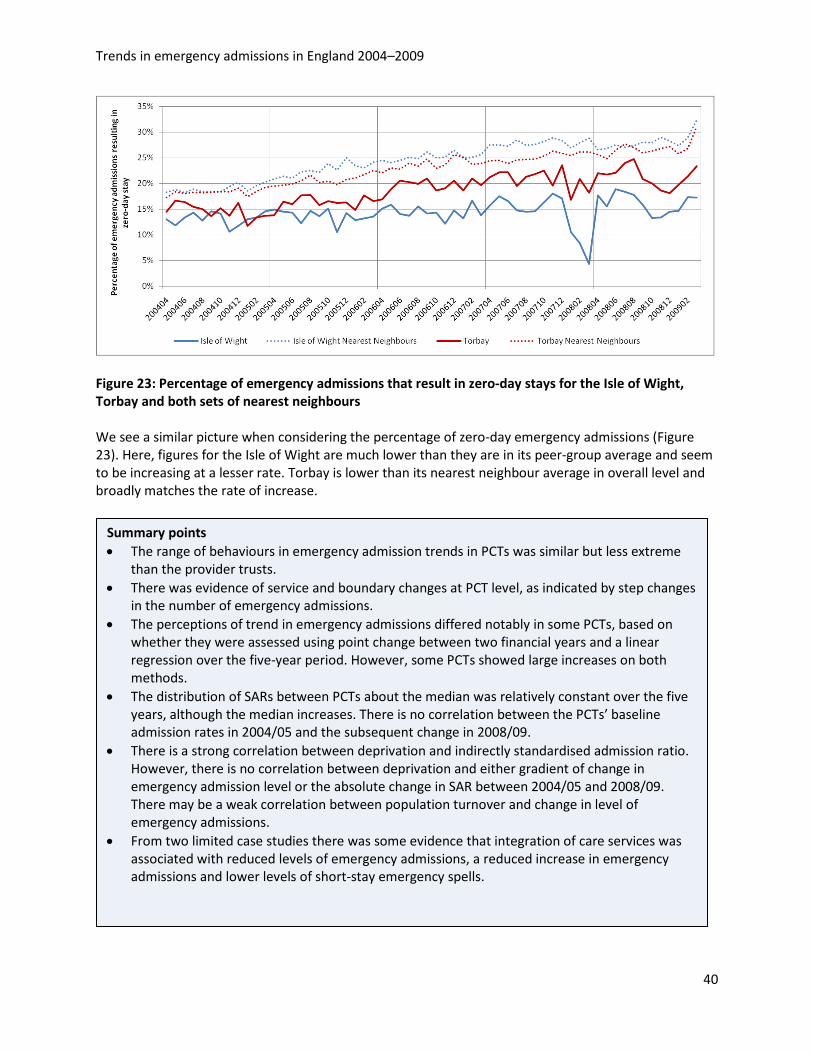
Figure 23: Percentage of emergency admissions that result in zero-day stays for the Isle of Wight, Torbay and both sets of nearest neighbours We see a similar picture when considering the percentage of zero-day emergency admissions (Figure 23). Here, figures for the Isle of Wight are much lower than they are in its peer-group average and seem to be increasing at a lesser rate. Torbay is lower than its nearest neighbour average in overall level and broadly matches the rate of increase.
Summary points • The range of behaviours in emergency admission trends in PCTs was similar but less extreme
than the provider trusts. • There was evidence of service and boundary changes at PCT level, as indicated by step changes
in the number of emergency admissions. • The perceptions of trend in emergency admissions differed notably in some PCTs, based on
whether they were assessed using point change between two financial years and a linear regression over the five-year period. However, some PCTs showed large increases on both methods.
• The distribution of SARs between PCTs about the median was relatively constant over the five years, although the median increases. There is no correlation between the PCTs’ baseline admission rates in 2004/05 and the subsequent change in 2008/09.
• There is a strong correlation between deprivation and indirectly standardised admission ratio. However, there is no correlation between deprivation and either gradient of change in emergency admission level or the absolute change in SAR between 2004/05 and 2008/09. There may be a weak correlation between population turnover and change in level of emergency admissions.
• From two limited case studies there was some evidence that integration of care services was associated with reduced levels of emergency admissions, a reduced increase in emergency admissions and lower levels of short-stay emergency spells.
Trends in emergency admissions in England 2004–2009
41
5 Discussion The results presented here have focused on the rise in emergency admissions in England over the five years from 2004/05 to 2008/09. The number of emergency admissions across England rose by 11.8 per cent over the five years – a total of approximately 1.35 million extra admissions. The five-year period under study highlights the most recent information available of a trend that has been evident for at least the last three decades, although the rate at which emergency admissions increased appeared to have accelerated in the five-year period. A similar increase in other aspects of demand for urgent care was also observed, for example, ambulance journeys and A&E attendances. Though emergency admissions rose there was a fall in emergency bed-day use and emergency admissions that end in death. We have presented commonly suggested causes for this rise and explored some of them using nationally available routine administrative data. • The rise in emergency admissions over the five years under study outstrips what might be expected
due to an aging population and is not concentrated as a disproportionate increase in any particular age group. When changing demographics are taken into account, the observed 11.8 per cent increase in emergency admissions is more like a 7.1 per cent rise in real terms between 2004 and 2009.
• Attendance at A&E has risen by a similar amount as admissions. The fact that most of the attendance increase is in A&E departments such as minor incident units suggests that these are mostly minor ailments. However, on average 24 per cent of attendees at major A&E units are admitted and this figure has been rising. If the issue were solely a shift in behaviour of patients to present with increasingly minor conditions, we would not expect a rise in admissions as A&E physicians would act as gatekeepers to the inpatient services.
• The vast majority of the increase in emergency admissions appears to be caused by an increase in zero-day and single-day admissions being admitted through A&E departments. The short length of stay suggests that these are low severity cases, and adds weight to the argument that the rise is being caused by a lack of alternative services or increasingly defensive medicine. The fact that the rise in zero-day admissions does not appear to be concentrated in any limited group of diagnoses, nor any particular age band indicates that this is an across-the-board effect. This is possibly unfeasibly widespread for a lowering of admission thresholds in condition-specific clinical protocols to be the cause.
• While the impact of central targets may increase emergency admissions in certain trusts, there is no evidence of this driving the increase at a national level.
There is a variation in emergency admission rates, levels of zero-day use and change in both factors between provider trusts and between primary care trust (PCT) areas. Some of this is undoubtedly due to local service reconfigurations and data quality issues, while deprivation has a strong influence on levels of emergency admission. However, deprivation levels do not explain the increase in emergency admissions and short-stay spells. The impact of the increasing plurality of access routes is difficult to measure. Many of the plural services will redirect to A&E if hospital admission is likely (therefore classed in data as admission through A&E) or are classified as admission through A&E in their own right. We have no data on trends in cases handled by these services that do not result in hospital admission.
Trends in emergency admissions in England 2004–2009
42
Based on two very limited case studies, there might be evidence of a possible limiting effect on emergency admissions caused by service configuration for integrated care. Of these two examples the model of vertical integration between primary and secondary care appears more powerful than horizontal integration of health and social care. It is possible that this is a reflection of the balance of incentives acting on the system relating to emergency admissions. This area would benefit from a more sophisticated analysis such as individual level-matched control groups applied over the five year time-span investigated here. A further case study suggests that downgrading A&E departments simply displaces admissions to the next nearest open A&E, although this is not associated with a notable rise in the crude case fatality rate. The potential reasons for the rise are many, but these can be roughly divided into ‘demand’ for care and ‘supply’ of care. On ‘demand’, the analysis shows that at most 40 per cent of the increase could be because of a growing number of older people in the population. Levels of self-reported health status have not shown a change and are unlikely to have contributed to the increase. Though patient expectations of treatment may be changing, decisions to admit a patient are made by doctors. On ‘supply’ reasons, better medical care is allowing patients to be discharged early and there are greater financial incentives on hospitals, which encourage early discharge. Earlier discharge will free up capacity in hospitals and allow hospital doctors the possibility of admitting more patients (so lowering the threshold for admission). In turn, the decision to admit will also be influenced by other ‘supply’ factors such as a lack of knowledge of, and confidence in, the quality of NHS care outside hospital, in particular primary care. Many decisions to admit are highly discretionary and are based on a number of clinical and non-clinical factors, for example the extent to which the patient and their carers, and services in the community, can effectively substitute for hospital care, or the increasing practice of defensive medicine (where extra caution creates its own demand).There may be changes in doctors’ attitudes to risk: for hospital doctors when beds are available it becomes easier and less risky to admit, especially as there may be little knowledge and communication between doctors in hospital and clinicians supporting patients outside; GPs may have little training in A&E medicine and lack confidence in providing the level of ambulatory care required. As a result, care is often fragmented, and ill coordinated. The impact of the four-hour maximum waiting time target in A&E departments (in providing incentives for hospitals to admit patients who have waited nearly four hours) appears to have had a marginal effect on admissions across England, although a greater effect in specific NHS trusts. Foundation status does not appear to be associated with the rise. We conclude, like others, that the introduction of Payment by Results also does not seem to be associated with the rise, although it is associated with shorter lengths of stay in hospitals.11 It could be that a combination of these policies has contributed to the steeper increase in emergency admissions around 2004/05 and this should be investigated further. The paradox is that earlier discharge will in turn free up capacity and thus allow doctors to admit more patients. The findings from this study show that while attendances at major A&E departments rose by only 1.2 per cent, emergency admission from these departments rose by 14.3 per cent. Greater efficiency (shorter days in hospital for each admitted patient) has probably led to more ‘inefficiency’ (increasing the number of less severe cases admitted as emergencies).

Trends in emergency admissions in England 2004–2009
43
There were an extra 594,000 emergency admissions in 2008/09 alone (compared with 2004/05) costing at least an additional £330 million a year. The current financial squeeze on the NHS and the need for efficiency savings of £20 billion by 2014 mean that ways to understand and stem this demand appropriately are urgently needed. It is critical that future reform should focus on how to reduce hospital care where it is preventable and avoidable. There are many different service innovations aimed at improving how demand factors are managed and some can have short-term local impacts. However, putting in place better out-of-hospital care and reducing the number of hospital beds is unlikely to be enough – there needs to be more fundamental reshaping and incentives in the health system towards robustly managed coordinated care. Action could take place at three levels: Policy-makers should continue to scrutinise and reform the system for reimbursing hospitals and primary care so that avoidable admissions are discouraged. There is a need to understand more fully the contribution of inadequate out-of-hospital care to the rise in admissions and what can be done to improve it. In particular pilot attempts to link hospital care more with out-of-hospital care providers (primary care, community services and social care) that aim to promote more coordinated care so that patients are treated in the most appropriate and cost-effective setting. Policy-makers could craft better financial incentives, or allow the local NHS to craft them – that encourage providers to keep people well so that admission is avoided, and discourage admission to hospital unless absolutely necessary. Policy-makers should allow the closure of more hospitals and beds. The Coalition Government has stated that closures are a matter for the local NHS to decide, but these decisions are politically fraught, especially in the face of apparently increasing admissions, beds full of emergency patients, lack of confidence by hospital doctors in the capacity of primary care and community services either to prevent the need for hospital care or substitute for it. Encouraging the local development of coordinated care is more complex but in the long run likely to lead to better care for patients and reduced emergency admissions. The policy should be to encourage links between hospital care and out-of-hospital care providers (primary and community services) and give both incentives to keep people well so that admission is avoided and disincentives to admit patients to hospital unless absolutely necessary. Better links between clinicians in hospital and primary/community services will allow the joint crafting of care pathways and protocols, and the development of information about care that can be shared and peer-reviewed to assess its quality for patients. For example, better incentives to reduce avoidable emergency admissions could take the form of the PCT giving groups of hospitals, general practices and community services a joint risk-adjusted capitated budget for the local population registered with those practices46 and the freedom to keep any surplus to invest in improving care. This would encourage more proactive care for people identified as being at high risk of admission,47 and better quality ambulatory care to reduce the risk of admission. These ideas are in circulation at present and being developed in key sites in the NHS under the rubric of ‘integrated care’.48,49 Regulators should develop ways of assessing the quality of care across different providers, use avoidable emergency admission as an undesirable outcome measure and assess the compliance of providers in reducing them. Local clinicians and managers (including GP commissioners) should work with patients to identify how they could be better supported to reduce the risk of ill health and admission. For example, they could:
Trends in emergency admissions in England 2004–2009
44
• review how clinical decisions to admit patients to hospital are made and improve them • develop higher-quality out-of-hospital care for patients to reduce the need for emergency
admissions • create more coordinated care between hospital and out-of-hospital settings, for example through
easier lines of communication between admitting clinicians, better management of care pathways between hospitals and general practices, shared information and peer review between providers on the use, cost and outcomes of care for individual patients.
There could be more action locally to identify the patients at high risk of future admission, using risk stratification techniques,50 to target for personalised support, an evaluation of the impact on emergency admissions. More fundamentally, local clinicians and managers should ensure that shorter stays for admitted patients, which free up beds available for care, are translated into reducing the number of hospital beds, rather than further lowering the threshold for hospital admission. The clinical, as well as economic case for this, needs to be made strongly by clinicians. In particular there may be useful lessons from NHS trusts in which emergency admissions have declined, and those in which admissions have been far higher than the national average. Without such change, future rises in emergency admissions – with all the avoidable human and financial cost they represent – are guaranteed.
Trends in emergency admissions in England 2004–2009
45
References
1. Robinson P (2010) Are Emergency Admissions in England Out of Control? London: CHKS.
2. Gillam S (2010) ‘Rising hospital admissions’, British Medical Journal, vol 340, 275–276.
3. Hobbs R (1995) ‘Rising emergency admissions’, British Medical Journal, vol 310, 207–208.
4. Campbell WB, Lee EJK, Van de Sijpe K, Gooding J and Copper MJ (2002) ‘A 25-year study of emergency surgical admissions’, Annals of the Royal College of Surgeons of England, vol 84, 273–277.
5. Patel AR (1971) ‘Modes of admission to hospital: a survey of emergency admissions to a General Medical Unit’, British Medical Journal, vol 1: 281–283.
6. Bagust A, Place M and Posnett JW (1999) ’Dynamics of bed use in accommodating emergency admissions: stochastic simulation model’, British Medical Journal, vol 319, 155–158.
7. Sibly E, Wiskin CM, Holder RL and Cooke MW (2007) ‘Short stay emergency admissions to a West Midlands NHS trust: a longitudinal descriptive study, 2002–2005’, Emergency Medicine Journal, vol 24, 553–557. 8. Blatchford O and Capewell S (1997) ‘Emergency medical admissions: taking stock and planning for winter’, British Medical Journal, vol 315, 1322–1323.
9. West D (2010) ‘A&E alternatives “confuse” the public’, Health Service Journal, 25 March.
10. Information Centre for Health and Social Care (2009) Further Analysis of the Published 2007–08 A&E HES Data (Experimental Statistics). Leeds: Information Centre.
11. Farrar S, Yi D, Sutton M, Chalkley M, Sussex J and Scott A (2009) ‘Has payment by results affected the way that English hospitals provide care? Difference-in-differences analysis’, British Medical Journal, vol 339, 3047. 12. Dunstan E (2010) Fuelled by risk avoidance’, British Medical Journal, vol 340, 1048.
13. Morgan K, Prother D and Frankel S (1999) ‘The rise in emergency admissions – crisis or artefact?’ British Medical Journal, vol 319, 158–159.
14. Kendall, L (2009) ‘On urgent care efficiency’, Health Service Journal, 19 Nov.
15. Coast J, Inglis A, Morgan K, Gray S, Kammerling M and Frankel, S (1995) ‘The hospital admissions study in England: are there alternatives to emergency hospital admission?’ Journal of Epidemiology and Community Health, vol 49, 194–199.
Trends in emergency admissions in England 2004–2009
46
16. Thorlby R and Maybin J (2010) A High-performing NHS? A review of progress 1997–2010. London: The King’s Fund.
17. Frankel S, Ebrahim S and Davey-Smith G (2000) ‘The limits to demand for health care’, British Medical Journal, vol 321, 40–44.
18. Information Centre for Health and Social Care (2009) Hospital Episode Statistics. Leeds: Information Centre.
19. Department of Health (2010) Quarterly Monitoring of Accident and Emergency. London: Department of Health.
20. Information Centre for Health and Social Care (2009) Trends in Consultation Rates in General Practice 1995–2009. Leeds: Information Centre.
21. Information Centre for Health and Social Care (2009) Ambulance services in England 2008–09. Leeds: Information Centre.
22. Ministry of Justice (2007) Judicial and Court Statistics. London: Ministry of Justice.
23. Department for Work and Pensions Information Directorate (2010) Work and Pensions Longitudinal Study. London: DWP.
24. Communities and Local Government (2010) Fire and Rescue Service Operational Statistics. London: CLG.
25. Information Centre for Health and Social Care (2009) Health Survey for England – 2008 adult trend tables. Leeds: Information Centre.
26. Raspin C (2008) Cut short hospital stays to lower admission’, Health Service Journal, 4 December.
27. Audit Commission (2008) Short stay emergency admissions – Questions a PCT should ask. London: Audit Commission.
28. Council of International Hospitals (1996) Confronting the Challenge: Seven tactics for managing the rise in emergency admissions. London: Council of International Hospitals.
29. Carson D, Clay H and Stern (2010) Primary Care and Emergency Departments. London: Primary Care Foundation.
30. Department of Health (2009) Payment by Results Draft Guidance for 2010–11. London: DH.
31. Hensher M, Edwards N and Stokes R (1999) International Trends in the Provision and Utilisation of Hospital Care’, British Medical Journal, vol 319, 845–848.
32. Kendrick S (1996) ‘The pattern of increase in emergency hospital admissions in Scotland’, Health Bulletin, vol 54, 169–183.
Trends in emergency admissions in England 2004–2009
47
33. Blatchford O and Capewell S (1999) ‘Rise has been real in Glasgow’, British Medical Journal, vol 319, 1201.
34 ISD Scotland (2009) Inpatient, Day Case and Outpatient Activity: Multiple and all emergency admissions. Edinburgh: ISD Scotland.
35. National Centre for Health Outcomes Development (2010) Compendium of Clinical and Health Indicators. Leeds: Information Centre.
36. Department of Health (2009) National Reference Costs. London: DH.
37. Department of Health (2004) National Standards, Local Action: Health and Social Care Standards and Planning Framework 2005/06–2007/08. London: DH.
38. Department of Health (2009) Departmental Report 2009. The Health and Personal Social Services Programme. London: DH.
39. Department of Health (2008) The Operating Framework Vital Signs. London: DH.
40. Communities and Local Government (2008) Indices of Deprivation 2007. London: CLG.
41. World Health Organisation (2007) International Statistical Classification of Diseases and Related Health Problems 10th Revision Version for 2007. Geneva: WHO.
42. Department of Health (2000) The NHS Plan: A plan for investment, a plan for reform. London: Department of Health.
43. Office for National Statistics (2008) Internal Migration Estimates. Newport: Office of National Statistics.
44. Department of Health (2010) NHS Choices. www.nhs.uk/Pages/HomePage.aspx.
45. Chartered Institute of Public Finance and Accountancy (2010) Nearest Neighbours Models. www.cipfastats.net/resources/nearestneighbours/default.asp.
46. Dixon J and others (forthcoming, 2010) Developing a Person-based Risk-adjusted Resource Allocation Formula for Allocations to General Practices in England. London: Nuffield Trust.
47. Billings J, Dixon J, Mijanovich T and Wennberg D (2006) ‘Case finding for patients at risk of readmission to hospital: development of algorithm to identify high risk patients’, British Medical Journal, vol 333 (7563): 327.
48. Lewis R, Rosen R, Goodwin N and Dixon J (2010) Where Next for Integrated Care Organisations in the English NHS? London: Nuffield Trust and The King’s Fund.
49. Smith JA, Wood J and Elias J (2009) Beyond Practice-based Commissioning: The local clinical partnership. London: Nuffield Trust and NHS Alliance.

Trends in emergency admissions in England 2004–2009
48
50. King’s Fund (2006) Predicting and Reducing Readmission to Hospital. London: The King’s Fund.
Trends in emergency admissions in England 2004–2009
49
Appendix 1 – Casting spells Emergency admissions were defined as anywhere that the admission method field (ADMIMETH)began with ‘2’. This covers:
21 = Emergency: via Accident and Emergency (A&E) services, including the casualty department of the provider 22 = Emergency: via general practitioner (GP) 23 = Emergency: via Bed Bureau, including the Central Bureau 24 = Emergency: via consultant outpatient clinic 28 = Emergency: other means, including patients who arrive via the A&E department of another healthcare provider
The method for assigning primary diagnosis and length of stay to emergency spells was: • Spells were assigned to the month of admission, irrespective of discharge date or in which data year
they appear. • An emergency admission is anywhere that ADMIMETHbegins with ‘2’. • Episodes that have the episode order field (EPIORDER) = 1 and the spell ending field (SPELEND) = Y
are self-contained spells that require no further processing. • Spells that have multiple episodes must be aligned to allow us to capture initial primary diagnosis
and specialty alongside spell duration and discharge method (usually only recorded for the final episode in the spell).
• This is achieved by selecting all episodes where EPIORDER = 1 and SPELEND <> Y and linking these to all episodes where EPIORDER <> 1 and SPELEND = Y, joining on the unique annonymised patient ID (XHESID) and admission date field (ADMIDATE)
• There are a handful of opening episodes with no matching closing episode – these are assumed to be coding errors for the most part. They will be negligible in terms of the analysis with the exception of spell duration, for which we have a strategy in place.
• Spells that were not discharged as of 31 March 2009 were excluded from calculations involving total emergency bed days consumed and added to the 11+ category for calculations categorising spells by number of bed days used.
Appendix 2 – Classifying admission patterns Admission patterns in acute provider trusts were classified using the following method: • Any trust with one or more months where the count is less than 25 per cent of that trust’s average
monthly count is classified as a potential data issue. • For each month we apply two linear regressions; one from the start month to the current month,
and the other from the next month to the end month. The month with the lowest residual sum across both regressions is selected as the month by which to judge change.
• Any trust where difference between the admission count in the change month and the month after is greater than 15 per cent of the average monthly count is classified as having a step change.
• Any trust that does not have a step change but does have gradient ratio (see below) of less than 0.75 is classified as having a ‘kink’, that is two separate admissions patterns that switches at a given point in time.

Trends in emergency admissions in England 2004–2009
50
• If the trust is not any of the above classifications, it is classed as a steady trend and assigned as high, low or reducing if the admissions for full financial year 2008/09 represent growth on 2004/05 of above the average for the 150 trusts (‘high’), below average (‘low’) or negative (‘reducing’).
The gradient ratio is designed to express the difference between the gradients of the before and after regressions. If it is 1, then the two gradients are identical. It is calculated as the modulus of the smaller gradient plus 100 divided by the modulus of the larger plus 100. We add 100 to the top and bottom to ensure the metric is stable when the gradients are close to zero.
Nuffield Trust 59 New Cavendish StreetLondon W1G 7LPEmail: [email protected] www.nuffieldtrust.org.uk
© Nuffield Trust 2010. Not to be reproduced without permission.
Nuffield Trust
The Nuffield Trust is a charitable trust carrying out research and health policy analysis on health services. Our focus is on the reform of health services to improve the efficiency, effectiveness, equity and responsiveness of care.
Key current work themes include:
• efficiency in healthcare
• commissioning
• the future organisation and delivery of care
• competition policy
• UK and national and international comparisons.
Trends in Emergency Admissions in England 2004–2009
This report forms part of our efficiency work theme. A major programme of Trust work in this area, New Frontiers in NHS Efficiency, is currently underway. Full details are available on our website.
Further copies of this report can be downloaded from: www.nuffieldtrust.org.uk/publications
Keep in touch
For more information on our work programme and to sign up to receive our regular e-newsletter, visit www.nuffieldtrust.org.uk


![Odontogenic Abscess-Related Emergency Hospital Admissions: …downloads.hindawi.com/journals/bmri/2018/3504727.pdf · BioMedResearchInternational IncontrasttothestudyofKaraetal.[],astatistically](https://img.pdfslide.us/doc/110x75/5c8b6c6c09d3f2016f8c5133/odontogenic-abscess-related-emergency-hospital-admissions-biomedresearchinternational.jpg)