Embed Size (px)
DESCRIPTION
Trends in Child Welfare Outcomes. CA Blue Ribbon Commission May1, 2013. The Performance Indicators Project is a collaboration of the California Department of Social Services and UC Berkeley, and is supported by CDSS , and the Stuart Foundation. National Trends. - PowerPoint PPT Presentation
Citation preview
Trends in Child Welfare Outcomes
CA Blue Ribbon CommissionMay1, 2013
The Performance Indicators Project is a collaboration of the California Department of Social Services and UC Berkeley, and is supported by CDSS , and the Stuart Foundation.
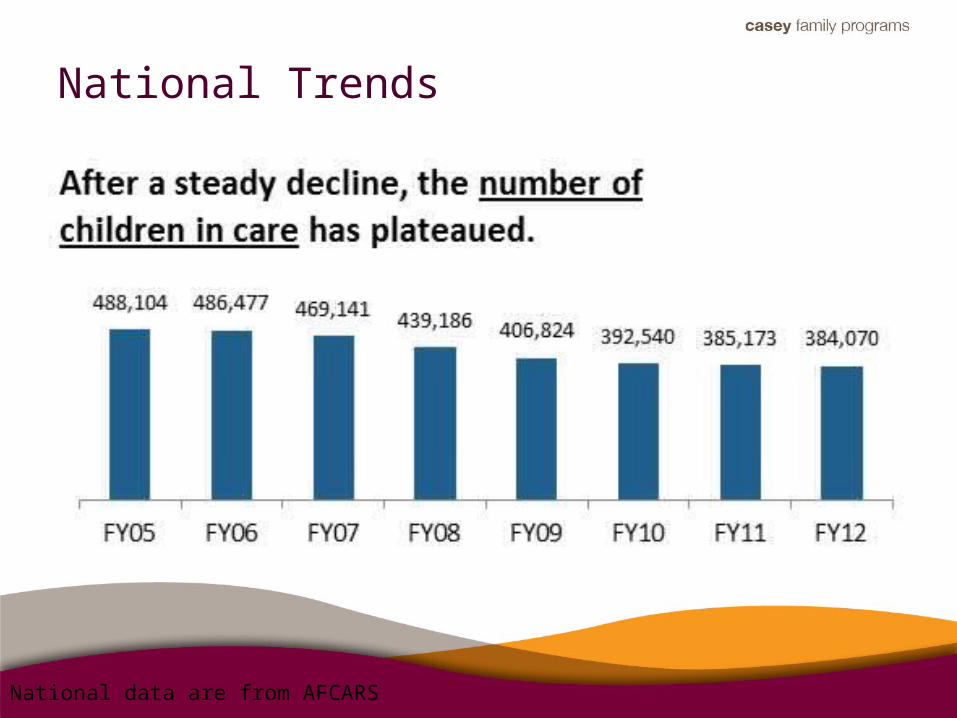
National Trends
National data are from AFCARS
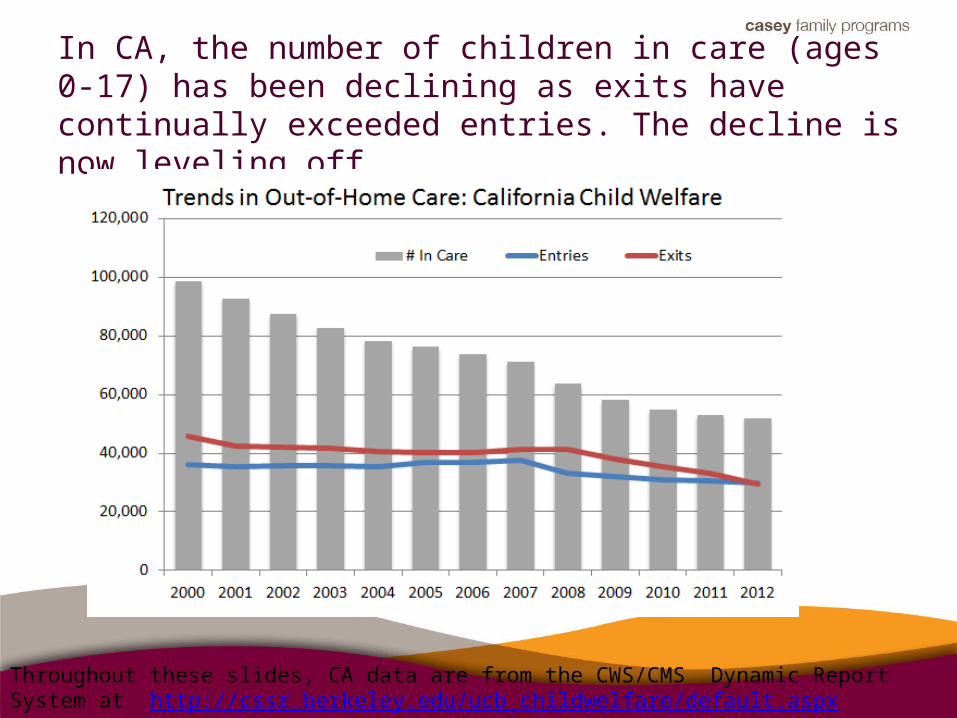
In CA, the number of children in care (ages 0-17) has been declining as exits have continually exceeded entries. The decline is now leveling off.
Throughout these slides, CA data are from the CWS/CMS Dynamic Report System at http://cssr.berkeley.edu/ucb_childwelfare/default.aspx National data are from AFCARS
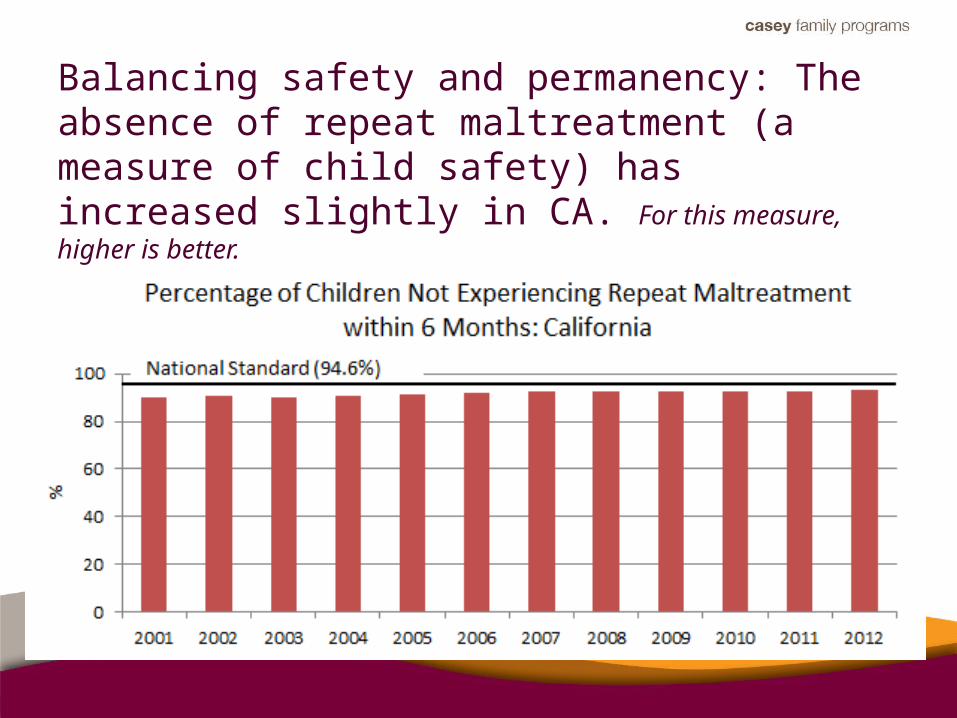
Balancing safety and permanency: The absence of repeat maltreatment (a measure of child safety) has increased slightly in CA. For this measure, higher is better.
CHILDREN ENTERING CAREState and Counties
Key Questions: Entries
• What is the entry rate – by age/race?• Are entries increasing/decreasing? for all
groups?• How many children enter and exit within just a
few days?• What are the reasons for removal?• What strategies/service are in place/planned to
reduce entries (and re-entries) into care?
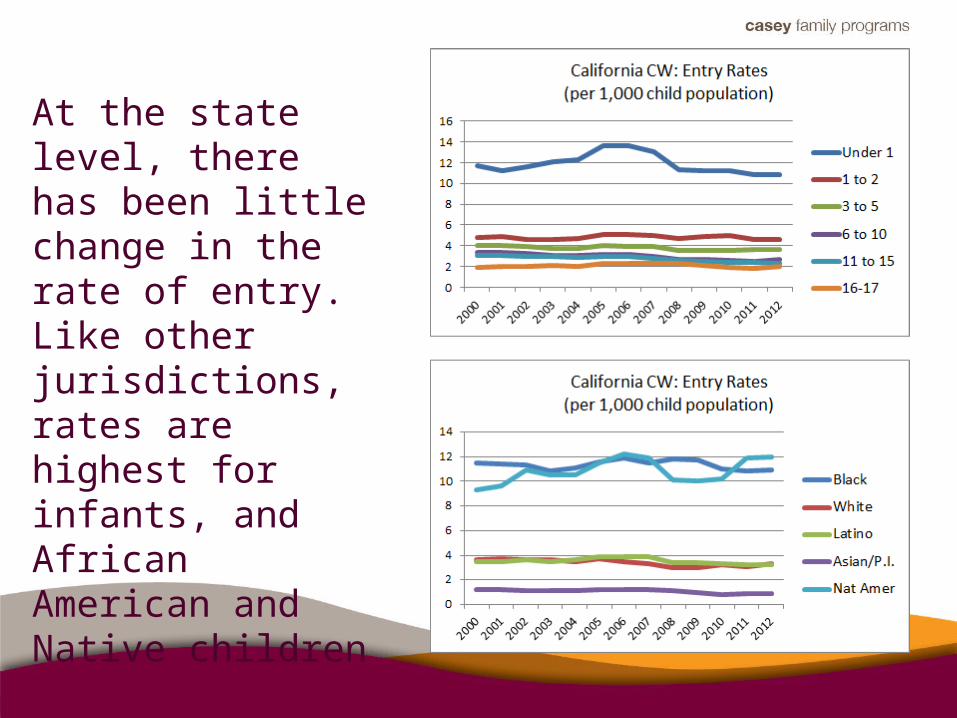
At the state level, there has been little change in the rate of entry. Like other jurisdictions, rates are highest for infants, and African American and Native children
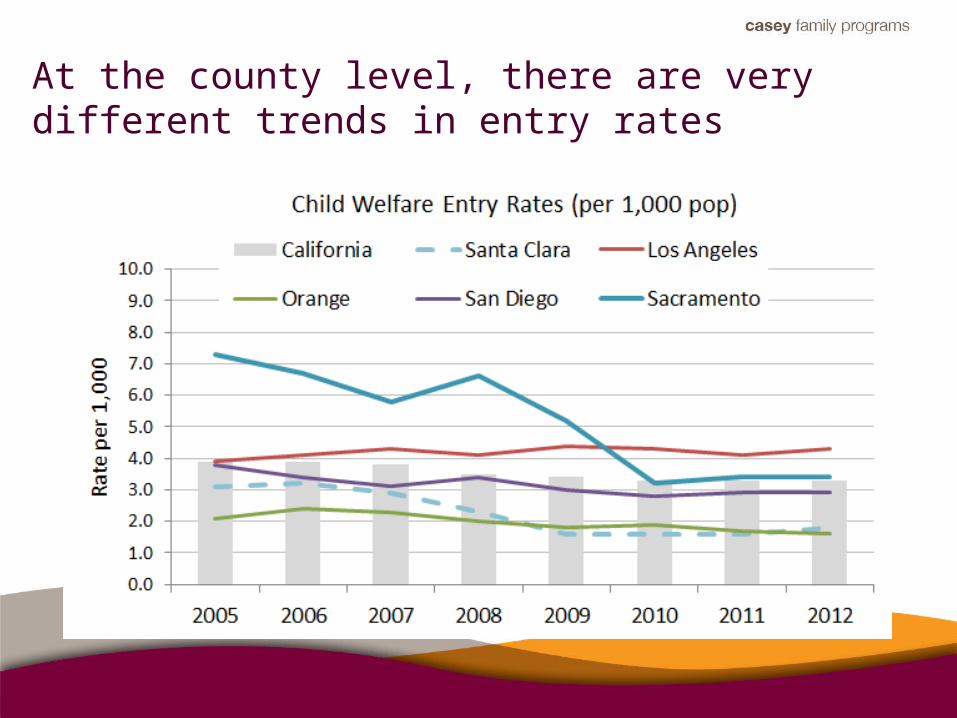
At the county level, there are very different trends in entry rates
PERMANENCYState and Counties
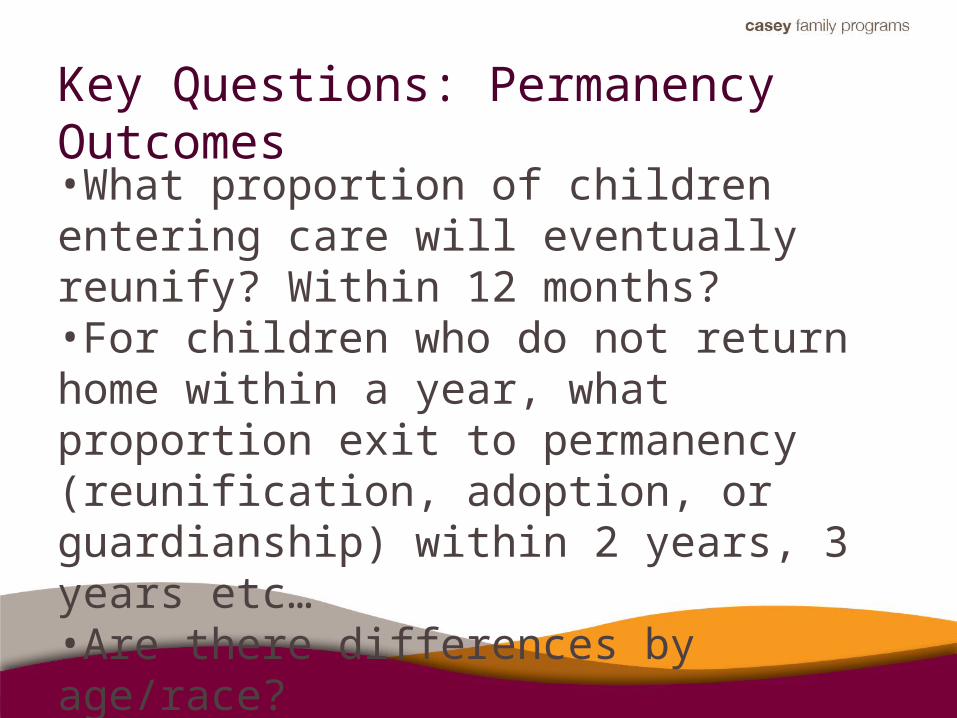
Key Questions: Permanency Outcomes
•What proportion of children entering care will eventually reunify? Within 12 months?•For children who do not return home within a year, what proportion exit to permanency (reunification, adoption, or guardianship) within 2 years, 3 years etc… •Are there differences by age/race?•Is the trends changing over time?
TIMELY REUNIFICATIONAchieving Permanency
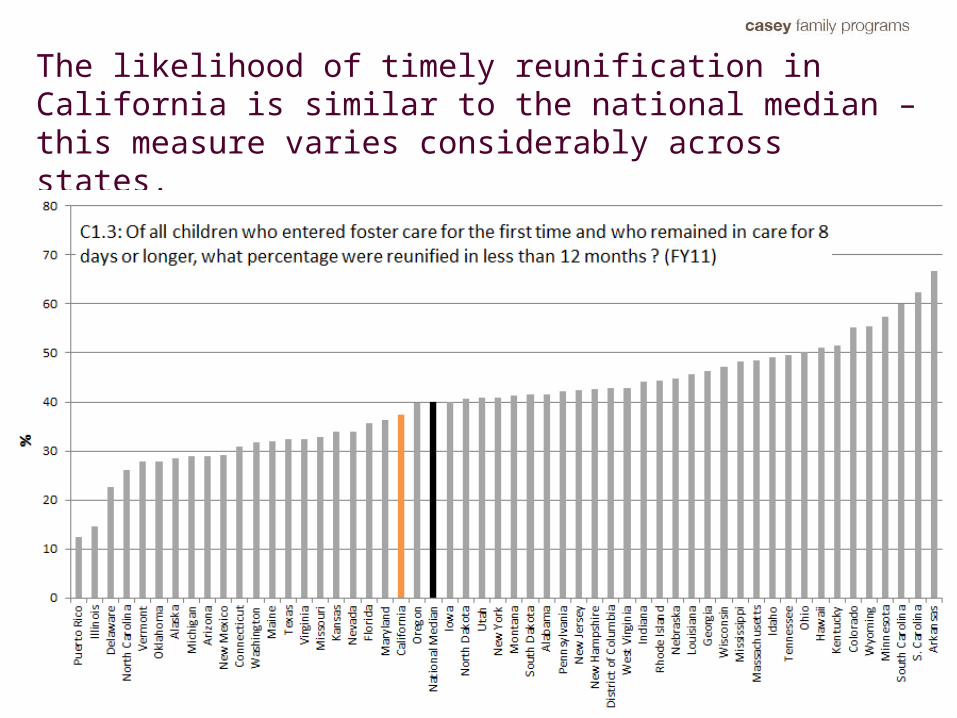
The likelihood of timely reunification in California is similar to the national median – this measure varies considerably across states.
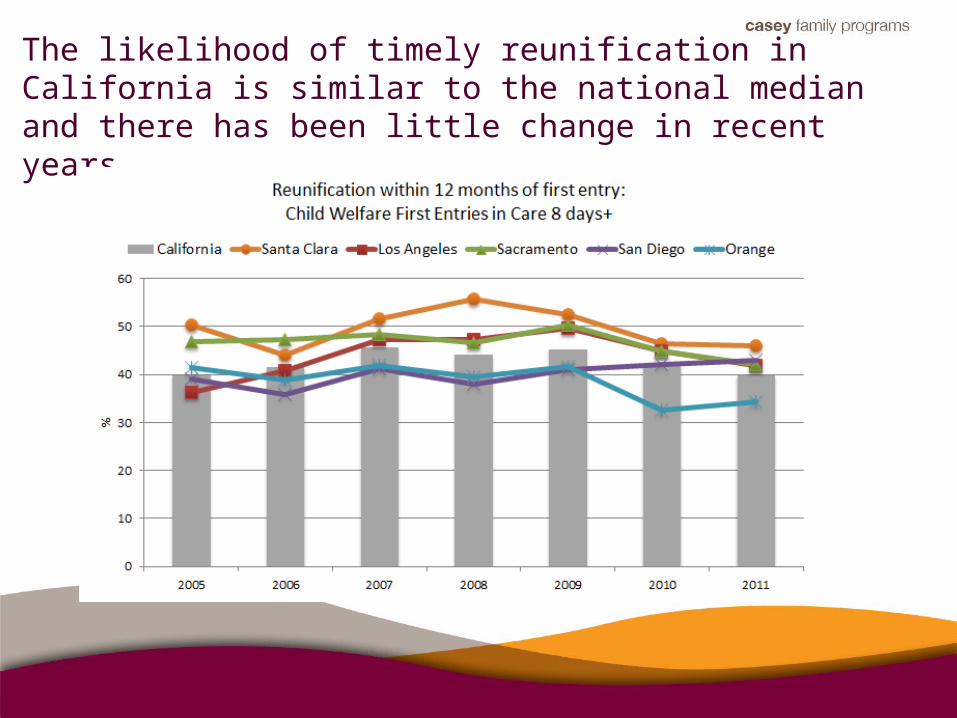
The likelihood of timely reunification in California is similar to the national median and there has been little change in recent years.
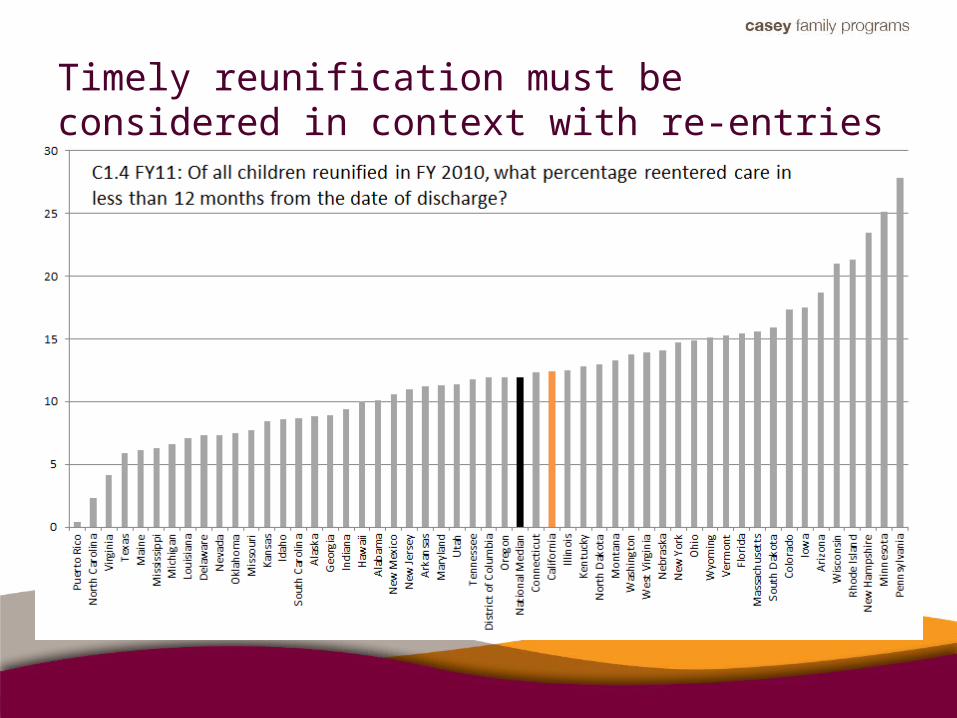
Timely reunification must be considered in context with re-entries into care

CHILDREN AND YOUTH IN CARE FOR LONGER PERIODS OF TIME
Achieving Permanency
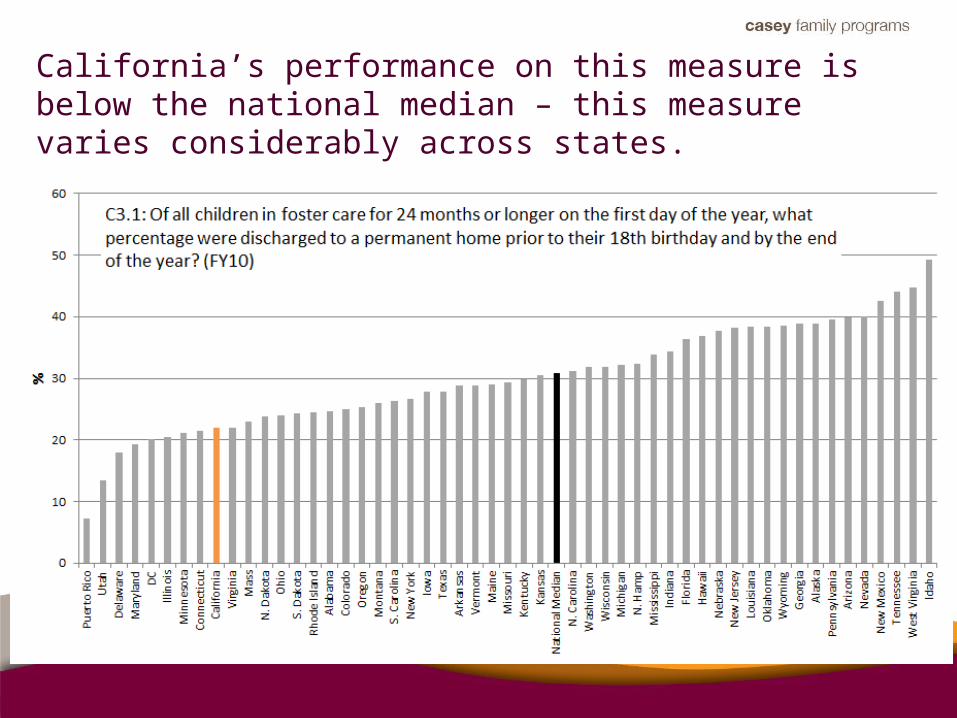
California’s performance on this measure is below the national median – this measure varies considerably across states.
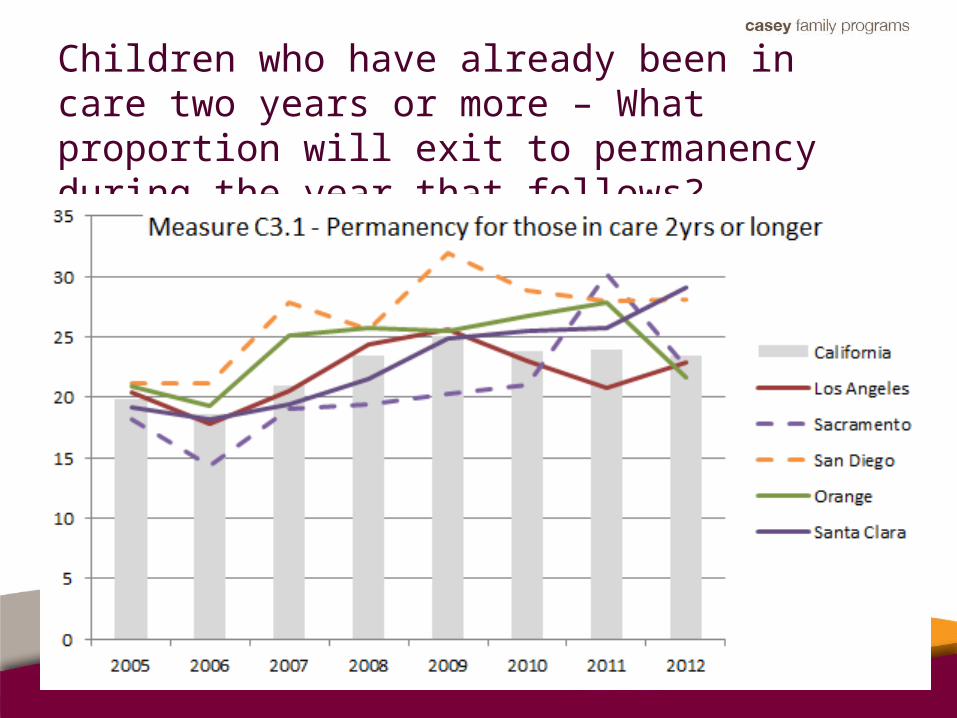
Children who have already been in care two years or more – What proportion will exit to permanency during the year that follows?
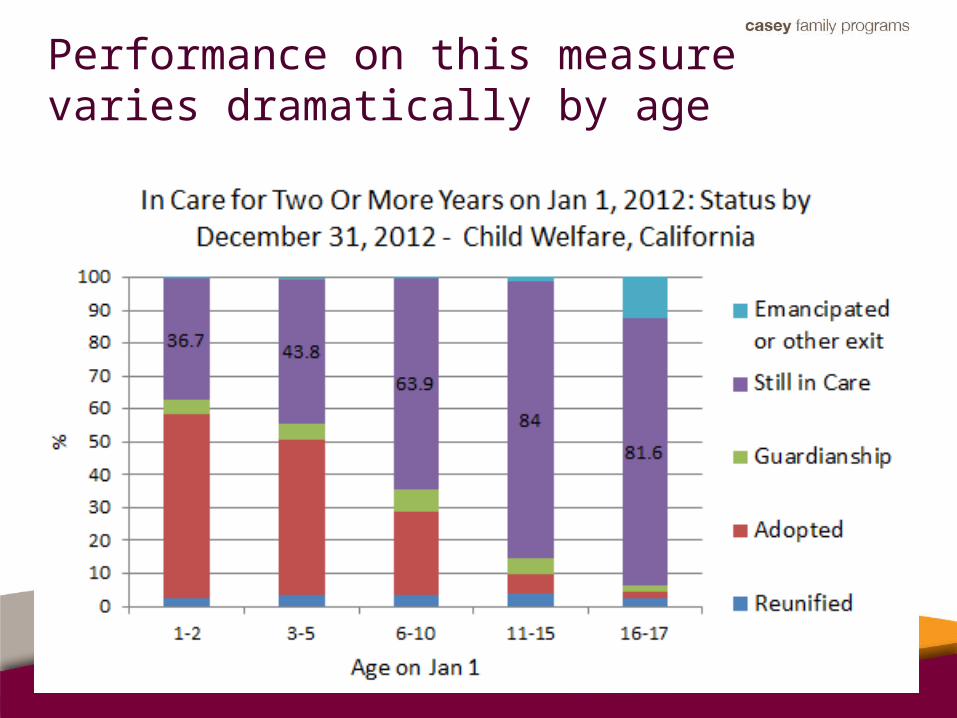
Performance on this measure varies dramatically by age
AB 12: NON MINOR DEPENDENTS
Achieving Permanency
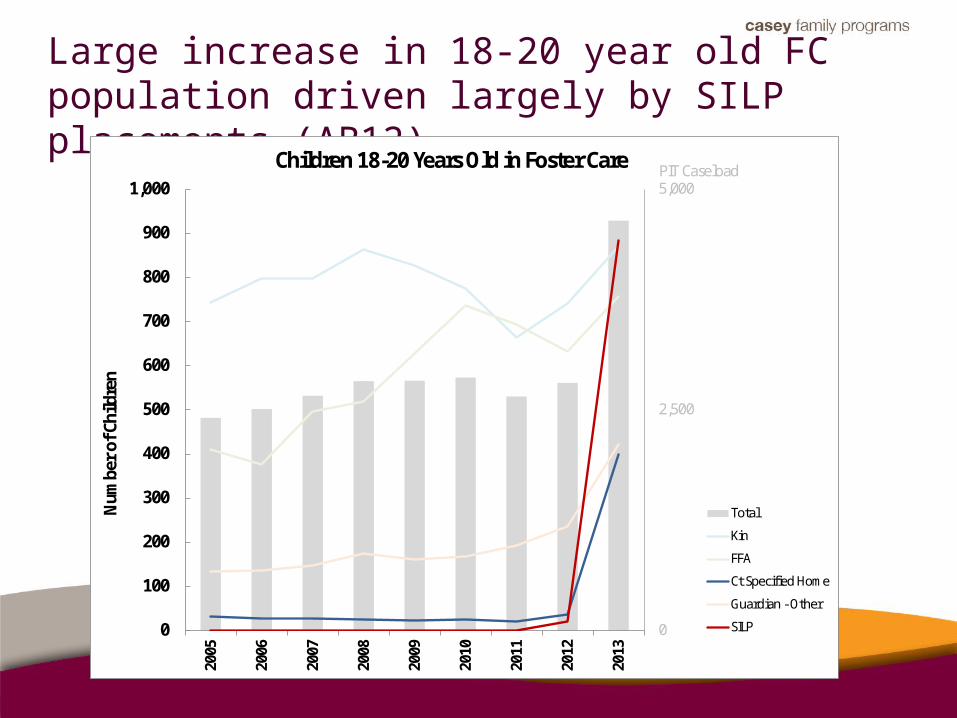
Large increase in 18-20 year old FC population driven largely by SILP placements (AB12)
0
2,500
5,000
0
100
200
300
400
500
600
700
800
900
1,00020
05
2006
2007
2008
2009
2010
2011
2012
2013
Num
ber o
f Chi
ldre
n
Children 18-20 Years Old in Foster Care
Total
Kin
FFA
Ct Specified Home
Guardian - Other
SILP
PIT Caseload
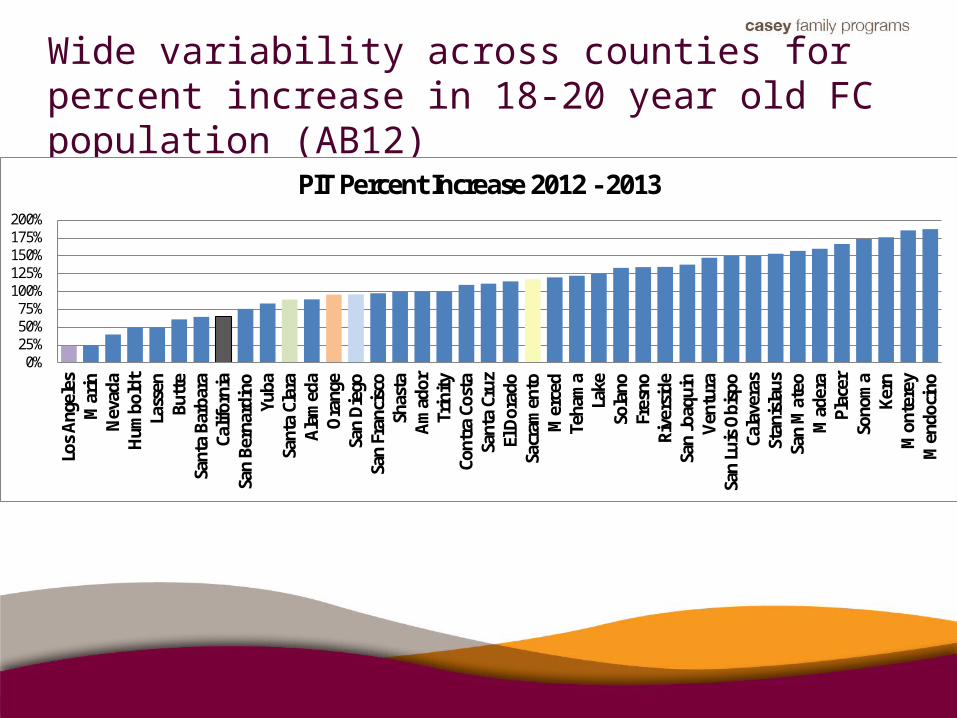
Wide variability across counties for percent increase in 18-20 year old FC population (AB12)
0%25%50%75%
100%125%150%175%200%
Los
Ange
les
Mar
inN
evad
aH
umbo
ldt
Lass
enBu
tte
Sant
a Ba
rbar
aCa
lifor
nia
San
Bern
ardi
noYu
baSa
nta
Clar
aAl
amed
aO
rang
eSa
n D
iego
San
Fran
cisc
oSh
asta
Amad
orTr
inity
Cont
ra C
osta
Sant
a Cr
uzEl
Dor
ado
Sacr
amen
toM
erce
dTe
ham
aLa
keSo
lano
Fres
noRi
vers
ide
San
Joaq
uin
Vent
ura
San
Luis
Obi
spo
Cala
vera
sSt
anis
laus
San
Mat
eoM
ader
aPl
acer
Sono
ma
Kern
Mon
tere
yM
endo
cino
PIT Percent Increase 2012 - 2013
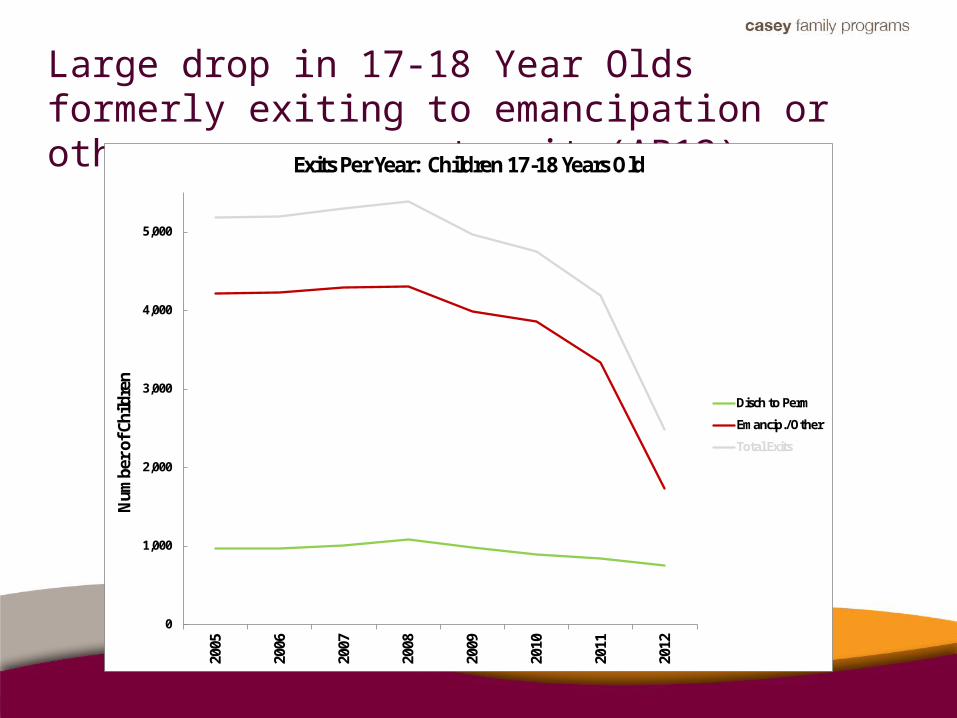
Large drop in 17-18 Year Olds formerly exiting to emancipation or other non-permanent exit (AB12)
0
1,000
2,000
3,000
4,000
5,00020
05
2006
2007
2008
2009
2010
2011
2012
Num
ber o
f Chi
ldre
n
Exits Per Year: Children 17-18 Years Old
Disch to Perm
Emancip./Other
Total Exits
Dependency Court Data in CA• Excel Tool• Court-related variables• Developed User’s Guide• Includes voluntary & court-ordered placements• Convenient access to selected summary data• Making data relevant to non-researchers• Allows for statewide comparison• Allows courts & child welfare to align outcome
measures
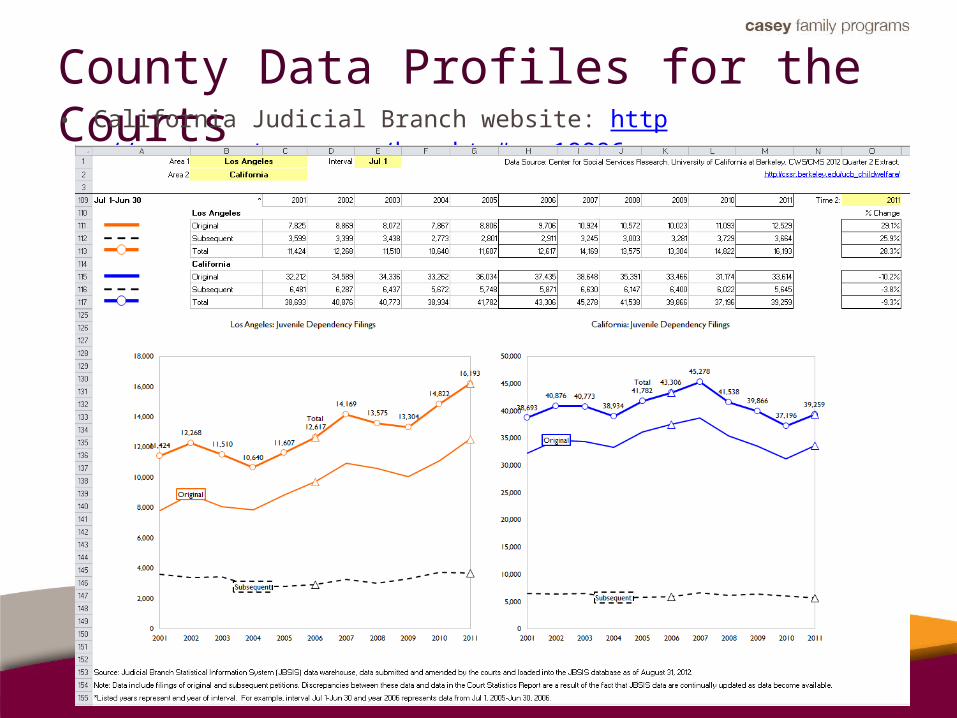
County Data Profiles for the Courts• California Judicial Branch website: http://www.courts.ca.gov/brc.htm#acc18886

Thank you! Please contact us with any additional questions
Daniel Webster: [email protected]
Melissa Correia: [email protected]