Embed Size (px)
Citation preview
International Journal of Environmental Protection and Policy 2014; 2(4): 138-146
Published online August 30, 2014 (http://www.sciencepublishinggroup.com/j/ijepp) doi: 10.11648/j.ijepp.20140204.13 ISSN: 2330-7528 (Print); ISSN: 2330-7536 (Online)
Trends and shifts in time series of rainfall and runoff in the Gambia River Watershed
Vieux Boukhaly Traore1, Soussou Sambou
1, Mohamed Talla Cisse
2, Séni Tamba
3, Sidy Fall
4,
Amadou Tahirou Diaw5, Hyacinthe Sambou
5, Malanda Edmond Nimy
1
1Hydraulics Laboratory and Fluid Mechanics (LHMF), Faculty of Science and Technology, Department of Physics, University Cheikh
Anta Diop (UCAD) BP 5005, Dakar-Fann, Senegal 2University of Thies, Facultty of Technological Sciences, Department of Experimental Sciences, Thies, Senegal 3Thies Polytechnic School, Department of Civil Engineering, PB 10, Thies, Senegal 4Office Lake Guiers Company for the Development and Operation of Lands Senegal River Delta and the Valleys of the Senegal River
and Falémé (SAED), Saint Louis, Senegal 5Teaching Laboratory and Research in Geomatics (LERG), Faculty of letters and Social Sciences, Department of Geography,
University Campus of Polytechnic High School of Dakar BP 5005 Dakar-Fann, Senegal
Email address: [email protected] (V. B. Traore)
To cite this article: Vieux Boukhaly Traore, Soussou Sambou, Mohamed Talla Cisse, Séni Tamba, Sidy Fall, Amadou Tahirou Diaw, Hyacinthe Sambou,
Malanda Edmond Nimy. Trends and Shifts in Time Series of Rainfall and Runoff in the Gambia River Watershed. International Journal of
Environmental Protection and Policy. Vol. 2, No. 4, 2014, pp. 138-146. doi: 10.11648/j.ijepp.20140204.13
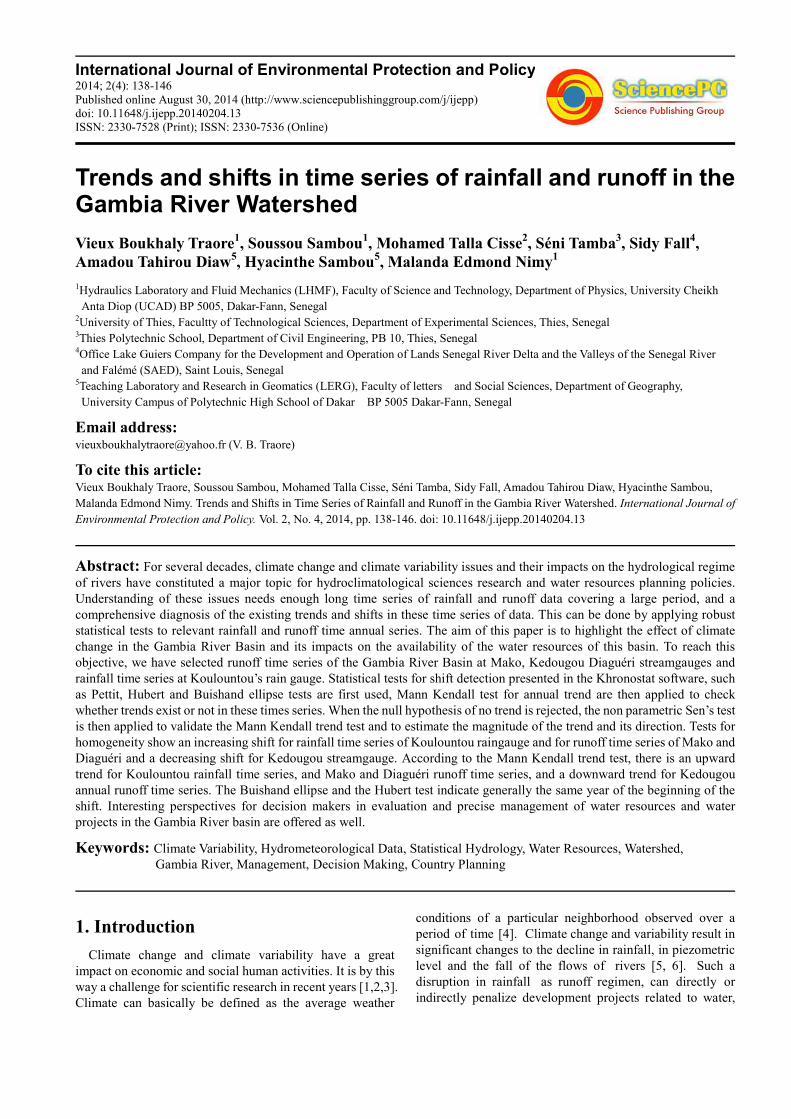
Abstract: For several decades, climate change and climate variability issues and their impacts on the hydrological regime
of rivers have constituted a major topic for hydroclimatological sciences research and water resources planning policies.
Understanding of these issues needs enough long time series of rainfall and runoff data covering a large period, and a
comprehensive diagnosis of the existing trends and shifts in these time series of data. This can be done by applying robust
statistical tests to relevant rainfall and runoff time annual series. The aim of this paper is to highlight the effect of climate
change in the Gambia River Basin and its impacts on the availability of the water resources of this basin. To reach this
objective, we have selected runoff time series of the Gambia River Basin at Mako, Kedougou Diaguéri streamgauges and
rainfall time series at Koulountou’s rain gauge. Statistical tests for shift detection presented in the Khronostat software, such
as Pettit, Hubert and Buishand ellipse tests are first used, Mann Kendall test for annual trend are then applied to check
whether trends exist or not in these times series. When the null hypothesis of no trend is rejected, the non parametric Sen’s test
is then applied to validate the Mann Kendall trend test and to estimate the magnitude of the trend and its direction. Tests for
homogeneity show an increasing shift for rainfall time series of Koulountou raingauge and for runoff time series of Mako and
Diaguéri and a decreasing shift for Kedougou streamgauge. According to the Mann Kendall trend test, there is an upward
trend for Koulountou rainfall time series, and Mako and Diaguéri runoff time series, and a downward trend for Kedougou
annual runoff time series. The Buishand ellipse and the Hubert test indicate generally the same year of the beginning of the
shift. Interesting perspectives for decision makers in evaluation and precise management of water resources and water
projects in the Gambia River basin are offered as well.
Keywords: Climate Variability, Hydrometeorological Data, Statistical Hydrology, Water Resources, Watershed,
Gambia River, Management, Decision Making, Country Planning
1. Introduction
Climate change and climate variability have a great
impact on economic and social human activities. It is by this
way a challenge for scientific research in recent years [1,2,3].
Climate can basically be defined as the average weather
conditions of a particular neighborhood observed over a
period of time [4]. Climate change and variability result in
significant changes to the decline in rainfall, in piezometric
level and the fall of the flows of rivers [5, 6]. Such a
disruption in rainfall as runoff regimen, can directly or
indirectly penalize development projects related to water,
139 Vieux Boukhaly Traore et al.: Trends and Shifts in Time Series of Rainfall and Runoff in the Gambia River Watershed
such as agriculture [7, 8]. It can also affect the good
functioning of arrangements previously made to these
climate changes [9,10-11,12].Thorough knowledge about
the long-term variability and trends of rainfall is seen as a
major concern in environmental science because of the
extreme vulnerability of the environment where the climate
can be broadly defined by an annual rainfall [13]. To
characterize these climatic fluctuations, the statistical
analysis of time series of rainfall/runoff at different sites on
possible longer periods is essential and uncontested to better
seek to locate them in the chronology available [11, 14, 15] .
Statistical analysis involves studying past events, the
characteristics of processes (rainfall, runoff) to define the
probabilities of future occurrence [16, 17, 18]. This
prediction is based on fitting the act of probability to the
empirical frequencies of past observation [16]. Analysis of
the frequency of rain predicts the characteristics in terms of
quantiles, return period, and response time of the watershed
[16]. It quantifies the extent of flooding and takes the
decisions necessary for the drainage of rainwater to mitigate
the impact of these events [16]. Statistical analysis indicates
an increasing trend of the mean annual precipitation and the
existence of some break points in the data series [19, 20].
Annual rainfall is an essential component in the water
budget [20].Most of water resources projects are designed
based on the historical pattern of water availability and
demand, assuming constantly climatic behavior [20,21]. So,
any change in climatic behavior has a big influence in the
precipitation regimen [20,22].The existence of an increasing
or decreasing trend in hydrological time series can be
explained by changes in the factors that influence
precipitation [20, 23, 24].The analysis of long time series of
annual/ monthly rainfall can help put the current drought in
historical perspective and thus enjoy the alternating wet and
dry periods to better characterize the current annual rainfall
deficit [25,26]. It shows the existence of significant
relationships of dependency [27]. It also reveals a strong
tendency for a dry year is followed by another dry year [25,
27]. Assessing trends in rainfall characteristics based on past
records together with the perception of the local community
is essential to develop adaptation strategies [28].The
Ecosystem management requires the collection of data to
define one or more quantitative indicators whose evolution
is typically observed year to year or month by month [29].
Today, most of these information systems exist on a
relatively short period of time and therefore give a vision of
the “short term” evolution. The difficulty is thus to
appreciate any trend in the dynamical process and/or detect
significant changes which would allow to define efficient
strategies for ecosystem management or to detect the impact
of some human activities on the behavior of natural
ecosystem [29]. To resolve this difficulty, long time series
data are needed but sometimes this is not sufficient to detect
changes and trends in climate/hydrological variables,
[30,31]. Some of the reasons of these difficulties are related
to data availability and quality. To ensure the quality of the
results and conclusions on the study of climate change and
its impacts, the check of data quality is a preliminary and
mandatory task [32, 33]. Reliable measurements of climate
data are the essential foundation for quantitative climate
analyses. Unfortunately, there are several factors that affect
the quality of climate data and these factors must be
understood and considered both for scientists and climate
analyzes [17]. Although there are universally
accepted/recommendations for instrument installation and
observations, the measurement practices and instruments
may differ from station to station in a given country, and also
there may be changes in an individual station from time to
time. As a result, these factors cause variations in station
time series [17]. There are today several methods and tools
for detecting trends and breaks in the hydro climatic series
[34]. Statistical analysis requires methodological rigor and
should lead to conservative interpretations [34,35].That is
why the choice must be made by the identification of tools or
methods that can accurately highlight all the events related
to climate variability and change and their impact on water
resources to ensure prediction [36, 37, 15]. In this paper, we
focus on the Gambia River basin on the west coast of Africa.
Tests for detecting trends and shifts have been applied to
runoff time series of this watershed at Mako, Kédougou,
Diaguéri’s streamgauges and rainfall time series at
Koulountou’s raingauge. The Khronostat software was used
to search for potential interruptions by Pettitt, Buishand and
Hubert’s methods [38]; Mann Kendall test and Sen.’s
estimator of slope are used to solve the question of trends
detections and its directions and magnitudes. The aim of this
study is to check trend and shift in the time series of rainfall
and runoff of Gambia river basin to measure the effect of the
climate change and variability and its direct impact on water
resources .The methods used to identify a shift or trend in
the time series are described in flowing section and the
conclusions are presented in the last section.
2. Materials and Methods
2.1. Study Area and Data
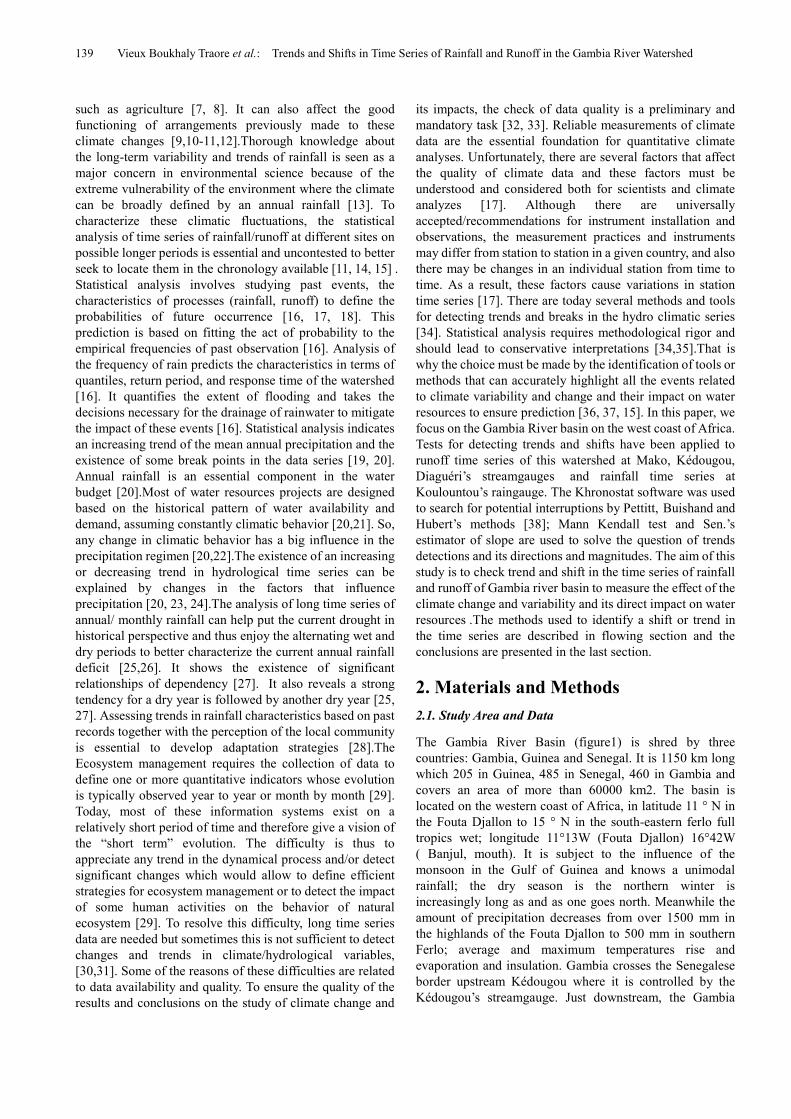
The Gambia River Basin (figure1) is shred by three
countries: Gambia, Guinea and Senegal. It is 1150 km long
which 205 in Guinea, 485 in Senegal, 460 in Gambia and
covers an area of more than 60000 km2. The basin is
located on the western coast of Africa, in latitude 11 ° N in
the Fouta Djallon to 15 ° N in the south-eastern ferlo full
tropics wet; longitude 11°13W (Fouta Djallon) 16°42W
( Banjul, mouth). It is subject to the influence of the
monsoon in the Gulf of Guinea and knows a unimodal
rainfall; the dry season is the northern winter is
increasingly long as and as one goes north. Meanwhile the
amount of precipitation decreases from over 1500 mm in
the highlands of the Fouta Djallon to 500 mm in southern
Ferlo; average and maximum temperatures rise and
evaporation and insulation. Gambia crosses the Senegalese
border upstream Kédougou where it is controlled by the
Kédougou’s streamgauge. Just downstream, the Gambia
International Journal of Environmental Protection and Policy 2014;
receives watershed Diaguéri, controlled
Diaguéri. The river begins its crossing
Djallon by a large loop in the middle
stream gauge of Mako ; it enters the plates
terminal to its mouth it receives on
Koulountou controlled by the stream
(Niokolo Koba National Park). Data used
rainfall at Koulountou’s raingauge, and
Diaguéri and Kédougou’s streamgauges.
acquired from the database of OMVG (Organization
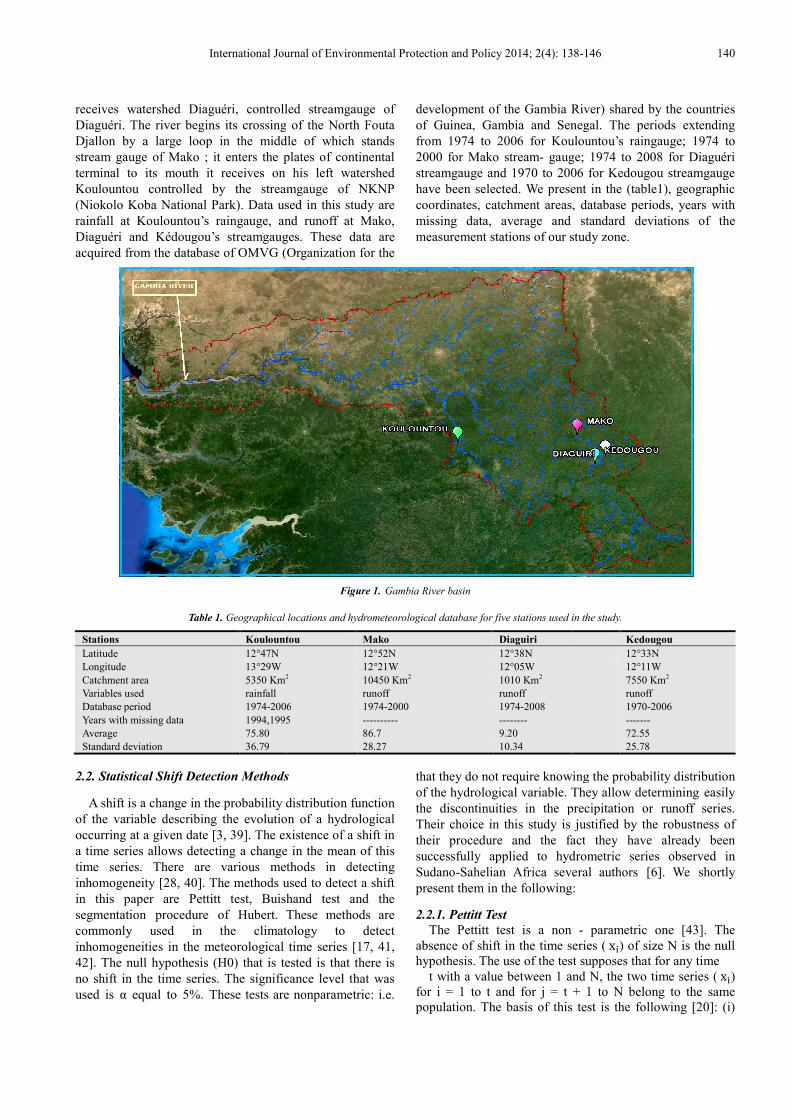
Table 1. Geographical
Stations Koulountou
Latitude 12°47N
Longitude 13°29W
Catchment area 5350 Km2
Variables used rainfall
Database period
Years with missing data
1974-2006
1994,1995
Average 75.80
Standard deviation 36.79
2.2. Statistical Shift Detection Methods
A shift is a change in the probability distribution
of the variable describing the evolution
occurring at a given date [3, 39]. The existence
a time series allows detecting a change
time series. There are various methods
inhomogeneity [28, 40]. The methods used
in this paper are Pettitt test, Buishand
segmentation procedure of Hubert. These
commonly used in the climatology
inhomogeneities in the meteorological
42]. The null hypothesis (H0) that is tested
no shift in the time series. The significance
used is α equal to 5%. These tests are
International Journal of Environmental Protection and Policy 2014; 2(4): 138
controlled streamgauge of
crossing of the North Fouta
middle of which stands
plates of continental
his left watershed
streamgauge of NKNP used in this study are
and runoff at Mako,
streamgauges. These data are
(Organization for the
development of the Gambia River)
of Guinea, Gambia and Senegal.
from 1974 to 2006 for Koulountou’s
2000 for Mako stream- gauge;
streamgauge and 1970 to 2006
have been selected. We present
coordinates, catchment areas,
missing data, average and
measurement stations of our study
Figure 1. Gambia River basin
locations and hydrometeorological database for five stations used in
Koulountou Mako Diaguiri
12°52N 12°38N
12°21W 12°05W 2 10450 Km2 1010 Km2
runoff runoff
2006
1994,1995
1974-2000
----------
1974-2008
--------
86.7 9.20
28.27 10.34
Methods
distribution function
evolution of a hydrological
existence of a shift in
change in the mean of this
methods in detecting
used to detect a shift
Buishand test and the
These methods are
climatology to detect
time series [17, 41,
tested is that there is
significance level that was
are nonparametric: i.e.
that they do not require knowing
of the hydrological variable. They
the discontinuities in the precipitation
Their choice in this study is
their procedure and the fact
successfully applied to hydrometric
Sudano-Sahelian Africa several
present them in the following
2.2.1. Pettitt Test
The Pettitt test is a non
absence of shift in the time series
hypothesis. The use of the test
t with a value between 1 and
for i = 1 to t and for j = t
population. The basis of this
38-146 140
River) shared by the countries
Senegal. The periods extending
Koulountou’s raingauge; 1974 to
gauge; 1974 to 2008 for Diaguéri
2006 for Kedougou streamgauge
present in the (table1), geographic
areas, database periods, years with
standard deviations of the
study zone.
in the study.
Kedougou
12°33N
12°11W
7550 Km2
runoff
1970-2006
-------
72.55
25.78
knowing the probability distribution
They allow determining easily
precipitation or runoff series.
justified by the robustness of
fact they have already been
hydrometric series observed in
several authors [6]. We shortly
:
- parametric one [43]. The
series (x�) of size N is the null
test supposes that for any time
and N, the two time series (x�) + 1 to N belong to the same
this test is the following [20]: (i)
141 Vieux Boukhaly Traore et al.: Trends and Shifts in Time Series of Rainfall and Runoff in the Gambia River Watershed
the studied series is divided into two sub-samples of sizes m and n respectively; (ii) the values of the two samples are
grouped and arranged by increasing order; (iii) the sum of
the ranks of the components of each sub-sample in the total
sample is then calculated by (1); (iv) a statistic,U� , is
defined using the two sums thus obtained in order to assess whether the two samples belong to the same population
given by (2).
D�,� = sgn x� − x�� = � 1six� − x� > 00six� − x� = 0−1six� − x� < 0� (1)
U�,� = ∑ ∑ D�,����������� (2)
Pettitt proposed, "for the test of null hypothesis H0: 'no
change' against alternative hypothesis H1: 'change', the use
of the statistic given by (3):
K� = max�U�,�� (3)
for, t= 1 to t= N-1
If k is the value of K� taken on the studied series, under
the null hypothesis, then the significance probability
associated with the value k of KN is approximately given by (4)
Prob$K� > %& ≈ 2exp+−6K- $N- + N0&⁄ 2 (4)
If Prob (K > k) < α, for a significance level α, then the
null hypothesis is rejected, and an estimation of the date of
the break is provided by the moment t defining the
maximum in absolute terms of the U�,� variable [ 3]
2.2.2. Buishand U Statistic
The Buishand test is Bayesian procedure applied under
the assumption that the studied series is normally
distributed [44]. Then, the Buishand U statistic is defined
by (5):
U = ∑ 345 678 9:;<=>?=�$���& (5)
Where the terms SA and σCare the partial sum and the
standard deviation of the given series$x� ) that tests for
homogeneity can be based and they are respectively given
by (6) and (7);xDis the average given by (8):
SA = ∑ $x� − xD�� & (6)
σC- = ∑ $x� − xD&-�� N⁄ (7)
xD = ��∑ x��� (8)
The null hypothesis of the statistical test is the absence of
shift in the series. In the case of rejection of the null hypothesis, no estimation of the date of the shift is
proposed by this test [28]. In addition to these different
procedures, the building of a control ellipse makes it
possible to analyze the homogeneity of the (xi) series.
Under the null hypothesis assumption, the SA variable,
defined above, follows a normal distribution with a zero mean and a variance equal to (9):
σ- = �� K$N − K& (9)
With, k = 0 to N. This control ellipse was used here to estimate visually
the importance of the deviations under the null hypothesis
of the homogeneity of the series [45]. It is consequently
possible to define confidence limits including the series of
the SA[ 46].
2.2.3. Hubert Segmentation
Hubert’s segmentation procedure detects the multiple
shifts in time series [47]. It provides, thanks to a specific
algorithm, one or several break dates (or possibly none).The principle is to cut the series into m segments
(m>1) such that the calculated means of the neighboring
sub-series significantly differ. To limit the segmentation,
the means of two contiguous segments must be different to
the point of satisfying Scheffe’s test. The procedure gives
the timing of the shifts. Giving a m�Eorder segmentation
of the time series,iA, k = 1, m, the rank in the initial series
of extreme end of the k�E segment (with iG = 0), the
following are defined by (10) and (11):
xADDD = ∑ CHI?I5I?I5<=J=�5K�5<= (10)
DL = ∑ ∑ $x� − xDA&-���5���5<=��A�LA�� (11)
DL is the quadratic deviation between the series and the
segmentation. For a given segmentation order, the
algorithm determine the optimal segmentation of a series
that is such that the deviation DL is minimal. This procedure can also be interpreted as a stationary test, the
null hypothesis being the studied series is non-stationary. If
the procedure doesn’t produce acceptable segmentations of
order bigger or equal to two, the null hypothesis is accepted
[48, 49].
2.3. Statistical Trend Detection Methods
Trend is the tendency of a phenomenon over a fixed
period; it can vary according to the reference temporal
window. It is well known that the time series data required
for trend analysis should be random and/or non-persistent
[41]. One of problems in the analysis and interpretation of
trends in hydrological data is the confounding effect of serial
dependence [24]. Furthermore, in the presence of positive
serial correlation, the non-parametric test could signify a
significant trend due to random effects of the data series [50].
Among the tests to detect (linear) trend in time series the
most used are Mann Kendall and Sen’s estimator of slope
because of theirs simplicity and robustness [51]. The null
hypothesis (H0) that is tested is that there is no trend in the
time series. The significance level that was used is α equal
to 5%.
International Journal of Environmental Protection and Policy 2014; 2(4): 138-146 142
2.3.1. Sen’s Estimator of Slope
This test is applied in cases where the trend is assumed to be linear, depicting the quantification of changes per unit
time [52]. This method could be used with missing data and
remain unaffected by outliers or gross errors [24, 50]. It
allows also estimating the magnitude and direction of the
trend [53]. The N values of slopes Pij for n observations are
calculated by:
Pij = MHKMI�K� (12)
Wherex� and x� are data values at times (or during time
periods) j and i, respectively, and where j >i for, i= 1 to i= n; and j = i+1 to j= n
After slopes computations, the N values of slope are
algebraically classified in ascending order (there included
the null value if there's any) and median of these N values of
slope noted PN which is Sen’s estimator of slope, is estimated depending on whether N is odd or even by (13):
PN = �P;J=: ifNisold�- RP;: + P;J:: S ifNiseven� (13)
We define a confidence interval for the median slope by
calculating the lower limit denotedP�UV corresponding to M��E and the upper limit denoted PXYZ corresponding
to$M- + 1&�Eof the N ordered slope estimates; where M�
and M- are respectively given by (14) and (15):
M� = �K[\- (14)
M- = ��[\- (15)
C^ is the parameter calculated by (16):
C^ =$Z�K\: &`Var$S& (16)
Where Z�K\: and Var$S ) are respectively the critical
valueofthetest statistic Z from the standard normal table
for a desired significance level α and variance which is computed by (17):
Var(S) = ��d en$n − 1&$2n + 5& − ∑ tZ − 1�tg$2tZ + 5&hg�� i (17)
Where q is the number of tied groups and tZ is the
number of data in thep�E group. The null hypothesis H0
(there is trend in the series) is accepted if we have: P�UV < PM < PXYZif not, it is rejected. According to the
magnitude and direction, a positive value of the median
slope means that trend is upwards and its negative value
means that trend is downwards.
2.3.2. Mann-Kendall’s Test
Mann-Kendall’s test is a non-parametric method, which is
less sensitive to outliers and test for a trend in a time series
without specifying whether the trend is linear or non-linear
[54]. Mann-Kendall’s test statistic is given as (18)
S = ∑ ∑ sgn x� − x���������K���� (18)
Where S is the Mann-Kendal’s test statistics; x� and x�are the sequential data values of the time series in the
years i and j ( j > i) and N is the length of the time series. A
positive S value indicates an increasing trend and a negative
value indicates a decreasing trend in the data series. The sign
function is given as (19):
sgn x� − x�� = � 1ifx� − x� > 00ifx� − x� = 0−1ifx� − x� < 0� (19)
The variance of S, for the situation where there may be
ties (that is, equal values) in the x values is given by (20):
Var$S& = ��d +n$n − 1&$2n + 5& − ∑ t�$t� − 1&$2t� + 5&L��� 2 (20)
Where m is the number of tied groups in the data set and t� is the number of data points in the i�E tied group. For n
larger than 10, ZNj approximates the standard normal
distribution [24, 55] and computed as follows (21):
ZNj = klm 4K�√opq$4& ifS > 00ifS = 04��√opq$4& ifS < 0� (21)
The presence of a statistically significant trend is
evaluated using the ZNj value. In a two-sided test for trend,
the null hypothesis Ho “there is no trend in the series”,
should be rejected if |ZNj| < Z�Kα: (or p-value > α) at a
given level of significance α. The critical value Z�Kα: of ZNj from the standard normal table. For example, for α= 5%
significance level, the value of Z�Kα: is 1.96. A positive
value of ZNjindicates an increasing trend while a negative
value indicates a decreasing trend [28].
3. Result and Discussion
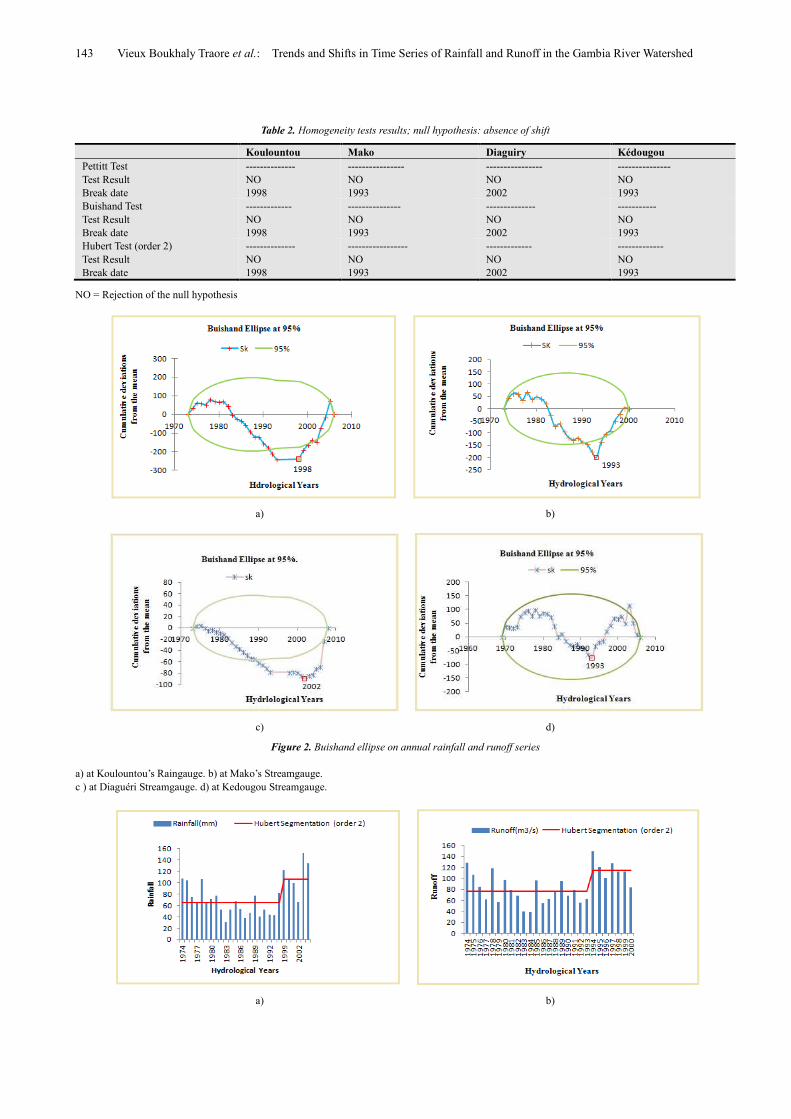
3.1. Results of the Shifts Detection Tests
We present the results of all shift detection tests in table2
and the corresponding graphics in (Fig 2). Both Pettitt test
and Buishand test reject the null hypothesis of no shift at the
5% significance level for all stations. For these two tests,
break occurs at year 1993 for Kédougou and Mako
streamgauges, 1998 for Koulountou raingauge and 2002 for
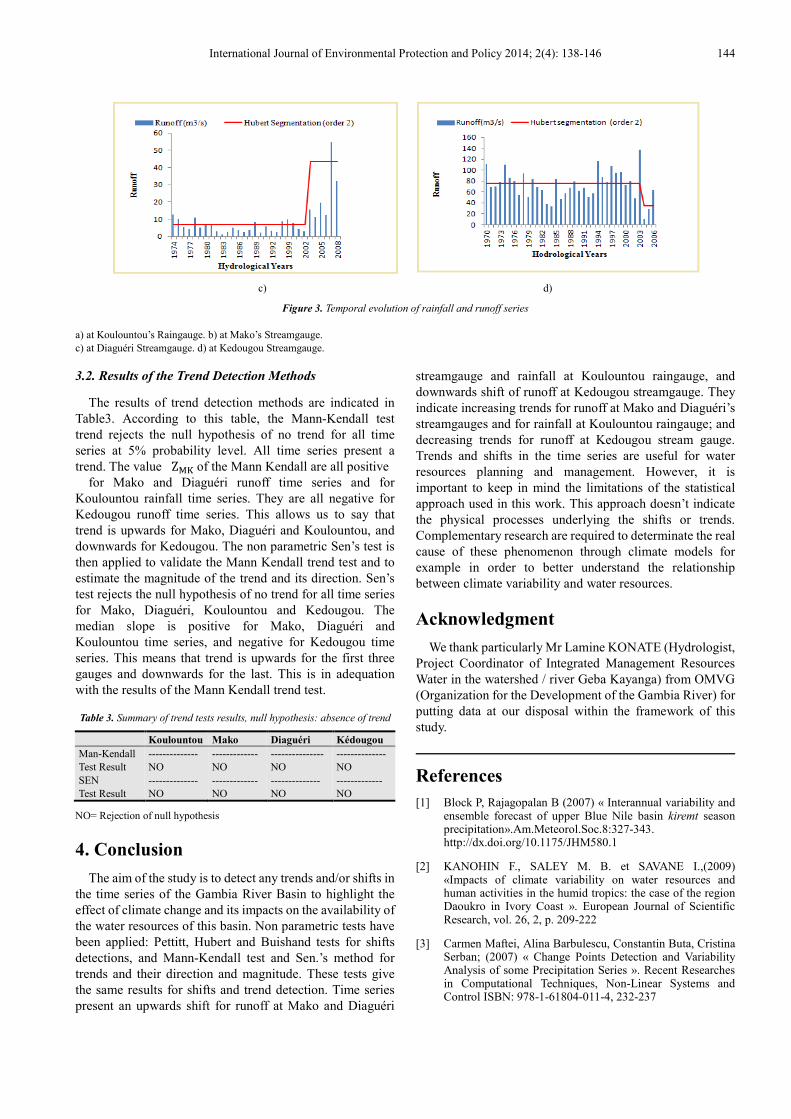
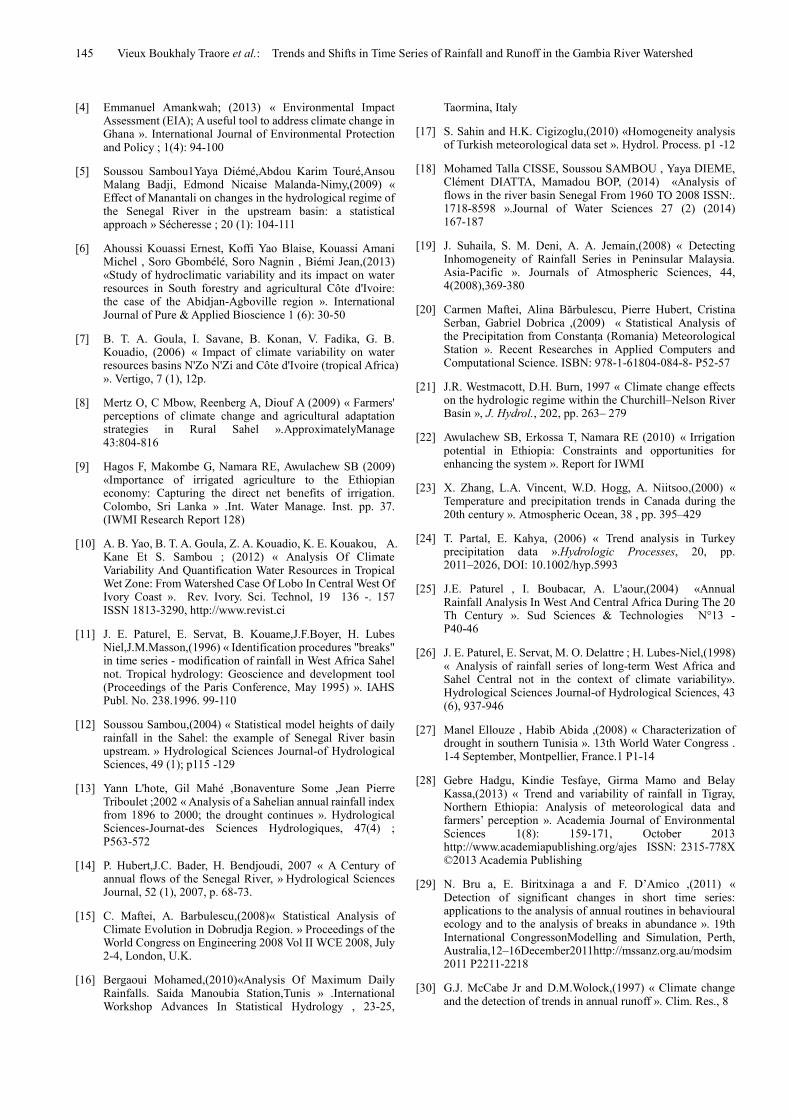
Diaguéri streamgauge. The Hubert’s procedure of time
series segmentation corroborates the preceding results and
leads to the same years for break (Fig 3). We can conclude
that the time series for all four stations (raingauge and
streamgauge) are not homogeneous because they all have a
shift. Nevertheless, the direction of the shift is not the same
for all time series. The runoff increases for Mako and
Diaguéri time series; it decreases for Kedougou streamgauge.
The rainfall increases for Koulountou raingauge.
143 Vieux Boukhaly Traore et al.: Trends and Shifts in Time Series of Rainfall and Runoff in the Gambia River Watershed
Table 2. Homogeneity tests results; null hypothesis: absence of shift
Koulountou Mako Diaguiry Kédougou
Pettitt Test
Test Result
Break date
--------------
NO
1998
----------------
NO
1993
----------------
NO
2002
---------------
NO
1993
Buishand Test
Test Result
Break date
-------------
NO
1998
---------------
NO
1993
--------------
NO
2002
-----------
NO
1993
Hubert Test (order 2)
Test Result
Break date
--------------
NO
1998
-----------------
NO
1993
-------------
NO
2002
-------------
NO
1993
NO = Rejection of the null hypothesis
a) b)
c) d)
Figure 2. Buishand ellipse on annual rainfall and runoff series
a) at Koulountou’s Raingauge. b) at Mako’s Streamgauge.
c ) at Diaguéri Streamgauge. d) at Kedougou Streamgauge.
a) b)
International Journal of Environmental Protection and Policy 2014; 2(4): 138-146 144
c) d)
Figure 3. Temporal evolution of rainfall and runoff series
a) at Koulountou’s Raingauge. b) at Mako’s Streamgauge.
c) at Diaguéri Streamgauge. d) at Kedougou Streamgauge.
3.2. Results of the Trend Detection Methods
The results of trend detection methods are indicated in
Table3. According to this table, the Mann-Kendall test
trend rejects the null hypothesis of no trend for all time
series at 5% probability level. All time series present a
trend. The value ZNjof the Mann Kendall are all positive
for Mako and Diaguéri runoff time series and for
Koulountou rainfall time series. They are all negative for
Kedougou runoff time series. This allows us to say that
trend is upwards for Mako, Diaguéri and Koulountou, and
downwards for Kedougou. The non parametric Sen’s test is
then applied to validate the Mann Kendall trend test and to
estimate the magnitude of the trend and its direction. Sen’s
test rejects the null hypothesis of no trend for all time series
for Mako, Diaguéri, Koulountou and Kedougou. The
median slope is positive for Mako, Diaguéri and
Koulountou time series, and negative for Kedougou time
series. This means that trend is upwards for the first three
gauges and downwards for the last. This is in adequation
with the results of the Mann Kendall trend test.
Table 3. Summary of trend tests results, null hypothesis: absence of trend
Koulountou Mako Diaguéri Kédougou
Man-Kendall
Test Result
--------------
NO
-------------
NO
---------------
NO
--------------
NO
SEN
Test Result
--------------
NO
-------------
NO
--------------
NO
-------------
NO
NO= Rejection of null hypothesis
4. Conclusion
The aim of the study is to detect any trends and/or shifts in
the time series of the Gambia River Basin to highlight the
effect of climate change and its impacts on the availability of
the water resources of this basin. Non parametric tests have
been applied: Pettitt, Hubert and Buishand tests for shifts
detections, and Mann-Kendall test and Sen.’s method for
trends and their direction and magnitude. These tests give
the same results for shifts and trend detection. Time series
present an upwards shift for runoff at Mako and Diaguéri
streamgauge and rainfall at Koulountou raingauge, and
downwards shift of runoff at Kedougou streamgauge. They
indicate increasing trends for runoff at Mako and Diaguéri’s
streamgauges and for rainfall at Koulountou raingauge; and
decreasing trends for runoff at Kedougou stream gauge.
Trends and shifts in the time series are useful for water
resources planning and management. However, it is
important to keep in mind the limitations of the statistical
approach used in this work. This approach doesn’t indicate
the physical processes underlying the shifts or trends.
Complementary research are required to determinate the real
cause of these phenomenon through climate models for
example in order to better understand the relationship
between climate variability and water resources.
Acknowledgment
We thank particularly Mr Lamine KONATE (Hydrologist,
Project Coordinator of Integrated Management Resources
Water in the watershed / river Geba Kayanga) from OMVG
(Organization for the Development of the Gambia River) for
putting data at our disposal within the framework of this
study.
References
[1] Block P, Rajagopalan B (2007) « Interannual variability and ensemble forecast of upper Blue Nile basin kiremt season precipitation».Am.Meteorol.Soc.8:327-343. http://dx.doi.org/10.1175/JHM580.1
[2] KANOHIN F., SALEY M. B. et SAVANE I.,(2009) «Impacts of climate variability on water resources and human activities in the humid tropics: the case of the region Daoukro in Ivory Coast ». European Journal of Scientific Research, vol. 26, 2, p. 209-222
[3] Carmen Maftei, Alina Barbulescu, Constantin Buta, Cristina Serban; (2007) « Change Points Detection and Variability Analysis of some Precipitation Series ». Recent Researches in Computational Techniques, Non-Linear Systems and Control ISBN: 978-1-61804-011-4, 232-237
145 Vieux Boukhaly Traore et al.: Trends and Shifts in Time Series of Rainfall and Runoff in the Gambia River Watershed
[4] Emmanuel Amankwah; (2013) « Environmental Impact Assessment (EIA); A useful tool to address climate change in Ghana ». International Journal of Environmental Protection and Policy ; 1(4): 94-100
[5] Soussou Sambou1Yaya Diémé,Abdou Karim Touré,Ansou Malang Badji, Edmond Nicaise Malanda-Nimy,(2009) « Effect of Manantali on changes in the hydrological regime of the Senegal River in the upstream basin: a statistical approach » Sécheresse ; 20 (1): 104-111
[6] Ahoussi Kouassi Ernest, Koffi Yao Blaise, Kouassi Amani Michel , Soro Gbombélé, Soro Nagnin , Biémi Jean,(2013) «Study of hydroclimatic variability and its impact on water resources in South forestry and agricultural Côte d'Ivoire: the case of the Abidjan-Agboville region ». International Journal of Pure & Applied Bioscience 1 (6): 30-50
[7] B. T. A. Goula, I. Savane, B. Konan, V. Fadika, G. B. Kouadio, (2006) « Impact of climate variability on water resources basins N'Zo N'Zi and Côte d'Ivoire (tropical Africa) ». Vertigo, 7 (1), 12p.
[8] Mertz O, C Mbow, Reenberg A, Diouf A (2009) « Farmers' perceptions of climate change and agricultural adaptation strategies in Rural Sahel ».ApproximatelyManage 43:804-816
[9] Hagos F, Makombe G, Namara RE, Awulachew SB (2009) «Importance of irrigated agriculture to the Ethiopian economy: Capturing the direct net benefits of irrigation. Colombo, Sri Lanka » .Int. Water Manage. Inst. pp. 37. (IWMI Research Report 128)
[10] A. B. Yao, B. T. A. Goula, Z. A. Kouadio, K. E. Kouakou, A. Kane Et S. Sambou ; (2012) « Analysis Of Climate Variability And Quantification Water Resources in Tropical Wet Zone: From Watershed Case Of Lobo In Central West Of Ivory Coast ». Rev. Ivory. Sci. Technol, 19 136 -. 157 ISSN 1813-3290, http://www.revist.ci
[11] J. E. Paturel, E. Servat, B. Kouame,J.F.Boyer, H. Lubes Niel,J.M.Masson,(1996) « Identification procedures "breaks" in time series - modification of rainfall in West Africa Sahel not. Tropical hydrology: Geoscience and development tool (Proceedings of the Paris Conference, May 1995) ». IAHS Publ. No. 238.1996. 99-110
[12] Soussou Sambou,(2004) « Statistical model heights of daily rainfall in the Sahel: the example of Senegal River basin upstream. » Hydrological Sciences Journal-of Hydrological Sciences, 49 (1); p115 -129
[13] Yann L'hote, Gil Mahé ,Bonaventure Some ,Jean Pierre Triboulet ;2002 « Analysis of a Sahelian annual rainfall index from 1896 to 2000; the drought continues ». Hydrological Sciences-Journat-des Sciences Hydrologiques, 47(4) ; P563-572
[14] P. Hubert,J.C. Bader, H. Bendjoudi, 2007 « A Century of annual flows of the Senegal River, » Hydrological Sciences Journal, 52 (1), 2007, p. 68-73.
[15] C. Maftei, A. Barbulescu,(2008)« Statistical Analysis of Climate Evolution in Dobrudja Region. » Proceedings of the World Congress on Engineering 2008 Vol II WCE 2008, July 2-4, London, U.K.
[16] Bergaoui Mohamed,(2010)«Analysis Of Maximum Daily Rainfalls. Saida Manoubia Station,Tunis » .International Workshop Advances In Statistical Hydrology , 23-25,
Taormina, Italy
[17] S. Sahin and H.K. Cigizoglu,(2010) «Homogeneity analysis of Turkish meteorological data set ». Hydrol. Process. p1 -12
[18] Mohamed Talla CISSE, Soussou SAMBOU , Yaya DIEME, Clément DIATTA, Mamadou BOP, (2014) «Analysis of flows in the river basin Senegal From 1960 TO 2008 ISSN:. 1718-8598 ».Journal of Water Sciences 27 (2) (2014) 167-187
[19] J. Suhaila, S. M. Deni, A. A. Jemain,(2008) « Detecting Inhomogeneity of Rainfall Series in Peninsular Malaysia. Asia-Pacific ». Journals of Atmospheric Sciences, 44, 4(2008),369-380
[20] Carmen Maftei, Alina Bărbulescu, Pierre Hubert, Cristina Serban, Gabriel Dobrica ,(2009) « Statistical Analysis of the Precipitation from Constanța (Romania) Meteorological Station ». Recent Researches in Applied Computers and Computational Science. ISBN: 978-1-61804-084-8- P52-57
[21] J.R. Westmacott, D.H. Burn, 1997 « Climate change effects on the hydrologic regime within the Churchill–Nelson River Basin », J. Hydrol., 202, pp. 263– 279
[22] Awulachew SB, Erkossa T, Namara RE (2010) « Irrigation potential in Ethiopia: Constraints and opportunities for enhancing the system ». Report for IWMI
[23] X. Zhang, L.A. Vincent, W.D. Hogg, A. Niitsoo,(2000) « Temperature and precipitation trends in Canada during the 20th century ». Atmospheric Ocean, 38 , pp. 395–429
[24] T. Partal, E. Kahya, (2006) « Trend analysis in Turkey precipitation data ».Hydrologic Processes, 20, pp. 2011–2026, DOI: 10.1002/hyp.5993
[25] J.E. Paturel , I. Boubacar, A. L'aour,(2004) «Annual Rainfall Analysis In West And Central Africa During The 20 Th Century ». Sud Sciences & Technologies N°13 - P40-46
[26] J. E. Paturel, E. Servat, M. O. Delattre ; H. Lubes-Niel,(1998) « Analysis of rainfall series of long-term West Africa and Sahel Central not in the context of climate variability». Hydrological Sciences Journal-of Hydrological Sciences, 43 (6), 937-946
[27] Manel Ellouze , Habib Abida ,(2008) « Characterization of drought in southern Tunisia ». 13th World Water Congress . 1-4 September, Montpellier, France.1 P1-14
[28] Gebre Hadgu, Kindie Tesfaye, Girma Mamo and Belay Kassa,(2013) « Trend and variability of rainfall in Tigray, Northern Ethiopia: Analysis of meteorological data and farmers’ perception ». Academia Journal of Environmental Sciences 1(8): 159-171, October 2013 http://www.academiapublishing.org/ajes ISSN: 2315-778X ©2013 Academia Publishing
[29] N. Bru a, E. Biritxinaga a and F. D’Amico ,(2011) « Detection of significant changes in short time series: applications to the analysis of annual routines in behavioural ecology and to the analysis of breaks in abundance ». 19th International CongressonModelling and Simulation, Perth, Australia,12–16December2011http://mssanz.org.au/modsim2011 P2211-2218
[30] G.J. McCabe Jr and D.M.Wolock,(1997) « Climate change and the detection of trends in annual runoff ». Clim. Res., 8
International Journal of Environmental Protection and Policy 2014; 2(4): 138-146 146
[31] A.M.G. Klein Tank, F.W. Zwiers, and X. Zhang,(2009) «Guidelines on analysis of extremes in a changing climate in support of informed decisions for adaptation ». Technical Report 72, World Meteorological Organization.
[32] L. Xiong and S. Guo.(2004) «Trend test and change point detection for the annual discharge series of the Yangtze river at the Yichang hydrological station ». Hydrological Sciences Journal, 49(1):99–112.
[33] Renata Vezzoli , Silvano Pecora , Enrica Zenoni , Fabrizio Tonelli,(2012) « Data analysis to detect inhomogeneity, change points, trends in observations: an application to Po river discharge extremes CMCC ». Research Papers Issue RP0138; July 2012 Impact on Soil and Coasts Division (ISC P1-15)
[34] V.Ch. Khon, I.I. Mokhov, E. Roeckner, V.A. Semenov, (2007) «Regional changes of precipitation characteristics in Northern Eurasia from simulations with global climate model ».Global and Planetary Change, 57, , pp. 118–123
[35] Machiwal D, Jha MK.(2008) « Comperative evaluation of statistical tests for time series analysis: application to hydrologicaltimeseries».HydrologicalSciences,Journal-desSciences Hydrologiques] 53(3): 353–366
[36] Helsel, D.R. and R. M. Hirsch, (2002) «Statistical Methods in Water Resources Techniques of Water Resources Investigations ».Book 4, chapter A3. U.S. Geological Survey, 522 pages
[37] C.Huntingford, R.G. Jones, C. Prudhomme, R. Lamb, J..H.C. Gash, D.A. Jones, (2003) « Regional climate model predictions of extreme rainfall for a changingclimate, Q. J. R. Meteorol. Soc., 129, pp. 1607–1621
[38] J.F. Boyer,(2002) « Logiciel Khronostat d’analyse statistique de series chronologique ». IRD UR2, Programme 21 FRIEND AOC, Equipe Hydrologie UMRGBE, Universite de Montpellier II, Ecole des Mines de Paris, 2002
[39] CAUSSINUS,H.,MESTRE,O.,(2004) « Detection and correction of artificial shifts in climate series ». Applied statistics, vol. 3, p. 405-425
[40] Ho Ming Kang and Fadhilah Yusof ,(2012) « Homogeneity Tests on Daily Rainfall Series in Peninsular Malaysia ; Int. J. Contemp » . Math. Sciences, Vol. 7, 2012, no. 1, 9 – 22
[41] Ngongondo C, Yu-Xu C, Gottschalk L, Alemaw B (2011) « Evaluation of spatial and temporal characteristics of rainfall in Malawi: a case of data scarce region ». Theor. Appl. Climatol. DOI 10.1007/s00704-011-0413-0
[42] Kang HM, Yusof F (2012) « Homogeneity tests on daily rainfall series in Peninsular Malaysia. Int. J. Contemp. Math. Sci. 7(1):9 – 22.
[43] A. N. Pettitt,(1979) « A non-parametric approach to the change-point problem».Applied Statistics, 28 (2), pp.126-135
[44] Buishand, T. A. (1984): Tests for detecting a shift in the mean of hydrological time series ». Hydrol. 73, 51-69.
[45] A.A.Aka,E.Servat,J. E. Paturel & B. Kouamé , H. Lubes, J. M. Masson,(1996) «Analysis of the temporal variabilityof runoff in Ivory Coast: statistical approach and phenomenacharacterization» .HydrologicalSciences-Journal- des Sciences Hydrologiques,4l(6) December 959-970
[46] CostaAC,Soares A (2006): Identification of inhomogeneities in precipitation time series using SUR models and the Ellipse test. In: Caetano M, Painho M (eds.) Proceedings of Accuracy - 7th International Symposium on Spatial Accuracy Assessment in Natural Resources and Environmental Sciences.Instituto Geográfico Português, pp 419–428
[47] P. Hubert, JP Carbonnel, (1993) « Segmentation annual series of major African rivers flow ». Binding CIEH Bulletin 92 (3)
[48] Hubert P. ,J.P.Carbonnel,A.Chaouche,(1989 ) « Segmentation of hydrometeorological series. Application to a series of precipitation and flow of West Africa ». Journal of Hydrology, 110, pp. 349-367
[49] P. Hubert, (2000) « The segmentation Procedure as a tool for Discrete Modeling of Hydrometeorological Regimes».Stochastic Environmental Research and Risk Assessment, 14 (4-5), pp. 297-304.
[50] Karpouzos Dk, Kavalieratou S, Babajimopoulos C (2010) «Trend analysis of Precipitation data in Pieria Region (Greece)». European Water. 30:31-40
[51] D.P.Lettenmaier, E.F. Wood, J.R. Wallis,(1994) «Hydroclimatological trends in the continental United States (1948–88) ». Journal of Climate, 7 , pp. 586–607
[52] Sen PK (1968) «Estimates of the regression coefficient based on Kendall’s tau ». J. Am. Stat. Assoc. 39:1379–1389
[53] Ayalew D, Tesfaye K, Mamo G, Yitaferu B, Bayu W (2012) «Variability of rainfall and its current trend in Amhara region,Ethiopia».Afr.J.Agric.Res.7(10):1475-1486. http://dx.doi.org/10.5897/AJAR11.698
[54] Mann HB (1945) Mann HB (1945) « Non-parametric test against trend ». Econometrika 13:245–259
[55] Yenigun K, Gumus V, Bulut H (2008) «Trends in stream flow of the Euphrates basin, Turkey ». Proc. Inst. Civil Eng.Water Manage. 161:189–198.doi: 10.1680/wama.2008.161.4.189