Embed Size (px)
Citation preview
Global Energy Trends and it’s Impact on European Petrochemicals
Dusseldorf Mar 11, 2015
01 Large uncertainties in evolution of global crude oil market –
balance of US Light Tight Oil (LTO) production and global
demand evolution will dictate outcomes in the mid-term
Crude oil summary
Crude oil
Oil & Gas industry has rarely seen magnitude and pace of change as in previous 2-3
years; as a result, huge uncertainty in crude industry outlook
Little agreement among various industry players/experts as to crude price outlook
– Bulls – Crude prices will keep going up (Barclays)
– Bears – Increased oil production could take crude to $70-90/bbl (IHS CERA, Citibank)
– Middle of road – Oil production will increase, but not sure of impact on crude prices
(McKinsey, Goldman)
However, few dynamics likely to continue to play a role
– Marginal global supply is currently around $90/bbl, which could be “equilibrium crude
price”
– Fiscal earnings pressures on OPEC countries require $90+ crude oil price
– Downward pressure by Light Tight Oil (LTO) to below $90
3
Recent steep decline in global crude oil price – what happened?
0
20
40
60
80
100
120
140
Jan-1990 Jan-2010 Jan-1995 Jan-2015 Jan-2005 Jan-2000
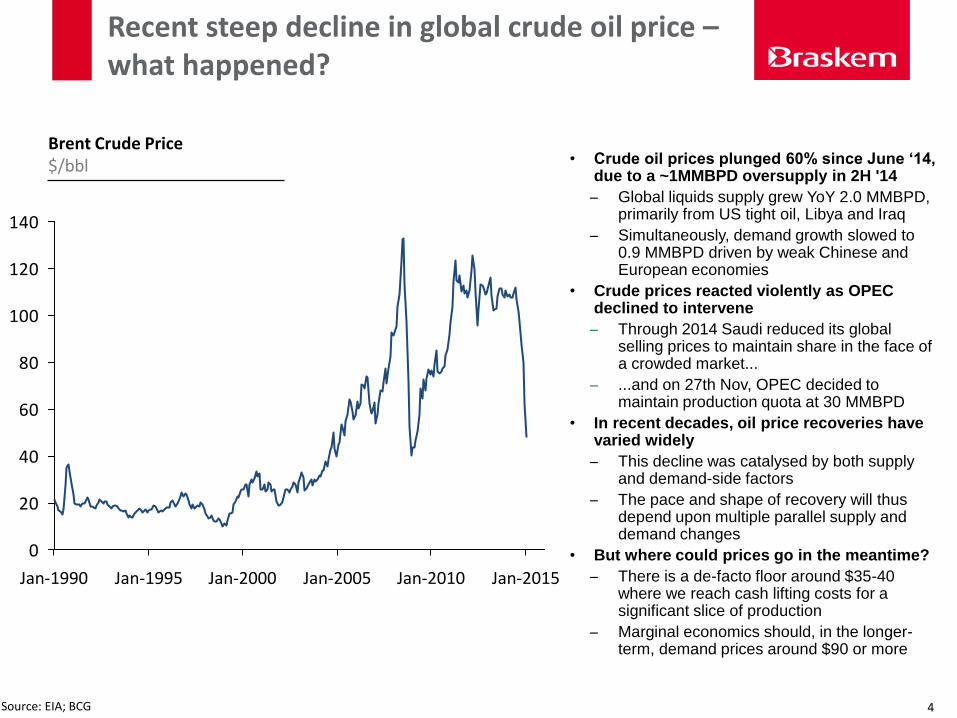
• Crude oil prices plunged 60% since June ‘14, due to a ~1MMBPD oversupply in 2H '14
Global liquids supply grew YoY 2.0 MMBPD, primarily from US tight oil, Libya and Iraq
Simultaneously, demand growth slowed to 0.9 MMBPD driven by weak Chinese and European economies
• Crude prices reacted violently as OPEC declined to intervene
Through 2014 Saudi reduced its global selling prices to maintain share in the face of a crowded market...
...and on 27th Nov, OPEC decided to maintain production quota at 30 MMBPD
• In recent decades, oil price recoveries have varied widely
This decline was catalysed by both supply and demand-side factors
The pace and shape of recovery will thus depend upon multiple parallel supply and demand changes
• But where could prices go in the meantime?
There is a de-facto floor around $35-40 where we reach cash lifting costs for a significant slice of production
Marginal economics should, in the longer-term, demand prices around $90 or more
Brent Crude Price $/bbl
Source: EIA; BCG 4
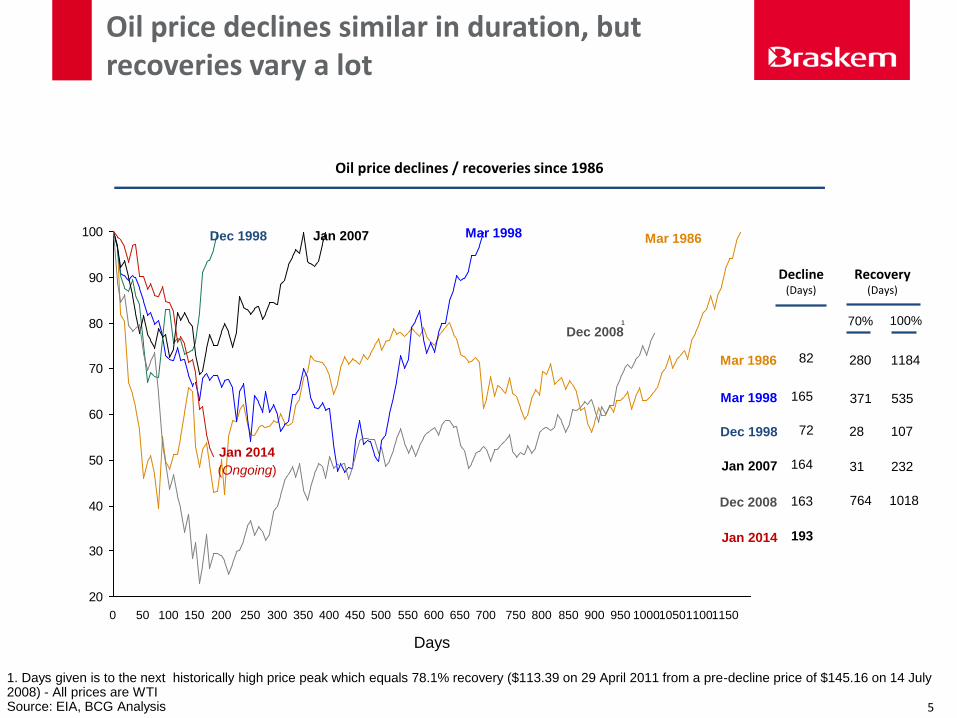
Oil price declines similar in duration, but recoveries vary a lot
20
30
40
50
60
70
80
90
100
Days
1150 1100 1050 1000 950 900 850 800 750 700 650 600 550 500 450 400 350 300 250 200 150 100 50 0
Dec 2008
Mar 1986 Mar 1998 Jan 2007 Dec 1998
Oil price declines / recoveries since 1986
Jan 2014
(Ongoing)
Decline (Days)
Recovery (Days)
82 Mar 1986
Mar 1998
Dec 1998
Jan 2007
Dec 2008
1184
165 535
72 107
164 232
163
Jan 2014 193
1. Days given is to the next historically high price peak which equals 78.1% recovery ($113.39 on 29 April 2011 from a pre-decline price of $145.16 on 14 July 2008) - All prices are WTI Source: EIA, BCG Analysis
1 70% 100%
280
371
28
31
1018 764
5
SOURCE: EIA; Deutsche Bank; ShaleGas.com; USGS; NPC; company announcements; McKinsey
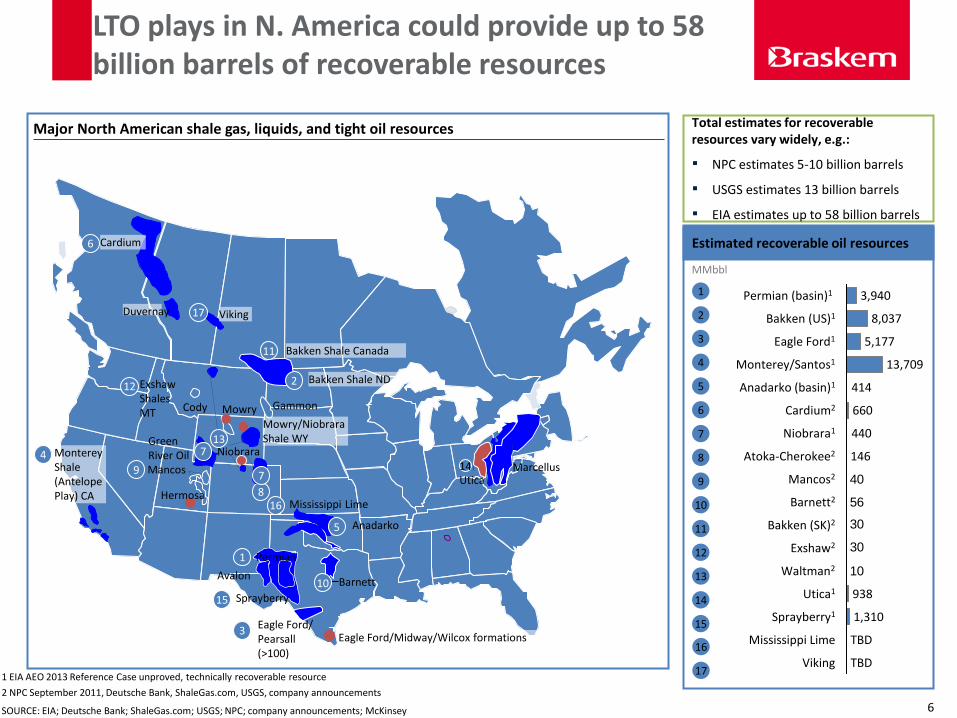
LTO plays in N. America could provide up to 58 billion barrels of recoverable resources
Major North American shale gas, liquids, and tight oil resources
16
12
11
10
9
8
7
6
5
4
3
2
1
MMbbl
13
14
15
17
Estimated recoverable oil resources
Total estimates for recoverable resources vary widely, e.g.:
▪ NPC estimates 5-10 billion barrels
▪ USGS estimates 13 billion barrels
▪ EIA estimates up to 58 billion barrels
Niobrara
Cody Mowry Gammon
Barnett
Eagle Ford/ Pearsall (>100)
Avalon
Anadarko
Mancos Utica
Monterey Shale (Antelope Play) CA
Eagle Ford/Midway/Wilcox formations 3
14
6
12 Exshaw Shales MT
11 Bakken Shale Canada
2 Bakken Shale ND
8
13
4
1
Sprayberry
Permian
5
Mississippi Lime
Mowry/Niobrara Shale WY
7
Green River Oil
Cardium
Duvernay Viking
7
10
15
16
17
Hermosa
Marcellus 9
10
30
30
56
40
8,037
Bakken (SK)2
Niobrara1
Monterey/Santos1
660
Exshaw2
Eagle Ford1 5,177
440
Atoka-Cherokee2
Bakken (US)1
Permian (basin)1
146
Cardium2
Anadarko (basin)1
Mississippi Lime
Sprayberry1
3,940
Viking
938
Waltman2
Utica1
Mancos2
13,709
Barnett2
414
1,310
TBD
TBD 1 EIA AEO 2013 Reference Case unproved, technically recoverable resource
2 NPC September 2011, Deutsche Bank, ShaleGas.com, USGS, company announcements
6
797371655932
80727066625958575450424234
968572
494637
106100
6889
575644
0
50
100
150
Bak
ken
- N
ort
her
n E
xten
sio
n
Gra
nit
e W
ash
- H
emp
hill
Gra
nit
e W
ash
- R
ob
erts
Eagl
e Fo
rd -
Wes
t O
il
Bak
ken
- S
ou
ther
n E
xten
sio
n
Cle
vela
nd
Bak
ken
- W
este
rn E
xten
sio
n
DJ
Nio
bra
ra -
EO
G
Bak
ken
- B
aile
y
Mis
s Li
me
Hz
SK B
akke
n -
Ver
y Po
or
to P
oo
r
Bak
ken
- E
ast
Nes
son
Gra
nit
e W
ash
- W
hee
ler
Bak
ken
- F
BIR
Bak
ken
- N
esso
n A
nti
clin
e
Bo
ne
Spri
ng
- Sh
elf
Slo
pe
Spra
ber
ry W
olf
ber
ry -
Bas
in C
en
Bak
ken
- E
lm C
ou
lee
SK B
akke
n -
Bila
ts
Gra
nit
e W
ash
- W
ash
ita
Eagl
e Fo
rd -
Eas
t O
il
DJ
Nio
bra
ra -
Oth
er
Spra
ber
ry W
olf
ber
ry -
W F
lan
k
Bak
ken
- S
anis
h P
arsh
all
SK B
akke
n -
Fai
r to
Go
od
Eagl
e Fo
rd -
Eas
t C
on
dy
Eagl
e Fo
rd -
Wes
t C
on
dy
PR
B N
iob
rara
- H
igh
Eagl
e Fo
rd -
Eas
t W
et G
as
Bo
ne
Spri
ng
- B
asin
Cen
ter
Eagl
e Fo
rd -
Wes
t W
et G
as
SK B
akke
n -
VG
to
Exc
elle
nt
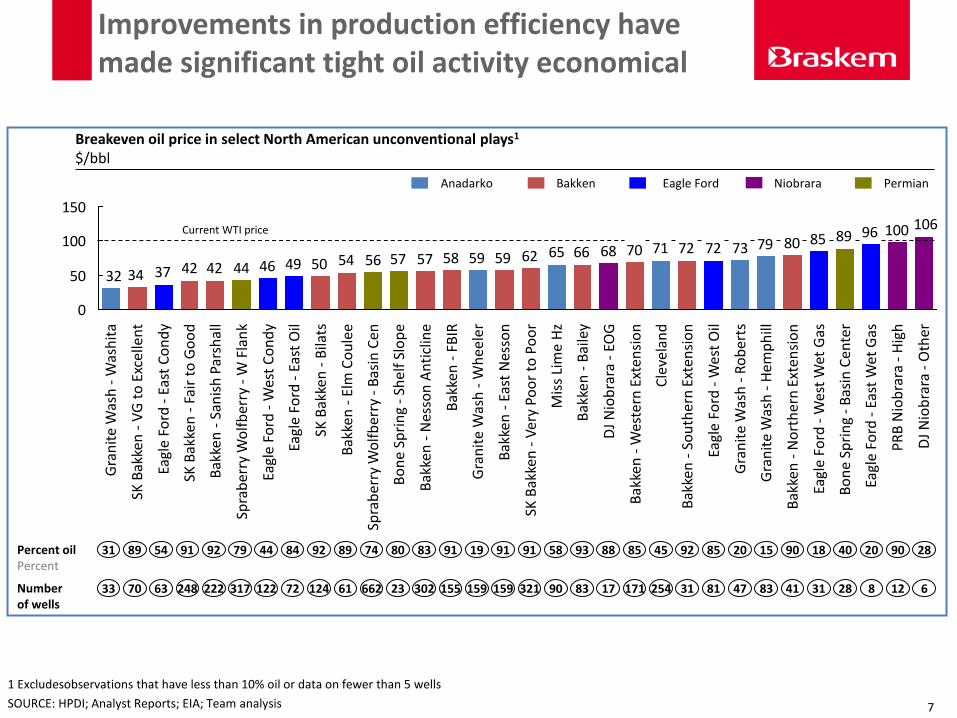
Breakeven oil price in select North American unconventional plays1
$/bbl
31 Percent oil Percent
89 54 91 92 79 44 84 92 89 74 80 83 91 19 91 91 58 93 88 85 45 92 85 20 15 90 18 40 20 90 28
33 Number of wells
70 63 248 222 317 122 72 124 61 662 23 302 155 159 159 321 90 83 17 171 254 31 81 47 83 41 31 28 8 12 6
Anadarko Bakken Eagle Ford Niobrara Permian
1 Excludesobservations that have less than 10% oil or data on fewer than 5 wells
SOURCE: HPDI; Analyst Reports; EIA; Team analysis
Current WTI price
Improvements in production efficiency have made significant tight oil activity economical
7
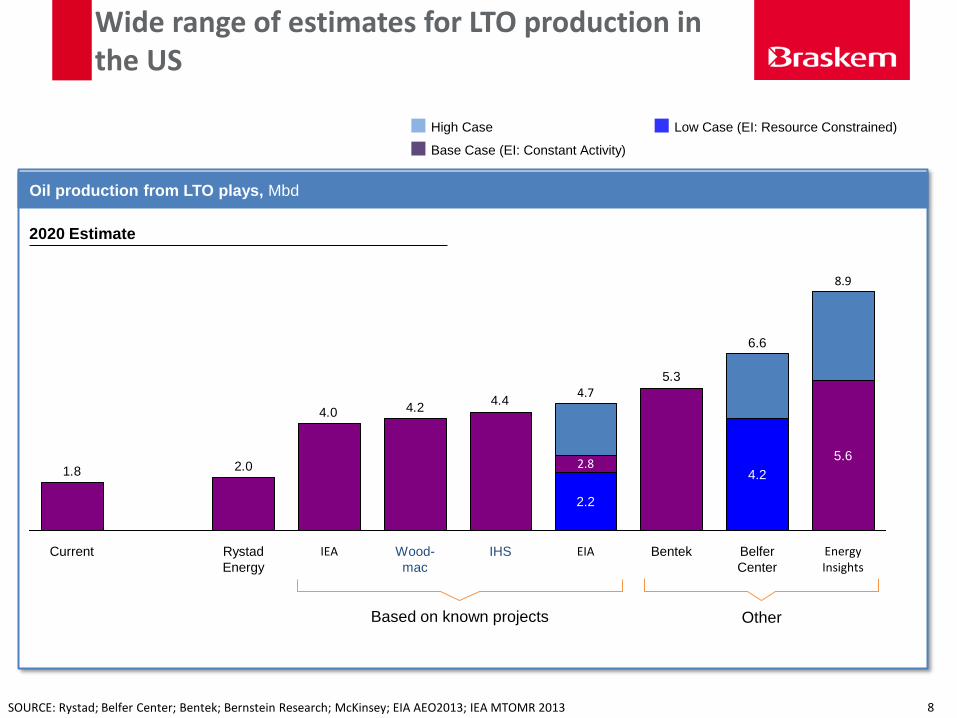
2020 Estimate
Wide range of estimates for LTO production in the US
Based on known projects Other
Oil production from LTO plays, Mbd
5.3
4.44.24.0
2.01.8
Energy Insights
8.9
5.6
Belfer
Center
6.6
4.2
Bentek EIA
4.7
2.2
2.8
IHS Wood-
mac
IEA Rystad
Energy
Current
SOURCE: Rystad; Belfer Center; Bentek; Bernstein Research; McKinsey; EIA AEO2013; IEA MTOMR 2013
High Case
Base Case (EI: Constant Activity)
Low Case (EI: Resource Constrained)
8
SOURCE: Energy Insights
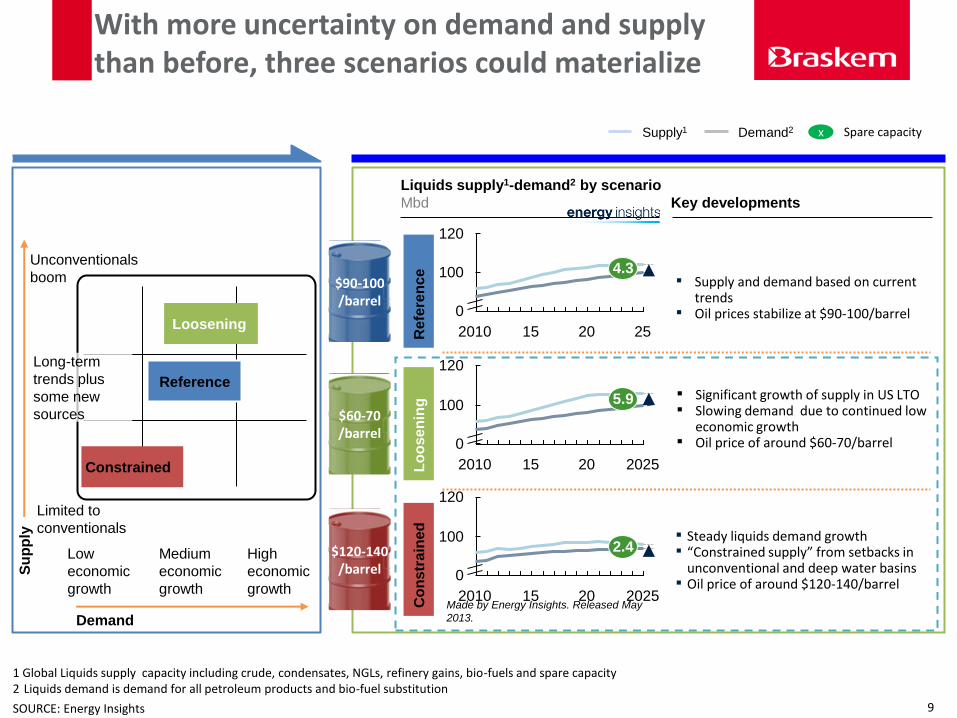
Liquids supply1-demand2 by scenario
Mbd
Lo
ose
nin
g
Su
pp
ly
Low
economic
growth
Medium
economic
growth
High
economic
growth
Demand
Constrained
Co
ns
tra
ine
d
120
100
0
4.3
2520152010
120
100
0
5.9
202520152010
120
100
0
2.4
202520152010Made by Energy Insights. Released May
2013.
1 Global Liquids supply capacity including crude, condensates, NGLs, refinery gains, bio-fuels and spare capacity 2 Liquids demand is demand for all petroleum products and bio-fuel substitution
Loosening
Unconventionals
boom
Limited to
conventionals
▪ Supply and demand based on current trends
▪ Oil prices stabilize at $90-100/barrel
▪ Significant growth of supply in US LTO ▪ Slowing demand due to continued low
economic growth ▪ Oil price of around $60-70/barrel
▪ Steady liquids demand growth ▪ “Constrained supply” from setbacks in
unconventional and deep water basins ▪ Oil price of around $120-140/barrel
Key developments
With more uncertainty on demand and supply than before, three scenarios could materialize
Reference
Re
fere
nc
e
$90-100 /barrel
$60-70 /barrel
$120-140 /barrel
Demand2 Supply1 x Spare capacity
Long-term
trends plus
some new
sources
9
02 N. America likely to enjoy low natural gas prices in the mid-
to-long term; chemicals and energy intensive manufacturing
will benefit
Natural gas summary
Large proven reserves of natural gas from current shale gas fields in N.America
Natural gas will also be produced from Tight Oil plays
LNG exports unlikely to be significant, and even if so, not expected to be big impact on
NG pricing
Largely, agreement that long-term N. America NG prices will be at $3-5/mmbtu
Price range does not reflect good growth of LTO which has associated gas
Asia uses large amounts of fuel oil for power and heat, so gas price likely to be linked to
crude oil ($15/mmbtu range)
EU gas price will likely be below fuel oil due to ability to develop more resource, but still
in the $8/mmbtu range
Natural
Gas
11
SOURCE: EIA; Deutsche Bank; Shale Gas.com; USGS; NPC; Company announcements; McKinsey analysis
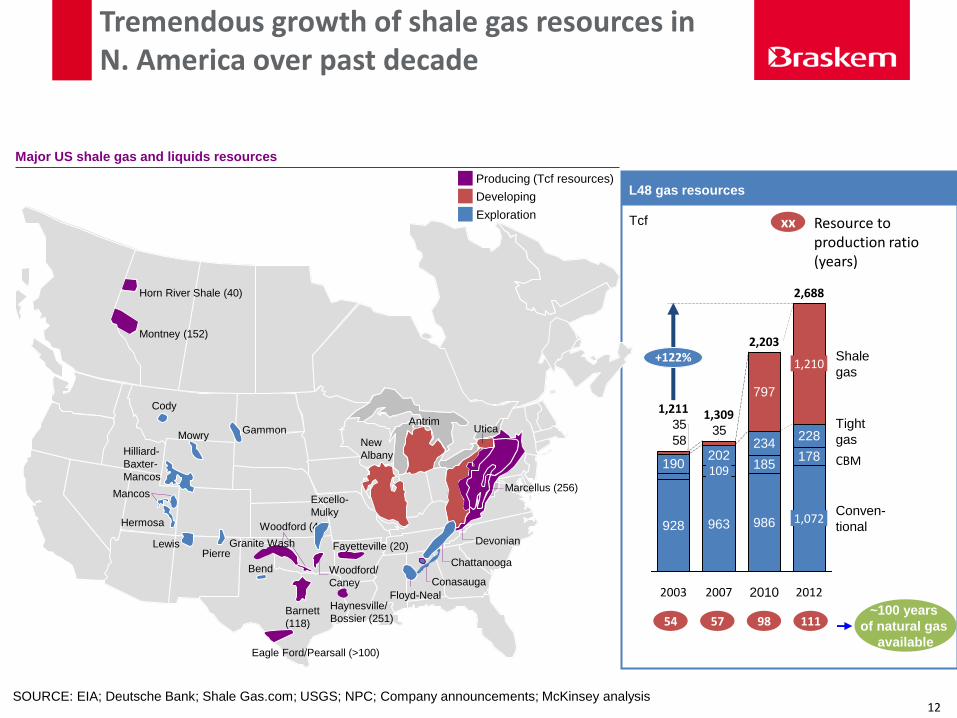
Tremendous growth of shale gas resources in N. America over past decade
L48 gas resources
Tcf
~100 years
of natural gas
available
xx Resource to production ratio (years)
54 57
583535
2012
2,688
1,072
178
228
1,210
2010
2,203
986
185
234
797
2007
1,309
963
109 202
2003
928
190
Conven-
tional
+122%
CBM
Tight
gas
Shale
gas
1,211
98 111
Major US shale gas and liquids resources
Exploration
Developing
Producing (Tcf resources)
Cody
Mowry Gammon
Excello-
Mulky
Marcellus (256)
Devonian
Chattanooga
Conasauga
Floyd-Neal Haynesville/
Bossier (251)
Woodford/
Caney
Barnett
(118)
Eagle Ford/Pearsall (>100)
Woodford (42)
Bend
Pierre Lewis
Hermosa
Mancos
Hilliard-
Baxter-
Mancos
Antrim Utica
Horn River Shale (40)
Montney (152)
Granite Wash Fayetteville (20)
New
Albany
12
SOURCE: EIA; HPDI; McKinsey analysis
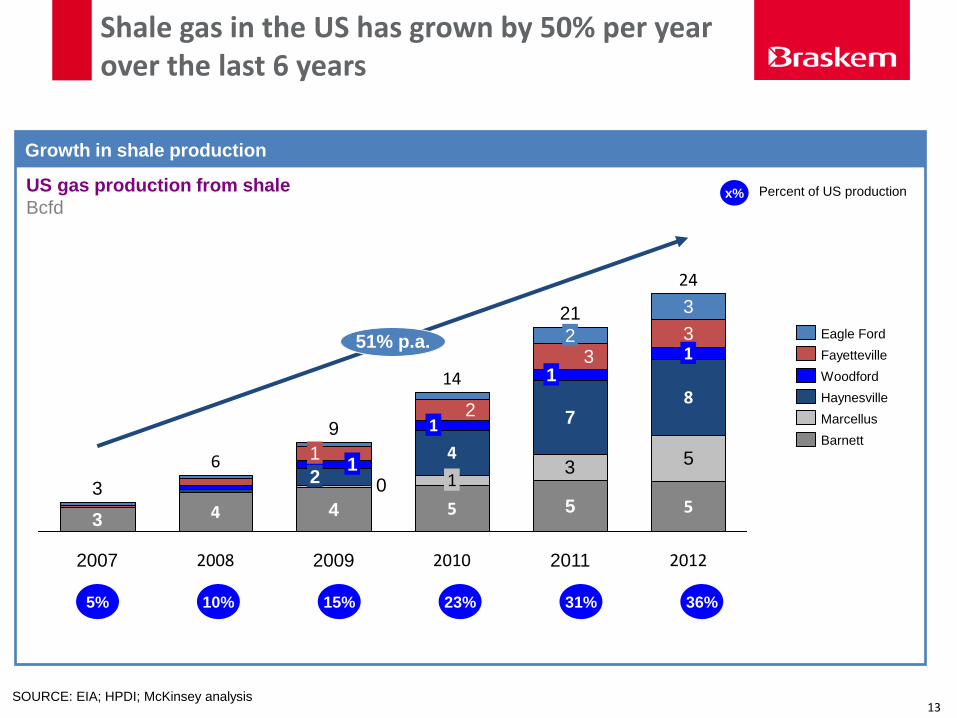
Growth in shale production
35
0
2012
24
5
8
1 3
3
2011
21
5
7
1 3
2
2010
14
51% p.a.
5
1
4
1 2
2009
9
4
2 1
1
2008
6
4
2007
3
3
Barnett
Marcellus
Haynesville
Woodford
Fayetteville
Eagle Ford
US gas production from shale
Bcfd
5% 15% 31%
x% Percent of US production
Shale gas in the US has grown by 50% per year over the last 6 years
10% 23% 36%
13
SOURCE: EIA; HPDI; McKinsey analysis
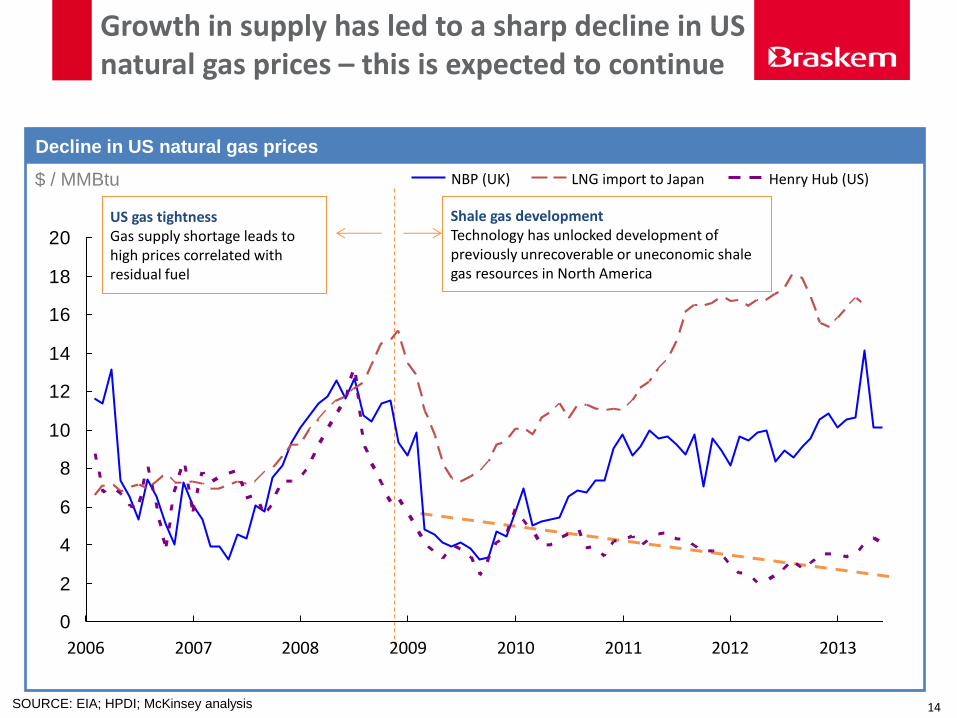
Growth in supply has led to a sharp decline in US natural gas prices – this is expected to continue
Decline in US natural gas prices
$ / MMBtu
US gas tightness Gas supply shortage leads to high prices correlated with residual fuel
Shale gas development Technology has unlocked development of previously unrecoverable or uneconomic shale gas resources in North America
0
2
4
6
8
10
12
14
16
18
20
2009 2013 2012 2011 2010 2006 2008 2007
LNG import to Japan NBP (UK) Henry Hub (US)
14
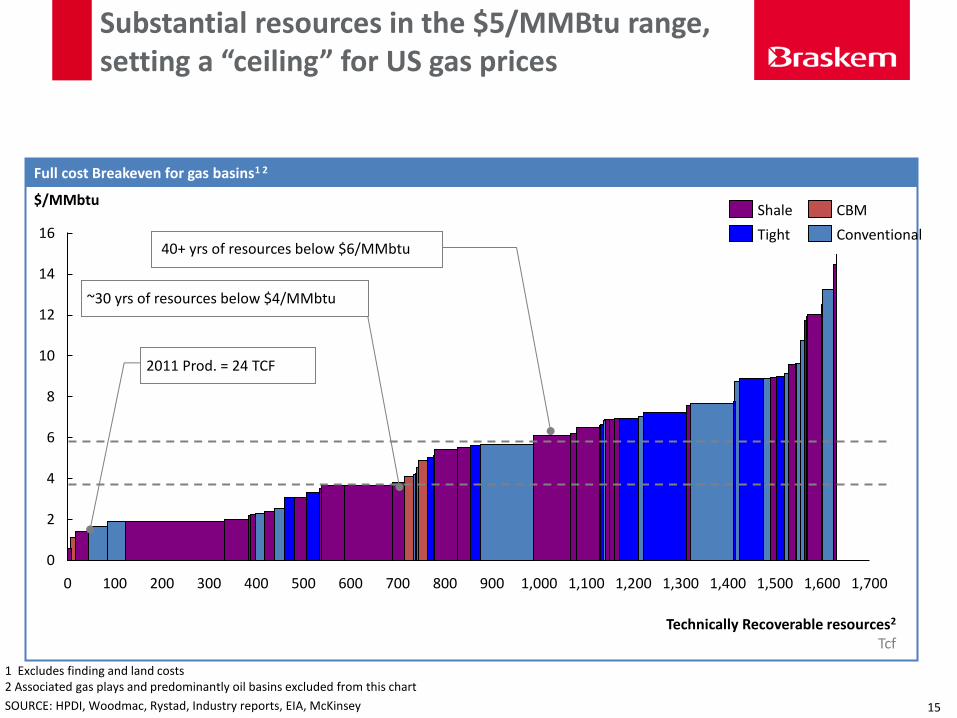
1 Excludes finding and land costs 2 Associated gas plays and predominantly oil basins excluded from this chart
SOURCE: HPDI, Woodmac, Rystad, Industry reports, EIA, McKinsey
1,000
8
200
4
2
0
1,700 1,600 1,500 800 700 600 500 900
6
400 300 100 0
16
14
12
10
1,300 1,200 1,100 1,400
Technically Recoverable resources2
Tcf
Full cost Breakeven for gas basins1 2
$/MMbtu
Conventional
CBM
Tight
Shale
Substantial resources in the $5/MMBtu range, setting a “ceiling” for US gas prices
2011 Prod. = 24 TCF
~30 yrs of resources below $4/MMbtu
40+ yrs of resources below $6/MMbtu
15
03 Low cost feedstock in N. America will impact global dynamics
of ethylene and propylene; W. Europe continues to remain at
disadvantaged position
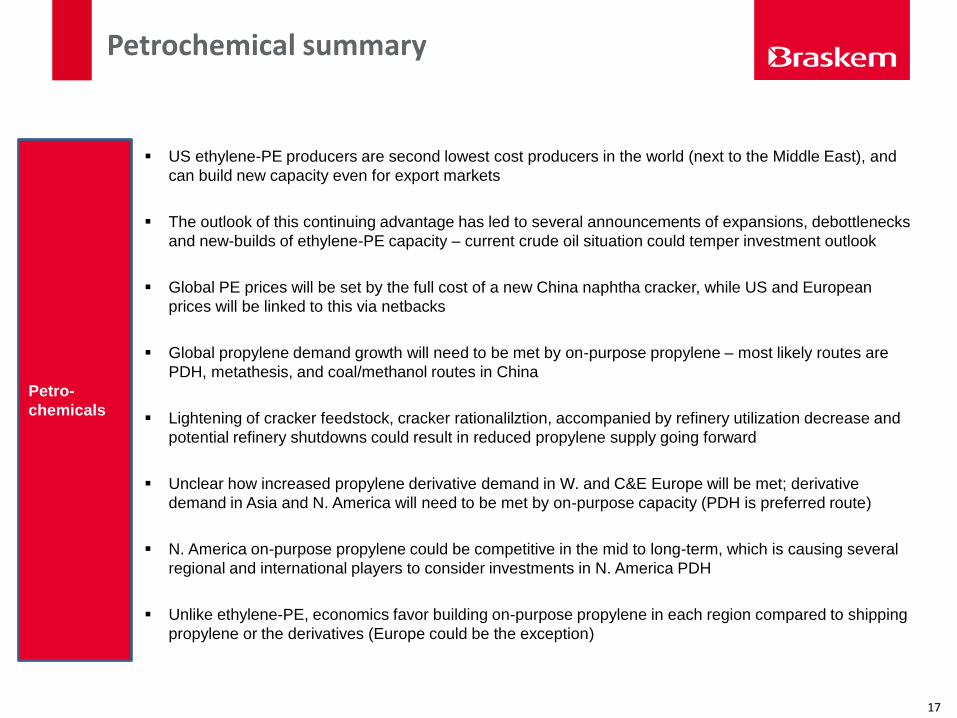
Petrochemical summary
US ethylene-PE producers are second lowest cost producers in the world (next to the Middle East), and
can build new capacity even for export markets
The outlook of this continuing advantage has led to several announcements of expansions, debottlenecks
and new-builds of ethylene-PE capacity – current crude oil situation could temper investment outlook
Global PE prices will be set by the full cost of a new China naphtha cracker, while US and European
prices will be linked to this via netbacks
Global propylene demand growth will need to be met by on-purpose propylene – most likely routes are
PDH, metathesis, and coal/methanol routes in China
Lightening of cracker feedstock, cracker rationalilztion, accompanied by refinery utilization decrease and
potential refinery shutdowns could result in reduced propylene supply going forward
Unclear how increased propylene derivative demand in W. and C&E Europe will be met; derivative
demand in Asia and N. America will need to be met by on-purpose capacity (PDH is preferred route)
N. America on-purpose propylene could be competitive in the mid to long-term, which is causing several
regional and international players to consider investments in N. America PDH
Unlike ethylene-PE, economics favor building on-purpose propylene in each region compared to shipping
propylene or the derivatives (Europe could be the exception)
Petro-
chemicals
17
150,000
1,500
1,000
500
0
100,000 50,000 0
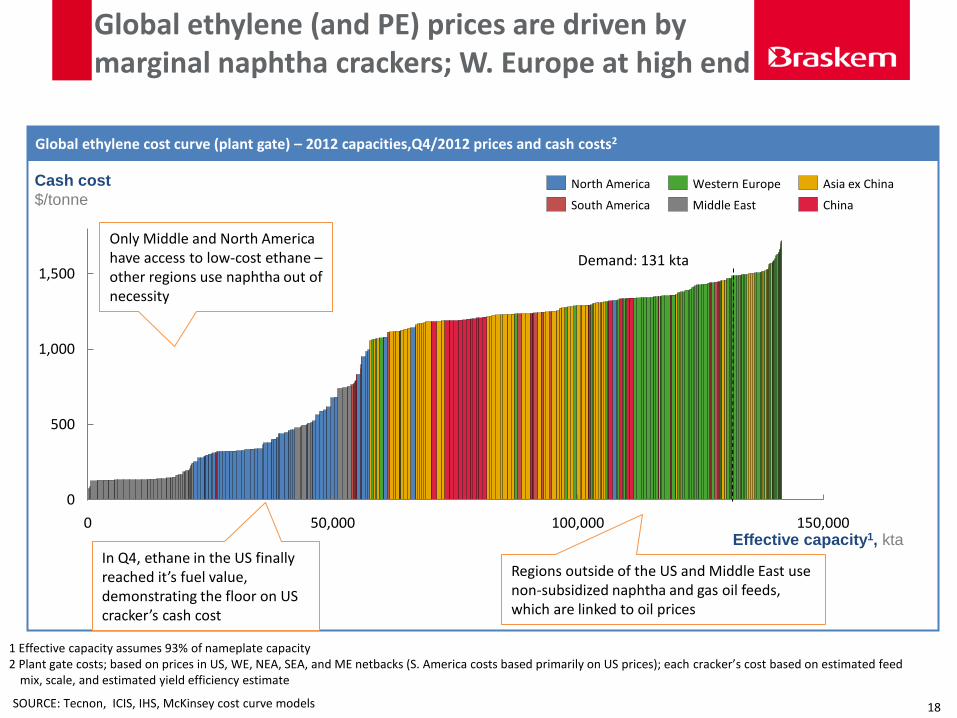
Global ethylene (and PE) prices are driven by marginal naphtha crackers; W. Europe at high end
SOURCE: Tecnon, ICIS, IHS, McKinsey cost curve models
Effective capacity1, kta
Demand: 131 kta
Cash cost
$/tonne
Global ethylene cost curve (plant gate) – 2012 capacities,Q4/2012 prices and cash costs2
China
Asia ex China
Middle East
Western Europe
South America
North America
Only Middle and North America have access to low-cost ethane – other regions use naphtha out of necessity
In Q4, ethane in the US finally reached it’s fuel value, demonstrating the floor on US cracker’s cash cost
Regions outside of the US and Middle East use non-subsidized naphtha and gas oil feeds, which are linked to oil prices
1 Effective capacity assumes 93% of nameplate capacity 2 Plant gate costs; based on prices in US, WE, NEA, SEA, and ME netbacks (S. America costs based primarily on US prices); each cracker’s cost based on estimated feed
mix, scale, and estimated yield efficiency estimate
18
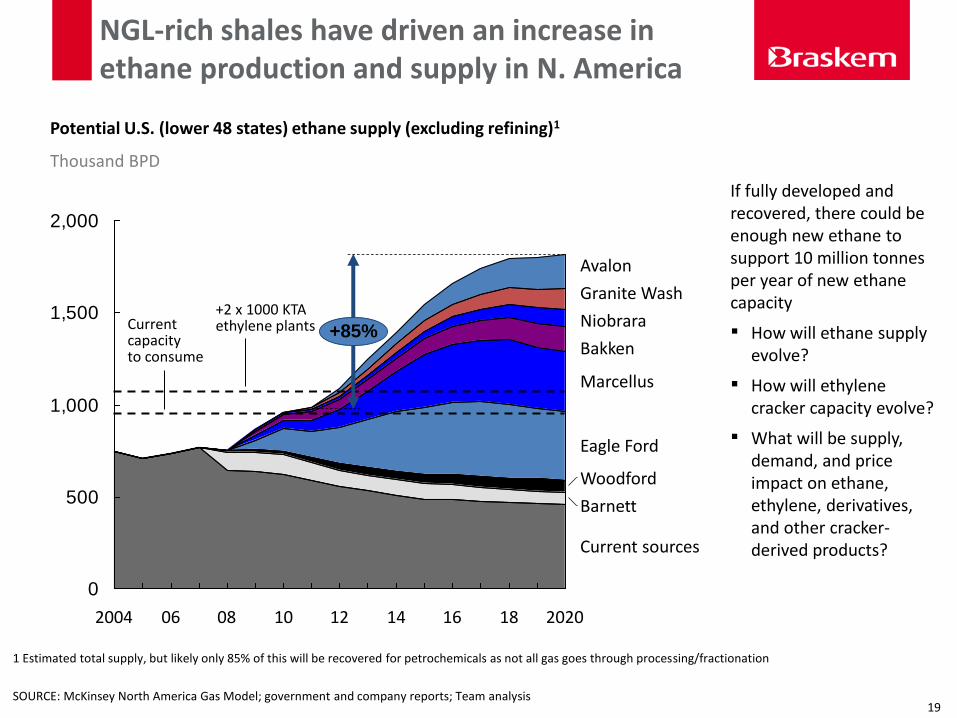
Potential U.S. (lower 48 states) ethane supply (excluding refining)1
NGL-rich shales have driven an increase in ethane production and supply in N. America
+2 x 1000 KTA ethylene plants Current
capacity to consume
Thousand BPD
SOURCE: McKinsey North America Gas Model; government and company reports; Team analysis
If fully developed and recovered, there could be enough new ethane to support 10 million tonnes per year of new ethane capacity
▪ How will ethane supply evolve?
▪ How will ethylene cracker capacity evolve?
▪ What will be supply, demand, and price impact on ethane, ethylene, derivatives, and other cracker-derived products?
0
500
1,000
1,500
2,000
14 12 10 08 06 2004
Woodford
Barnett
Niobrara
Granite Wash
Avalon
2020 18
+85%
Current sources
Eagle Ford
Marcellus
Bakken
16
1 Estimated total supply, but likely only 85% of this will be recovered for petrochemicals as not all gas goes through processing/fractionation
19
20
30
25
35
40
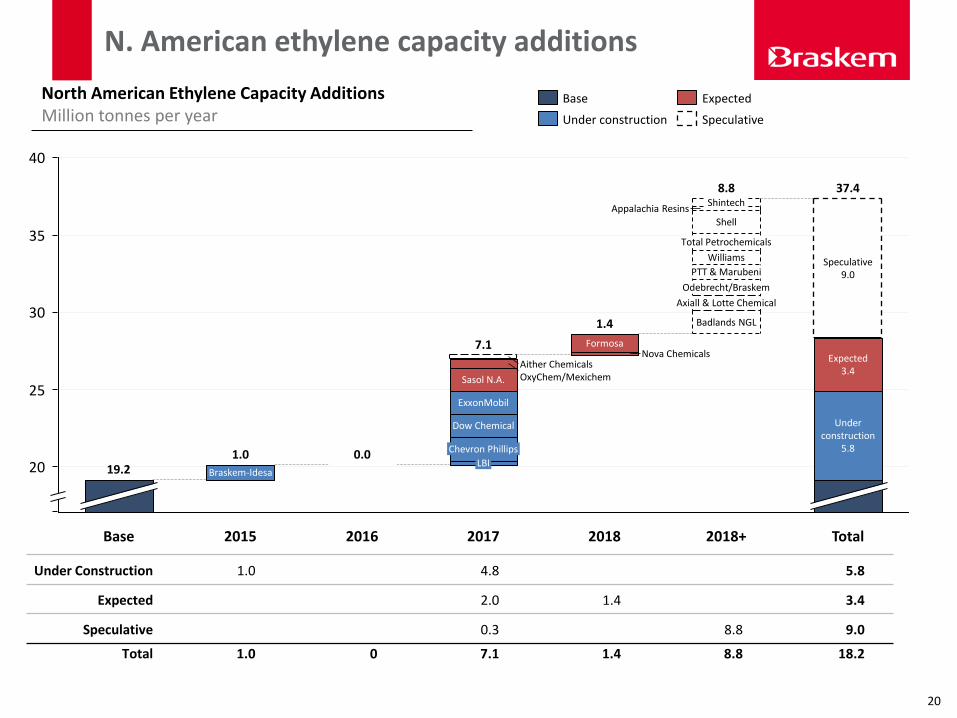
19.2
Odebrecht/Braskem
Shintech Appalachia Resins
Shell
Total Petrochemicals
Williams
PTT & Marubeni
Badlands NGL
2018
1.4
Formosa
Axiall & Lotte Chemical
37.4
Speculative 9.0
Expected 3.4
2018+
8.8
ExxonMobil
Dow Chemical
Chevron Phillips
Total
Under construction
5.8
LBI
2016
0.0
Nova Chemicals
2017
7.1
Aither Chemicals OxyChem/Mexichem Sasol N.A.
2015
1.0
Braskem-Idesa
Base
Under Construction 1.0 4.8 5.8
Expected 2.0 1.4 3.4
Speculative 0.3 8.8 9.0
Total 1.0 0 7.1 1.4 8.8 18.2
North American Ethylene Capacity Additions
Million tonnes per year
N. American ethylene capacity additions
Speculative
Expected
Under construction
Base
20
0
1,000
800
600
400
200
1,200
40 30 20 10 0 40 30 20 10 0
800
600
400
200
1,200
1,000
0
40 30 20 10 0
SOURCE: McKinsey
1 Based on April 2009 prices for feeds and coproducts (except CC4 prices determined by model); outlook demand based on significant recession
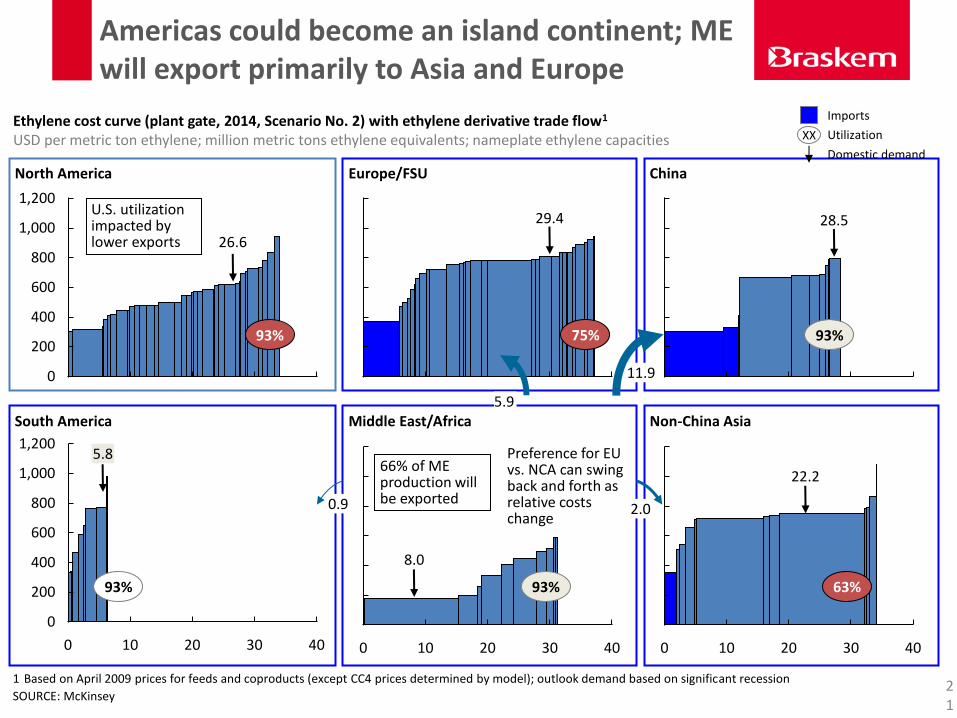
Imports
Utilization XX
Domestic demand
Ethylene cost curve (plant gate, 2014, Scenario No. 2) with ethylene derivative trade flow1 USD per metric ton ethylene; million metric tons ethylene equivalents; nameplate ethylene capacities
North America Europe/FSU China
South America Middle East/Africa Non-China Asia
U.S. utilization impacted by lower exports
66% of ME production will be exported
Preference for EU vs. NCA can swing back and forth as relative costs change
93% 75% 93%
63% 93% 93%
26.6
29.4 28.5
22.2
8.0
5.8
0.9
11.9
2.0
5.9
Americas could become an island continent; ME will export primarily to Asia and Europe
21
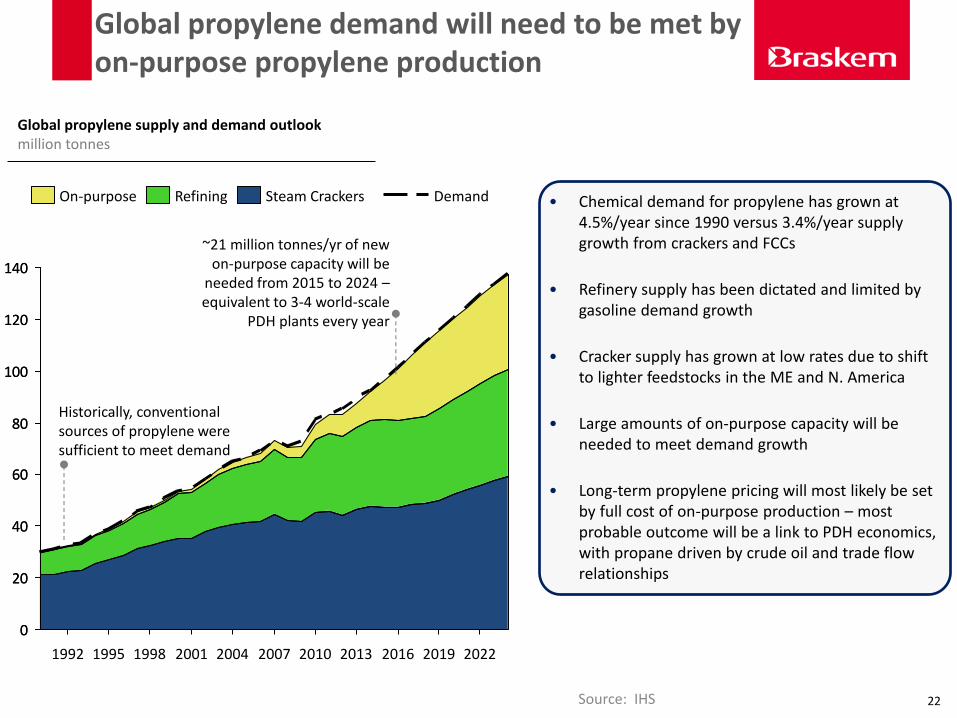
Global propylene demand will need to be met by on-purpose propylene production
Source: IHS
0
20
40
60
80
100
120
140
0
20
40
60
80
100
120
140
2007 2016 2022 1995 2019 2013 2010 1992 2004 1998 2001
Demand
Global propylene supply and demand outlook million tonnes
Historically, conventional sources of propylene were sufficient to meet demand
~21 million tonnes/yr of new on-purpose capacity will be
needed from 2015 to 2024 – equivalent to 3-4 world-scale
PDH plants every year
• Chemical demand for propylene has grown at 4.5%/year since 1990 versus 3.4%/year supply growth from crackers and FCCs
• Refinery supply has been dictated and limited by gasoline demand growth
• Cracker supply has grown at low rates due to shift to lighter feedstocks in the ME and N. America
• Large amounts of on-purpose capacity will be needed to meet demand growth
• Long-term propylene pricing will most likely be set by full cost of on-purpose production – most probable outcome will be a link to PDH economics, with propane driven by crude oil and trade flow relationships
Refining Steam Crackers On-purpose
22
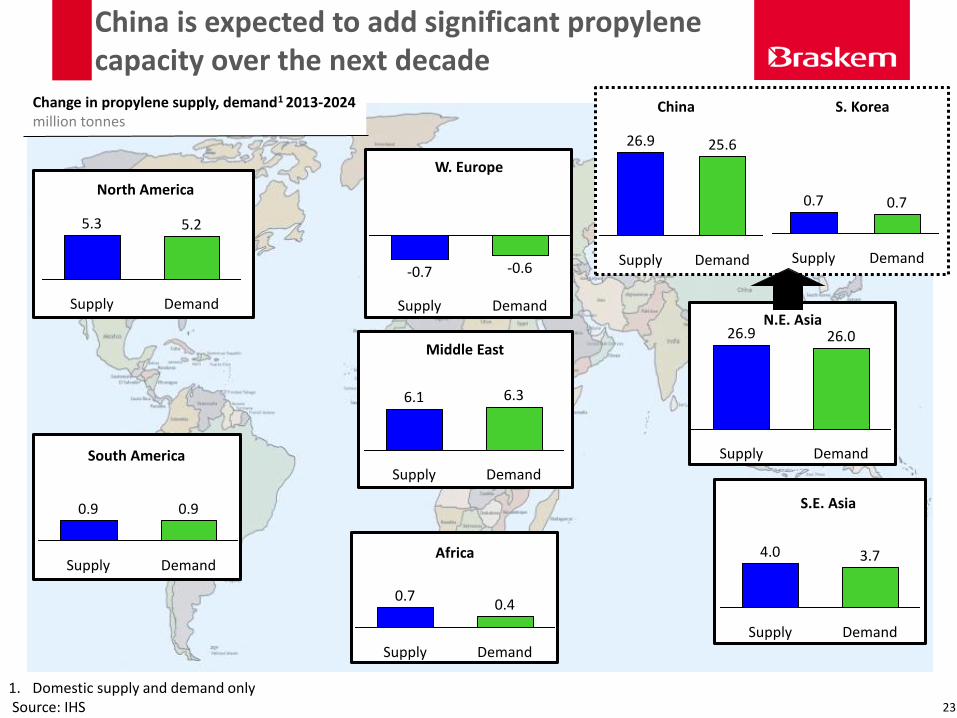
Change in propylene supply, demand1 2013-2024
million tonnes
China is expected to add significant propylene capacity over the next decade
North America
South America
W. Europe
Middle East
Africa
N.E. Asia
S.E. Asia
1. Domestic supply and demand only Source: IHS
China S. Korea
Demand
5.3
Supply
5.2
-0.7 -0.6
Demand Supply
Supply
0.9
Demand
0.9
Supply
0.7 0.4
Demand
Supply
6.3 6.1
Demand
Supply
3.7
Demand
4.0
26.0 26.9
Supply Demand
Demand
26.9 25.6
Supply
0.7 0.7
Demand Supply
23
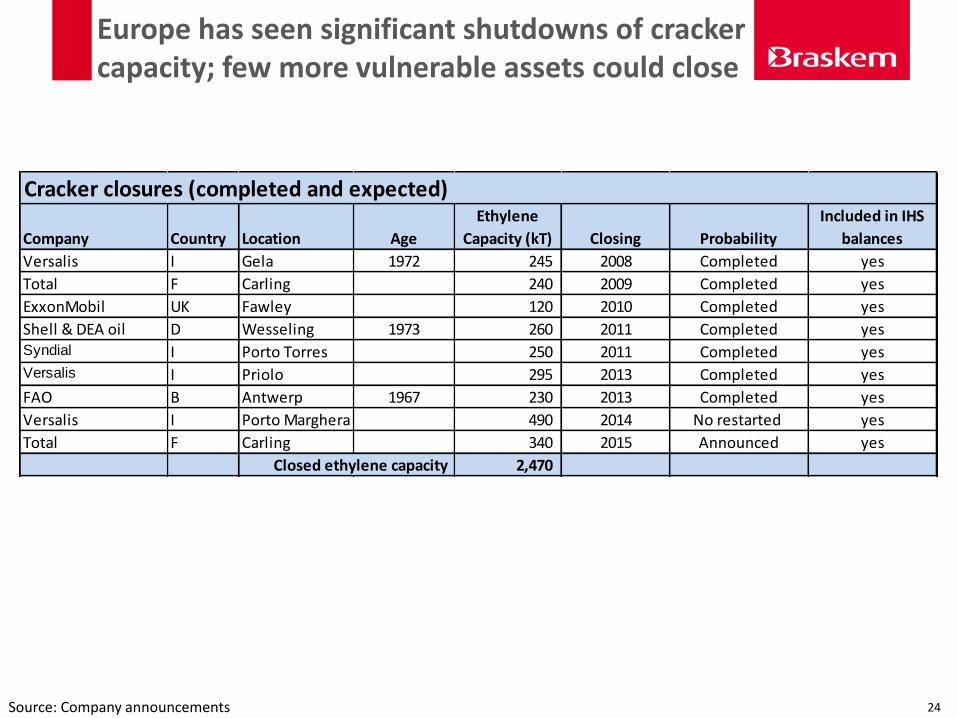
Europe has seen significant shutdowns of cracker capacity; few more vulnerable assets could close
Company Country Location Age
Ethylene
Capacity (kT) Closing Probability
Included in IHS
balances
Versalis I Gela 1972 245 2008 Completed yes
Total F Carling 240 2009 Completed yes
ExxonMobil UK Fawley 120 2010 Completed yes
Shell & DEA oil D Wesseling 1973 260 2011 Completed yesSyndial I Porto Torres 250 2011 Completed yesVersalis I Priolo 295 2013 Completed yes
FAO B Antwerp 1967 230 2013 Completed yes
Versalis I Porto Marghera 490 2014 No restarted yes
Total F Carling 340 2015 Announced yes
Closed ethylene capacity 2,470 Vunerable assets
Dow NL Terneuzen 1970 535 no
Repsol Sp Sines 250 no
Potential closures 785
Cracker closures (completed and expected)
24 Source: Company announcements
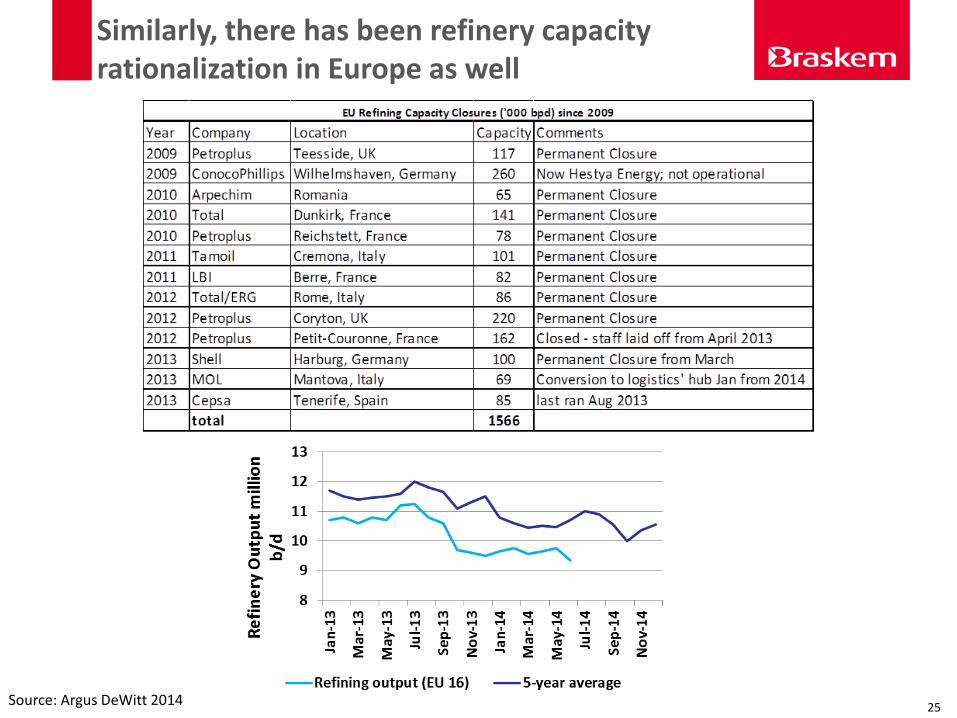
Similarly, there has been refinery capacity rationalization in Europe as well
Source: Argus DeWitt 2014 25
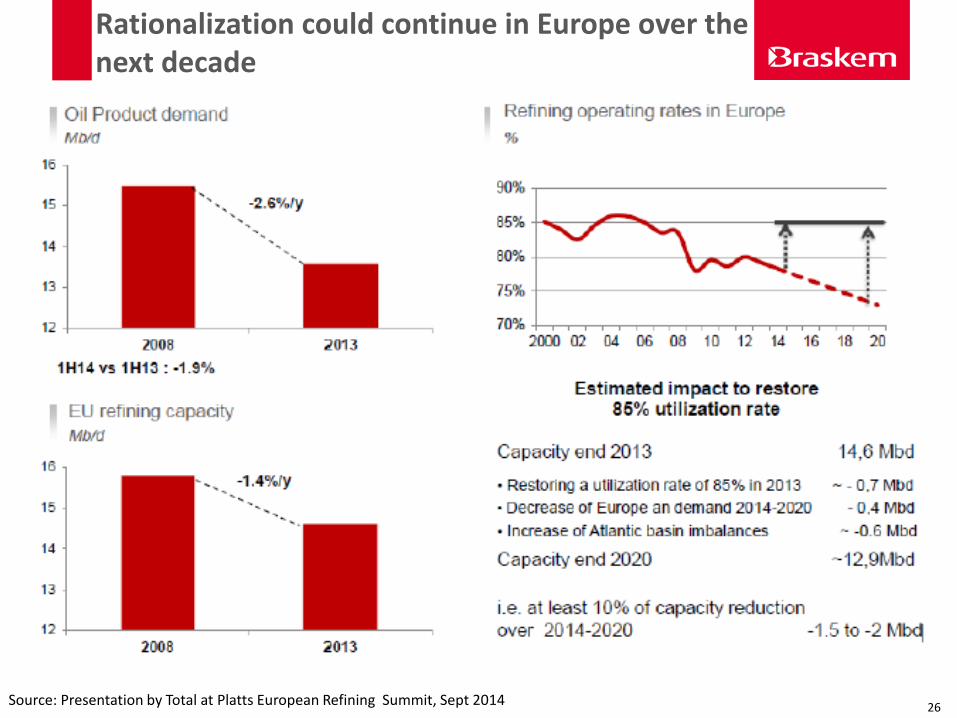
Rationalization could continue in Europe over the next decade
Source: Presentation by Total at Platts European Refining Summit, Sept 2014 26
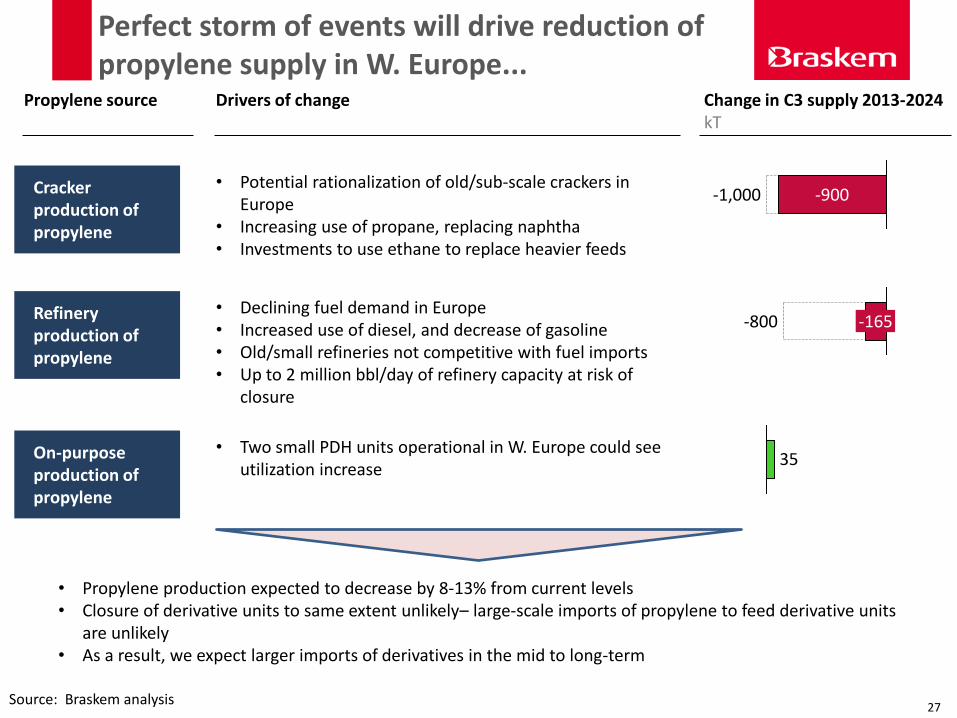
Perfect storm of events will drive reduction of propylene supply in W. Europe...
27
• Potential rationalization of old/sub-scale crackers in Europe
• Increasing use of propane, replacing naphtha • Investments to use ethane to replace heavier feeds
-900 -1,000 Cracker production of propylene
Source: Braskem analysis
Drivers of change Propylene source Change in C3 supply 2013-2024 kT
• Declining fuel demand in Europe • Increased use of diesel, and decrease of gasoline • Old/small refineries not competitive with fuel imports • Up to 2 million bbl/day of refinery capacity at risk of
closure
-800 -165 Refinery production of propylene
35 On-purpose production of propylene
• Propylene production expected to decrease by 8-13% from current levels • Closure of derivative units to same extent unlikely– large-scale imports of propylene to feed derivative units
are unlikely • As a result, we expect larger imports of derivatives in the mid to long-term
• Two small PDH units operational in W. Europe could see utilization increase
27
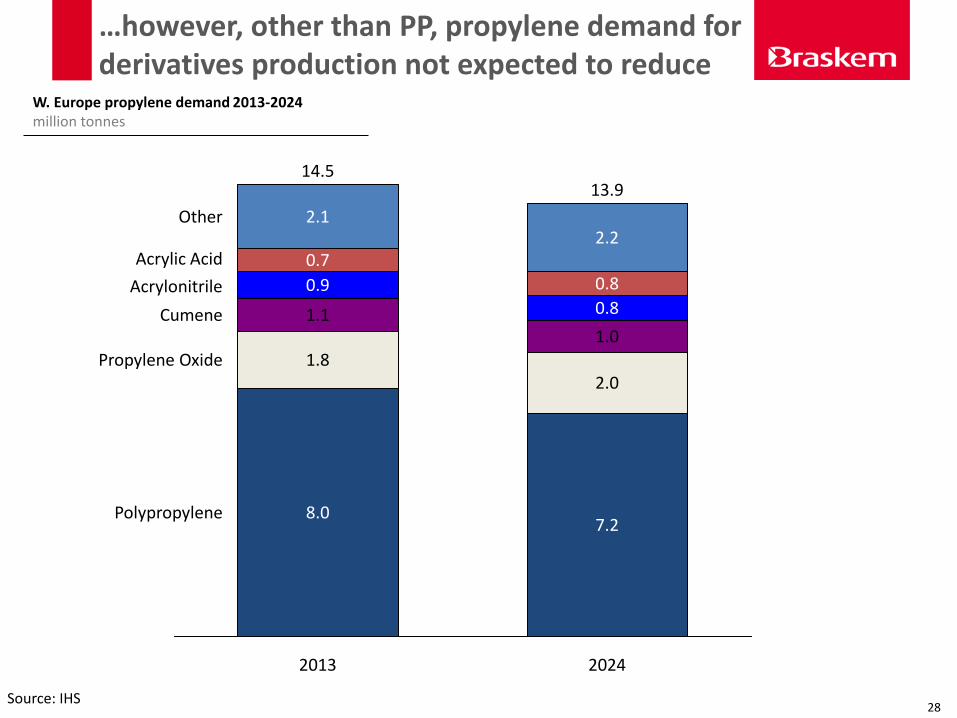
…however, other than PP, propylene demand for derivatives production not expected to reduce
1.8
8.0
Propylene Oxide
1.1
0.8
2.2
1.0
7.2
2.0
14.5
0.9
0.7
2.1
13.9
0.8
Polypropylene
2013 2024
Cumene
Other
Acrylic Acid
Acrylonitrile
W. Europe propylene demand 2013-2024
million tonnes
Source: IHS 28
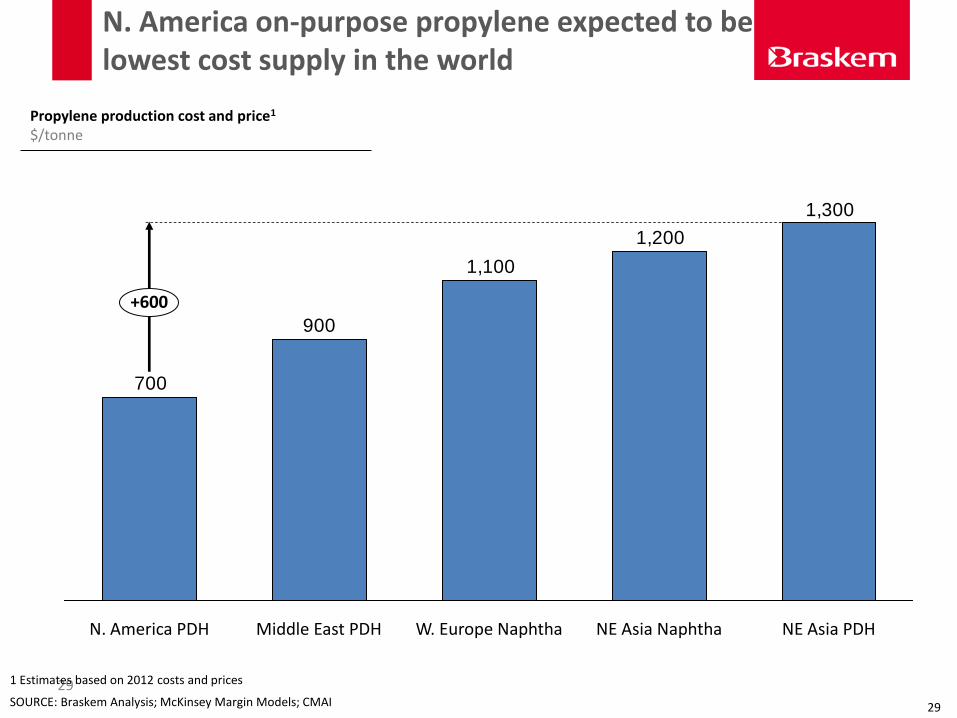
N. America on-purpose propylene expected to be lowest cost supply in the world
29 SOURCE: Braskem Analysis; McKinsey Margin Models; CMAI
Propylene production cost and price1 $/tonne
1,300
1,200
1,100
900
700
+600
NE Asia PDH NE Asia Naphtha W. Europe Naphtha Middle East PDH N. America PDH
1 Estimates based on 2012 costs and prices
29
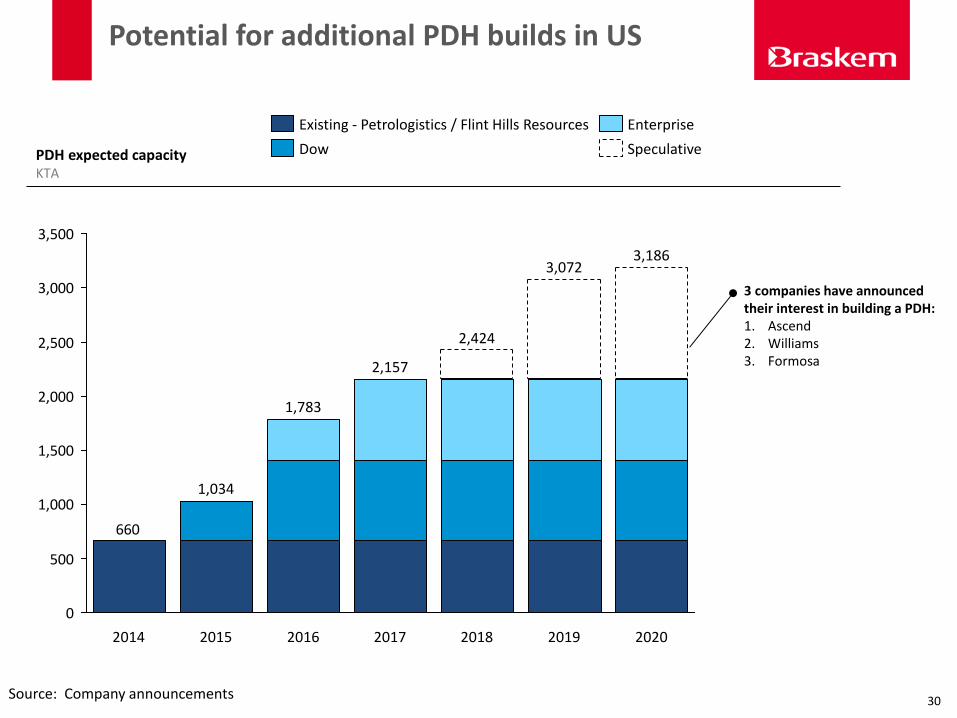
Potential for additional PDH builds in US
Source: Company announcements
PDH expected capacity KTA
660
0
500
1,000
1,500
2,000
2,500
3,000
3,500
2019
3,072
2018
2,424
2020
3,186
2017
2,157
2016
1,783
2015
1,034
2014
Speculative Dow
Enterprise Existing - Petrologistics / Flint Hills Resources
3 companies have announced their interest in building a PDH: 1. Ascend 2. Williams 3. Formosa
30
Summary
Uncertainties in global energy markets likely to continue
Impact of how energy market evolves could be significant for petrochemicals
Rush for new investments in ME, China and US showing signs of slow down given uncertainty in crude oil markets
European disadvantage in petrochemicals likely to continue, however, survivors
31

Thank you!