Embed Size (px)
Citation preview
Earth Sciences 2015; 4(4): 129-145 Published online June 26, 2015 (http://www.sciencepublishinggroup.com/j/earth) doi: 10.11648/j.earth.20150404.11 ISSN: 2328-5974 (Print); ISSN: 2328-5982 (Online)
Trend of Mineral Commodity Price and its Impact on the Indonesia Economy 1990-2025
Ukar Wijaya Soelistijo1, 2, 3
, Pakerti Lutzow Anjani4, Hanif Ikhsan Pratama
4, Hariono La Pili
5,
Mixsindo Korra Herdyanti6
1University of Islam Bandung (UNISBA), Department of Mining Engineering, Faculty of Engineering, Bandung, Indonesia 2Institute of Technology Bandung Department of Mining Engineering, Faculty of Mining and Petroleum Engineering, Bandung, Indonesia 3Center for Education and Training of Mineral and Coal, Ministry of Energy and Mineral Resources, Bandung, Indonesia 4Institute of Technology Bandung, Department of Mining Engineering, Faculty of Mining and Petroleum Engineering, Bandung, Indonesia 5University of Halu Oleo, Department of Mining Engineering; Faculty of Engineering, Kendari, Indonesia 6University of Trisakti, Department of Mining Engineering, Faculty of Engineering, Jakarta, Indonesia
Email address: [email protected] (U. W. Soelistijo), [email protected] (P. L. Anjani), [email protected] (H. I. Pratama),
[email protected] (H. L. Pili), [email protected] (M. K. Herdyanti)
To cite this article: Ukar Wijaya Soelistijo, Pakerti Lutzow Anjani, Hanif Ikhsan Pratama, Hariono La Pili, Mixsindo Korra Herdyanti. Trend of Mineral
Commodity Price and its Impact on the Indonesia Economy 1990-2025. Earth Sciences. Vol. 4, No. 4, 2015, pp. 129-145.
doi: 10.11648/j.earth.20150404.11
Abstract: Indonesia is one of the mineral rich developing countries in the world. Indonesia has a large quantity of mineral
resources such as natural oil and gas, hard minerals (metallic, non metallic/industrial mineral, coal, and stone), because it is
located in the Pacific ring of fire. Mineral and energy commodities have always been giving contribution to Gross Domestic
Product (GDP) of Indonesia besides doing regional development, because of its potential mineral resources. Trade of mineral
commodity aims is to gain from trade of mineral to increase economic growth through Balance of Trade (BOT). Mineral
commodity markets have been volatile for a long time. The trends of mineral commodity prices have been fluctuated and
recently it changed dramatically due to commodity prices to increase within only several years. The aims of this study are to
comprehend recent contribution of mining sector to Indonesian economy 1990-2014 and to analyze forecasting of mineral
commodity future prices until 2025. The price trends of commodity mineral is increasing from time to time, but sometimes
decreasing because of world crisis, scarcity, and other problems in the world related to mining, trade, and relationship between
countries, such as fundamentals matter, including long-run demand growth, technical change that opens up new sources of
supply, changes that transform the operation of financial markets, and macro-economic shocks, etc. Mining sector contribute
about 6-12% of Indonesian Gross Domestic Product and increasing from time to time. Contribution of mining includes trade of
mineral commodity, regional development by companies, etc. It is shown that mining is important for Indonesian economy.
Methodology applied in this paper is data analysis using dynamic commodity and macroeconomic models and forecast using
linear and polynomial regression with its trend line.
Keywords: Mineral, Price Trend, Trade, Forecast, Economy
1. Introduction
Indonesia has high economy potency and began to be
considered internationally. The high economy potency is
shown by the growth of Gross Domestic Product (GDP)
which is increasing from 2000 until 2014 besides doing
regional development [30]. It is still expected that it would be
going on beyond the year of 2015 and on. It makes foreign
investors interested to invest the capital in Indonesia [42].
Even mineral resources utilization has been well carried out
since the early of 1970s.The strong macroeconomic growth
and the increasing in foreign investment are caused by some
reasons, those are: natural resources (variety and the great
number of commodity), great population of young generation,
stability of political (relative), the wise fiscal management by
end of 1990s, the strategic location to the economic giants,
China and India and also the low wage for employee.
From some reasons above, the concern is on natural
130 Ukar Wijaya Soelistijo et al.: Trend of Mineral Commodity Price and its Impact on the Indonesia Economy 1990-2025
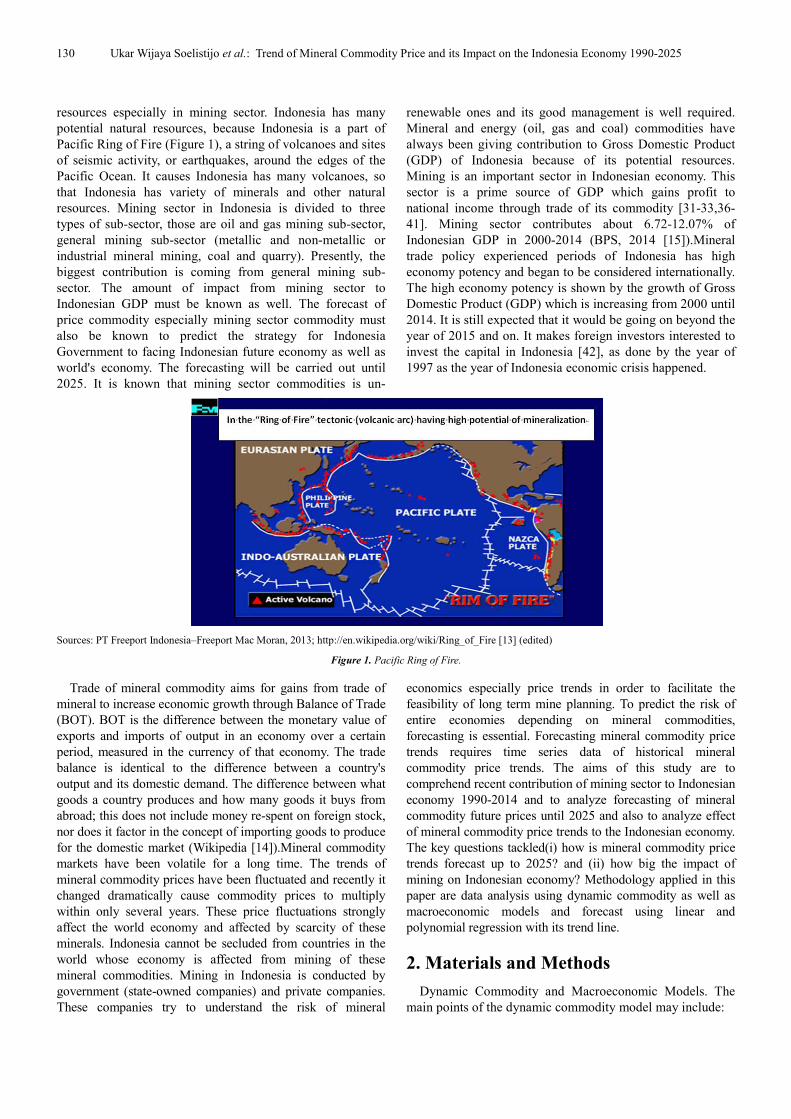
resources especially in mining sector. Indonesia has many
potential natural resources, because Indonesia is a part of
Pacific Ring of Fire (Figure 1), a string of volcanoes and sites
of seismic activity, or earthquakes, around the edges of the
Pacific Ocean. It causes Indonesia has many volcanoes, so
that Indonesia has variety of minerals and other natural
resources. Mining sector in Indonesia is divided to three
types of sub-sector, those are oil and gas mining sub-sector,
general mining sub-sector (metallic and non-metallic or
industrial mineral mining, coal and quarry). Presently, the
biggest contribution is coming from general mining sub-
sector. The amount of impact from mining sector to
Indonesian GDP must be known as well. The forecast of
price commodity especially mining sector commodity must
also be known to predict the strategy for Indonesia
Government to facing Indonesian future economy as well as
world's economy. The forecasting will be carried out until
2025. It is known that mining sector commodities is un-
renewable ones and its good management is well required.
Mineral and energy (oil, gas and coal) commodities have
always been giving contribution to Gross Domestic Product
(GDP) of Indonesia because of its potential resources.
Mining is an important sector in Indonesian economy. This
sector is a prime source of GDP which gains profit to
national income through trade of its commodity [31-33,36-
41]. Mining sector contributes about 6.72-12.07% of
Indonesian GDP in 2000-2014 (BPS, 2014 [15]).Mineral
trade policy experienced periods of Indonesia has high
economy potency and began to be considered internationally.
The high economy potency is shown by the growth of Gross
Domestic Product (GDP) which is increasing from 2000 until
2014. It is still expected that it would be going on beyond the
year of 2015 and on. It makes foreign investors interested to
invest the capital in Indonesia [42], as done by the year of
1997 as the year of Indonesia economic crisis happened.
Sources: PT Freeport Indonesia–Freeport Mac Moran, 2013; http://en.wikipedia.org/wiki/Ring_of_Fire [13] (edited)
Figure 1. Pacific Ring of Fire.
Trade of mineral commodity aims for gains from trade of
mineral to increase economic growth through Balance of Trade
(BOT). BOT is the difference between the monetary value of
exports and imports of output in an economy over a certain
period, measured in the currency of that economy. The trade
balance is identical to the difference between a country's
output and its domestic demand. The difference between what
goods a country produces and how many goods it buys from
abroad; this does not include money re-spent on foreign stock,
nor does it factor in the concept of importing goods to produce
for the domestic market (Wikipedia [14]).Mineral commodity
markets have been volatile for a long time. The trends of
mineral commodity prices have been fluctuated and recently it
changed dramatically cause commodity prices to multiply
within only several years. These price fluctuations strongly
affect the world economy and affected by scarcity of these
minerals. Indonesia cannot be secluded from countries in the
world whose economy is affected from mining of these
mineral commodities. Mining in Indonesia is conducted by
government (state-owned companies) and private companies.
These companies try to understand the risk of mineral
economics especially price trends in order to facilitate the
feasibility of long term mine planning. To predict the risk of
entire economies depending on mineral commodities,
forecasting is essential. Forecasting mineral commodity price
trends requires time series data of historical mineral
commodity price trends. The aims of this study are to
comprehend recent contribution of mining sector to Indonesian
economy 1990-2014 and to analyze forecasting of mineral
commodity future prices until 2025 and also to analyze effect
of mineral commodity price trends to the Indonesian economy.
The key questions tackled(i) how is mineral commodity price
trends forecast up to 2025? and (ii) how big the impact of
mining on Indonesian economy? Methodology applied in this
paper are data analysis using dynamic commodity as well as
macroeconomic models and forecast using linear and
polynomial regression with its trend line.
2. Materials and Methods
Dynamic Commodity and Macroeconomic Models. The
main points of the dynamic commodity model may include:
Earth Sciences 2015; 4(4): 129-145 131
(1) Calculation of the amount required to reserve.
a. Approach through the quantity of the commodity.
b. Approach through commodity prices.
(2) Calculation of benefit and loss.
a. Data input.
b. Output each year.
Formula to model the dynamic commodity among others
(Labys, 1973; Soelistijo, 1991, 201; Schaeffer, 2008 [24; 34,
35; 29]):
Demand for commodity: D = d (D-1, PW, PS, A, TF)
This relationship can be explained that the requirement (D)
depends on endogenous variables changed, needs of the past
(D-1), the international price (PW), the level or the level of
economic activity (A), prices of one or more commodities
direction substitute (PS), and the possibility technical effect
(TF) as well as the growth of synthetic substitutes.
Supply of commodity: Q = q (Q-1, PW-1, U, NR, Z)
Supply (Q) will depend on the prices of the past (PW-1),
the amount of reserves (U), natural resources (NR), and the
possibility of change of policy (Z). Future price changes past
included because the supply of goods usually depend on past
factors which is generally translated as price.
Commodity prices: P = p (P-1, D, I)
Price (P) will depend on price changes of the past (P-1),
needs (D), and stock (IC). While the amount of stock is the
stock of the past (IC-1) plus the provision of demand and
present stock of commodity (IC).
Stock commodity: IC = IC-1 + Q - D
Besides gained added relationship supply demand:
Relationship of supply-demand: C = Q + M - X + (-) S
Where the stock as the use of (C) is the provision plus
imports (M) reduced export (E).
Macroeconomic model applied in this study may cover the
Gross Domestic Product (GDP) from the expenditure
side(Ye)[38,41,45]:
Ye = C + I + G + X – M
where C = consumption, I = investment, G = government
spending, X = exports and M = imports. In this case (X-M) is
also called Balance of Trade (BOT) that will be observed
within 2000-2014 and its projection in 2015-2025 due to the
impact of the mineral commodity price trend. In general it
could be formulated as Ye = f(I,C,G,BOT).
From the income side PDB (Yi) :
Yi = f (K, L, R, I, E, Z)T ,
where K = capital, L = labor, R = natural resources, I =
information, E = environmental cost, T = technology, Z =
other variables. In this study mining sector may be included
in the sector of natural resources.
Forecasting. Forecasting is the process of making
statements about events whose actual outcomes (typically)
have not yet been observed. A commonplace example might
be estimation of some variables of interest at some specified
future date. Prediction is a similar, but more general term.
Both might refer to formal statistical methods employing
time series, cross-sectional or longitudinal data, or
alternatively to less formal judgmental methods. Usage can
differ between areas of application: for example, in
hydrology, the terms "forecast" and "forecasting" are
sometimes reserved for estimates of values at certain specific
future times, while the term "prediction" is used for more
general estimates, such as the number of times floods will
occur over a long period. Risk and uncertainty are central to
forecasting and prediction; it is generally considered good
practice to indicate the degree of uncertainty attaching to
forecasts. In any case, the data must be up to date in order for
the forecast to be as accurate as possible.
Time series analysis comprises methods for analyzing time
series data in order to extract meaningful statistics and other
characteristics of the data. Time series forecasting is the use
of a model to predict future values based on previously
observed values. While regression analysis is often employed
in such a way as to test theories that the current values of one
or more independent time series affect the current value of
another time series, this type of analysis of time series is not
called "time series analysis", which focuses on comparing
values of a single time series or multiple dependent time
series at different points in time.
Exponential smoothing is a technique that can be applied
to time series data, either to produce smoothed data for
presentation, or to make forecasts. The time series data
themselves are a sequence of observations. The observed
phenomenon may be an essentially random process, or it may
be an orderly, but noisy, process. Whereas in the simple
moving average the past observations are weighted equally,
exponential smoothing assigns exponentially decreasing
weights over time.
The raw data sequence is often represented by beginning
(X)at time t=0, and the output of the exponential smoothing
algorithm is commonly written as St, which may be regarded
as a best estimate of what the next value of will be.
Linear regression is an approach for modeling the
relationship between a scalar dependent variable y and one or
more explanatory variables (or independent variable) denoted
X. In linear regression, data are modeled using linear
predictor functions, and unknown model parameters are
estimated from the data. Linear regression was the first type
of regression analysis to be studied rigorously, and to be used
extensively in practical applications. A linear regression line
has an equation of the form Y = a + b X, where X is the
explanatory variable and Y is the dependent variable. The
slope of the line is b, and a is the intercept (the value of y
when x = 0).
Polynomial regression is a form of linear regression in
which the relationship between the independent variable x
and the dependent variable y is modeled as an nth degree
polynomial. Polynomial regression fits a nonlinear
132 Ukar Wijaya Soelistijo et al.: Trend of Mineral Commodity Price and its Impact on
relationship between the value of x and the corresponding
conditional mean of y, denoted E(y | x). The goal of
regression analysis is to model the expected value of a
Trend line represents a trend, the long-term movement in
time series data after other components have been accounted
for. It tells whether a particular data set (say GDP, oil prices
or stock prices) have increased or decreased over the period
of time. A trend line could simply be drawn by eye through a
set of data points, but more properly their position and slope
is calculated using statistical techniques like linear regression.
Trend lines typically are straight lines, although some
variations use higher degree polynomials depending on the
degree of curvature desired in the line [Gujarati, 2006
Maddala, 1977 [ 26].
Data. National income calculation is using the Gross
Domestic Product (GDP) in 2000 up to 2014 as a reference
of national income. The data consists of the GDP of Mining
Sector, Total GDP, and General Mineral Sector c
as shown in Table 1[1-17].
Balance of trade (BOT) calculation is using the BOT in
1984 up to 2014. The data consists of Total Export, Total
Import, Total Surplus/deficit (BOT), Oil and Gas
Surplus/deficit (BOT), and Non Oil and
Surplus/deficit(BOT) as shown in Table 2 [15
Actual price of mineral commodity based on its own units
per year in 1990 up to 2014. Data sources
Bank and OPEC (Table 3) [1-14, 16-18].
3. Results and Discussion
Price Trends of Mineral Commodity, 1990
price trends of mineral commodity from 1990 to
on their own units in trade is shown in Figure 2 [1
The prices of several important mineral commodities,
including fossil fuels and metals, have repeatedly undergone
periods of boom and bust over the last 150 years
et al, 2008; Jacks et al., 2011 [19, 23]). These long
fluctuations affect the macroeconomic conditions of
developing and industrialized countries (World Trade
Organization, 2010; IMF, 2012 [46]), one of these countries is
Indonesia. Commodity price fluctuations have
Indonesian economy conditions, especially energy commodity
such as oil, gas, and coal. Broad-based commodity price
declines occurred in the second half of 2014 (World Bank,
2015 [46]). Crude oil prices declined the most, down from
$104.08/TOE in 2013 to $96.24/TOE in 2014, bringing an end
to a four-year period of high and stable prices. The weakness
in crude oil prices will extend to other energy markets,
especially natural gas in Europe and Asia.
Revisions of supply and demand expectat
key role during the course of the current episode of declining
oil prices, such revisions are neither unique nor unusually large;
what is unique is that these changing expectations unfolded
together with a number of other key development
: Trend of Mineral Commodity Price and its Impact on the Indonesia Economy 1990
elationship between the value of x and the corresponding
conditional mean of y, denoted E(y | x). The goal of
regression analysis is to model the expected value of a
dependent variable y in terms of the value of an independent
variable (or vector of indepe
polynomial regression model:
term movement in
time series data after other components have been accounted
rticular data set (say GDP, oil prices
or stock prices) have increased or decreased over the period
of time. A trend line could simply be drawn by eye through a
set of data points, but more properly their position and slope
techniques like linear regression.
Trend lines typically are straight lines, although some
variations use higher degree polynomials depending on the
[Gujarati, 2006 [21];
lculation is using the Gross
to 2014 as a reference
of the GDP of Mining
nd General Mineral Sector contribution
calculation is using the BOT in
to 2014. The data consists of Total Export, Total
, Oil and Gas
, and Non Oil and Gas
[15].
modity based on its own units
s are LME, World
1990-2014. The actual
price trends of mineral commodity from 1990 to 2014 based
Figure 2 [1-18].
mineral commodities,
fuels and metals, have repeatedly undergone
periods of boom and bust over the last 150 years (Cuddington
). These long-term
fluctuations affect the macroeconomic conditions of
developing and industrialized countries (World Trade
), one of these countries is
have a big impact on
Indonesian economy conditions, especially energy commodity
based commodity price
declines occurred in the second half of 2014 (World Bank,
). Crude oil prices declined the most, down from
.08/TOE in 2013 to $96.24/TOE in 2014, bringing an end
year period of high and stable prices. The weakness
in crude oil prices will extend to other energy markets,
Revisions of supply and demand expectations have played a
key role during the course of the current episode of declining
oil prices, such revisions are neither unique nor unusually large;
what is unique is that these changing expectations unfolded
together with a number of other key developments: change in
OPEC’s objectives, receding geopolitical risks, and U.S. dollar
appreciation. Together, these forces have formed a “perfect
storm” of conditions that are exerting strong downward
pressure on prices (World Bank, 2015
are also falling down recently, for some metals such as iron ore,
copper, lead, and tin prices all fell in 2014. However,
Indonesia’s export ban on unprocessed ore affected the nickel
market in particular, so the price of nickel strengthened in
2014.Table4shows the forecast of price trends of mineral
commodity and the formula. Figures 3 and 4 shows the price
trend of mineral commodities based its actual price and price
indices respectfully and figure 4 shows oil versus gold price
that affected each other.
It could also be shown on the tables and the graphs, that all
mineral commodities (metal, oil, gas, and coal) have the same
increasing pattern from 1990 to 2008 (peak point) but in 2009,
all mineral price was decreasing because of the world crisis
caused by America. This world crisis not only affected mining
commodity but also all commodities in trade. After 2009 the
trend was increasing, but in 2012 decreased especially for coal
because China stopped importing coal from
other country has the same power to import coal as big as
China, so when it happened it affected all coal exporting
countries.
Gross Domestic Product of Indonesia, 2000
Domestic Product (GDP) of Indonesia from 2000 to 2014
could be seen on Table 1in constant billion I
price (Badan Pusat Statistik Indonesia 2015
consists of GDP of Indonesia,
mineral) sector, and its subsector. It can be seen that
graph how much mining sector contribution to Indones
GDP. Indonesian GDP increases
so the economic growth is positive
IDR current value the GDP trend is shown in Figure 7.
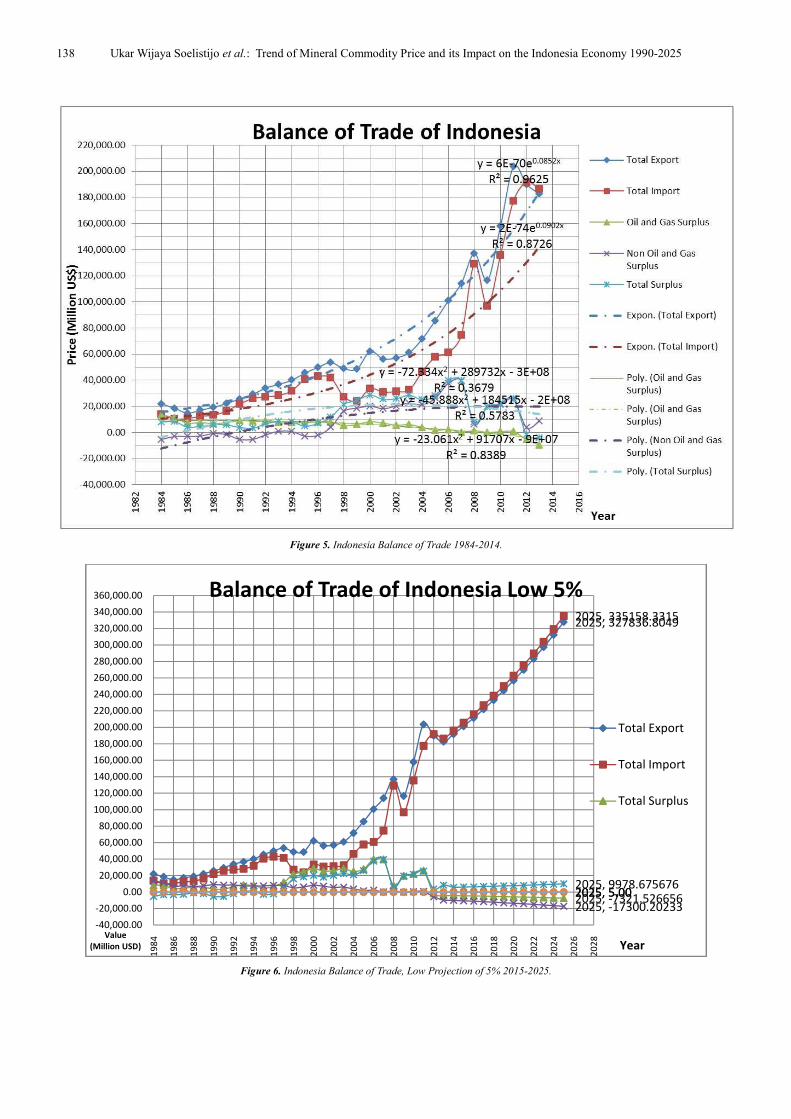
Balance of Trade of Indonesia, 2000
Indonesia could be seen on Fig
consisted of total export, total import, oil and gas
surplus/deficit (BOT),non oil and gas surplus
and total surplus/deficit (BOT).
that export and import trend is increasing, but it doesn’t
happen to oil and gas surplus
decreasing. Although the oil and gas surplus
decreasing, non oil and gas surplus
increasing trends. However, for the recent years non oil and
gas surplus/deficit (BOT) is also decreasing, so total BOT is
negative.
2000s Commodity boom. Since 2000, many prices of
mineral commodity experienced increasing trend. For example,
in 2000, Aluminum price is 1551,5 US$/ton, nickel is 8630
US$/ton and copper is 1580 US$
Aluminum is reached to level 2148 US$
the Indonesia Economy 1990-2025
dependent variable y in terms of the value of an independent
variable (or vector of independent variables) x. The
OPEC’s objectives, receding geopolitical risks, and U.S. dollar
appreciation. Together, these forces have formed a “perfect
storm” of conditions that are exerting strong downward
pressure on prices (World Bank, 2015 [46]). Price of metals
also falling down recently, for some metals such as iron ore,
copper, lead, and tin prices all fell in 2014. However,
Indonesia’s export ban on unprocessed ore affected the nickel
market in particular, so the price of nickel strengthened in
s the forecast of price trends of mineral
Figures 3 and 4 shows the price
trend of mineral commodities based its actual price and price
indices respectfully and figure 4 shows oil versus gold price
uld also be shown on the tables and the graphs, that all
mineral commodities (metal, oil, gas, and coal) have the same
increasing pattern from 1990 to 2008 (peak point) but in 2009,
all mineral price was decreasing because of the world crisis
rica. This world crisis not only affected mining
commodity but also all commodities in trade. After 2009 the
trend was increasing, but in 2012 decreased especially for coal
importing coal from their country. No
ame power to import coal as big as
China, so when it happened it affected all coal exporting
Gross Domestic Product of Indonesia, 2000-2014.Gross
Domestic Product (GDP) of Indonesia from 2000 to 2014
could be seen on Table 1in constant billion IDR of 2000 base
at Statistik Indonesia 2015,,[15]). The graph
of GDP of Indonesia, general mining (and industrial
sector, and its subsector. It can be seen that from the
graph how much mining sector contribution to Indonesian
es from time to time until 2014
so the economic growth is positive of around 6% per year. In
IDR current value the GDP trend is shown in Figure 7.
Balance of Trade of Indonesia, 2000-2014.BOT of
nesia could be seen on Figure 8 shown in current US$,
consisted of total export, total import, oil and gas
,non oil and gas surplus/deficit (BOT),
. It can be seen from the graph
that export and import trend is increasing, but it doesn’t
happen to oil and gas surplus/deficit (BOT) because it is
decreasing. Although the oil and gas surplus/deficit (BOT) is
decreasing, non oil and gas surplus/deficit(BOT) balance with
increasing trends. However, for the recent years non oil and
is also decreasing, so total BOT is
2000s Commodity boom. Since 2000, many prices of
mineral commodity experienced increasing trend. For example,
minum price is 1551,5 US$/ton, nickel is 8630
US$/ton and copper is 1580 US$/ton. But in 2010, the price of
num is reached to level 2148 US$/ton, nickel is 21810
Earth Sciences 2015; 4(4): 129-145 133
US$/ton and copper is 7538 US$/ton. Each price of them have
been tripled or more. This phenomenon is called 2000s
commodity boom.
Based on Radetzki, 2006 [27] and Sruermer, 2013 [44], the
causes of this commodity boom is because of increasing
demand that ignited by the next three reasons. Firstly, the fast
economic growth in OECD countries. OECD or The
Organization for Economic Co-operation and Development
(OECD) is an international economic organization of 34
countries founded in 1961 to stimulate economic progress and
world trade. The member of this organization is mostly
countries in Europe, North America, Australia and some from
South America. The economic growth is reported 3.3% GDP
growth per year. This fast growth increases the demand of
mineral commodity. Secondly, the explosive growth of China
and India raw material demand. Especially for China, in 2000-
2005, China share in global demand of oil is 28%, aluminum is
50%, steel is 84% and copper is 95%. This is a very strong
demand from China to support the development in its country
and causes major increase in global demand. Third reason is,
the speculative activity due to negative stock market. The
speculative activity could also increase the price of commodity.
The increase of the commodity demand is failed to be
answered by the supply from the mining industry and causes
the prices to increase. Radetzki (2008) [28], briefly give
explanation to this condition by two reasons. Firstly, high
demand of mineral commodity is not accompanied by supply
because of long installation time to build new supply system.
The average time is 5 years, but the demand is need to be
fulfilled immediately. Secondly, the investors failed to
understand the needed capacity of the current demand. This
makes the investment in building new supply system is low.
Thirdly, the cost of finding and developing new mineral
deposit are rising. According to the increasing price of mineral
commodity, the price of exploration had been influenced too as
the price of mineral commodity will drive the price of other
goods and equipments needed for exploration activity,
increased too.
Contribution of Mining Sector to Indonesia GDP. Mineral
commodities (oil and gas, hard minerals and coal) is a major
contributor to GDP Indonesia, despite its declining trend but
the percentage is increasing its value (Figure 2).Since 2009 the
percentage of GDP from hard mineral and coal exceed the
GDP contribution of oil and gas, this is due to the volume of
oil lifting Indonesia continues to decline and a stronger price
mineral commodities on the world market, in addition to the
huge demand of the commodity minerals from China such as
iron, nickel, bauxite and others led to the phenomenon of
large-scale production at several mineral commodities (nickel
and bauxite) and made Indonesia as the largest exporter of
several mineral commodities. This condition directly affects to
the increased contribution of tax and non-tax revenues and
increase the value of the mineral and coal sector's contribution
to Indonesia GDP.
Law No. 4 on Mineral and Coal Mining was issued in 2009
replacing the previous Law No. 11 In 1967, one of its mandate
is the mandatory of the mining company to commence added
value process to mineral commodity such as refining process,
as the implementation of the MER (Mineral and Energy
Resources) Ministerial Decree No. 7/2012 that restrict the
export of raw material with a certain quota, and
implementation of export tax to metallic mineral export. This
condition results metallic mineral export volume dropped
dramatically at the beginning of the policy implementation, but
the volume of exports minerals back to increase until the end
of the beginning of 2014, where the government re-issued
Government Regulation No. 1/2014 and MER Ministerial
Decree No. 1 of 2014 which prohibits the export of almost all
metallic minerals, with the exception of copper, iron (iron sand
and iron ore) with a certain level of concentrate restrictions and
customs duties export progressively from 20% in the first year
to 60% in the year 2016.
Mineral commodity forecasting to 2025.Forecasting is the
art and science of predicting events that will occur with the
use of historical data and project it into the future with some
form of mathematical models. Based on the results of the
commodity price forecasting oil and gas, minerals and coal
showed that from year to year the commodity will increase
the price. This suggests that there will be progressive
increase of the demand of the commodity. The results of this
commodity price projection can assist in preparing
Indonesian government to compete with the global market
that will be faced in 2025.
Mineral commodity prices have a significant influence on
the production and adjustment of industrial structure of the
mineral. International mineral market is influenced by many
factors, it is very difficult to discern mechanism of factors
forming the price of the mineral. All of this led to the mineral
market investments that have uncertainty, uncertainty is seen
in the difficulty to predict the price of minerals, so it's
important for us to do with the price forecasting methods and
the corresponding theory (Yong Li, 2012 [25]).
Forecasting of mineral commodity price is done using
statistic regression, whether it is linear, exponential or
polynomial. The selection of the regression is based on the
coefficient of correlation or R2 of the equation. The equation
is come from analysis of trend of the price using historical
time series from 1990 to 2014. By using the equation,
forecasting of mineral commodity price is as following table.
Based on the forecasting formula of each commodity, the
forecast price until 2025 is then plotted as graph in Figure 3.
It can be shown that all the commodity is predicted to
experience a major increasing. This correlates with previous
increasing trend of price from 1990-2014. The behavior of
the mineral commodity price could be discussed in point of
view per commodity as follows.
Petroleum (Oil, LPG and LNG). Petroleum has been
dominating the primary energy supply in Indonesia, with a
share of about 37%. Considering the price of oil tends to
increase whereas oil reserves and production of domestic
crude oil continues to decline, the government has to
establish policies to reduce dependence on oil supply through
energy diversification programs. Petroleum prices continue to
rise beyond US$100, though now it is not dominated by
134 Ukar Wijaya Soelistijo et al.: Trend of Mineral Commodity Price and its Impact on the Indonesia Economy 1990-2025
OPEC, but the political situation of the countries in middle
east influences on world oil prices
Based on Table 4 and Figure 3 obtained prediction of oil
price in 2025 of US$ 251.42 per TOE. Natural gas (LPG and
LNG) is currently the third major primary energy source in
Indonesia, after petroleum and coal, with a share of about
15%. Gas supply comes from the oil and gas field in the
country. In the past period, the majority of natural gas
production largely utilized for export in the form of LNG and
gas pipelines. With the ever increasing domestic energy
demand, while prices oil is likely to increase the demand for
natural gas also is estimated to continue increase. Based on
Table 4 and Figure 3 obtained prediction of LPG and LNG
price in 2025 of US$ 6.99 and US$ 6.89 per MBTU.
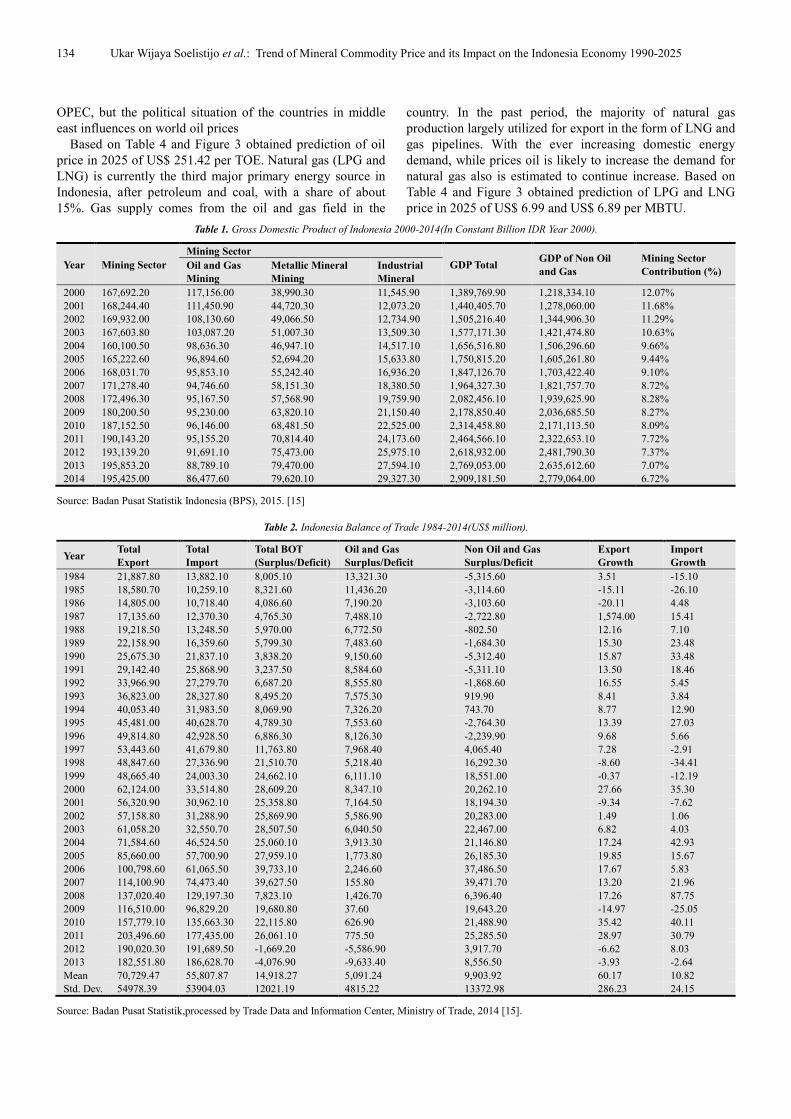
Table 1. Gross Domestic Product of Indonesia 2000-2014(In Constant Billion IDR Year 2000).
Year Mining Sector
Mining Sector
GDP Total GDP of Non Oil
and Gas
Mining Sector
Contribution (%) Oil and Gas
Mining
Metallic Mineral
Mining
Industrial
Mineral
2000 167,692.20 117,156.00 38,990.30 11,545.90 1,389,769.90 1,218,334.10 12.07%
2001 168,244.40 111,450.90 44,720.30 12,073.20 1,440,405.70 1,278,060.00 11.68%
2002 169,932.00 108,130.60 49,066.50 12,734.90 1,505,216.40 1,344,906.30 11.29%
2003 167,603.80 103,087.20 51,007.30 13,509.30 1,577,171.30 1,421,474.80 10.63%
2004 160,100.50 98,636.30 46,947.10 14,517.10 1,656,516.80 1,506,296.60 9.66%
2005 165,222.60 96,894.60 52,694.20 15,633.80 1,750,815.20 1,605,261.80 9.44%
2006 168,031.70 95,853.10 55,242.40 16,936.20 1,847,126.70 1,703,422.40 9.10%
2007 171,278.40 94,746.60 58,151.30 18,380.50 1,964,327.30 1,821,757.70 8.72%
2008 172,496.30 95,167.50 57,568.90 19,759.90 2,082,456.10 1,939,625.90 8.28%
2009 180,200.50 95,230.00 63,820.10 21,150.40 2,178,850.40 2,036,685.50 8.27%
2010 187,152.50 96,146.00 68,481.50 22,525.00 2,314,458.80 2,171,113.50 8.09%
2011 190,143.20 95,155.20 70,814.40 24,173.60 2,464,566.10 2,322,653.10 7.72%
2012 193,139.20 91,691.10 75,473.00 25,975.10 2,618,932.00 2,481,790.30 7.37%
2013 195,853.20 88,789.10 79,470.00 27,594.10 2,769,053.00 2,635,612.60 7.07%
2014 195,425.00 86,477.60 79,620.10 29,327.30 2,909,181.50 2,779,064.00 6.72%
Source: Badan Pusat Statistik Indonesia (BPS), 2015. [15]
Table 2. Indonesia Balance of Trade 1984-2014(US$ million).
Year Total
Export
Total
Import
Total BOT
(Surplus/Deficit)
Oil and Gas
Surplus/Deficit
Non Oil and Gas
Surplus/Deficit
Export
Growth
Import
Growth
1984 21,887.80 13,882.10 8,005.10 13,321.30 -5,315.60 3.51 -15.10
1985 18,580.70 10,259.10 8,321.60 11,436.20 -3,114.60 -15.11 -26.10
1986 14,805.00 10,718.40 4,086.60 7,190.20 -3,103.60 -20.11 4.48
1987 17,135.60 12,370.30 4,765.30 7,488.10 -2,722.80 1,574.00 15.41
1988 19,218.50 13,248.50 5,970.00 6,772.50 -802.50 12.16 7.10
1989 22,158.90 16,359.60 5,799.30 7,483.60 -1,684.30 15.30 23.48
1990 25,675.30 21,837.10 3,838.20 9,150.60 -5,312.40 15.87 33.48
1991 29,142.40 25,868.90 3,237.50 8,584.60 -5,311.10 13.50 18.46
1992 33,966.90 27,279.70 6,687.20 8,555.80 -1,868.60 16.55 5.45
1993 36,823.00 28,327.80 8,495.20 7,575.30 919.90 8.41 3.84
1994 40,053.40 31,983.50 8,069.90 7,326.20 743.70 8.77 12.90
1995 45,481.00 40,628.70 4,789.30 7,553.60 -2,764.30 13.39 27.03
1996 49,814.80 42,928.50 6,886.30 8,126.30 -2,239.90 9.68 5.66
1997 53,443.60 41,679.80 11,763.80 7,968.40 4,065.40 7.28 -2.91
1998 48,847.60 27,336.90 21,510.70 5,218.40 16,292.30 -8.60 -34.41
1999 48,665.40 24,003.30 24,662.10 6,111.10 18,551.00 -0.37 -12.19
2000 62,124.00 33,514.80 28,609.20 8,347.10 20,262.10 27.66 35.30
2001 56,320.90 30,962.10 25,358.80 7,164.50 18,194.30 -9.34 -7.62
2002 57,158.80 31,288.90 25,869.90 5,586.90 20,283.00 1.49 1.06
2003 61,058.20 32,550.70 28,507.50 6,040.50 22,467.00 6.82 4.03
2004 71,584.60 46,524.50 25,060.10 3,913.30 21,146.80 17.24 42.93
2005 85,660.00 57,700.90 27,959.10 1,773.80 26,185.30 19.85 15.67
2006 100,798.60 61,065.50 39,733.10 2,246.60 37,486.50 17.67 5.83
2007 114,100.90 74,473.40 39,627.50 155.80 39,471.70 13.20 21.96
2008 137,020.40 129,197.30 7,823.10 1,426.70 6,396.40 17.26 87.75
2009 116,510.00 96,829.20 19,680.80 37.60 19,643.20 -14.97 -25.05
2010 157,779.10 135,663.30 22,115.80 626.90 21,488.90 35.42 40.11
2011 203,496.60 177,435.00 26,061.10 775.50 25,285.50 28.97 30.79
2012 190,020.30 191,689.50 -1,669.20 -5,586.90 3,917.70 -6.62 8.03
2013 182,551.80 186,628.70 -4,076.90 -9,633.40 8,556.50 -3.93 -2.64
Mean 70,729.47 55,807.87 14,918.27 5,091.24 9,903.92 60.17 10.82
Std. Dev. 54978.39 53904.03 12021.19 4815.22 13372.98 286.23 24.15
Source: Badan Pusat Statistik,processed by Trade Data and Information Center, Ministry of Trade, 2014 [15].
Earth Sciences 2015; 4(4): 129-145 135
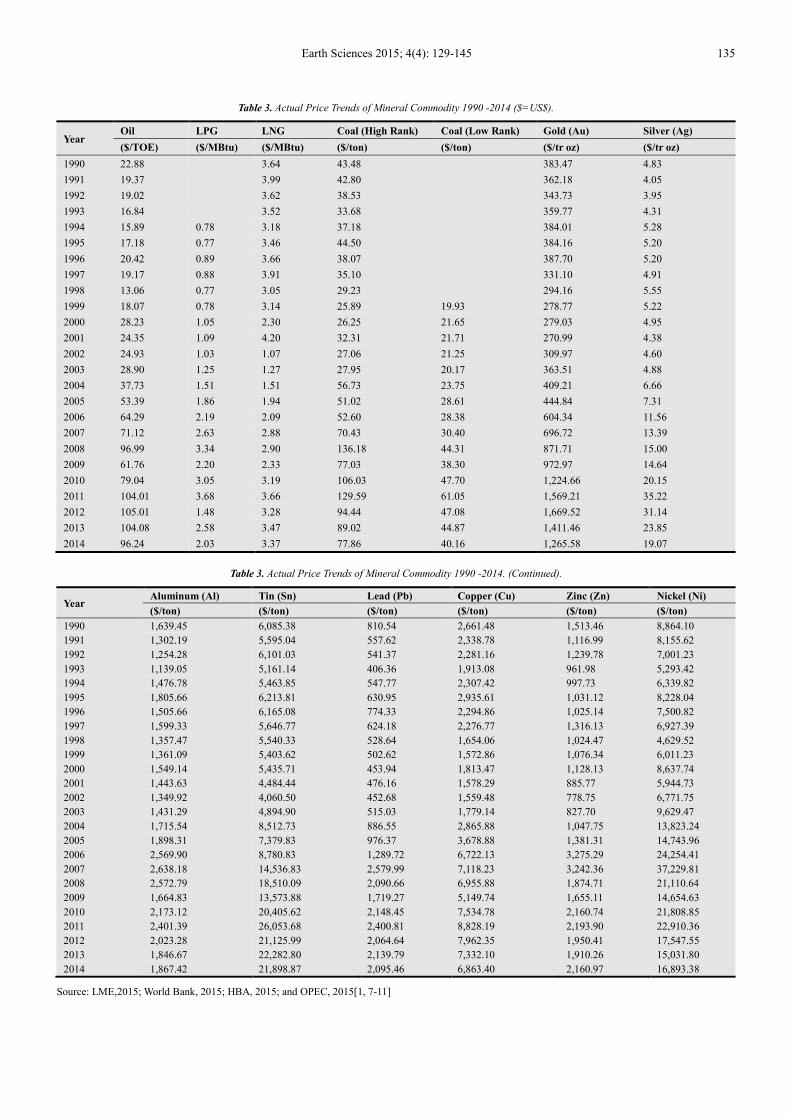
Table 3. Actual Price Trends of Mineral Commodity 1990 -2014 ($=US$).
Year Oil LPG LNG Coal (High Rank) Coal (Low Rank) Gold (Au) Silver (Ag)
($/TOE) ($/MBtu) ($/MBtu) ($/ton) ($/ton) ($/tr oz) ($/tr oz)
1990 22.88
3.64 43.48
383.47 4.83
1991 19.37
3.99 42.80
362.18 4.05
1992 19.02
3.62 38.53
343.73 3.95
1993 16.84
3.52 33.68
359.77 4.31
1994 15.89 0.78 3.18 37.18
384.01 5.28
1995 17.18 0.77 3.46 44.50
384.16 5.20
1996 20.42 0.89 3.66 38.07
387.70 5.20
1997 19.17 0.88 3.91 35.10
331.10 4.91
1998 13.06 0.77 3.05 29.23
294.16 5.55
1999 18.07 0.78 3.14 25.89 19.93 278.77 5.22
2000 28.23 1.05 2.30 26.25 21.65 279.03 4.95
2001 24.35 1.09 4.20 32.31 21.71 270.99 4.38
2002 24.93 1.03 1.07 27.06 21.25 309.97 4.60
2003 28.90 1.25 1.27 27.95 20.17 363.51 4.88
2004 37.73 1.51 1.51 56.73 23.75 409.21 6.66
2005 53.39 1.86 1.94 51.02 28.61 444.84 7.31
2006 64.29 2.19 2.09 52.60 28.38 604.34 11.56
2007 71.12 2.63 2.88 70.43 30.40 696.72 13.39
2008 96.99 3.34 2.90 136.18 44.31 871.71 15.00
2009 61.76 2.20 2.33 77.03 38.30 972.97 14.64
2010 79.04 3.05 3.19 106.03 47.70 1,224.66 20.15
2011 104.01 3.68 3.66 129.59 61.05 1,569.21 35.22
2012 105.01 1.48 3.28 94.44 47.08 1,669.52 31.14
2013 104.08 2.58 3.47 89.02 44.87 1,411.46 23.85
2014 96.24 2.03 3.37 77.86 40.16 1,265.58 19.07
Table 3. Actual Price Trends of Mineral Commodity 1990 -2014. (Continued).
Year Aluminum (Al) Tin (Sn) Lead (Pb) Copper (Cu) Zinc (Zn) Nickel (Ni)
($/ton) ($/ton) ($/ton) ($/ton) ($/ton) ($/ton)
1990 1,639.45 6,085.38 810.54 2,661.48 1,513.46 8,864.10
1991 1,302.19 5,595.04 557.62 2,338.78 1,116.99 8,155.62
1992 1,254.28 6,101.03 541.37 2,281.16 1,239.78 7,001.23
1993 1,139.05 5,161.14 406.36 1,913.08 961.98 5,293.42
1994 1,476.78 5,463.85 547.77 2,307.42 997.73 6,339.82
1995 1,805.66 6,213.81 630.95 2,935.61 1,031.12 8,228.04
1996 1,505.66 6,165.08 774.33 2,294.86 1,025.14 7,500.82
1997 1,599.33 5,646.77 624.18 2,276.77 1,316.13 6,927.39
1998 1,357.47 5,540.33 528.64 1,654.06 1,024.47 4,629.52
1999 1,361.09 5,403.62 502.62 1,572.86 1,076.34 6,011.23
2000 1,549.14 5,435.71 453.94 1,813.47 1,128.13 8,637.74
2001 1,443.63 4,484.44 476.16 1,578.29 885.77 5,944.73
2002 1,349.92 4,060.50 452.68 1,559.48 778.75 6,771.75
2003 1,431.29 4,894.90 515.03 1,779.14 827.70 9,629.47
2004 1,715.54 8,512.73 886.55 2,865.88 1,047.75 13,823.24
2005 1,898.31 7,379.83 976.37 3,678.88 1,381.31 14,743.96
2006 2,569.90 8,780.83 1,289.72 6,722.13 3,275.29 24,254.41
2007 2,638.18 14,536.83 2,579.99 7,118.23 3,242.36 37,229.81
2008 2,572.79 18,510.09 2,090.66 6,955.88 1,874.71 21,110.64
2009 1,664.83 13,573.88 1,719.27 5,149.74 1,655.11 14,654.63
2010 2,173.12 20,405.62 2,148.45 7,534.78 2,160.74 21,808.85
2011 2,401.39 26,053.68 2,400.81 8,828.19 2,193.90 22,910.36
2012 2,023.28 21,125.99 2,064.64 7,962.35 1,950.41 17,547.55
2013 1,846.67 22,282.80 2,139.79 7,332.10 1,910.26 15,031.80
2014 1,867.42 21,898.87 2,095.46 6,863.40 2,160.97 16,893.38
Source: LME,2015; World Bank, 2015; HBA, 2015; and OPEC, 2015[1, 7-11]
136 Ukar Wijaya Soelistijo et al.: Trend of Mineral Commodity Price and its Impact on the Indonesia Economy 1990-2025
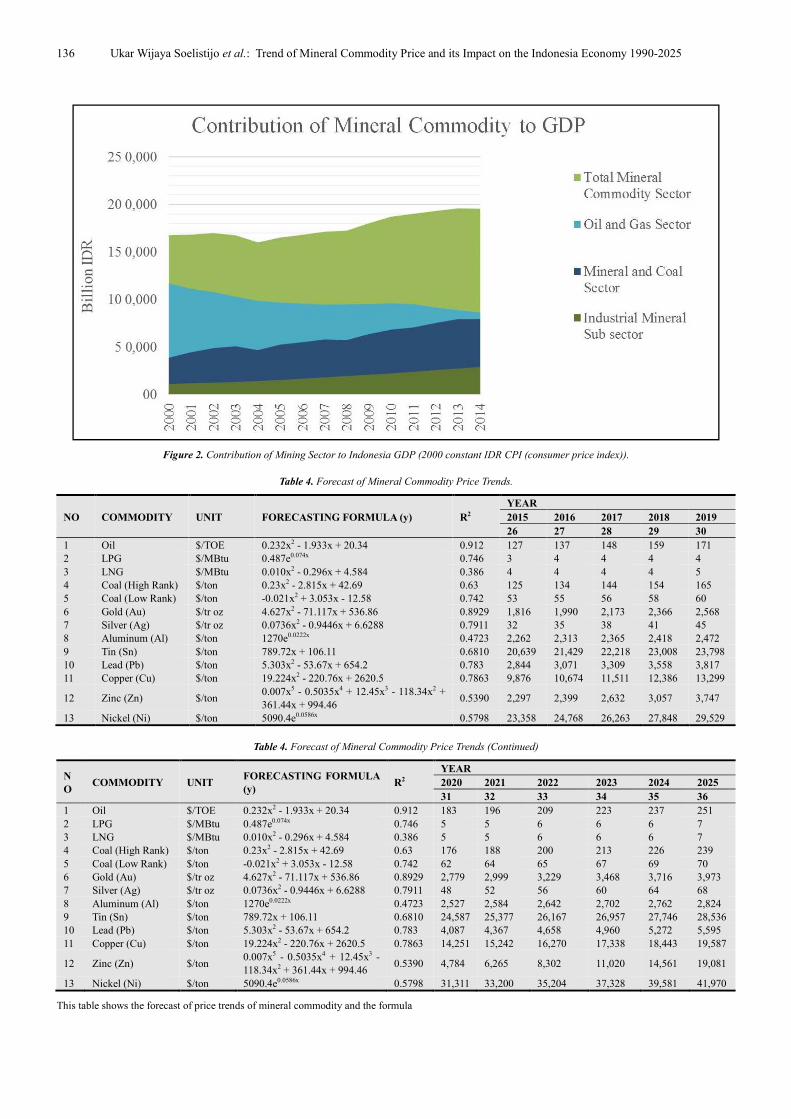
Figure 2. Contribution of Mining Sector to Indonesia GDP (2000 constant IDR CPI (consumer price index)).
Table 4. Forecast of Mineral Commodity Price Trends.
NO COMMODITY UNIT FORECASTING FORMULA (y) R2
YEAR
2015 2016 2017 2018 2019
26 27 28 29 30
1 Oil $/TOE 0.232x2 - 1.933x + 20.34 0.912 127 137 148 159 171
2 LPG $/MBtu 0.487e0.074x 0.746 3 4 4 4 4
3 LNG $/MBtu 0.010x2 - 0.296x + 4.584 0.386 4 4 4 4 5
4 Coal (High Rank) $/ton 0.23x2 - 2.815x + 42.69 0.63 125 134 144 154 165
5 Coal (Low Rank) $/ton -0.021x2 + 3.053x - 12.58 0.742 53 55 56 58 60
6 Gold (Au) $/tr oz 4.627x2 - 71.117x + 536.86 0.8929 1,816 1,990 2,173 2,366 2,568
7 Silver (Ag) $/tr oz 0.0736x2 - 0.9446x + 6.6288 0.7911 32 35 38 41 45
8 Aluminum (Al) $/ton 1270e0.0222x 0.4723 2,262 2,313 2,365 2,418 2,472
9 Tin (Sn) $/ton 789.72x + 106.11 0.6810 20,639 21,429 22,218 23,008 23,798
10 Lead (Pb) $/ton 5.303x2 - 53.67x + 654.2 0.783 2,844 3,071 3,309 3,558 3,817
11 Copper (Cu) $/ton 19.224x2 - 220.76x + 2620.5 0.7863 9,876 10,674 11,511 12,386 13,299
12 Zinc (Zn) $/ton 0.007x5 - 0.5035x4 + 12.45x3 - 118.34x2 +
361.44x + 994.46 0.5390 2,297 2,399 2,632 3,057 3,747
13 Nickel (Ni) $/ton 5090.4e0.0586x 0.5798 23,358 24,768 26,263 27,848 29,529
Table 4. Forecast of Mineral Commodity Price Trends (Continued)
N
O COMMODITY UNIT
FORECASTING FORMULA
(y) R2
YEAR
2020 2021 2022 2023 2024 2025
31 32 33 34 35 36
1 Oil $/TOE 0.232x2 - 1.933x + 20.34 0.912 183 196 209 223 237 251
2 LPG $/MBtu 0.487e0.074x 0.746 5 5 6 6 6 7
3 LNG $/MBtu 0.010x2 - 0.296x + 4.584 0.386 5 5 6 6 6 7
4 Coal (High Rank) $/ton 0.23x2 - 2.815x + 42.69 0.63 176 188 200 213 226 239
5 Coal (Low Rank) $/ton -0.021x2 + 3.053x - 12.58 0.742 62 64 65 67 69 70
6 Gold (Au) $/tr oz 4.627x2 - 71.117x + 536.86 0.8929 2,779 2,999 3,229 3,468 3,716 3,973
7 Silver (Ag) $/tr oz 0.0736x2 - 0.9446x + 6.6288 0.7911 48 52 56 60 64 68
8 Aluminum (Al) $/ton 1270e0.0222x 0.4723 2,527 2,584 2,642 2,702 2,762 2,824
9 Tin (Sn) $/ton 789.72x + 106.11 0.6810 24,587 25,377 26,167 26,957 27,746 28,536
10 Lead (Pb) $/ton 5.303x2 - 53.67x + 654.2 0.783 4,087 4,367 4,658 4,960 5,272 5,595
11 Copper (Cu) $/ton 19.224x2 - 220.76x + 2620.5 0.7863 14,251 15,242 16,270 17,338 18,443 19,587
12 Zinc (Zn) $/ton 0.007x5 - 0.5035x4 + 12.45x3 -
118.34x2 + 361.44x + 994.46 0.5390 4,784 6,265 8,302 11,020 14,561 19,081
13 Nickel (Ni) $/ton 5090.4e0.0586x 0.5798 31,311 33,200 35,204 37,328 39,581 41,970
This table shows the forecast of price trends of mineral commodity and the formula
Note: $ = US$
Figure 3. Actual Price Trends of Mineral Commodity 1990
Figure
Earth Sciences 2015; 4(4): 129-145
Actual Price Trends of Mineral Commodity 1990-2014 and Its Forecast to 2025
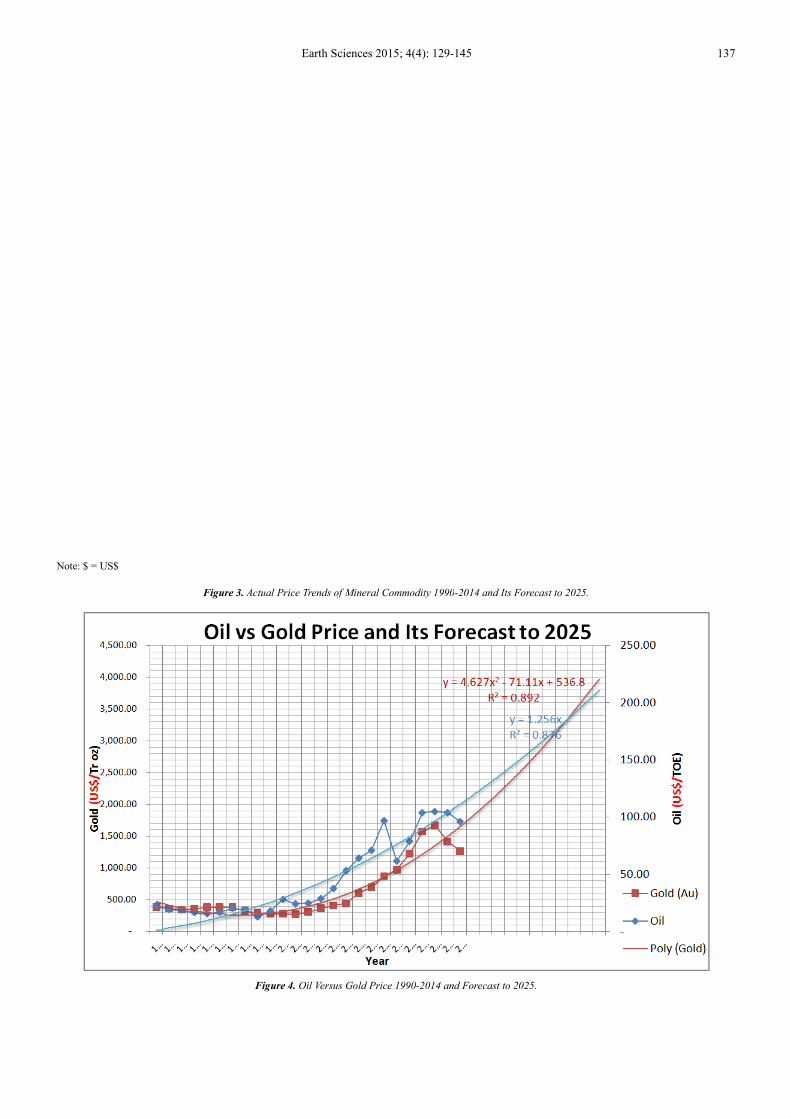
4. Oil Versus Gold Price 1990-2014 and Forecast to 2025.
137
Forecast to 2025.
138 Ukar Wijaya Soelistijo et al.: Trend of Mineral Commodity Price and its Impact on the Indonesia Economy 1990-2025
Figure 5. Indonesia Balance of Trade 1984-2014.
Figure 6. Indonesia Balance of Trade, Low Projection of 5% 2015-2025.
2025, 327836.80492025, 335158.3315
2025, -7321.5266562025, -17300.20233
2025, 9978.6756762025, 5.002025, 5.00
-40,000.00
-20,000.00
0.00
20,000.00
40,000.00
60,000.00
80,000.00
100,000.00
120,000.00
140,000.00
160,000.00
180,000.00
200,000.00
220,000.00
240,000.00
260,000.00
280,000.00
300,000.00
320,000.00
340,000.00
360,000.00
19
84
19
86
19
88
19
90
19
92
19
94
19
96
19
98
20
00
20
02
20
04
20
06
20
08
20
10
20
12
20
14
20
16
20
18
20
20
20
22
20
24
20
26
20
28Value
(Million USD) Year
Balance of Trade of Indonesia Low 5%
Total Export
Total Import
Total Surplus
Earth Sciences 2015; 4(4): 129-145 139
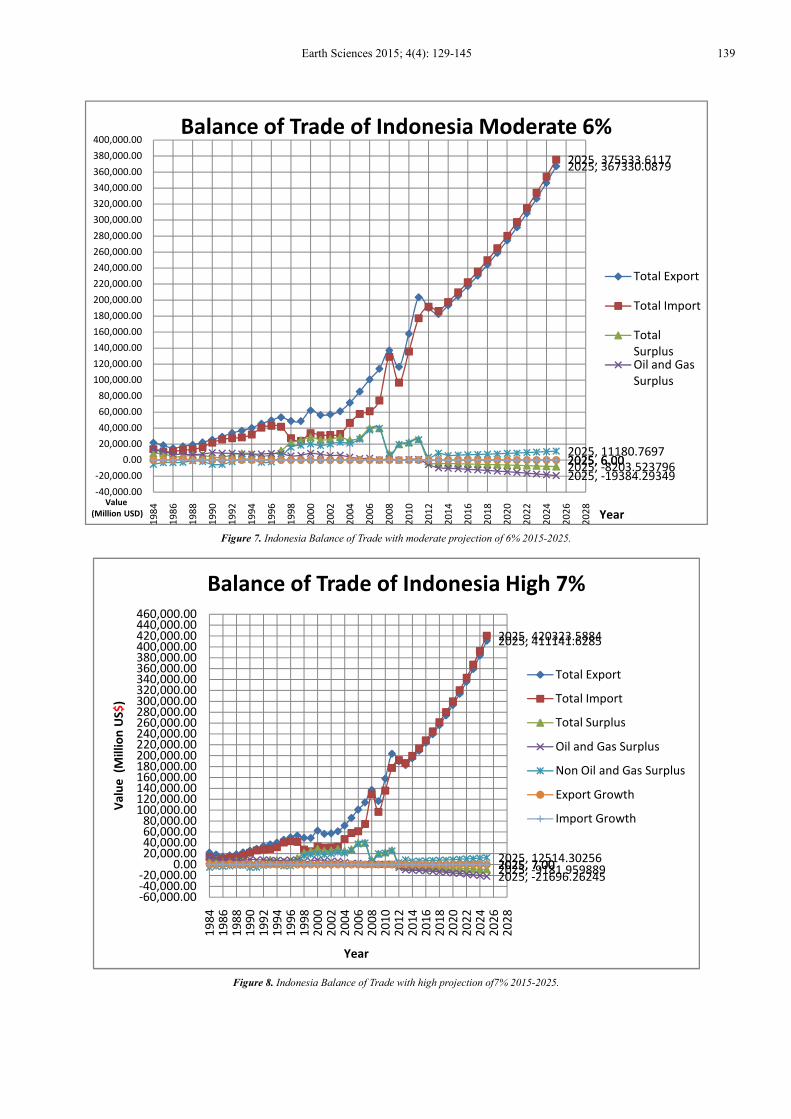
Figure 7. Indonesia Balance of Trade with moderate projection of 6% 2015-2025.
Figure 8. Indonesia Balance of Trade with high projection of7% 2015-2025.
2025, 367330.08792025, 375533.6117
2025, -8203.5237962025, -19384.29349
2025, 11180.76972025, 6.002025, 6.00
-40,000.00
-20,000.00
0.00
20,000.00
40,000.00
60,000.00
80,000.00
100,000.00
120,000.00
140,000.00
160,000.00
180,000.00
200,000.00
220,000.00
240,000.00
260,000.00
280,000.00
300,000.00
320,000.00
340,000.00
360,000.00
380,000.00
400,000.00
19
84
19
86
19
88
19
90
19
92
19
94
19
96
19
98
20
00
20
02
20
04
20
06
20
08
20
10
20
12
20
14
20
16
20
18
20
20
20
22
20
24
20
26
20
28Value
(Million USD) Year
Balance of Trade of Indonesia Moderate 6%
Total Export
Total Import
Total
SurplusOil and Gas
Surplus
2025, 411141.62852025, 420323.5884
2025, -9181.9598892025, -21696.26245
2025, 12514.302562025, 7.002025, 7.00
-60,000.00-40,000.00-20,000.00
0.0020,000.0040,000.0060,000.0080,000.00
100,000.00120,000.00140,000.00160,000.00180,000.00200,000.00220,000.00240,000.00260,000.00280,000.00300,000.00320,000.00340,000.00360,000.00380,000.00400,000.00420,000.00440,000.00460,000.00
19
84
19
86
19
88
19
90
19
92
19
94
19
96
19
98
20
00
20
02
20
04
20
06
20
08
20
10
20
12
20
14
20
16
20
18
20
20
20
22
20
24
20
26
20
28
Va
lue
(M
illi
on
US
$)
Year
Balance of Trade of Indonesia High 7%
Total Export
Total Import
Total Surplus
Oil and Gas Surplus
Non Oil and Gas Surplus
Export Growth
Import Growth
140 Ukar Wijaya Soelistijo et al.: Trend of Mineral Commodity Price and its Impact on the Indonesia Economy 1990-2025
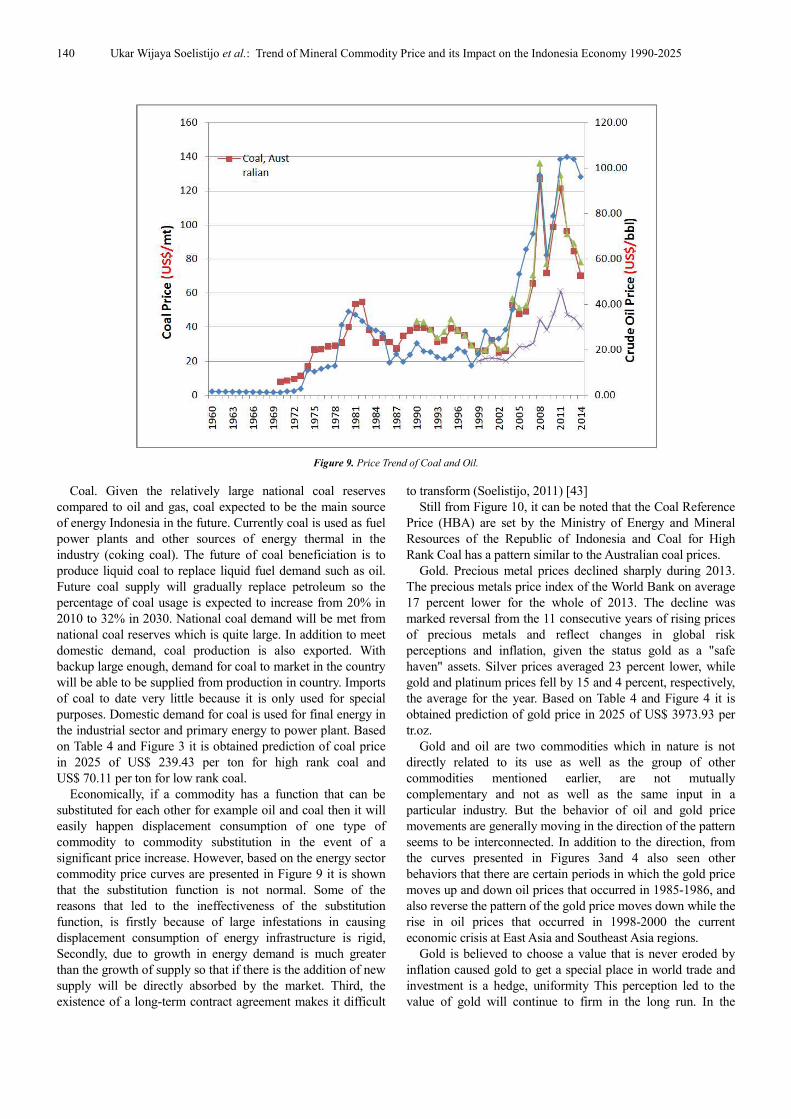
Figure 9. Price Trend of Coal and Oil.
Coal. Given the relatively large national coal reserves
compared to oil and gas, coal expected to be the main source
of energy Indonesia in the future. Currently coal is used as fuel
power plants and other sources of energy thermal in the
industry (coking coal). The future of coal beneficiation is to
produce liquid coal to replace liquid fuel demand such as oil.
Future coal supply will gradually replace petroleum so the
percentage of coal usage is expected to increase from 20% in
2010 to 32% in 2030. National coal demand will be met from
national coal reserves which is quite large. In addition to meet
domestic demand, coal production is also exported. With
backup large enough, demand for coal to market in the country
will be able to be supplied from production in country. Imports
of coal to date very little because it is only used for special
purposes. Domestic demand for coal is used for final energy in
the industrial sector and primary energy to power plant. Based
on Table 4 and Figure 3 it is obtained prediction of coal price
in 2025 of US$ 239.43 per ton for high rank coal and
US$ 70.11 per ton for low rank coal.
Economically, if a commodity has a function that can be
substituted for each other for example oil and coal then it will
easily happen displacement consumption of one type of
commodity to commodity substitution in the event of a
significant price increase. However, based on the energy sector
commodity price curves are presented in Figure 9 it is shown
that the substitution function is not normal. Some of the
reasons that led to the ineffectiveness of the substitution
function, is firstly because of large infestations in causing
displacement consumption of energy infrastructure is rigid,
Secondly, due to growth in energy demand is much greater
than the growth of supply so that if there is the addition of new
supply will be directly absorbed by the market. Third, the
existence of a long-term contract agreement makes it difficult
to transform (Soelistijo, 2011) [43]
Still from Figure 10, it can be noted that the Coal Reference
Price (HBA) are set by the Ministry of Energy and Mineral
Resources of the Republic of Indonesia and Coal for High
Rank Coal has a pattern similar to the Australian coal prices.
Gold. Precious metal prices declined sharply during 2013.
The precious metals price index of the World Bank on average
17 percent lower for the whole of 2013. The decline was
marked reversal from the 11 consecutive years of rising prices
of precious metals and reflect changes in global risk
perceptions and inflation, given the status gold as a "safe
haven" assets. Silver prices averaged 23 percent lower, while
gold and platinum prices fell by 15 and 4 percent, respectively,
the average for the year. Based on Table 4 and Figure 4 it is
obtained prediction of gold price in 2025 of US$ 3973.93 per
tr.oz.
Gold and oil are two commodities which in nature is not
directly related to its use as well as the group of other
commodities mentioned earlier, are not mutually
complementary and not as well as the same input in a
particular industry. But the behavior of oil and gold price
movements are generally moving in the direction of the pattern
seems to be interconnected. In addition to the direction, from
the curves presented in Figures 3and 4 also seen other
behaviors that there are certain periods in which the gold price
moves up and down oil prices that occurred in 1985-1986, and
also reverse the pattern of the gold price moves down while the
rise in oil prices that occurred in 1998-2000 the current
economic crisis at East Asia and Southeast Asia regions.
Gold is believed to choose a value that is never eroded by
inflation caused gold to get a special place in world trade and
investment is a hedge, uniformity This perception led to the
value of gold will continue to firm in the long run. In the
Earth Sciences 2015; 4(4): 129-145 141
hedging function and belief in the value of gold that will never
go down in the long run, countries rich in oil-producing excess
profits from the sales and rise in oil prices to increase their
gold reserves boosting demand and led to the gold price
appreciation itself. Conversely, when the price of oil downs,
gold reserves will be released into the market so that the excess
supply and the price of gold fell. This behavior was also
performed by the business to protect their assets from inflation
scour and of the risk of loss for example due to rising
production costs due to higher oil price. Both of these acts may
explain why the price of gold and oil prices have a general
pattern of movement in the same direction.
For the special case that occurred in 1998-2000 in which the
gold price moves down while the rise in oil prices caused by
the amount of gold supply comes from the release of gold
reserves by countries hit by the current economic crisis,
especially countries of East and Southeast Asia and funds
raised be used in their efforts to emerge from the crisis by
encouraging investment and industrialization role in their
country, further these efforts to encourage an increase in
demand for the oil industry needs. While beyond the year of
2020 the projected increasing price of gold would be more
stronger than oil one (Figure 4).
Silver. Silver is second precious metal after gold, which
since the first traded as a commodity mineral. As the
development of jewelry, the soaring price of silver
technological advances coupled substitution of silver by
various other materials to make use of silver be reduced, but
silver remains a precious metal commodity, whose value is
timeless as well as gold, and its main use remains dominate
jewelry, arts and crafts .Based on Table 4 and Figure 4
obtained prediction of silver price in 2025 of US$ 68,01 per
tr.oz. (Figure 3).
Aluminum. On an international scale, Indonesia is the
largest bauxite producer 7th in the world. From the price, the
price of bauxite is determined by the International market.
Several factors affect the price is the dominant development of
alumina and aluminum smelting plant. In the last 10 years, the
price of bauxite almost 2-fold to fold, which was originally
only US$17/MT to about US$26/MT, or grow an average of
5.19% per year, while the price of aluminum folding 2.5 times,
i.e. the original US$1468/MT increased to US$3620 /MT, or
grew at an average of 11.24% per year. Based on Table 4 and
Figure 3 obtained prediction of Aluminum price in 2025 of
US$ 2824.28 per ton (Figure 3).
Tin. Indonesia is a major producer of tin world, in addition
to Bolivia as the largest producers. Tin is needed as the
backbone of other industries as well as synonymous with war
industry (bullets), the needs of the world's tin is increasing
year-on-year rises in the cost significantly, especially since
2006 up to 2012. Indonesia has imposed a tin commodity
trading conditions in the country through the Indonesia Tin
stock, this step is believed to foster confidence in the market
Indonesian tin. Based on Table 4 and Figure 3 obtained
prediction of tin price in 2025 of US$ 28,536 per ton.
Copper. Indonesia is ranked 20th in the world based on the
location of the mine and copper production capacity. PT
Freeport Indonesia was ranked third, while the PT Newmont
Nusa Tenggara is the eleventh position. Ranked first and the
second is the state mining company in Chile. Especially copper
needs of the cable industry, and other electrical equipment.
Although the price of copper world possessed a tendency to
fluctuate, but the trend in the last 10 years shows an increase of
more than 200%, it is possible also occur in the future in line
with the needs of the growing copper. Based on Table 4 and
Figure 4 obtained prediction of zinc price in 2025 of
US$ 19,587 per ton (Figure 3).
Zinc. The estimate says that globally, zinc mine production
is expected to rise by 2.6 percent this year to 13.57 tons as
output from China, followed by Australia, it will increase.
Production by other Asian countries such as South Korea,
currently the world's third largest producer of lead behind
China and the United States, and India and Kazakhstan are
also expected to increase. Based on Table 4 and Figure 4
obtained prediction of zinc price in 2025 of US$ 19,081 per
ton (Figure 3).
Nickel. Indonesian nickel production, both nickel ore, nickel
or nickel rough, almost entirely used to meet export
requirements. So the Indonesian nickel demand is determined
by the world nickel demand. In the global market, the demand
for nickel is expected to increase by 3% per year, so that by
2015 demand for nickel metal was estimated at 2,000,000 tons.
Largest consumer of nickel in the world today is the Asian
countries (especially China), which in 2009 accounted for 61%
of world nickel consumption, followed by Europe 26%,
America 10%, Africa and Oceania only 3% .Meanwhile, the
needs of the world's nickel supplied by 20 companies
including the company of Indonesia, which was recorded with
a production rate of approximately 1,329 million tons of nickel.
Indonesian nickel production, either nickel, ferronickel or
nickel rough, almost entirely used to meet export requirements.
So the demand for nickel Indonesia is determined by the world
nickel demand. In the global market, the demand for nickel is
expected to increase by 3% per year, so that by the year
2015nickel metal demand is estimated at 2,000,000 tons.
Largest consumer of nickel in the world today is the Asian
countries (especially China), which in 2009 accounted for 61%
of world nickel consumption, followed by Europe 26%,
America 10%, Africa and Oceania only 3% .Meanwhile, the
needs of the world's nickel supplied by 20 companies
including the company of Indonesia, which was recorded with
a production rate of approximately 1,329 million tons of nickel
Based on Table 4 and Figure 3 obtained prediction of zinc
price in 2025 of US$ 41,970 per ton.
Mining sector is one of the mainstays of Indonesia in
achieving the goal of economic development is believed to be
able to support Indonesia in its transformation towards
developed countries. Exploitation of natural resources continue
to be made during the 30s decade considered not provide
sufficient results in achieving the ideals of the nation. This
prompted the government to find a new formula in the use and
management of natural resources in order to provide higher
economic impact.
The declining contribution of the mining sector in the
142 Ukar Wijaya Soelistijo et al.: Trend of Mineral Commodity Price and its Impact on the Indonesia Economy 1990-2025
Indonesian economy, especially in the oil and gas subsector as
shown in Figure 2, Indonesia decided to encouraging or
increase the value of the benefits of mineral and coal mining
subsector by issuing a law No. 4 of 2009. Various arguments
and reasons about the importance of these laws has been
expressed by the observer. But in this paper presenting it in a
different form that is based on the graphs presented in Figures
2and 10, it is shown that the sectors of mining and quarrying of
minerals and coal are still able to maintain it contribution on
GDP nominal value even showed an increase.
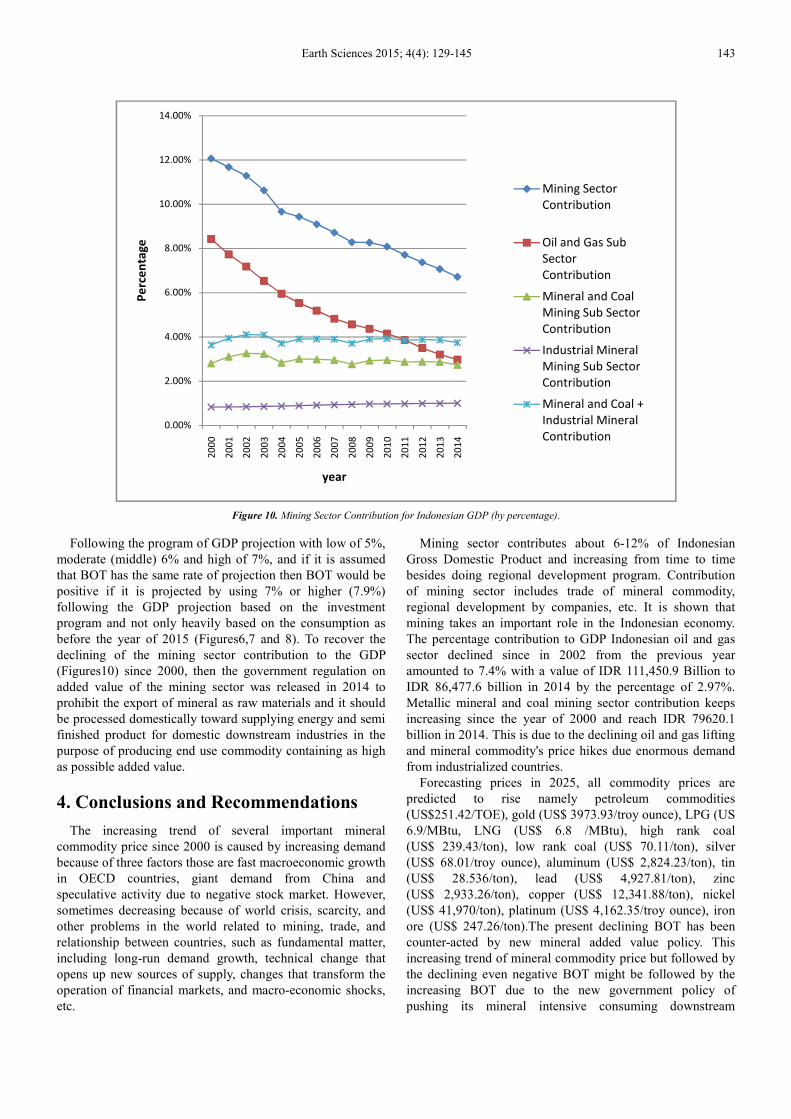
Based on Figure 3, during the year 2000 to 2014 the
contribution of the mining sector in general experienced a
decreasing trend, but the decline was caused by a decline in oil
and gas subsector as a result of declining productivity of
domestic oil wells. While the excavation subsector showed an
increase although the increase is relatively small. In the
mineral and coal mining subsector, which are periodic
fluctuations that in 2000-2002 showed an increase, 2003-2004
corrected, nail again in 2005-2006 and again corrected in
2007-2008 and then again showed improvement in 2009 -2010
and thereafter moved almost constant.
Nominally, the value of the general mining sector
throughout 2000 through 2014 has increased. Thus the
decrease in contributions was due to the increase in GDP
growth outpacing the growth of the mining and quarrying
sector. Nominal value of oil and gas subsector be offset by an
increase in the nominal value of the mining subsector (Figure
2).
Publication of laws prohibiting new mining exports as raw
materials to encourage efforts downstream mineral and coal
mining materials. Based on Figures 2 and 10 it is shown that
prior to the issuance of the law downstream sector contribution
of mining to GDP showed a decreasing trend. With the
presence of the laws of mineral and coal in 2009 can make
downstream sector of mining and quarrying of minerals and
coal back excited and managed to maintain contribution to
GDP besides its role in ding regional development such as
physical (infrastructure, physical environment and spatial order)
as well as non-physical development (corporate social
responsibility including community development). Currently,
net social gain created by the mining regional development
amounted to 1-20% of its revenue devoted to the local
community development (Soelistijo, 2013, [38,39].
In Figures 2 and 10, it is shown that in nominal terms, the
value of the downstream oil and gas has decreased from year
to year, besides in term of percentage. The decline in the
nominal value of the downstream oil and gas follows the
downward trend of the upstream sector as shown in Figure
2.The nominal value of the general mining increased and able
to offset a decline in the nominal value of oil and gas. This is a
positive value of the presence of the law on mineral and coal.
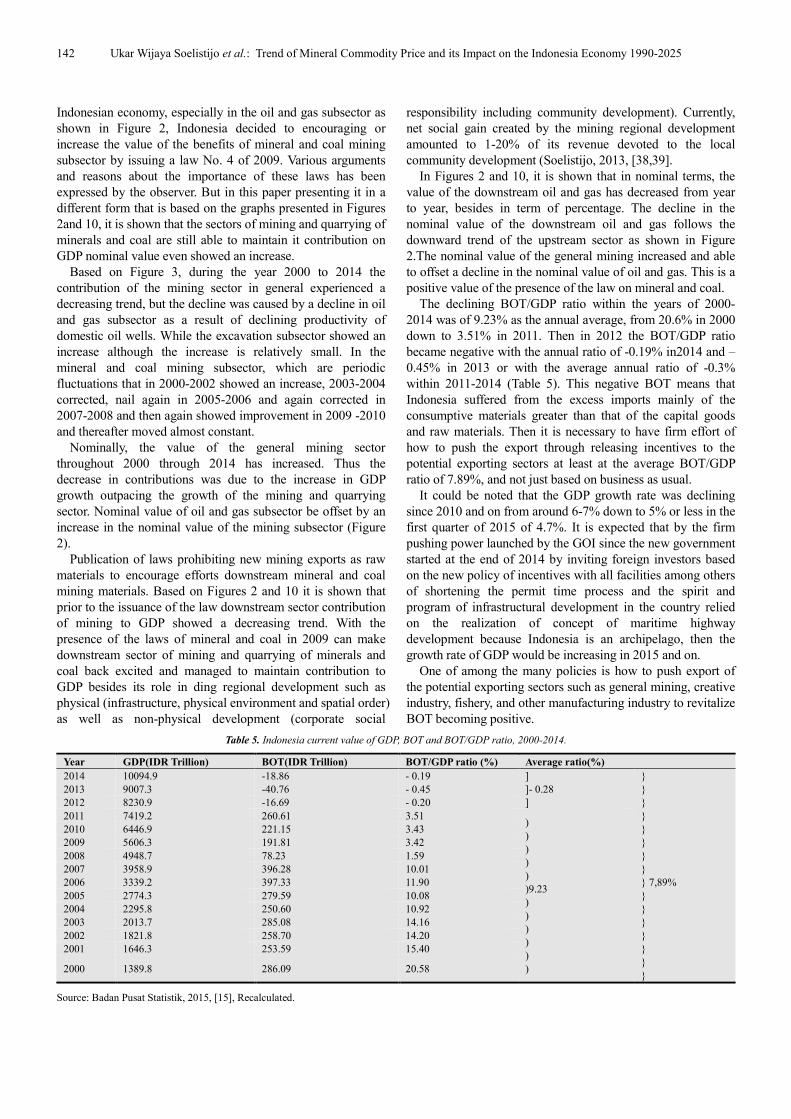
The declining BOT/GDP ratio within the years of 2000-
2014 was of 9.23% as the annual average, from 20.6% in 2000
down to 3.51% in 2011. Then in 2012 the BOT/GDP ratio
became negative with the annual ratio of -0.19% in2014 and –
0.45% in 2013 or with the average annual ratio of -0.3%
within 2011-2014 (Table 5). This negative BOT means that
Indonesia suffered from the excess imports mainly of the
consumptive materials greater than that of the capital goods
and raw materials. Then it is necessary to have firm effort of
how to push the export through releasing incentives to the
potential exporting sectors at least at the average BOT/GDP
ratio of 7.89%, and not just based on business as usual.
It could be noted that the GDP growth rate was declining
since 2010 and on from around 6-7% down to 5% or less in the
first quarter of 2015 of 4.7%. It is expected that by the firm
pushing power launched by the GOI since the new government
started at the end of 2014 by inviting foreign investors based
on the new policy of incentives with all facilities among others
of shortening the permit time process and the spirit and
program of infrastructural development in the country relied
on the realization of concept of maritime highway
development because Indonesia is an archipelago, then the
growth rate of GDP would be increasing in 2015 and on.
One of among the many policies is how to push export of
the potential exporting sectors such as general mining, creative
industry, fishery, and other manufacturing industry to revitalize
BOT becoming positive.
Table 5. Indonesia current value of GDP, BOT and BOT/GDP ratio, 2000-2014.
Year GDP(IDR Trillion) BOT(IDR Trillion) BOT/GDP ratio (%) Average ratio(%)
2014 10094.9 -18.86 - 0.19 ]
]- 0.28
]
}
}
}
}
}
}
}
}
} 7,89%
}
}
}
}
}
}
}
2013 9007.3 -40.76 - 0.45
2012 8230.9 -16.69 - 0.20
2011 7419.2 260.61 3.51 )
)
)
)
)
)9.23
)
)
)
)
)
)
2010 6446.9 221.15 3.43
2009 5606.3 191.81 3.42
2008 4948.7 78.23 1.59
2007 3958.9 396.28 10.01
2006 3339.2 397.33 11.90
2005 2774.3 279.59 10.08
2004 2295.8 250.60 10.92
2003 2013.7 285.08 14.16
2002 1821.8 258.70 14.20
2001 1646.3 253.59 15.40
2000 1389.8 286.09 20.58
Source: Badan Pusat Statistik, 2015, [15], Recalculated.
Earth Sciences 2015; 4(4): 129-145 143
Figure 10. Mining Sector Contribution for Indonesian GDP (by percentage).
Following the program of GDP projection with low of 5%,
moderate (middle) 6% and high of 7%, and if it is assumed
that BOT has the same rate of projection then BOT would be
positive if it is projected by using 7% or higher (7.9%)
following the GDP projection based on the investment
program and not only heavily based on the consumption as
before the year of 2015 (Figures6,7 and 8). To recover the
declining of the mining sector contribution to the GDP
(Figures10) since 2000, then the government regulation on
added value of the mining sector was released in 2014 to
prohibit the export of mineral as raw materials and it should
be processed domestically toward supplying energy and semi
finished product for domestic downstream industries in the
purpose of producing end use commodity containing as high
as possible added value.
4. Conclusions and Recommendations
The increasing trend of several important mineral
commodity price since 2000 is caused by increasing demand
because of three factors those are fast macroeconomic growth
in OECD countries, giant demand from China and
speculative activity due to negative stock market. However,
sometimes decreasing because of world crisis, scarcity, and
other problems in the world related to mining, trade, and
relationship between countries, such as fundamental matter,
including long-run demand growth, technical change that
opens up new sources of supply, changes that transform the
operation of financial markets, and macro-economic shocks,
etc.
Mining sector contributes about 6-12% of Indonesian
Gross Domestic Product and increasing from time to time
besides doing regional development program. Contribution
of mining sector includes trade of mineral commodity,
regional development by companies, etc. It is shown that
mining takes an important role in the Indonesian economy.
The percentage contribution to GDP Indonesian oil and gas
sector declined since in 2002 from the previous year
amounted to 7.4% with a value of IDR 111,450.9 Billion to
IDR 86,477.6 billion in 2014 by the percentage of 2.97%.
Metallic mineral and coal mining sector contribution keeps
increasing since the year of 2000 and reach IDR 79620.1
billion in 2014. This is due to the declining oil and gas lifting
and mineral commodity's price hikes due enormous demand
from industrialized countries.
Forecasting prices in 2025, all commodity prices are
predicted to rise namely petroleum commodities
(US$251.42/TOE), gold (US$ 3973.93/troy ounce), LPG (US
6.9/MBtu, LNG (US$ 6.8 /MBtu), high rank coal
(US$ 239.43/ton), low rank coal (US$ 70.11/ton), silver
(US$ 68.01/troy ounce), aluminum (US$ 2,824.23/ton), tin
(US$ 28.536/ton), lead (US$ 4,927.81/ton), zinc
(US$ 2,933.26/ton), copper (US$ 12,341.88/ton), nickel
(US$ 41,970/ton), platinum (US$ 4,162.35/troy ounce), iron
ore (US$ 247.26/ton).The present declining BOT has been
counter-acted by new mineral added value policy. This
increasing trend of mineral commodity price but followed by
the declining even negative BOT might be followed by the
increasing BOT due to the new government policy of
pushing its mineral intensive consuming downstream
0.00%
2.00%
4.00%
6.00%
8.00%
10.00%
12.00%
14.00%
20
00
20
01
20
02
20
03
20
04
20
05
20
06
20
07
20
08
20
09
20
10
20
11
20
12
20
13
20
14
Pe
rce
nta
ge
year
Mining Sector
Contribution
Oil and Gas Sub
Sector
Contribution
Mineral and Coal
Mining Sub Sector
Contribution
Industrial Mineral
Mining Sub Sector
Contribution
Mineral and Coal +
Industrial Mineral
Contribution
144 Ukar Wijaya Soelistijo et al.: Trend of Mineral Commodity Price and its Impact on the Indonesia Economy 1990-2025
industries respectively and asa whole within the coming
years.
The forecast of mineral commodity should be done by
another improved methods and models so that it could be
compared from one to the others. The parameters which
affect price trends and forecast should be completed before
forecasting, so that the result will be more precise and
accurate.
References
[1] Anonymous (a), 2012, Harga Batubara Acuan (HBA) & Harga Patokan Batubara (HPB), http://www.djmbp.esdm.go.id/sijh/HBA 20 February 202013.pdf, accessed on 1 April 2013.
[2] Anonymous (b), 2012, Non Ferrous Metals-Historical Data, http://www.lme.com/metals/non-ferrous/historical_data, accessed on 15 February 2013.
[3] Anonymous (c), 2013, Gold-London Price Market Fix, http://www.kitco.com/scripts/hist_charts/yearly_graphs.plx, accessed on 15 February 2013
[4] Anonymous (d), 2015, OPEC Basket Price, http://www.opec.org/opec_web/en/data_graphs/40.htm, accessed on 10 February 2015.
[5] Anonymous (e), 2013, Silver-London Price Market Fix, http://www.kitco.com/scripts/hist_charts/yearly_graphs.plx, accessed on 15 February 2013.
[6] Anonymous (f), 2015, Gold and Silver-London Price Market Fix, http://www.kitco.com/scripts/hist_charts/yearly_graphs.plx, accessed on 10 February 2015
[7] Anonymous (g), 2015, Tin LME spot price chart, http://ycharts.com/indicators/tin_lme_spot_price, accessed on 10 February 2015.
[8] Anonymous (h), 2015, Lead LME spot price chart, http://ycharts.com/indicators/lead_lme_spot_price, accessed on 10 February 2015.
[9] Anonymous (i), 2015, Copper LME spot price chart, http://ycharts.com/indicators/copper_lme_spot_price, accessed on 10 February 2015.
[10] Anonymous (j), 2015, Nickel LME spot price chart, http://ycharts.com/indicators/nickel_lme_spot_price, accessed on 10 February 2015.
[11] Anonymous (k), 2015, Harga Batubara Acuan (HBA) Desember 2014, http://www.minerba.esdm.go.id/library/content/file/28935-HBA 20 Desember 202014/8a8be52ae7f658b5a18b47b21c6e4e4b2014-12-09-00-38-04.pdf, accessed on 10 February 2015.
[12] Anonymous (l), 2015, zinc LME settlement price chart, http://ycharts.com/indicators/zinc_lme_settlement_price, accessed on 10 February 2015.
[13] http://en.wikipedia.org/wiki/Ring_of_Fire accessed on 25 March 2015
[14] http://wikipedia.org
[15] Badan Pusat Statistik. Statistik Indonesia 2014. 2015, Jakartahttp://www.bps.go.id/pdb.php
[16] http://www.lme.com/en-gb/metals/
[17] http://moharifwidarto.wordpress.com/2008/10/25/krisis-keuangan-global-2008-beda-dengan-krisis-keuangan-1997/
[18] http://bps.go.id/data
[19] Cuddington, J. T, D. Jerrett. “Super Cycles in Metals Prices?” IMF Staff Papers 55, 4(December), 541-565, 2008.
[20] Editorial. Understanding international commodity price fluctuations. Journal of International Money andFinance 42. 2014.
[21] Gujarati, DN. Fundamental econometrics. Penerbit Erlangga, Jakarta, 2006.
[22] Gujarati, DN. and Porter, DC. Basic Econometrics 5 th Edition. New York: McGraw-Hill, 2009.
[23] Jacks, D., K. O'Rourke, J. Williamson. Commodity price volatility and world market integration since 1700. The Review of Economics and Statistics, 93(3):800{813}, 2011.
[24] Labys, WC. Dynamic commodity models: Specification, estimation, and simulation. Lexington Books, D,C. Heath and Company, Lexington, 1973.
[25] Li, Y., C. Wu, J. Liu, P. Luo. A Combination Prediction Model of Stock Composite Index Based on Artificial Intellegent Methods and Multi-Agent Simulation. International Journal of Computational Intelligence Systems, 7(5), 853-864, 2014. http://dx.doi.org
[26] Maddala, GS. Econometrics. McGraw-Hill Book Company, New York, 1977.
[27] Radetzki, The anatomy of three commodity booms, Resources Policy 31, 2006, pg. 56-64
[28] Radetzki, Eggert, Lagos, Lima and Tilton. The boom in mineral markets: How long might it last?, Resources Policy 33, 2008, pg. 125-128.
[29] Schaeffer, PV, 2008. Commodity modeling and prices: Methods for analyzing resourcemarekt behavior. John Wiley & Sons, Inc, Canada.
[30] Soelistijo UW, T. Suseno, I. Suherman, Mujib, C. Nas. Ekonomi Regional dan Model Penerapannya: Pengembangan Sumber Daya Mineral dan Energi Dalam Rangka Otonomi Daerah di Indonesia.Pusat Penelitian dan Pengembangan Teknologi Mineraldan Batubara, Departemen Energi dan Sum,ber Daya Mineral, 2003.
[31] Soelistijo, UW. Prospect of Potential Nickel Added Value Development in Indonesia.Earth Science. Science Publishing Group, USA.Vol. 2, No. 6, 2013, pp. 129-138. doi: 10.11648/j.earth.20130206.13, 2013.
[32] Soelistijo, UW. The Influence of Geopolitics and Strategical Factors upon the Development of Natural and Human Resources in Indonesia. Social Sciences. Science Publishing Group, USA. Vol. 2, No. 6, 2013, pp. 200-211. doi: 10.11648/j.ss.20130206.15, 2013.
[33] Soelistijo, UW. Control of Illegal Mining (PETI) in Indonesia: Policy and Program.Indonesian Mining Journal, ISSN 0854-9931, Volume 14 Number 1, February 2011, R&D Centre for Mineral and Coal Technology, tekMIRA), 2011.
Earth Sciences 2015; 4(4): 129-145 145
[34] Soelistijo, UW. Several evaluation and analytical indicators of regional autonomy implementation impacts in Indonesia: Energy and Mineral Resource Sector Development.Indonesian Mining Journal, ISSN 0854-9931, Volume 15 Number 2, June 2012, R&D Centre for Mineral and Coal Technology, tekMIRA), 2012.
[35] Soelistijo, UW. Beberapa Indikator Nilai Tambah Ekonomi Indonesia: Sektor Energi dan Sumber DayaMineral (Several Indicators of the Indonesia Economy Added Value: Energy and Mineral Resource Sector). Jurnal Teknologi Mineral dan Batubara, ISSN 1979-6560, Vol. 9 No. 1, January 2013, Puslitbang Teknologi Mineral dan Batubara), 2013.
[36] Soelistijo, UW, B. Santoso. A Brief Overview of The Scarcity of The Indonesia Gold Mining,Buletin Tekmira, ISSN 0854-7890, Nomor 28, Tahun 11, Bandung, Mei, 2003.
[37] Soelistijo, UW. Economic Evaluation of the Existing and Potential Indonesian Coal Utilization.EarthScience.Vol. 2, No. 6, 2013, pp. 120-128. doi:10.11648/j.earth.20130206.12
[38] Soelistijo, UW. Political Economy of Resources and Its Development: The Case of Indonesia.American Journal of Business,Economics and Management. Vol. 1, No. 1, 2013, pp. 16-24.
[39] Soelistijo, UW. The Influence of Geopolitics and Strategical Factors upon the Development of Natural and Human Resources in Indonesia. Social Sciences. Vol. 2, No. 6, 2013, pp. 200-211. doi: 10.11648/j.ss.20130206.15
[40] Soelistijo, UW, B.Santoso, T. Suseno. An Eye-Bird View of Facing Scarcity of Gold Mining inIndonesia. Scientia Research Library ISSN 2348-0416 USA CODEN: JASRHB Journal of Applied Science And Research, 2014, 2 (1):11.(http://www.scientiaresearchlibrary.com/arhcive.php)
[41] Soelistijo, UW, L.O. Aswandi, 2014. “Future Trend of Mineral Industries Development in Indonesia.” Earth Science. Vol. 3, No. 2, 2014, pp. 58-67. doi: 10.11648/j.earth.20140302.14, 2014.
[42] Soelistijo, UW. “Dinamika Penanaman Modal Asing (PMA) Bidang Pertambangan Umum di Indonesia”,Mimbar, Jurnal Sosial dan Pembangunan, Volume XXVII, No.1 (Juni 20111), Unisba, 2011
[43] Soelistijo, UW. Laporan Perjalanan Mengikuti International Conference on Air Quality VIII, 24-27 Oktober 2011, Crystal Gateway Marriott, Arlington, Virginia, Amerika Serikat. Laporan dinas kepada Kementerian Keuangan,Rektor Unisba, dan Kapuslitbang Mineral dan Batubara, 2011.
[44] Stuermer, M. 150 Years of Boom and Bust: What Drives Mineral Commodity Prices?. Department of Economics, University of Bonn, Germany, 2013.
[45] Todaro, MP, SC Smith, 2011. Economic development. Penerbit Erlangga, Jakarta.
[46] World Bank. Commodity Market Outlook – January 2015 Edition Quarterly Report. World Bank Group, 2015.