Embed Size (px)
DESCRIPTION
Trend for Precision Soil Testing % Zone or Grid Samples Tested compared to Total Samples. AGVISE Laboratories % Zone or Grid Samples Tested Compared to Conventional Whole Field Composite Samples in 2013. AGVISE Laboratories %Zone or Grid Samples – Northwood laboratory 1997 - 2013. - PowerPoint PPT Presentation
Citation preview
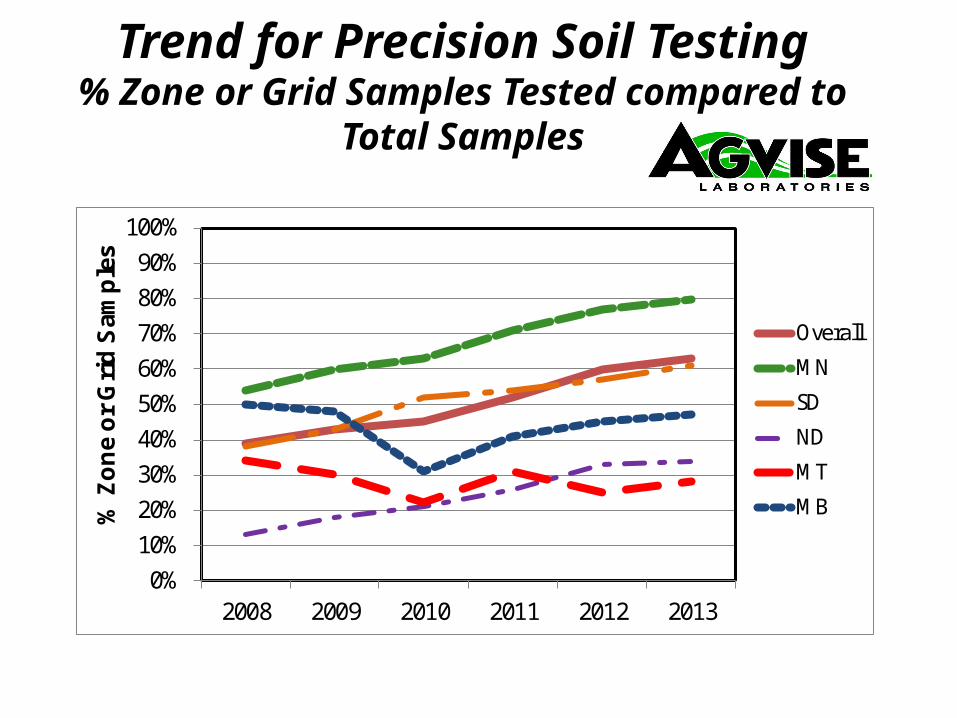
Trend for Precision Soil Testing% Zone or Grid Samples Tested compared to
Total Samples
0%10%20%30%40%50%60%70%80%90%
100%
2008 2009 2010 2011 2012 2013
% Z
on
e o
r G
rid
Sam
ple
s
Overall
MN
SD
ND
MT
MB
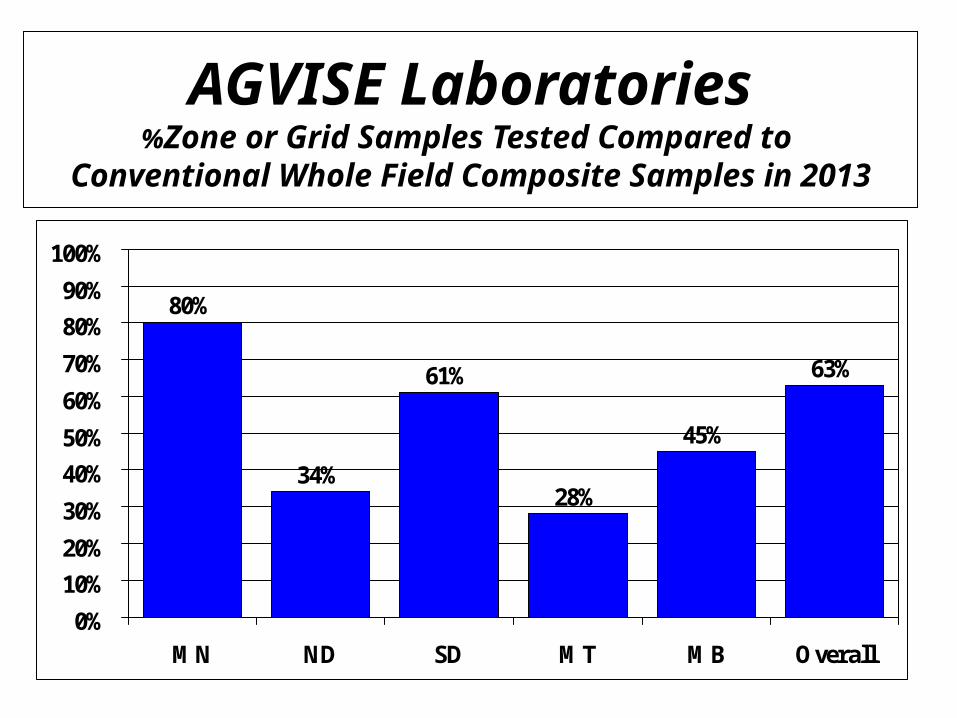
AGVISE Laboratories%Zone or Grid Samples Tested Compared to
Conventional Whole Field Composite Samples in 2013
80%
34%
61%
28%
45%
63%
0%
10%
20%
30%
40%
50%
60%
70%
80%
90%
100%
MN ND SD MT MB Overall
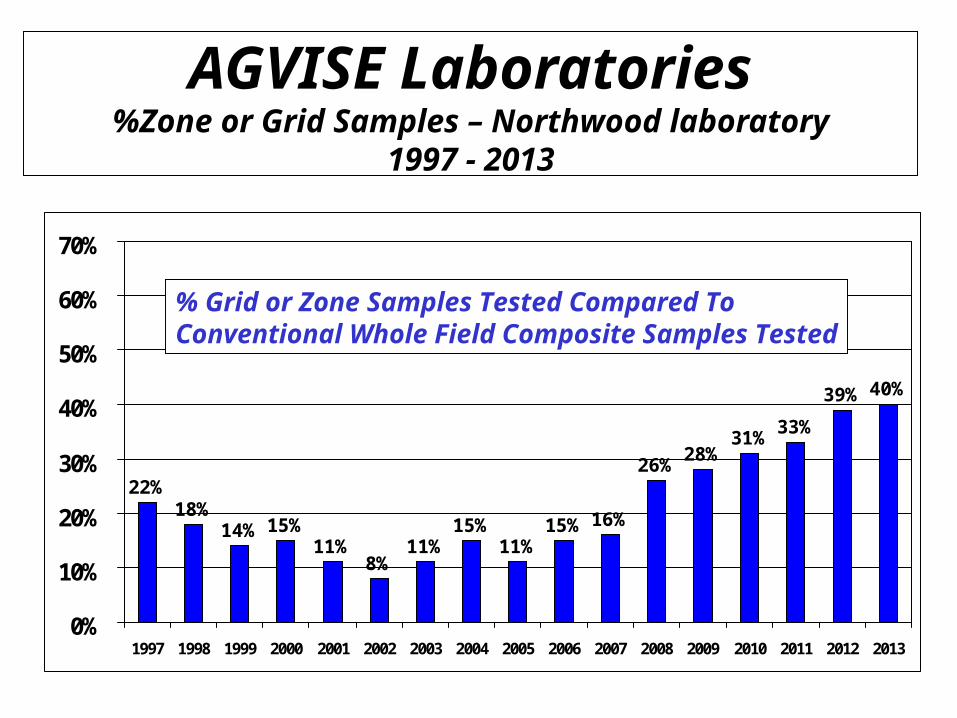
AGVISE Laboratories%Zone or Grid Samples – Northwood laboratory
1997 - 2013
22%18%
14% 15%11%
8%11%
15%11%
15% 16%
26%28%
31%33%
39% 40%
0%
10%
20%
30%
40%
50%
60%
70%
1997 1998 1999 2000 2001 2002 2003 2004 2005 2006 2007 2008 2009 2010 2011 2012 2013
% Grid or Zone Samples Tested Compared To Conventional Whole Field Composite Samples Tested
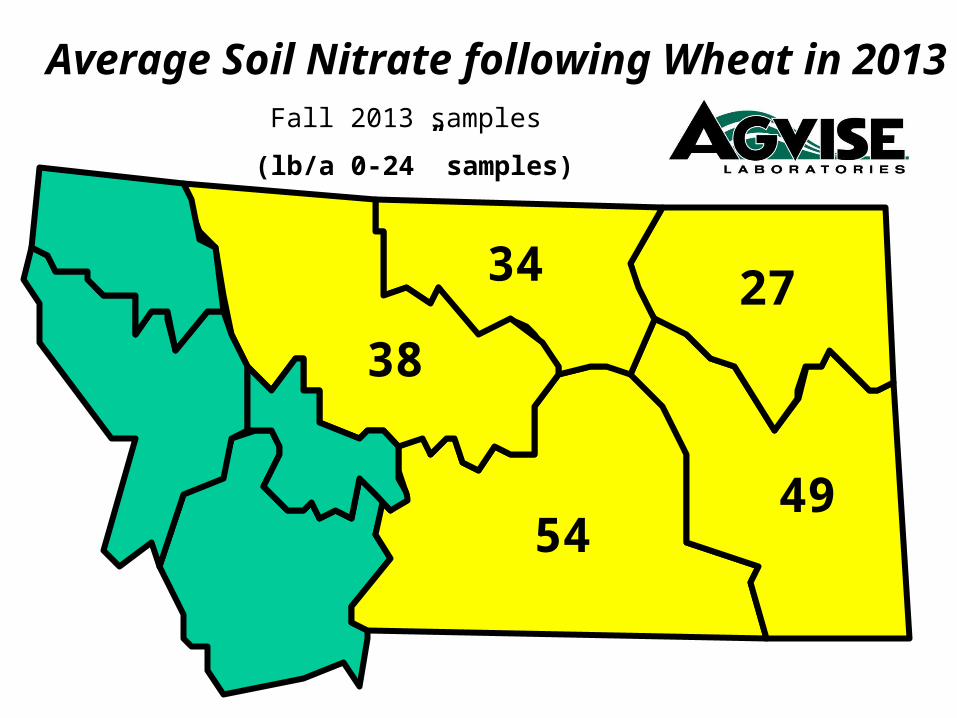
Fall 2013 samples
27
49
34
Average Soil Nitrate following Wheat in 2013
(lb/a 0-24” samples)
54
38
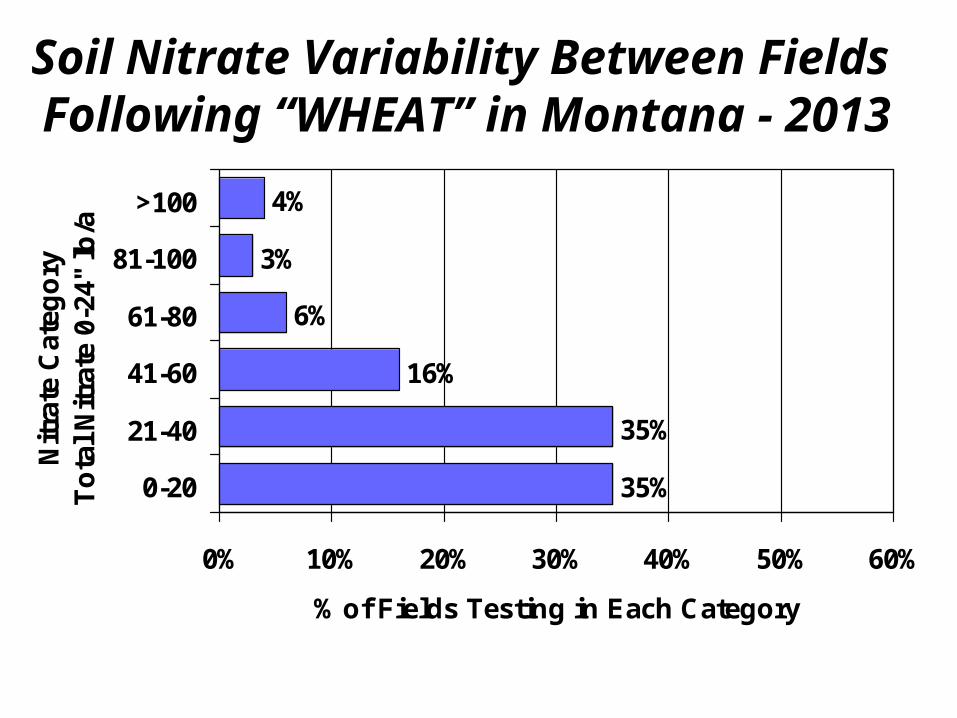
35%
35%
16%
6%
3%
4%
0% 10% 20% 30% 40% 50% 60%
0-20
21-40
41-60
61-80
81-100
>100
Nit
rate
Cat
ego
ry
To
tal
Nit
rate
0-2
4" l
b/a
% of Fields Testing in Each Category
Soil Nitrate Variability Between Fields Following “WHEAT” in Montana - 2013
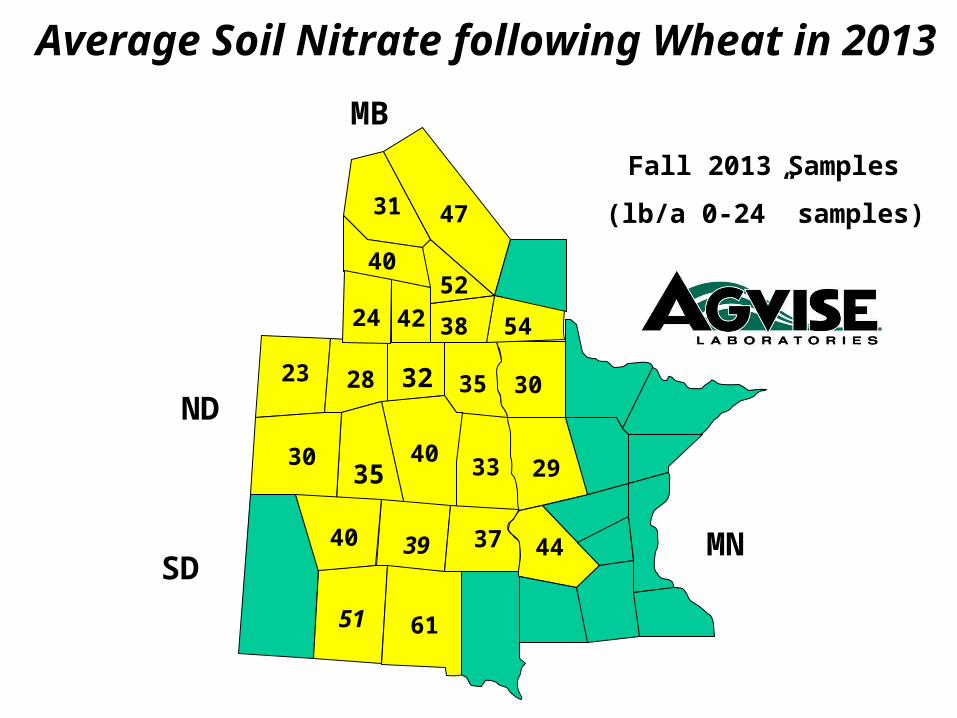
33
3532
4035
30
23 28
29
30
61
39
38 5442
Average Soil Nitrate following Wheat in 2013
Fall 2013 Samples
(lb/a 0-24” samples)
MB
ND
SDMN40
51
2452
31 47
40
4437
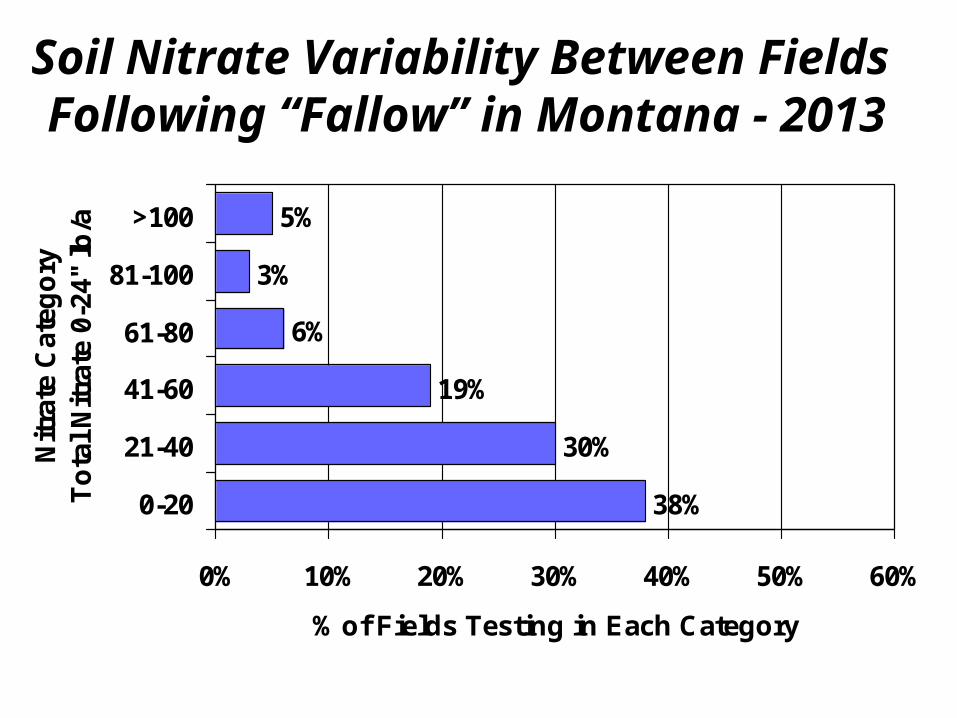
38%
30%
19%
6%
3%
5%
0% 10% 20% 30% 40% 50% 60%
0-20
21-40
41-60
61-80
81-100
>100
Nit
rate
Cat
ego
ry
To
tal
Nit
rate
0-2
4" l
b/a
% of Fields Testing in Each Category
Soil Nitrate Variability Between Fields Following “Fallow” in Montana - 2013
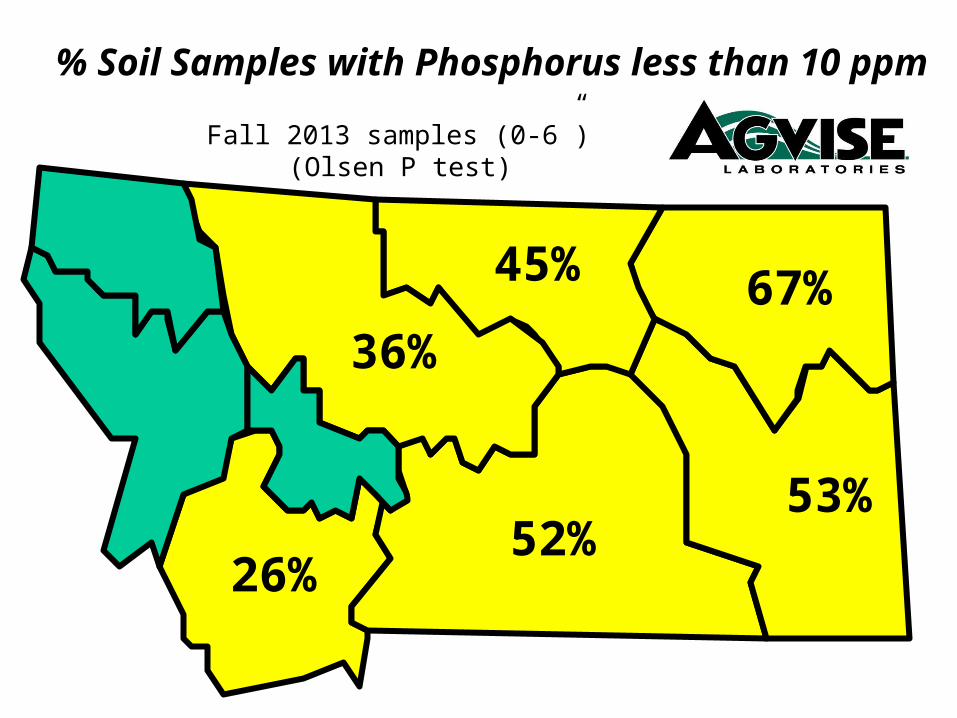
% Soil Samples with Phosphorus less than 10 ppm
Fall 2013 samples (0-6”)
67%
53%
36%
45%
52%
(Olsen P test)
26%
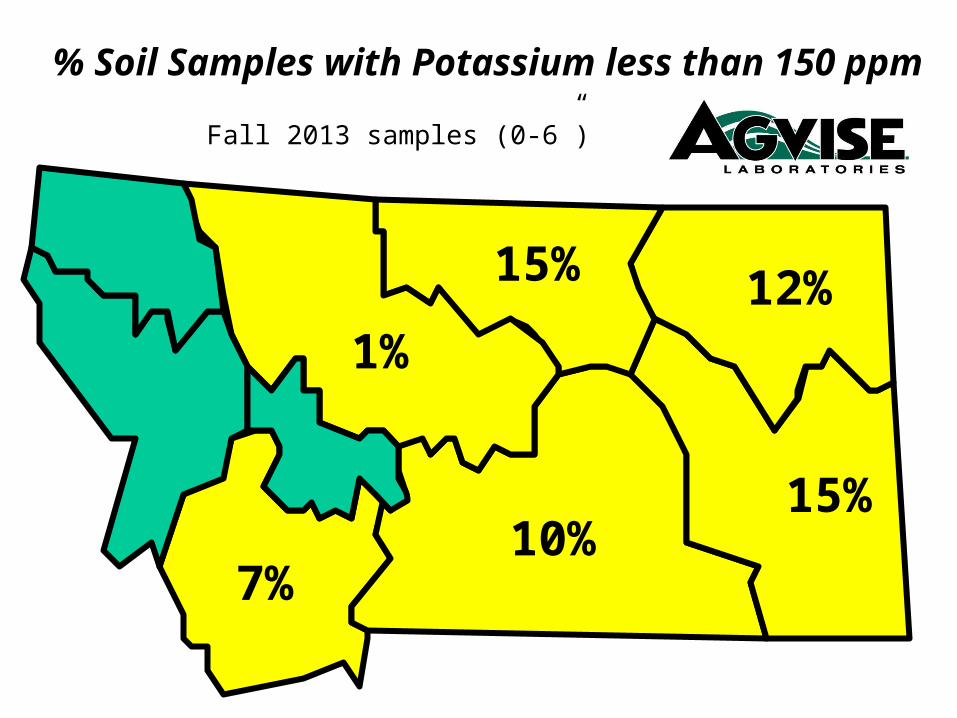
% Soil Samples with Potassium less than 150 ppm
Fall 2013 samples (0-6”)
12%
15%
1%
15%
10%7%
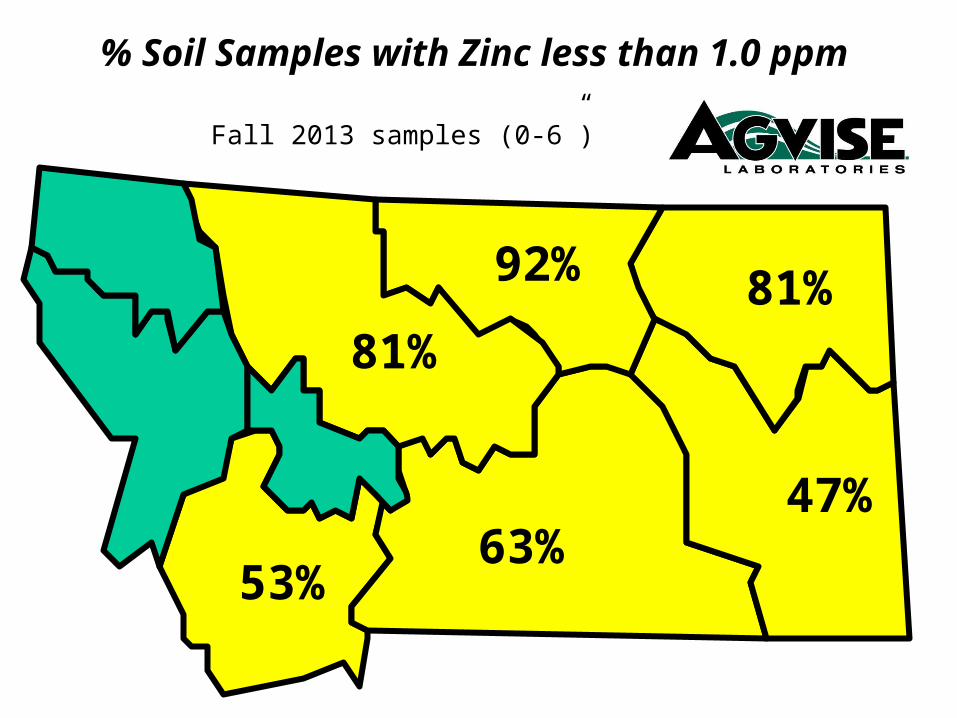
% Soil Samples with Zinc less than 1.0 ppm
Fall 2013 samples (0-6”)
81%
47%
81%
92%
63%53%

% Soil Samples with Sulfur less than 15 lb/a
Fall 2013 samples (0-6”)
54%
20%
46%
61%
12%35%
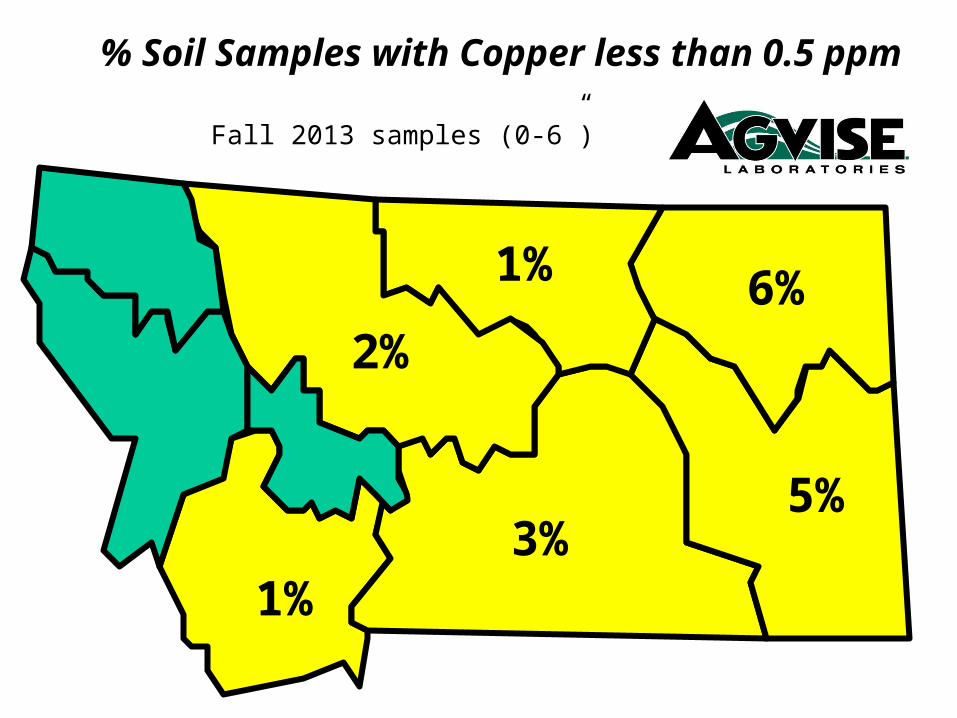
% Soil Samples with Copper less than 0.5 ppm
Fall 2013 samples (0-6”)
6%
5%
2%
1%
3%1%

% Soil Samples with Boron less than 0.4 ppm
Fall 2013 samples (0-6”)
11%
5%
10%
18%
1%3%
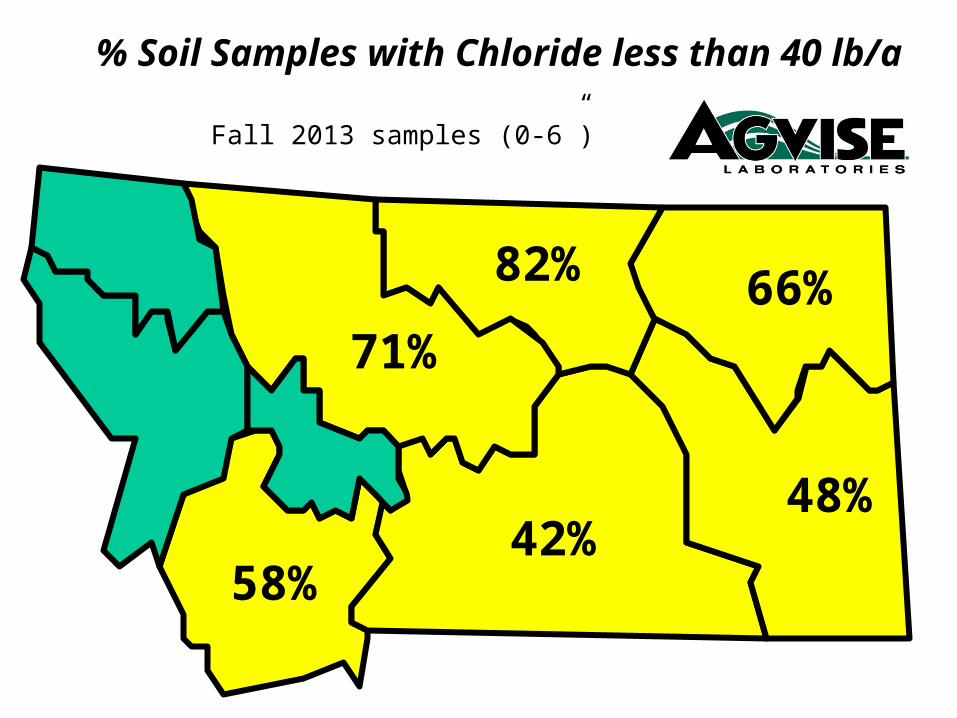
% Soil Samples with Chloride less than 40 lb/a
Fall 2013 samples (0-6”)
66%
48%
71%
82%
42%58%
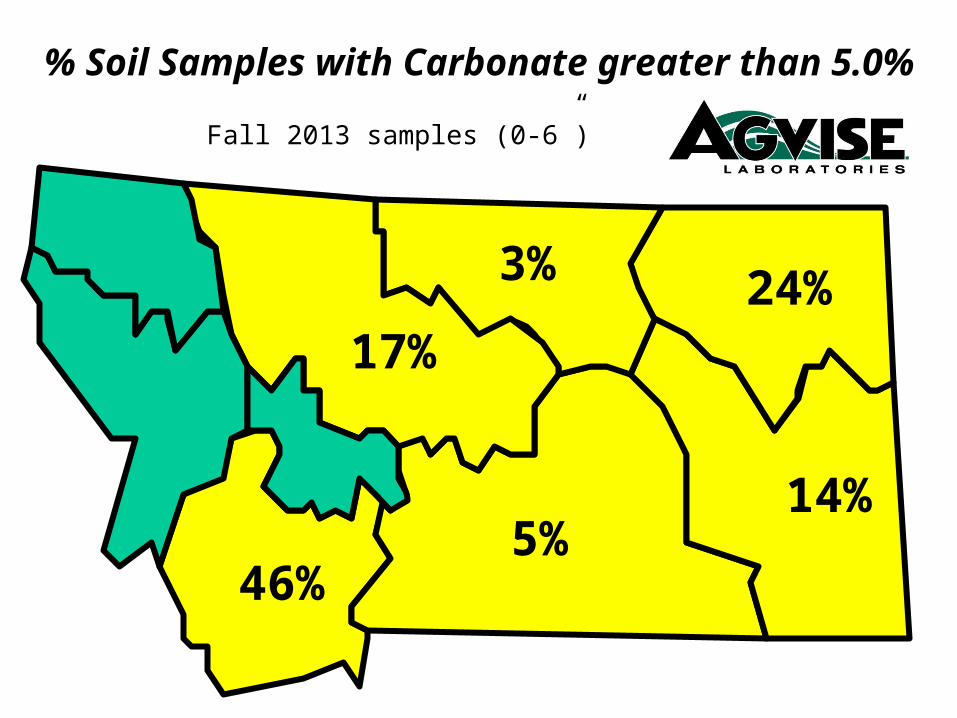
% Soil Samples with Carbonate greater than 5.0%
Fall 2013 samples (0-6”)
24%
14%
17%
5%46%
3%
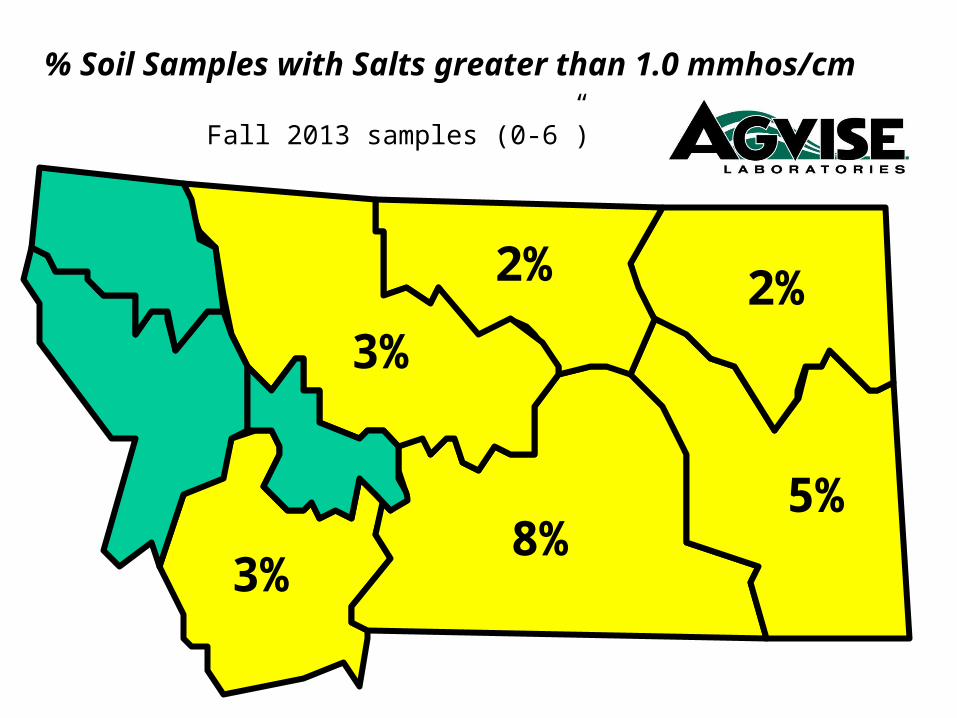
% Soil Samples with Salts greater than 1.0 mmhos/cm
Fall 2013 samples (0-6”)
2%
5%
3%
2%
8%3%

% Soil Samples with soil pH greater than 7.3
Fall 2013 samples (0-6”)
76%
88%
72%
66%
92%79%
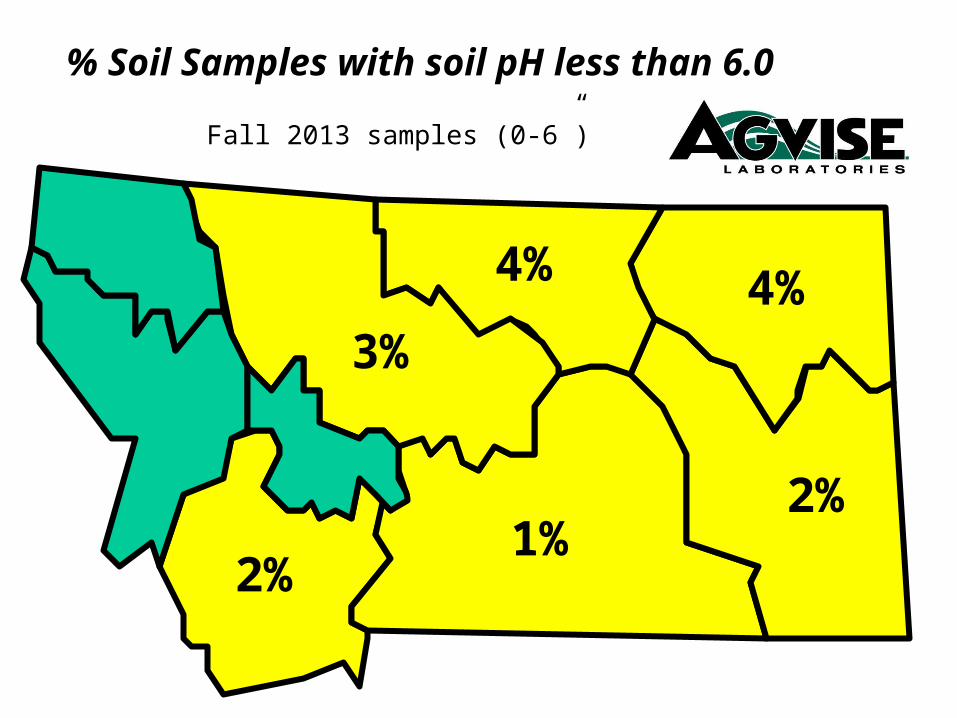
% Soil Samples with soil pH less than 6.0
Fall 2013 samples (0-6”)
4%
2%
3%
4%
1%2%
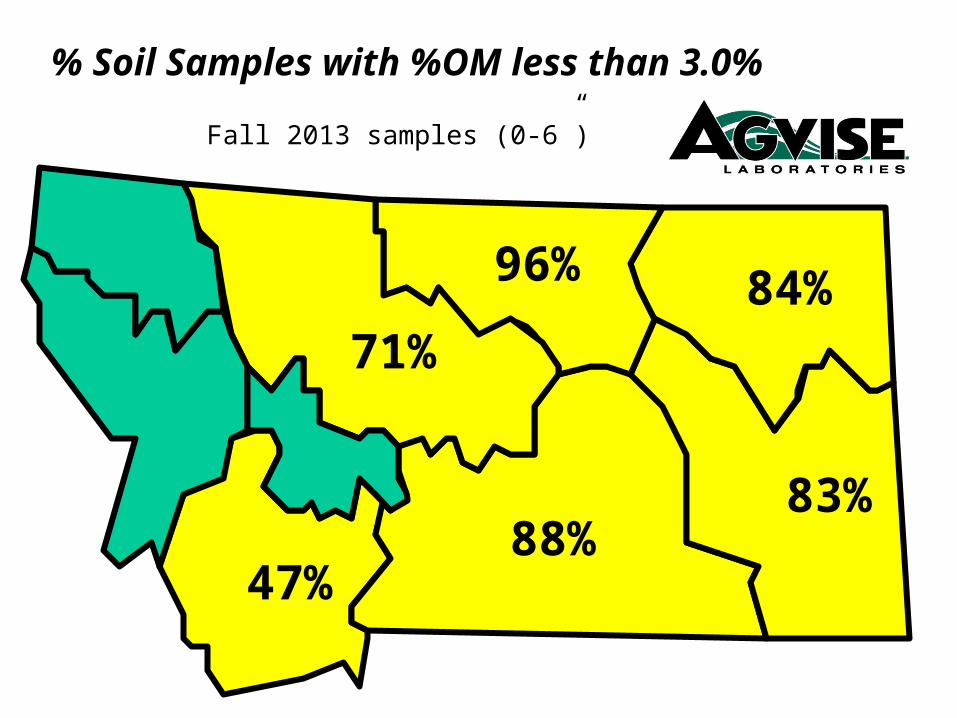
% Soil Samples with %OM less than 3.0%
Fall 2013 samples (0-6”)
84%
83%
71%
96%
88%47%
592
593
594
595
Zip codes for Montana
590-591
599
598
597
596