Embed Size (px)
Citation preview

Trend Detection in CarManufacturing Processes
Anton Andriyashin
Michal Benko
Wolfgang Hardle
Roman Timofeev
Uwe Ziegenhagen
http://ise.wiwi.hu-berlin.dehttp://www.case.hu-berlin.de
Motivation 1-2
Car Production Today
� outsourcing, different suppliers involved� painting is important cost factor� cost(painting)>cost(body)
Prozess Prototyping - OberflächentechnikBesuch Prof. Härdle, 19.10.2004
Rohbau VorreinigenVorreinigen Spülen PhosphatierenSpülen PhosphatierenSpülen Phosphatieren Passivieren Spülen Passivieren Spülen
Elektro-TauchlackierenElektro-TauchlackierenSpülenSpülenTauchspülenTauchspülenEinbrennenEinbrennen
SchleifenSchleifen AbdeckenAbdecken UnterbodenschutzUnterbodenschutz AbdeckenAbdecken Nahtabdichung (automatisch & manuell)Nahtabdichung (automatisch & manuell) AbreibenAbreiben
Füller (ESTA)Füller (ESTA)EinbrennenEinbrennenSchleifenSchleifenReinigenReinigenBC innenBC innenBC ESTABC ESTABC Air
Flash offFlash off CC innenCC innen CC ESTACC ESTA Flash offFlash off EinbrennenEinbrennen QualitätskontrolleQualitätskontrolle EndmontageEndmontage
OEM
Trend Detection
Motivation 1-3
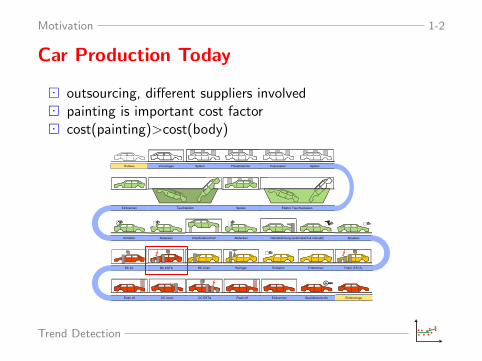
Problem
� early detection of trend needed
� construction of statistical tests
� comparison of test procedures
Trend Detection
2-4
Outline
1. Motivation X
2. Dataset
3. Tests
4. Simulation
Trend Detection
Data 3-5
Dataset
� 7100 painted cars, 20 different colors
� luminance, a- and b- color axis from fiveangles for bonnet and wing
� explanatory variables: color lot, temperature,measuring person
� 42% silver (luminance most important component)
� customers most sensitive to changes of metallic colors
Trend Detection
Data 3-6
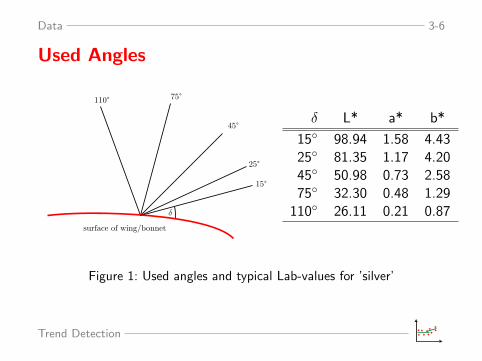
Used Angles
15°
25°
75°
45°
110°
δ
surface of wing/bonnet
1
δ L* a* b*
15◦ 98.94 1.58 4.4325◦ 81.35 1.17 4.2045◦ 50.98 0.73 2.5875◦ 32.30 0.48 1.29
110◦ 26.11 0.21 0.87
Figure 1: Used angles and typical Lab-values for ’silver’
Trend Detection
Data 3-7
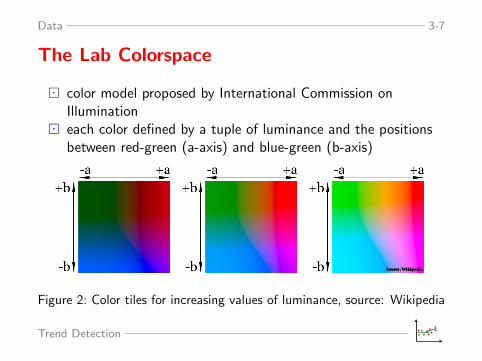
The Lab Colorspace
� color model proposed by International Commission onIllumination
� each color defined by a tuple of luminance and the positionsbetween red-green (a-axis) and blue-green (b-axis)
Source: Wikipedia
Figure 2: Color tiles for increasing values of luminance, source: Wikipedia
Trend Detection
Data 3-8
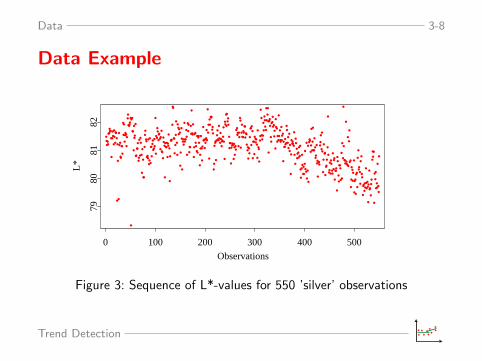
Data Example
0 100 200 300 400 500
Observations
7980
8182
L*
Figure 3: Sequence of L*-values for 550 ’silver’ observations
Trend Detection
Tests 4-9
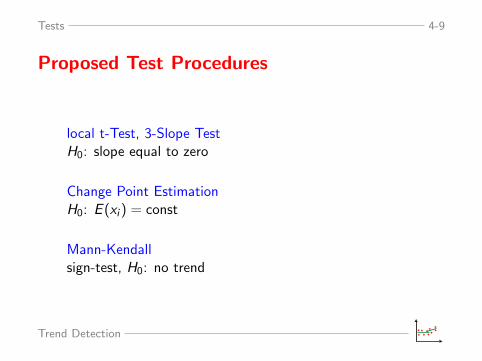
Proposed Test Procedures
local t-Test, 3-Slope TestH0: slope equal to zero
Change Point EstimationH0: E (xi ) = const
Mann-Kendallsign-test, H0: no trend
Trend Detection
Tests 4-10
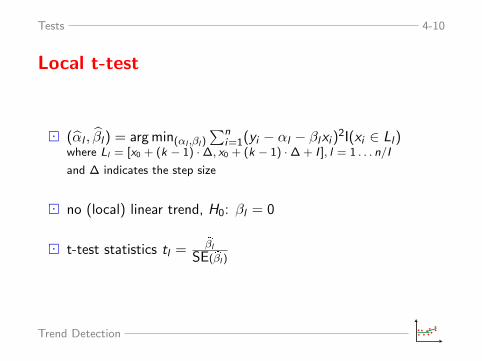
Local t-test
� (αl , βl) = arg min(αl ,βl )
∑ni=1(yi − αl − βlxi )
2I(xi ∈ Ll)where Ll = [x0 + (k − 1) · ∆, x0 + (k − 1) · ∆ + I ], l = 1 . . . n/I
and ∆ indicates the step size
� no (local) linear trend, H0: βl = 0
� t-test statistics tl =bβl
SE(bβl )
Trend Detection
Tests 4-11
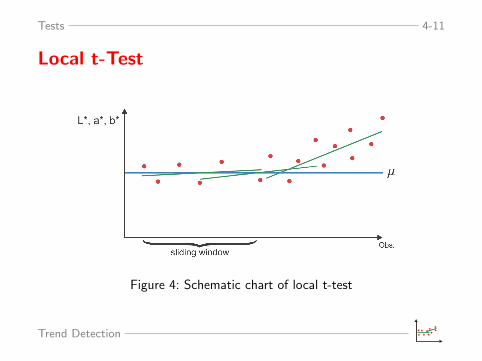
Local t-Test
Figure 4: Schematic chart of local t-test
Trend Detection
Tests 4-12
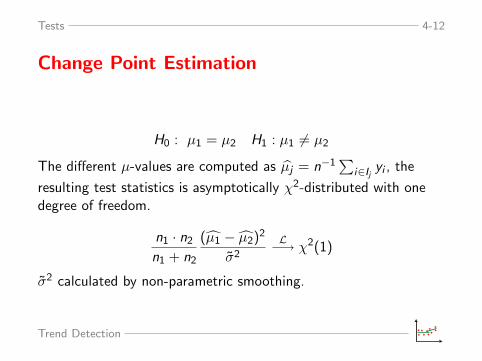
Change Point Estimation
H0 : µ1 = µ2 H1 : µ1 6= µ2
The different µ-values are computed as µj = n−1∑
i∈Ijyi , the
resulting test statistics is asymptotically χ2-distributed with onedegree of freedom.
n1 · n2
n1 + n2
(µ1 − µ2)2
σ2
L−→ χ2(1)
σ2 calculated by non-parametric smoothing.
Trend Detection
Tests 4-13
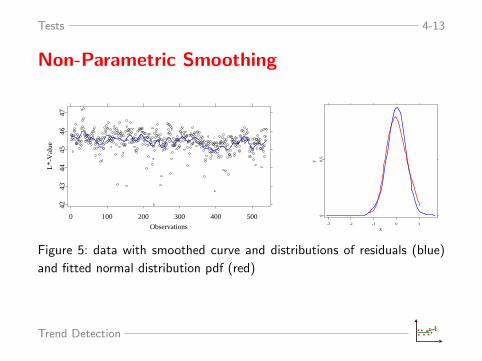
Non-Parametric Smoothing
0 100 200 300 400 500
Observations
4243
4445
4647
L*-
Val
ue
-3 -2 -1 0 1
X
00.
5
Y
Figure 5: data with smoothed curve and distributions of residuals (blue)
and fitted normal distribution pdf (red)
Trend Detection
Tests 4-14
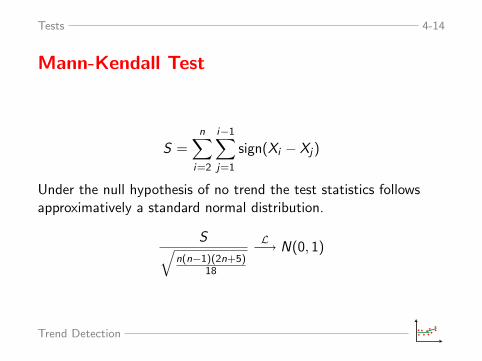
Mann-Kendall Test
S =n∑
i=2
i−1∑j=1
sign(Xi − Xj)
Under the null hypothesis of no trend the test statistics followsapproximatively a standard normal distribution.
S√n(n−1)(2n+5)
18
L−→ N(0, 1)
Trend Detection
Tests 4-15
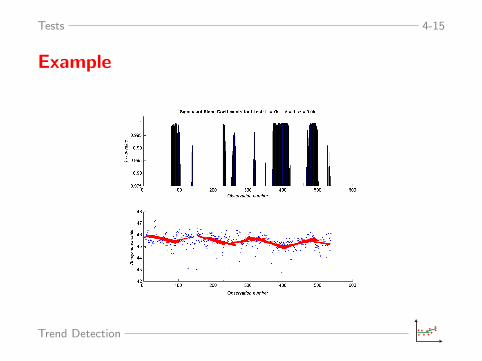
Example
Trend Detection
Tests 4-16
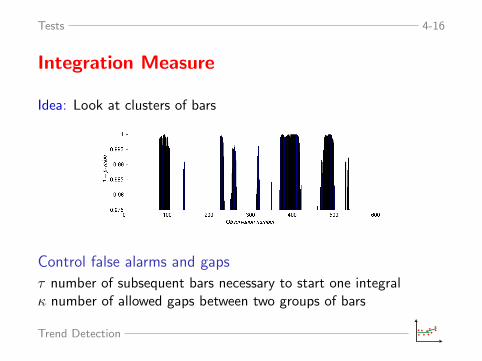
Integration Measure
Idea: Look at clusters of bars
Tests 4-13
Example
Color Harmonization
Control false alarms and gaps
τ number of subsequent bars necessary to start one integralκ number of allowed gaps between two groups of bars
Trend Detection
Tests 4-17
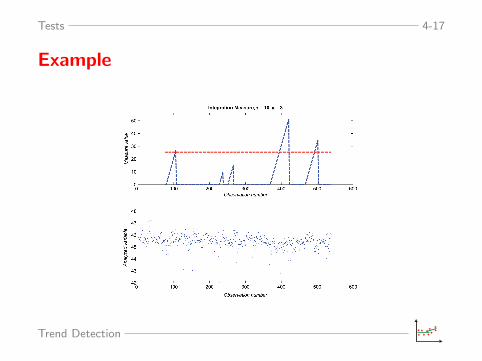
Example
Trend Detection
Tests 4-18
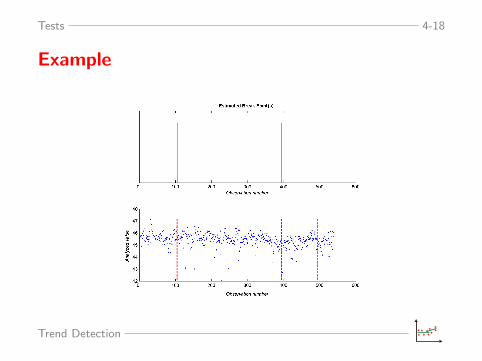
Example
Trend Detection
Simulation 5-19
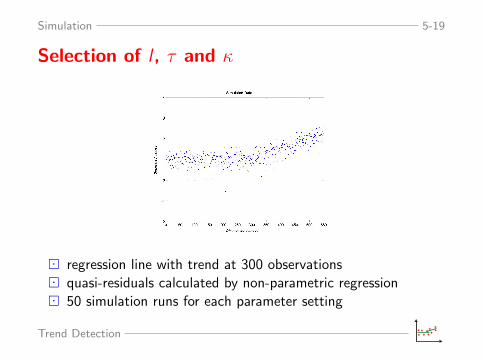
Selection of l , τ and κ
� regression line with trend at 300 observations
� quasi-residuals calculated by non-parametric regression
� 50 simulation runs for each parameter setting
Trend Detection
6-20
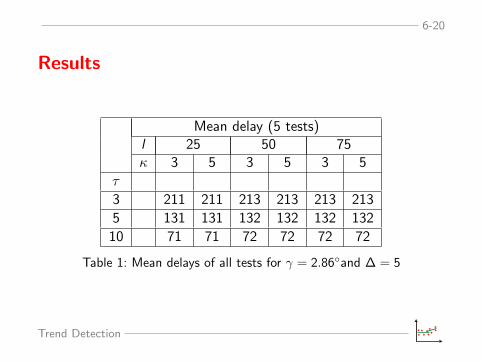
Results
Mean delay (5 tests)l 25 50 75κ 3 5 3 5 3 5
τ
3 211 211 213 213 213 213
5 131 131 132 132 132 132
10 71 71 72 72 72 72
Table 1: Mean delays of all tests for γ = 2.86◦and ∆ = 5
Trend Detection
6-21
Conclusion
� choice of l , κ and τ
� comparison of tests:local t-test outperforms Mann-Kendallchange point estimation performs well
� threshold value to be adjusted by further analysis
Thank You for listening!
Trend Detection