Embed Size (px)
Citation preview
TREE FARM LICENCE 33 CHANGE MONITORING INVENTORY PROGRAM
ANALYSIS OF
FIRST MEASUREMENT DATA
Prepared for:
Jeff Lipsett, RPF
Federated Co-operatives Limited
Canoe, BC
Prepared by:
Stephanie Ewen, BSF, FIT
Timberline Natural Resource Group Ltd.
Kamloops, BC
Project Number: BC0308121
March 31, 2008

TFL 33 CMI: Analysis of First Measurement Data
EXECUTIVE SUMMARY
Federated Cooperatives Limited (Federated Co-op) implemented a Change Monitoring Inventory (CMI) program on Tree Farm Licence (TFL) 33, as one of several programs designed to improve site productivity and growth and yield estimates for Timber Supply Review (TSR). The objective of the CMI program was to monitor the estimates obtained from the site index adjustment (SIA) project and volumes used in yield curves for Management Plan 9 (MP9).
Forty (40) CMI sample plots were established in the 2005 and 2006 field seasons in post-harvest regenerating (PHR) stands on the TFL across a 600m grid. Data analysis from the first measurement of these 40 plots included comparisons between CMI plot data and MP9 assumptions for merchantable volume, stand age, site index, and leading species.
The analysis results showed no significant differences in yield between MP9 assumptions and plot data. However trends indicated that stands were approximately four years younger, and site index of species sampled in the SIA program were approximately 1.5m higher in the MP9 assumptions, when compared to the plot data. A likely source of these differences originates with the different data collection standards that currently exist between the SIA1 and CMI programs.
Analysis of these data is equivalent to an inventory audit using establishment data and interpretation is limited to a one-time yield comparison. Future analyses of re-measurements will permit comparison of growth between the measurement periods, which will provide a better assessment of management plan assumptions. We recommend that Federated Co-op:
1. Continue with the 5 year CMI re-measurement program;
2. Collect more age measurements in the next 5 year remeasurement period to obtain improved estimates of average stand age;
3. Collect stump height ages to test whether total age predictions are biased; and
4. Standardize site tree selection guidelines between the CMI and SIA programs to improve site index comparisons.
1 BC Ministry of Forests and Range – Site Productivity Working Group. 2007. SIBEC Sampling and Data Standards: Version 5.2. Revised May 2007. p.3
ii

TFL 33 CMI: Analysis of First Measurement Data
iii
TFL 33 CMI: Analysis of First Measurement Data
TABLE OF CONTENTS
1.0 INTRODUCTION ................................................................................................................... 1 1.1 BACKGROUND........................................................................................................................ 1 1.2 REPORT OBJECTIVES.............................................................................................................. 1 1.3 TERMS OF REFERENCE........................................................................................................... 1
2.0 SAMPLE DESIGN .................................................................................................................. 2 2.1 OVERVIEW ............................................................................................................................. 2 2.2 TARGET POPULATION ............................................................................................................ 2 2.3 SAMPLE PLOT LOCATION....................................................................................................... 2 2.4 SAMPLE PLOT DESIGN ........................................................................................................... 3 2.5 FUTURE PLOT ESTABLISHMENT AND RE-MEASUREMENT ..................................................... 3
3.0 DATA MANAGEMENT......................................................................................................... 4 3.1 DATA ENTRY AND ERROR CHECKING ................................................................................... 4 3.2 INVENTORY DATA AND YIELD CURVES ................................................................................ 4 3.3 UTILIZATION STANDARDS ..................................................................................................... 4
4.0 ANALYSIS AND RESULTS.................................................................................................. 5 4.1 OVERVIEW ............................................................................................................................. 5 4.2 COMPARISON OF MEASURED AND INVENTORY ATTRIBUTES................................................ 5 4.3 NET MERCHANTABLE VOLUME............................................................................................. 6 4.4 SITE INDEX............................................................................................................................. 7 4.5 SPECIES COMPOSITION........................................................................................................... 9 4.6 AGE...................................................................................................................................... 10
5.0 DISCUSSION......................................................................................................................... 12 5.1 INTERPRETATION OF RESULTS............................................................................................. 12
6.0 RECOMMENDATIONS ...................................................................................................... 14 6.1 INTERPRETATION OF RESULTS............................................................................................. 14
7.0 APPENDIX I - CMI SAMPLE PLOT SUMMARIES ....................................................... 15
iv
TFL 33 CMI: Analysis of First Measurement Data
LIST OF TABLES
Table 1: Attributes compared between the inventory and the CMI sample plots........................... 5
LIST OF FIGURESFigure 1: CMI sample plot design ................................................................................................... 3 Figure 2: Volume difference by field age and inventory leading species. ...................................... 6 Figure 3: SI difference by field age and inventory leading species................................................ 7 Figure 4: Average SI comparisons for the three target species from the SIA program.................. 8 Figure 5: Age difference by field age and inventory leading species............................................ 10 Figure 6: Tree-level age differences in years. ............................................................................... 11
v
TFL 33 CMI: Analysis of First Measurement Data
1.0 INTRODUCTION
1.1 Background
In his 2000 Annual Allowable Cut (AAC) Determination2, the Provincial Chief Forester recommended improvements to the growth and yield (G&Y) information on Federated Cooperatives Limited's (Federated Co-op) Tree Farm License (TFL) 33. As a result of this recommendation, Federated Co-op developed a predictive ecosystem map (PEM), a site index adjustment (SIA)3 project, and updated the yield tables for the TFL based on the new site indices4 for inclusion in Management Plan 9 (MP9). Due to the uncertainty associated with any site productivity or G&Y estimate, monitoring programs are implemented to establish and maintain confidence in those estimates. Federated Co-op subsequently initiated a Change Monitoring Inventory (CMI) program on TFL 33 in 2005.
1.2 Report Objectives
The overall goal of the first measurement in a CMI program is to audit key G&Y attributes including volume, site index (SI), stand density, age, and species composition in regenerated stands. The specific objective of this report is to compare the results of Federated Co-op's CMI field data with attributes used for development of managed stand yield tables (MSYTs) in MP9.
1.3 Terms of Reference
Timberline Natural Resource Group (Timberline) completed this project for Jeff Lipsett, RPF of Federated Co-op. René de Jong, RPF was the project manager, Guillaume Thérien, PhD and Eleanor McWilliams, MSc, RPF provided technical support, and Stephanie Ewen, BSF, FIT completed the data analysis.
2 Ministry of Forests and Range (previously Ministry of Forests) – Rationale for Annual Allowable Cut (AAC) Determination for TFL 33, December 21, 2000. http://www.for.gov.bc.ca/hts/tfl/tfl33/tsr2/rationale.pdf3 J.S. Thrower & Associates Ltd. 2003. Improved Site Index for PHR Stands on TFL 33. Report prepared for Jeff Lipsett, Federated Co-op, October 7, 2003. Project # FCC-003. 4 J.S. Thrower & Associates Ltd. 2005. Natural and Managed Stand Yield Tables for Tree Farm License 33 Management Plan 9. Report prepared for Jeff Lipsett, Federated Co-op, March 31, 2005. Project # FCC-004.
1
TFL 33 CMI: Analysis of First Measurement Data
2.0 SAMPLE DESIGN
2.1 Overview
The key features of the sample design described in this section are:
1. Sample points are located on a 600m grid based on NAD 83 UTM coordinates.
2. Plots are established at these sample grid points and located in post-harvest regenerating (PHR) stands older than 14 years of age since harvest (in 2005; year of sample plan).
3. Plots are 11.28m radius (400m2) circular plots as per the Ministry of Forests and Range (MoFR) CMI standards.5
4. Plot re-measurement and installation of new plots will be done on a 5-year interval.
2.2 Target Population
The CMI target population6 is all PHR stands in the productive forest land base (PFLB) between 15 and 39 years total age (approximately 30% of the PFLB) in 2005.7 The harvest history shows the oldest PHR stands are approximately 39 years of age. A minimum of approximately 15 years total age ensures that most plots will contain some merchantable volume.
2.3 Sample Plot Location
The CMI sample plots were located in the target population on a 600m grid based on NAD 83 UTM coordinates (evenly divisible by 600). The advantage of locating plots on a grid instead of randomly is the convenience of locating sample points in the future. Statistical properties of the systematic samples and differences from random samples are known and can be addressed in future data analyses and reporting. Any sample point located on a permanent road was dropped from the sample through an office review of ortho photos at the sample point locations.8
5 Ministry of Agriculture and Land (previously Sustainable Resource Management (MSRM)) - National Forest Inventory BC Change Monitoring Procedures for Provincial and National Reporting ver. 1.4 March 2005. http://ilmbwww.gov.bc.ca/risc/pubs/teveg/nficmp05/nfi_cmp_2k5.pdf6 When defining the target population and subsequently sample selection, we excluded areas covered by permanent access roads. The target population therefore, includes a 2% aspatial area netdown to approximate all current roads. This amount is consistent with what was applied in the latest TSR2 analysis. 7 This is the reference year for land base summaries which were completed for the sample plan in 2005. 8 Plots 16, 17, 28 and 34 were dropped from the initial sample of 44 plots as a result.
2
TFL 33 CMI: Analysis of First Measurement Data
2.4 Sample Plot Design
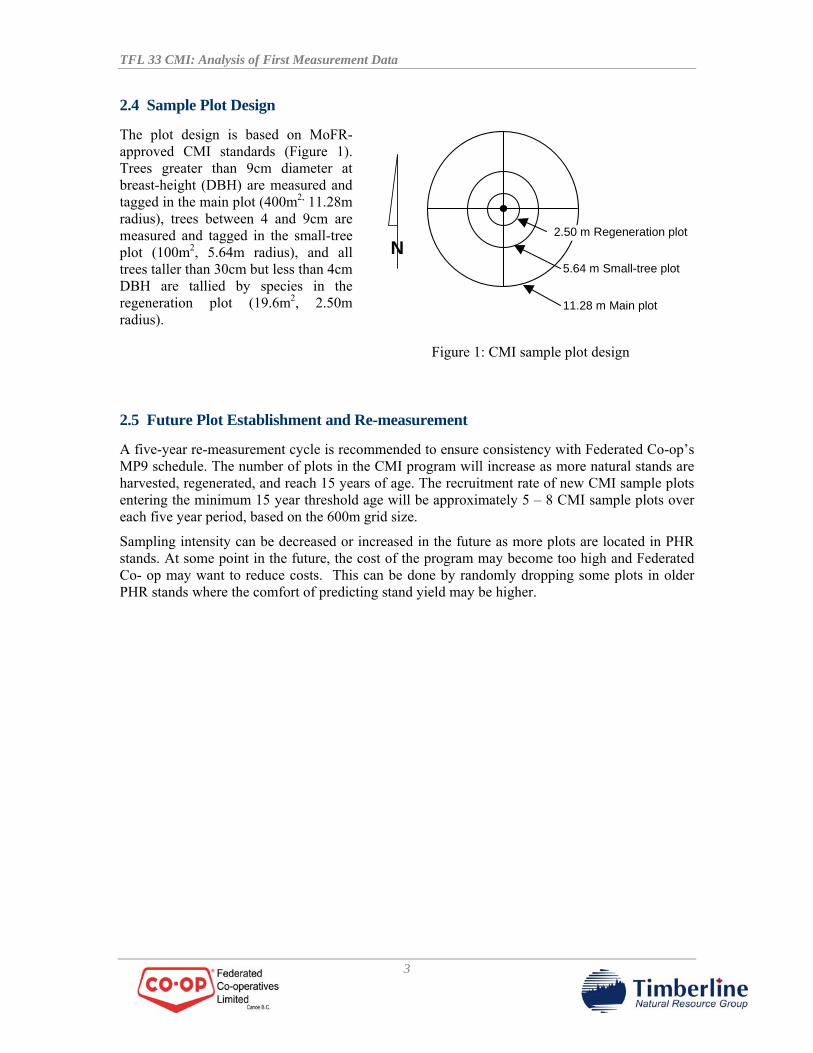
The plot design is based on MoFR-approved CMI standards (Figure 1). Trees greater than 9cm diameter at breast-height (DBH) are measured and tagged in the main plot (400m2, 11.28m radius), trees between 4 and 9cm are measured and tagged in the small-tree plot (100m2, 5.64m radius), and all trees taller than 30cm but less than 4cm DBH are tallied by species in the regeneration plot (19.6m2, 2.50m radius).
N
11.28 m Main plot
2.50 m Regeneration plot
5.64 m Small-tree plot
Figure 1: CMI sample plot design
2.5 Future Plot Establishment and Re-measurement
A five-year re-measurement cycle is recommended to ensure consistency with Federated Co-op’s MP9 schedule. The number of plots in the CMI program will increase as more natural stands are harvested, regenerated, and reach 15 years of age. The recruitment rate of new CMI sample plots entering the minimum 15 year threshold age will be approximately 5 – 8 CMI sample plots over each five year period, based on the 600m grid size.
Sampling intensity can be decreased or increased in the future as more plots are located in PHR stands. At some point in the future, the cost of the program may become too high and Federated Co- op may want to reduce costs. This can be done by randomly dropping some plots in older PHR stands where the comfort of predicting stand yield may be higher.
3
TFL 33 CMI: Analysis of First Measurement Data
3.0 DATA MANAGEMENT
3.1 Data Entry and Error Checking
Field data were entered using the MoFR program TIMVEG (updated to December 19, 2006). All data were compiled by Timberline Natural Resource Group Ltd. (Timberline)9 using the Vegetation Resources Inventory (VRI) / CMI compiler developed by the MoFR (updated to June 27, 2002).
3.2 Inventory Data and Yield Curves
Natural (NSYT) and managed (MSYT) stand yield tables were developed by Timberline in 2005 for each stand in the TFL. The yield tables were created using TIPSY for existing managed stands (up to 38 years old) and VDYP 6.6d for existing natural stands (older than 38 years in 2005). The yield table inputs and resulting volumes were the attributes used for comparison in this analysis. For the target population where the 40 CMI plots were established, the MP-based yield tables were all MSYTs.
3.3 Utilization Standards
The yield curves were developed using a minimum DBH of 12.5cm DBH for lodgepole pine (Pl) and 17.5cm for all other conifer species. Plot data were compiled using the same utilization standards. Net merchantable volume was based on reductions from whole stem volume10 which included 10cm top diameter, 30cm stump height, and applicable decay and waste loss factors.11 Site index calculations were based on the MoFR’s most recent version of Site Tools.12
9 J.S. Thrower and Associates Ltd were acquired by Timberline Natural Resource Group Ltd. in June 2006. 10 Whole stem volumes computed in MoFR’s VRI / CMI compiler use Kozak’s 1994 BGC zone-based volume taper equations. 11 MoFR loss factors for TFL 33 are based on those developed for Public Sustained Yield Unit (PSYU) 305. 12 The VRI / CMI compiler currently uses the Site Tools library ‘SINDEX33.DLL’ updated to 14-Sep-2004.
4
TFL 33 CMI: Analysis of First Measurement Data
4.0 ANALYSIS AND RESULTS
4.1 Overview
The 40 sampled plots represent an unbiased sample of the PHR stands within the inventory aged 15 to 39 in 2005 (year of sample plan). The first measurement data can be used to audit predicted values (projected yields and inventory attributes) from MP9.
4.2 Comparison of Measured and Inventory Attributes
Sample plot and predicted values were determined for merchantable volume, age, SI, and species composition. For volume, the plot estimate of merchantable volume per ha was compared to the yield table predicted volume at the adjusted inventory age (i.e., the volume assumed to be present in the plot). For SI and age, values were compared for each inventory-leading species with potential SI (PSI) estimates from the SIA program.
Table 1: Attributes compared between the inventory and the CMI sample plots.
Attribute Plot Predicted
Net Merchantable Volume
Total net volume less decay, waste and breakage (“vht_nwb”) was compiled for each plot in the SAS TimVeg compiler.
MSYT volume assigned to the stand for MP 9; input age used was the adjusted inventory age.
Site index Average site index by species based on the site tree data collected in each plot.
PSI from the 2003 SIA project were used in the development of MP9 MSYTs.
Age Average age of the site trees by species (“field age”). The total age is derived from breast-height age and total height in the compiler.
Yield table modelled ages corrected to the year of plot establishment (“adjusted inventory age”).
Species Composition
Plot leading species based on basal area for trees ≥ 1.3m in height
Species proportions from the regeneration assumptions used in development of the MP9 MSYTs.
Differences between plot (observed) and predicted values were calculated as:
Difference = observed – predicted
The average difference across all plots, or a subset of plots, is referred to as bias. A positive bias indicates predicted values underestimate the observed value in the CMI sample plots, and a negative bias indicates predicted values overestimate the values in the CMI sample plots. Scatter plots showing the attribute differences by field age are presented for each attribute, except leading species. A comparison of plot and predicted leading species was tabulated for species composition. Bias was quantified using paired t-tests with a 95% confidence interval.
5
TFL 33 CMI: Analysis of First Measurement Data
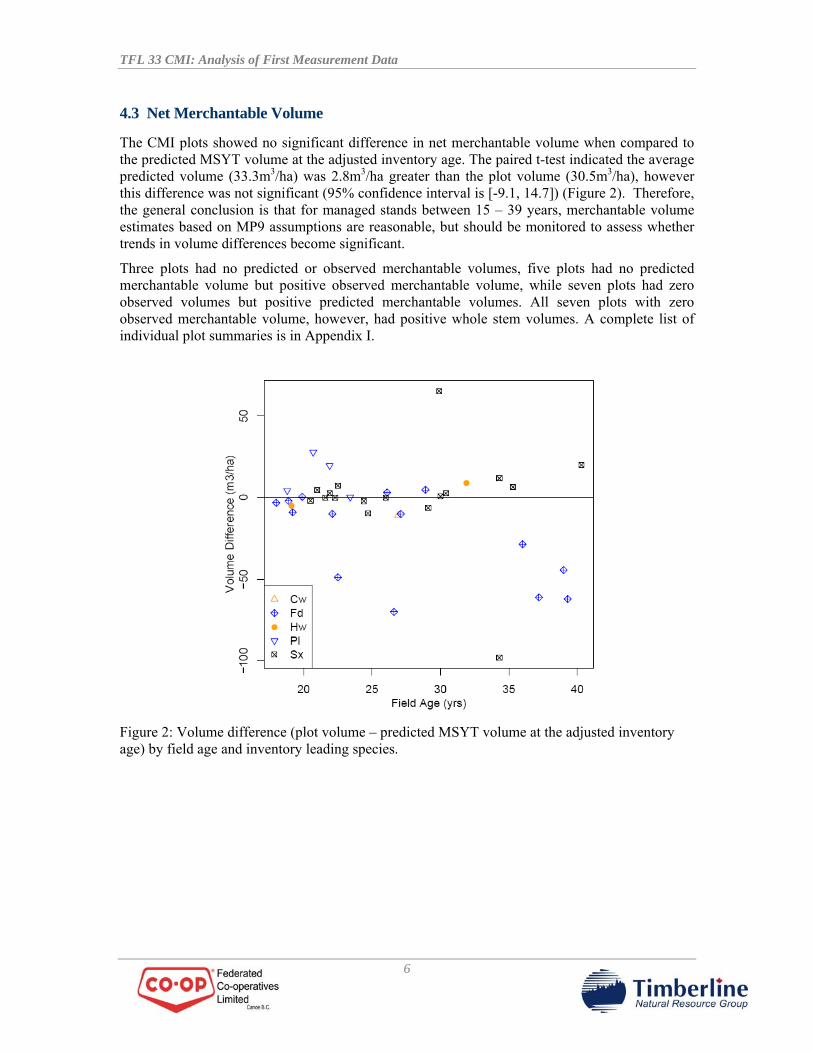
4.3 Net Merchantable Volume
The CMI plots showed no significant difference in net merchantable volume when compared to the predicted MSYT volume at the adjusted inventory age. The paired t-test indicated the average predicted volume (33.3m3/ha) was 2.8m3/ha greater than the plot volume (30.5m3/ha), however this difference was not significant (95% confidence interval is [-9.1, 14.7]) (Figure 2). Therefore, the general conclusion is that for managed stands between 15 – 39 years, merchantable volume estimates based on MP9 assumptions are reasonable, but should be monitored to assess whether trends in volume differences become significant.
Three plots had no predicted or observed merchantable volumes, five plots had no predicted merchantable volume but positive observed merchantable volume, while seven plots had zero observed volumes but positive predicted merchantable volumes. All seven plots with zero observed merchantable volume, however, had positive whole stem volumes. A complete list of individual plot summaries is in Appendix I.
Figure 2: Volume difference (plot volume – predicted MSYT volume at the adjusted inventory age) by field age and inventory leading species.
6
TFL 33 CMI: Analysis of First Measurement Data
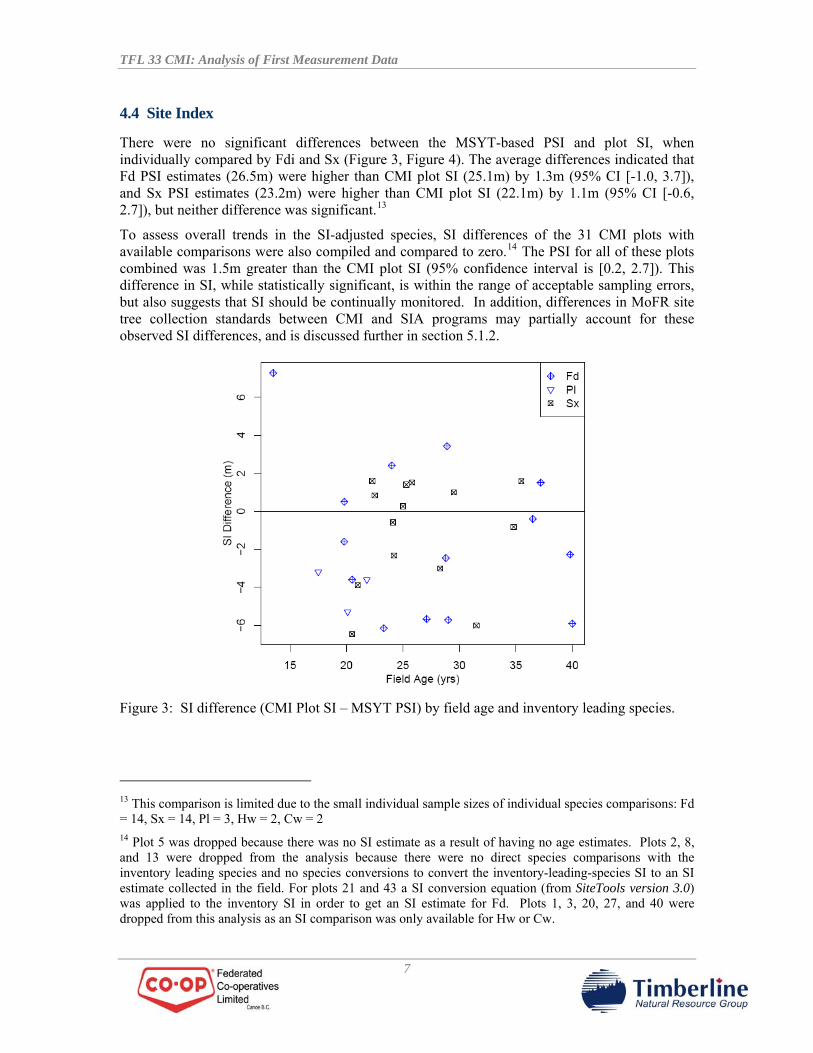
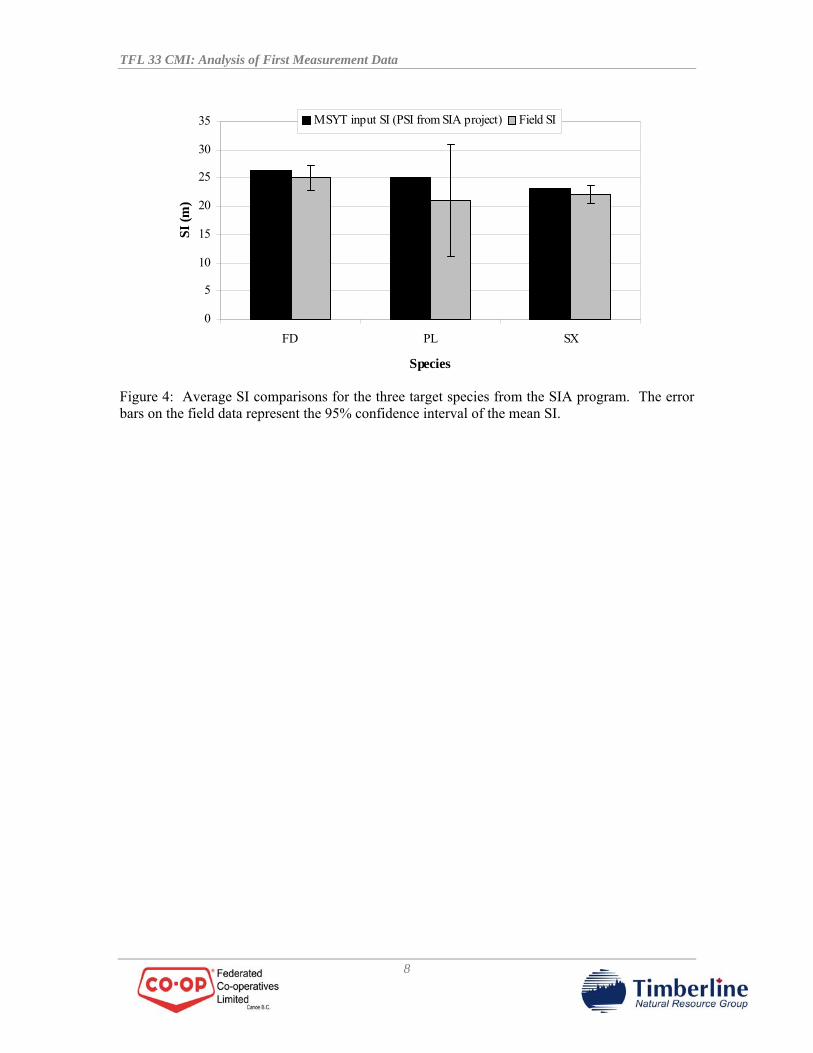
4.4 Site Index
There were no significant differences between the MSYT-based PSI and plot SI, when individually compared by Fdi and Sx (Figure 3, Figure 4). The average differences indicated that Fd PSI estimates (26.5m) were higher than CMI plot SI (25.1m) by 1.3m (95% CI [-1.0, 3.7]), and Sx PSI estimates (23.2m) were higher than CMI plot SI (22.1m) by 1.1m (95% CI [-0.6, 2.7]), but neither difference was significant.13
To assess overall trends in the SI-adjusted species, SI differences of the 31 CMI plots with available comparisons were also compiled and compared to zero.14 The PSI for all of these plots combined was 1.5m greater than the CMI plot SI (95% confidence interval is [0.2, 2.7]). This difference in SI, while statistically significant, is within the range of acceptable sampling errors, but also suggests that SI should be continually monitored. In addition, differences in MoFR site tree collection standards between CMI and SIA programs may partially account for these observed SI differences, and is discussed further in section 5.1.2.
Figure 3: SI difference (CMI Plot SI – MSYT PSI) by field age and inventory leading species.
13 This comparison is limited due to the small individual sample sizes of individual species comparisons: Fd = 14, Sx = 14, Pl = 3, Hw = 2, Cw = 2 14 Plot 5 was dropped because there was no SI estimate as a result of having no age estimates. Plots 2, 8, and 13 were dropped from the analysis because there were no direct species comparisons with the inventory leading species and no species conversions to convert the inventory-leading-species SI to an SI estimate collected in the field. For plots 21 and 43 a SI conversion equation (from SiteTools version 3.0) was applied to the inventory SI in order to get an SI estimate for Fd. Plots 1, 3, 20, 27, and 40 were dropped from this analysis as an SI comparison was only available for Hw or Cw.
7
TFL 33 CMI: Analysis of First Measurement Data
0
5
10
15
20
25
30
35
FD PL SX
Species
SI (m
)
MSYT input SI (PSI from SIA project) Field SI
Figure 4: Average SI comparisons for the three target species from the SIA program. The error bars on the field data represent the 95% confidence interval of the mean SI.
8
TFL 33 CMI: Analysis of First Measurement Data
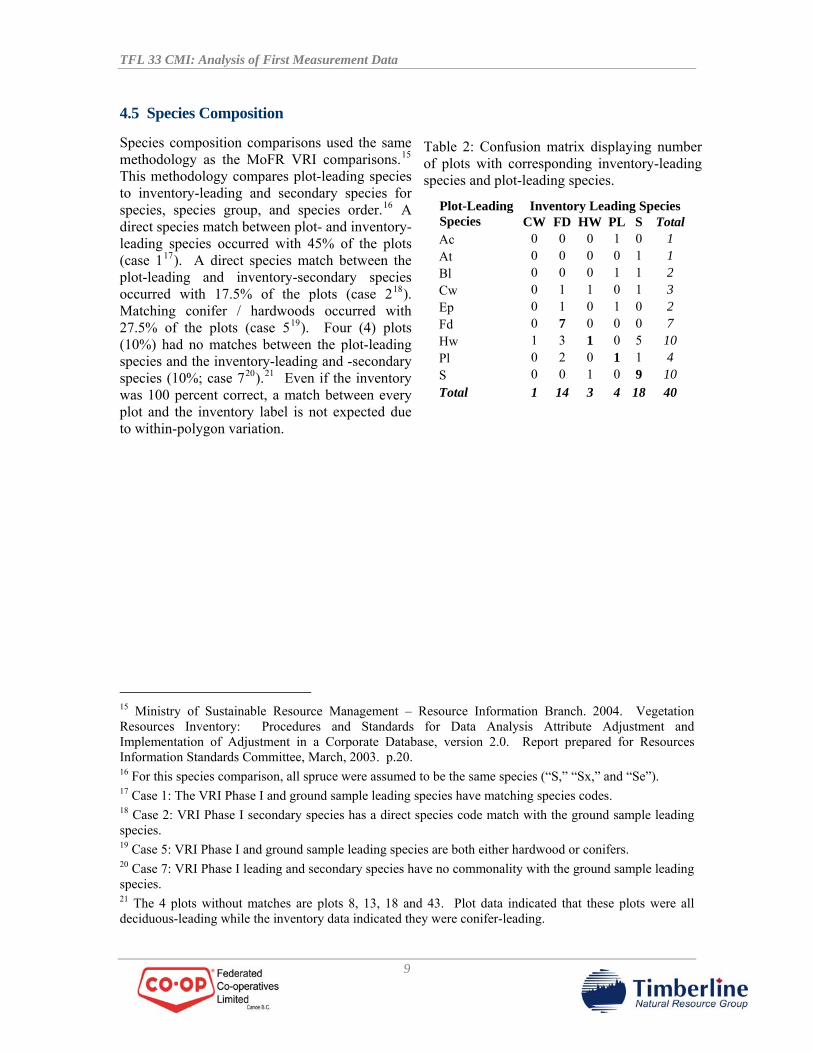
4.5 Species Composition
Species composition comparisons used the same methodology as the MoFR VRI comparisons.15 This methodology compares plot-leading species to inventory-leading and secondary species for species, species group, and species order.16 A direct species match between plot- and inventory-leading species occurred with 45% of the plots (case 117). A direct species match between the plot-leading and inventory-secondary species occurred with 17.5% of the plots (case 218). Matching conifer / hardwoods occurred with 27.5% of the plots (case 519). Four (4) plots (10%) had no matches between the plot-leading species and the inventory-leading and -secondary species (10%; case 720).21 Even if the inventory was 100 percent correct, a match between every plot and the inventory label is not expected due to within-polygon variation.
Table 2: Confusion matrix displaying number of plots with corresponding inventory-leading species and plot-leading species.
9
15 Ministry of Sustainable Resource Management – Resource Information Branch. 2004. Vegetation Resources Inventory: Procedures and Standards for Data Analysis Attribute Adjustment and Implementation of Adjustment in a Corporate Database, version 2.0. Report prepared for Resources Information Standards Committee, March, 2003. p.20. 16 For this species comparison, all spruce were assumed to be the same species (“S,” “Sx,” and “Se”). 17 Case 1: The VRI Phase I and ground sample leading species have matching species codes. 18 Case 2: VRI Phase I secondary species has a direct species code match with the ground sample leading species. 19 Case 5: VRI Phase I and ground sample leading species are both either hardwood or conifers. 20 Case 7: VRI Phase I leading and secondary species have no commonality with the ground sample leading species. 21 The 4 plots without matches are plots 8, 13, 18 and 43. Plot data indicated that these plots were all deciduous-leading while the inventory data indicated they were conifer-leading.
Inventory Leading Species Plot-Leading Species TotalCW FD HW PL S
1 0 0 0 1 0 Ac 1 0 0 0 0 1 At 2 0 0 0 1 1 Bl 3 0 1 1 0 1 Cw 2 0 1 0 1 0 Ep 7 7 0 0 0 0 Fd
10 Hw 1 3 1 0 5 4 Pl 0 2 0 1 1
10 S 0 0 1 0 9 Total 1 14 3 4 18 40
TFL 33 CMI: Analysis of First Measurement Data
4.6 Age
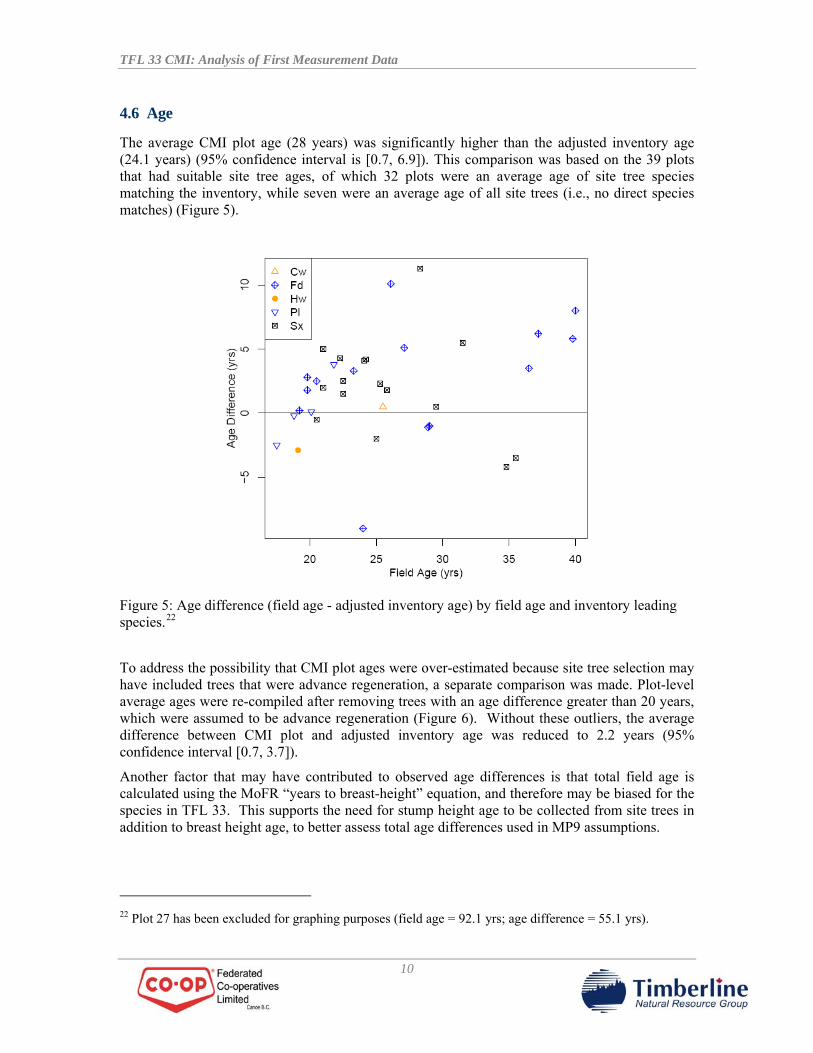
The average CMI plot age (28 years) was significantly higher than the adjusted inventory age (24.1 years) (95% confidence interval is [0.7, 6.9]). This comparison was based on the 39 plots that had suitable site tree ages, of which 32 plots were an average age of site tree species matching the inventory, while seven were an average age of all site trees (i.e., no direct species matches) (Figure 5).
Figure 5: Age difference (field age - adjusted inventory age) by field age and inventory leading species.22
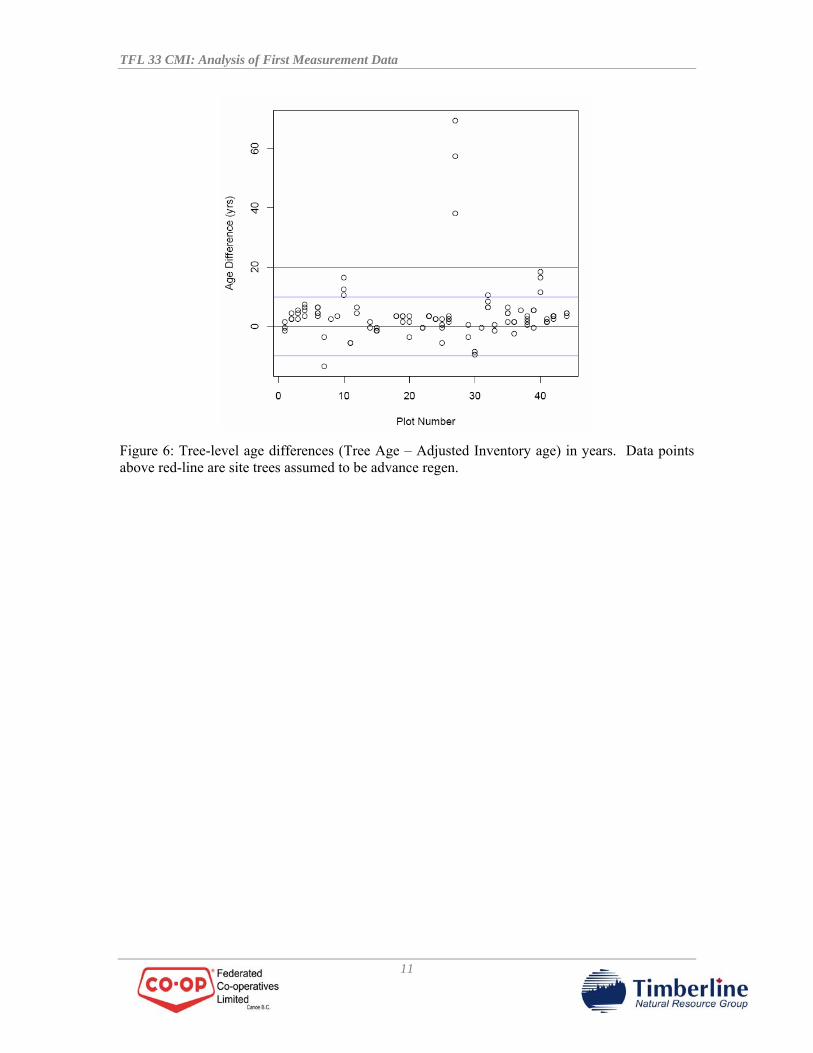
To address the possibility that CMI plot ages were over-estimated because site tree selection may have included trees that were advance regeneration, a separate comparison was made. Plot-level average ages were re-compiled after removing trees with an age difference greater than 20 years, which were assumed to be advance regeneration (Figure 6). Without these outliers, the average difference between CMI plot and adjusted inventory age was reduced to 2.2 years (95% confidence interval [0.7, 3.7]).
Another factor that may have contributed to observed age differences is that total field age is calculated using the MoFR “years to breast-height” equation, and therefore may be biased for the species in TFL 33. This supports the need for stump height age to be collected from site trees in addition to breast height age, to better assess total age differences used in MP9 assumptions.
22 Plot 27 has been excluded for graphing purposes (field age = 92.1 yrs; age difference = 55.1 yrs).
10
TFL 33 CMI: Analysis of First Measurement Data
Figure 6: Tree-level age differences (Tree Age – Adjusted Inventory age) in years. Data points above red-line are site trees assumed to be advance regen.
11
TFL 33 CMI: Analysis of First Measurement Data
5.0 DISCUSSION
5.1 Interpretation of Results 5.1.1 The volume analysis provides confidence in the volumes used in MP9 Overall, the CMI volumes were similar and not significantly different from those used in MP9. This provides confidence that the volumes predicted in MP9 are reasonable. First measurement of CMI plots is limited to an inventory audit of volume, so it is not possible to make conclusions about the accuracy of the yield curves due to lack of growth data within the plots. 5.1.2 Site tree sampling differences may be contributing to the SI differences The process of identifying a suitable site tree in the CMI program is not as rigid as the same process used in the SIA program (which originates from MoFR SIBEC standards). SIBEC standards require that an acceptable site tree exhibit less than 5% height loss from damage23, whereas the CMI process states that trees are unsuitable if there is “significant” height loss compared to what it would be if undamaged.24 This may have resulted in different site trees being selected depending on the standard used.
Also, MoFR standards for determining age are much more lenient in CMI than in SIA. CMI site trees are unacceptable if they are residuals25, whereas SIA site trees in are not age-acceptable if there is any suppression above breast-height.23 Therefore, it is possible that CMI site trees may include suppression and still be acceptable.
Overall, trees may have been accepted as “site trees” in the CMI program that would have been unsuitable for height or age in an SIA program; Thus, leading to a “lower” overall SI in the CMI data than in the SIA data. 5.1.3 Age discrepancies may be attributed to several confounding factors Plot ages were found to be statistically higher (α = 0.05) than the projected inventory ages by approximately 3.8 years. However, in this analysis the total tree age is derived in the CMI/VRI compiler as a function of the height-age relationship. If the age-to-breast-height is biased in these curves, the total plot age will be biased, thus the age difference will reflect this bias as opposed to the actual age difference.
Also, as mentioned in Section 5.1.2, the only reason to reject a CMI site tree based on age is if it is a residual. In this case, trees that are advanced regeneration are not classified as residuals, and
23 BC Ministry of Forests and Range – Site Productivity Working Group. 2007. SIBEC Sampling and Data Standards: Version 5.2. Revised May 2007. p.3. 24 Ministry of Sustainable Resource Management – Resource Information Branch. 2005. National Forest Inventory – BC: Change Monitoring Procedures for Provincial and National Reporting, version 1.4. Report prepared for Resources Information Standards Committee, March, 2005. p.60. 25 Residual: present in an even-aged stand, living remnant of a former stand, and occur as the occasional (< 25 per ha) large stem of an older age class than the stand as a whole.
12

TFL 33 CMI: Analysis of First Measurement Data
can be sampled as suitable for age. These ages are not congruent with the “stand age” as they were established before the rest of the stand. Also, advanced regeneration has a high likelihood of being sampled as they have more years contributing to diameter growth than the rest of the stand, and therefore would likely be the “largest diameter trees” in the plots. 5.1.4 Overall, adjustments may need to be made to the CMI program to get the desired answers from stands in the ICH The majority of TFL 33 falls in very diverse, rich stands in the Interior-Cedar-Hemlock (ICH) Biogeoclimatic Zone. Most CMI projects to date have been completed in the pine and spruce dominated Biogeoclimatic Zones found in the BC interior. The species and age diversity found in the ICH may lead to assumed “errors” in predicted values when sampled using a framework designed for single-species, even-aged stands. Multi-species, multi-age stands have many more complex interactions occurring on the site that have the potential to negatively impact the site index and/or age observed in any one tree. Overall, the CMI program is appropriate for comparing observed and predicted volumes, as all trees are measured for volume in these stands. However, the standards may have to be adjusted to gain meaningful comparisons for age and site index of the stands being sampled.
13
TFL 33 CMI: Analysis of First Measurement Data
6.0 RECOMMENDATIONS
6.1 Interpretation of Results 6.1.1 Continue with the CMI re-measurement program The plots should be re-measured five years after establishment to ensure that the growth trends observed are consistent with those assumed in timber supply analyses. Future re-measurement and analysis of the data will provide continued assurance that the managed stands are performing as expected, or allow for changes to be made if they are not. Multiple plot measurements allow for a check of growth projections, as opposed to just yield estimates. This allows the shape of the yield curves to be tested. 6.1.2 Collect more age measurements at each plot Age is a difficult characteristic to compare when comparing plot or individual tree values to a stand attribute, especially in multi-age, multi-species stands with a lot of natural ingress. By boring more trees per plot, more of the within stand variation can be captured, providing a plot-level estimate that is more reflective of the stand age. 6.1.3 Investigate the assumptions behind total age, and whether they are reasonable within TFL 33 In order to determine if there is bias in the age-to-breast-height equations, stump-height ages could be collected in the second-round of measurements to test whether the model assumptions are appropriate. 6.1.4 Create a more stringent standard for site trees in the second-measurement Site index comparisons in TFL 33 are made between SI predictions resulting from the SIA program and tree-level SI estimates for site trees sampled in the CMI program. If the methods for collecting data are not standardized across the two programs, then it can be expected that the two results will be different. In order to have an SI estimate from the CMI sample plots to compare to the predicted SI for the stand, the same sampling criteria should be applied to the site trees sampled in the CMI plots as the site trees sampled in the SIA program.
14
TFL 33 CMI: Analysis of First Measurement Data
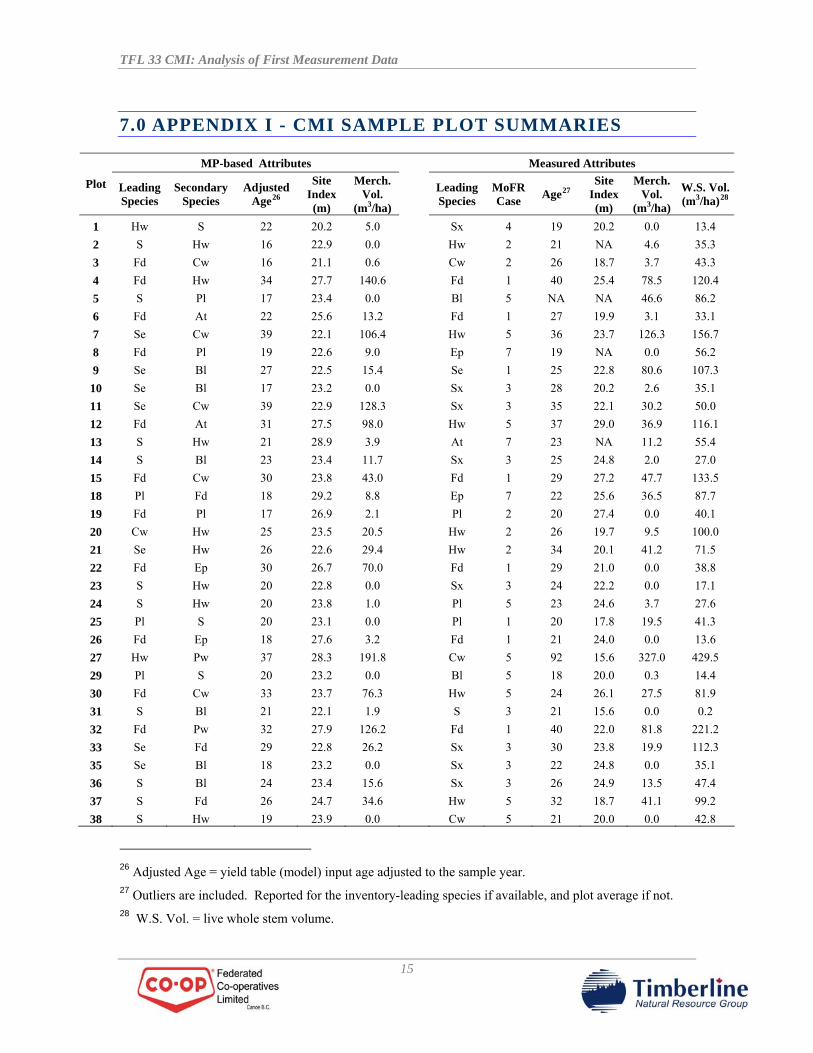
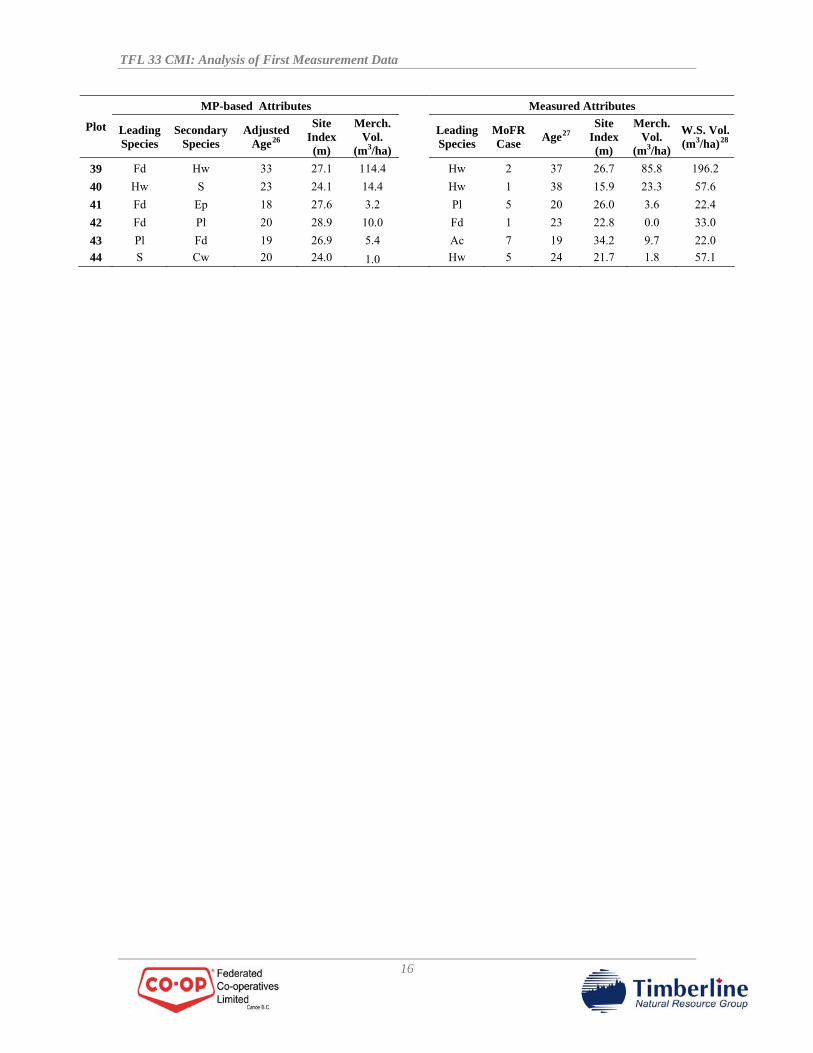
7.0 APPENDIX I - CMI SAMPLE PLOT SUMMARIES
MP-based Attributes Measured Attributes Site
Index (m)
Merch. Vol.
(m3/ha) Leading
Species MoFR Case Age27
Site Index (m)
Merch. Vol.
(m3/ha)
Plot Leading Species
Secondary Species
Adjusted Age26
W.S. Vol. (m3/ha)28
1 Hw S 22 20.2 5.0 Sx 4 19 20.2 0.0 13.4 2 S Hw 16 22.9 0.0 Hw 2 21 NA 4.6 35.3 3 Fd Cw 16 21.1 0.6 Cw 2 26 18.7 3.7 43.3 4 Fd Hw 34 27.7 140.6 Fd 1 40 25.4 78.5 120.4 5 S Pl 17 23.4 0.0 Bl 5 NA NA 46.6 86.2 6 Fd At 22 25.6 13.2 Fd 1 27 19.9 3.1 33.1 7 Se Cw 39 22.1 106.4 Hw 5 36 23.7 126.3 156.7 8 Fd Pl 19 22.6 9.0 Ep 7 19 NA 0.0 56.2 9 Se Bl 27 22.5 15.4 Se 1 25 22.8 80.6 107.3 10 Se Bl 17 23.2 0.0 Sx 3 28 20.2 2.6 35.1 11 Se Cw 39 22.9 128.3 Sx 3 35 22.1 30.2 50.0 12 Fd At 31 27.5 98.0 Hw 5 37 29.0 36.9 116.1 13 S Hw 21 28.9 3.9 At 7 23 NA 11.2 55.4 14 S Bl 23 23.4 11.7 Sx 3 25 24.8 2.0 27.0 15 Fd Cw 30 23.8 43.0 Fd 1 29 27.2 47.7 133.5 18 Pl Fd 18 29.2 8.8 Ep 7 22 25.6 36.5 87.7 19 Fd Pl 17 26.9 2.1 Pl 2 20 27.4 0.0 40.1 20 Cw Hw 25 23.5 20.5 Hw 2 26 19.7 9.5 100.0 21 Se Hw 26 22.6 29.4 Hw 2 34 20.1 41.2 71.5 22 Fd Ep 30 26.7 70.0 Fd 1 29 21.0 0.0 38.8 23 S Hw 20 22.8 0.0 Sx 3 24 22.2 0.0 17.1 24 S Hw 20 23.8 1.0 Pl 5 23 24.6 3.7 27.6 25 Pl S 20 23.1 0.0 Pl 1 20 17.8 19.5 41.3 26 Fd Ep 18 27.6 3.2 Fd 1 21 24.0 0.0 13.6 27 Hw Pw 37 28.3 191.8 Cw 5 92 15.6 327.0 429.5 29 Pl S 20 23.2 0.0 Bl 5 18 20.0 0.3 14.4 30 Fd Cw 33 23.7 76.3 Hw 5 24 26.1 27.5 81.9 31 S Bl 21 22.1 1.9 S 3 21 15.6 0.0 0.2 32 Fd Pw 32 27.9 126.2 Fd 1 40 22.0 81.8 221.2 33 Se Fd 29 22.8 26.2 Sx 3 30 23.8 19.9 112.3 35 Se Bl 18 23.2 0.0 Sx 3 22 24.8 0.0 35.1 36 S Bl 24 23.4 15.6 Sx 3 26 24.9 13.5 47.4 37 S Fd 26 24.7 34.6 Hw 5 32 18.7 41.1 99.2 38 S Hw 19 23.9 0.0 Cw 5 21 20.0 0.0 42.8
26 Adjusted Age = yield table (model) input age adjusted to the sample year. 27 Outliers are included. Reported for the inventory-leading species if available, and plot average if not. 28 W.S. Vol. = live whole stem volume.
15
TFL 33 CMI: Analysis of First Measurement Data
MP-based Attributes Measured Attributes Site
Index (m)
Merch. Vol.
(m3/ha) Leading
Species MoFR Case Age27
Site Index (m)
Merch. Vol.
(m3/ha)
Plot Leading Species
Secondary Species
Adjusted Age26
W.S. Vol. (m3/ha)28
39 Fd Hw 33 27.1 114.4 Hw 2 37 26.7 85.8 196.2 40 Hw S 23 24.1 14.4 Hw 1 38 15.9 23.3 57.6 41 Fd Ep 18 27.6 3.2 Pl 5 20 26.0 3.6 22.4 42 Fd Pl 20 28.9 10.0 Fd 1 23 22.8 0.0 33.0 43 Pl Fd 19 26.9 5.4 Ac 7 19 34.2 9.7 22.0 44 S Cw 20 24.0 1.0 Hw 5 24 21.7 1.8 57.1
16