Embed Size (px)
Citation preview
Treatment TechnologiesFor Mercury in Soil,Waste, and Water

Cover: Photograph of a drop of mercury taken by Adam Hartley. Exposure: 1/10 of one millisecond. Used by permission.
August 2007
Treatment Technologies for Mercury in Soil, Waste, and Water
U.S. Environmental Protection Agency Office of Superfund Remediation and Technology Innovation
Washington, DC 20460

This page is intentionally left blank.
TABLE OF CONTENTS
Section Page
ACRONYMS, ABBREVIATIONS, AND SYMBOLS.............................................................................. iii FOREWORD.................................................................................................................................................v NOTICE AND DISCLAIMER ....................................................................................................................vi ACKNOWLEDGMENTS............................................................................................................................vi EXECUTIVE SUMMARY.....................................................................................................................ES-1
PART I OVERVIEW
1.0 BACKGROUND.......................................................................................................................... 1-1
1.1 Introduction and Purpose of Report ................................................................................ 1-1 1.2 Sources of Information for the Report ............................................................................ 1-1 1.3 Methodology Used to Compile Technology-Specific Information................................. 1-2 1.4 Background ..................................................................................................................... 1-2 1.5 Environmental Occurrence.............................................................................................. 1-3 1.6 Chemistry and Behavior.................................................................................................. 1-5 1.7 Regulatory Considerations .............................................................................................. 1-6 1.8 Mercury Removal and Emergency Response ................................................................. 1-8 1.9 Detection and Site Characterization ................................................................................ 1-8
2.0 COMPARISON OF TREATMENT TECHNOLOGIES FOR MERCURY................................ 2-1
2.1 Types of Technologies Used ........................................................................................... 2-1 2.2 Frequency of Technology Use ........................................................................................ 2-2
PART II MERCURY TREATMENT TECHNOLOGY SUMMARIES
PART IIA TREATMENT TECHNOLOGIES APPLICABLE TO SOIL AND WASTE
3.0 SOLIDIFICATION AND STABILIZATION (INCLUDING AMALGAMATION) ................. 3-1
4.0 SOIL WASHING AND ACID EXTRACTION .......................................................................... 4-1
5.0 THERMAL TREATMENT ......................................................................................................... 5-1
6.0 VITRIFICATION......................................................................................................................... 6-1
PART IIB TREATMENT TECHNOLOGIES APPLICABLE TO WATER
7.0 PRECIPITATION/COPRECIPITATION.................................................................................... 7-1
8.0 ADSORPTION TREATMENT ................................................................................................... 8-1
9.0 MEMBRANE FILTRATION ...................................................................................................... 9-1
10.0 BIOLOGICAL TREATMENT .................................................................................................. 10-1
PART III ONGOING RESEARCH ON MERCURY TREATMENT
11.0 ONGOING RESEARCH ON MERCURY TREATMENT....................................................... 11-1
11.1 Nanotechnology ............................................................................................................ 11-1 11.2 Phytoremediation .......................................................................................................... 11-2 11.3 Air Stripping.................................................................................................................. 11-3 11.4 In Situ Thermal Desorption (ISTD)............................................................................... 11-3
i August 2007
TABLES
Table Page
ES-1 Overview of Selected Mercury Treatment Technologies...........................................................ES-4 ES-2 Summary of Technology Use and Availability of Technology Performance Data for Mercury
Treatment ...................................................................................................................................ES-5 1.1 Number of Superfund Sites with Mercury as a Contaminant of Concern by Media Type .......... 1-4 1.2 Number of Superfund Sites with Mercury as a Contaminant of Concern by Site Type .............. 1-4 1.3 Physical and Chemical Properties of Some Mercury Compounds............................................... 1-6 1.4 RCRA Listed Hazardous Wastes for Mercury ............................................................................. 1-7 1.5 Land Disposal Restrictions for Low Mercury Wastes, High Mercury Wastes, and Elemental
Mercury ........................................................................................................................................ 1-7 2.1 Applicability of Mercury Treatment Technologies ...................................................................... 2-5 2.2 Mercury Treatment Technologies Screening Matrix ................................................................... 2-6 2.3 Available Mercury Treatment Cost Data for Various Technologies............................................ 2-8 3.1 Solidification/Stabilization Treatment Performance Data for Mercury ....................................... 3-7 3.2 Available Mercury Treatment Cost Data ................................................................................... 3-10 4.1 Soil Washing and Acid Extraction Performance Data for Mercury............................................. 4-7 4.2 Available Mercury Treatment Cost Data for Soil Washing and Acid Extraction ...................... 4-10 5.1 Thermal Treatment Performance Data for Mercury..................................................................... 5-5 5.2 Available Mercury Treatment Cost Data for Thermal Treatment ................................................ 5-7 6.1 Vitrification Treatment Performance Data for Mercury............................................................... 6-6 6.2 Available Mercury Treatment Cost Data for Vitrification ........................................................... 6-7 7.1 Precipitation/Coprecipitation Treatment Performance Data for Mercury.................................... 7-5 7.2 Available Mercury Treatment Cost Data for Precipitation/Coprecipitation................................. 7-8 8.1 Adsorption Treatment Performance Data for Mercury ................................................................ 8-5 8.2 Available Mercury Treatment Cost Data for Adsorption............................................................. 8-7 10.1 Biological Treatment Performance Data for Mercury................................................................ 10-5
FIGURES
Figure Page
2.1 Technologies Applicable to Treatment of Mercury-Contaminated Media .................................. 2-1 2.2 Number of Identified Applications of Mercury Treatment Technologies for Soil and Waste..... 2-2 2.3 Number of Identified Applications of Mercury Treatment Technologies for Water ................... 2-2 3.1 Model of a Solidification/Stabilization System............................................................................ 3-1 4.1 Model of a Soil Washing System................................................................................................. 4-1 5.1 Model of a Thermal Desorption or Retort System ....................................................................... 5-2 6.1 Model of a Vitrification System................................................................................................... 6-1 6.2 Typical Ex Situ Vitrification System............................................................................................ 6-2 7.1 Model of a Precipitation/Coprecipitation System ........................................................................ 7-1 9.1 Model of a Membrane Filtration System...................................................................................... 9-2 10.1 Model of a Biological Treatment System................................................................................... 10-1
Appendix A
Information on Select Mercury Vapor Detection Instruments
ii August 2007
ACRONYMS, ABBREVIATIONS, AND SYMBOLS
µg/kg Micrograms per kilogram
µg/L Micrograms per liter
µg/m3 Micrograms per cubic meter
µm Micron
APC Air pollution control
APGEN Applied PhytoGenetics, Inc.
ARAR Applicable or relevant and appropriate requirement
BDAT Best demonstrated available technology
BNL Brookhaven National Laboratory
CAA Clean Air Act
CBPC Chemically bonded phosphate ceramics
CERCLA Comprehensive Environmental Response, Compensation, and Liability Act
CERCLIS Comprehensive Environmental Response, Compensation, and Liability Information System
CFM Chemische Fabrik Marktredwitz
CWA Clean Water Act
cm Centimeters
cy Cubic yards
DM Deutsche Mark
DoD Department of Defense
DTC Dithiocarbamate
EPA U.S. Environmental Protection Agency
ERT Emergency Response Team
FATE Field Analytic Technologies Encyclopedia
FRTR Federal Remediation Technologies Roundtable
g/cm3 Grams per cubic centimeter
GFT Glass furnace technology
g/L Grams per liter
gpm Gallons per minute
HEPA High efficiency particulate air
HTTD High-temperature thermal desorption
IA Immunoassay
ISTD In situ thermal desorption
L/min Liters per minute
LANL Las Alamos National Laboratory
LDR Land disposal restrictions
LTTD Low temperature thermal desorption
MACT Maximum achievable control technology
MCL Maximum contaminant level
iii August 2007
ACRONYMS, ABBREVIATIONS, AND SYMBOLS (Continued)
mg/L Milligrams per liter
mg/kg Milligrams per kilogram
mg/m3 Milligrams per cubic meter
NaDTC Sodium dithiocarbamate
ND Non-detect
ng/L Nanograms/liter
NPL National Priorities List
NRMRL National Risk Management Research Laboratory
O&M Operation and maintenance
OU Operable unit
P&T Pump and treat
PAH Polycyclic aromatic hydrocarbon
PCB Polychlorinated biphenyl
PNNL Pacific Northwest National Laboratory
POTW Publicly owned treatment works
ppb Parts per billion
ppm Parts per million
PRG Preliminary remediation goal
psi Pounds per square inch
RCRA Resource Conservation and Recovery Act
RPM Remedial project manager
S/S Solidification/Stabilization
SDWA Safe Drinking Water Act
SITE Superfund Innovative Technology Evaluation
SNAP Superfund NPL Assessment Program
SPC Sulfur polymer cement
SPSS Sulfur Polymer Stabilization/Solidification
SVOC Semivolatile organic compound
TCLP Toxicity Characteristic Leaching Procedure
Thiol-SAMMS Thiol Self-Assembled Monolayers on Mesoporous Silica
TLV Threshold limit value
TOC Total organic carbon
TWA Total Waste Analysis
UV Ultraviolet
VOC Volatile organic compound
WQC Water quality criteria
XRF X-ray fluorescence
iv August 2007
FOREWORD
This report provides a synopsis of the availability, performance, and cost of eight technologies for treatment of mercury in soil, waste, and water. The report also describes research under way on innovative methods to treat mercury contamination. The report’s intended audience includes hazardous waste site managers; those generating or treating mercury-contaminated waste and wastewater; regulators; and the interested public.
There is a need for cost-effective mercury treatment. Historical use of mercury has resulted in soil and groundwater contamination that may require remediation. Mercury contamination is difficult to treat and may pose a risk to human health and the environment. In addition, some industrial wastes and wastewaters currently being produced require treatment to remove or immobilize mercury.
This report is intended to be used as a screening tool for mercury treatment technologies. It describes the theory, design, and operation of the technologies; provides information on commercial availability and use; and includes data on performance and cost, where available. As a technology overview document, the information can serve as a starting point to identify options for mercury treatment. The feasibility of particular technologies will depend heavily on site-specific factors, and final treatment and remedy decisions will require further analysis, expertise, and possibly, treatability studies.
v August 2007
NOTICE AND DISCLAIMER
Preparation of this report has been funded by the U.S. Environmental Protection Agency (EPA) under Contract Number 68-W-02-034. Information in this report is derived from numerous sources (including personal communications with experts in the field). Not all the source documents have been peer-reviewed. This study has undergone EPA and external review by subject-matter experts. Mention of trade names or commercial products does not constitute endorsement or recommendation for use.
A PDF version of Treatment Technologies for Mercury in Soil, Waste, and Water is available for viewing or downloading from the Hazardous Waste Cleanup Information (CLU-IN) system Web site at http://clu-in.org/542R07003. A limited number of printed copies are available free of charge and may be ordered via the Web site, by mail, or by facsimile from:
U.S. EPA/National Service Center for Environmental Publications (NSCEP) P.O. Box 42419 Cincinnati, OH 45242-2419 Telephone: (800) 490-9198 Fax: (301) 604-3408
ACKNOWLEDGMENTS
Special acknowledgement is given to the federal and state staff and other remediation professionals who provided information for this document. Their willingness to share their expertise encourages the successful application of mercury treatment technologies at other sites. Contributors to the report included U.S. EPA Office of Superfund Remediation and Technology Innovation; U.S. EPA Office of Research and Development; U.S. EPA Regional Offices; U.S. EPA Office of Water; U.S. Army Corps of Engineers; Glen Fryxell, Ph.D., of the Pacific Northwest National Laboratory; and Jonathan McBurney of Lockheed Martin Corporation. Special acknowledgement also is given to Adam Hartley, Photographer, who provided the cover photograph.
vi August 2007
Executive Summary
EXECUTIVE SUMMARY
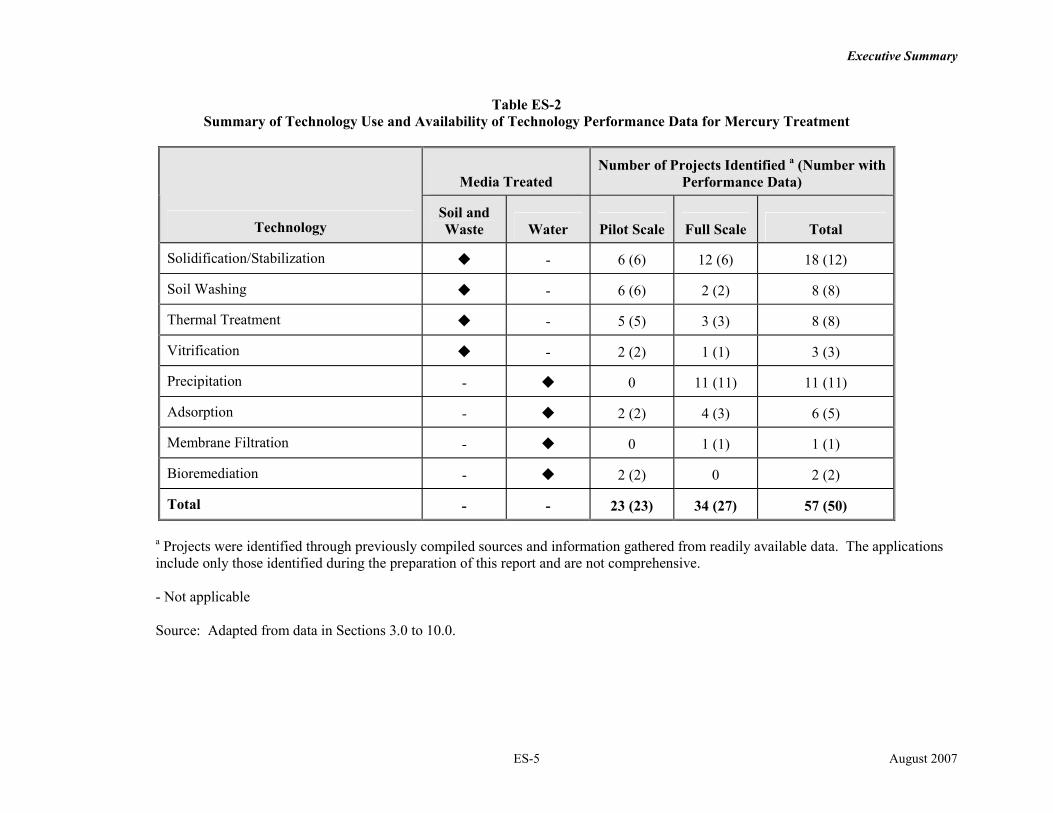
This report contains information on the treatment of soil, waste, and water that contain mercury, a contaminant that is difficult to treat and may cause a variety of adverse health effects in humans. A total of 57 projects were identified, of which 50 provide performance data. Twenty-three of the 57 projects were conducted at pilot scale and 34 at full scale. This information can help managers at sites with mercury-contaminated media and generators of mercury-contaminated waste and wastewater to:
• Identify proven and effective mercury treatment technologies; • Screen technologies based on application-specific goals, characteristics, and cost; and • Apply experiences from sites with similar treatment challenges.
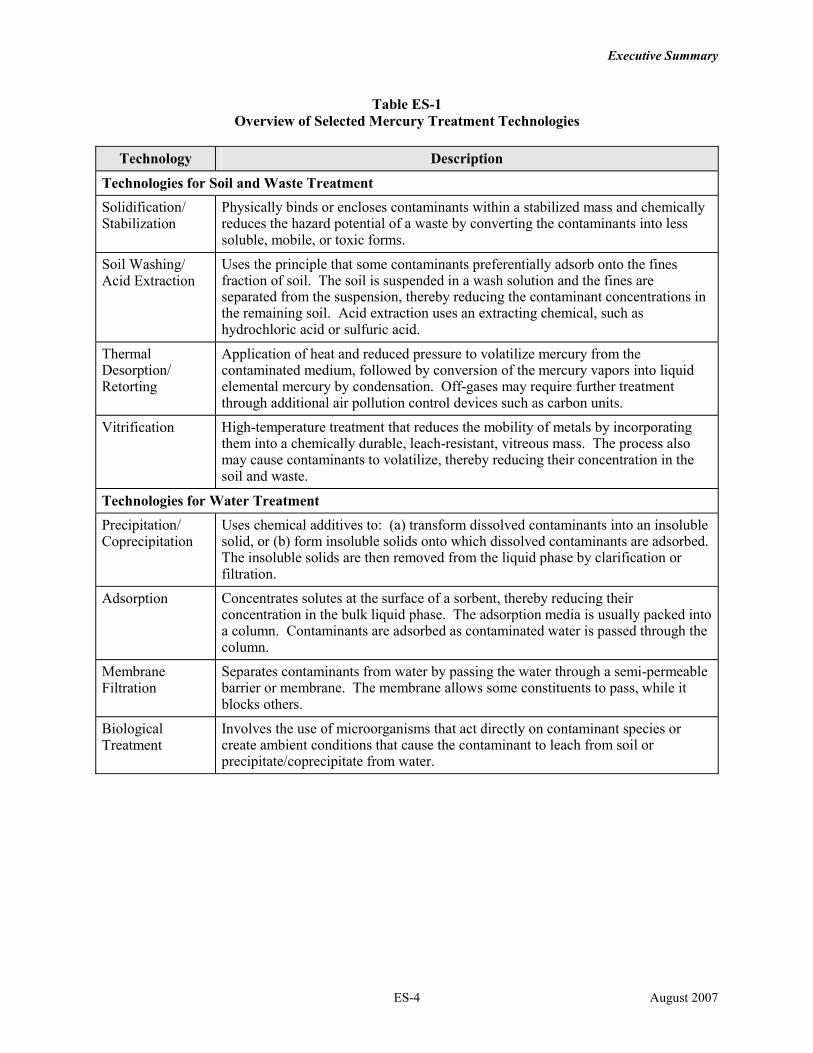
This report identifies eight technologies used to treat mercury in soil, waste, and water. These technologies were selected based on the availability of project-specific information for mercury treatment. Other technologies (for example, ion exchange) may be reported as being able to treat mercury contamination but are not covered in this report because project data were not found in the references used. Table ES-1 identifies and briefly describes each of these technologies. Mercury removal and emergency response are also covered briefly in the report, with a link to a guidebook for more detailed information. Treatment of air emissions that contain mercury is not covered in this report; however, technologies used to treat mercury-containing off-gas are mentioned where the information was available. Part II of this report contains more detailed information about each technology, including project-specific data. Case studies for some projects are provided based on the availability of data and the uniqueness of the application. Table ES-2 summarizes the technology applications and performance data identified for each technology and medium. Technologies that are applicable to one type of soil or waste are typically applicable to other types. For example, the media treated in the projects identified for solidification/stabilization include soil, concrete fines, sludge, liquid waste, mine tailings, and elemental mercury. Similarly, technologies that are applicable to one type of water are generally applicable to other types. For example, both groundwater and various types of wastewater are treated in the projects identified for precipitation/coprecipitation.
Mercury occurs naturally in the environment and can be found in elemental (metallic), inorganic, and organic forms. Modern uses for mercury include chemical manufacturing, thermometers, and lighting (mercury vapor and fluorescent lamps). The chemical and allied products industry group is responsible for the largest quantity of mercury used in the United States.
Mercury, particularly the organic methylmercury form, is a potent neurotoxin capable of impairing neurological development in fetuses and young children and of damaging the central nervous system of adults. Mercury regulations span multiple federal and state environmental statutes, as well as multiple agency jurisdictions.
Soil and Waste Treatment Technologies
Among the projects identified, solidification/stabilization (S/S) is the most frequently used technology to treat soil and waste contaminated with mercury. The data show that this technology has been used to meet regulatory cleanup levels, is commercially available to treat both soil and waste, and generates a residual that typically does not require further treatment before disposal. However, the data sources used for this report did not contain any information about the long-term stability of mercury-containing soil and waste treated using S/S.
ES-1 August 2007
Executive Summary
Other technologies for soil and waste, including soil washing, vitrification and thermal treatment, are typically considered for specific applications or soil types, and therefore are not used as often as solidification/stabilization.
Water Treatment Technologies
Among the mercury treatment projects identified, precipitation/coprecipitation is the most commonly used process to treat mercury-contaminated water. The effectiveness of this technology is less likely to be affected by characteristics of the media and contaminants compared with other water treatment technologies.
Alternative mercury treatment technologies include adsorption and membrane filtration; however, these technologies are used less frequently because both are more likely to be affected by characteristics of the media and non-mercury contaminants than is precipitation/coprecipitation. Adsorption tends to be used more often when mercury is the only contaminant to be treated, for relatively smaller systems, and as a polishing technology for effluent from larger systems. Membrane filtration is used less frequently because it tends to produce a larger volume of residuals than do other mercury treatment technologies.
Bioremediation has been used to treat mercury in two pilot-scale studies identified for this report. In one study, mercury ions were converted to elemental mercury by bacteria and then adsorbed onto a carbon unit. In the other study, a series of aerobic and anaerobic biological treatment steps was used to remove mercury from wastewater.
Innovative Approaches for Treatment of Mercury
Innovative approaches for treatment of mercury have been applied at the bench and pilot scale and show potential for deployment at full scale. These technologies include nanotechnology, phytoremediation, air stripping, and in situ thermal desorption. In a pilot-scale test of the nanotechnology, thiol-SAMMS (Selfassembled Monolayers on Mesoporous Silica), 97.4 percent of mercury dissolved in an aqueous waste stream was removed after the first treatment round, and 99.4 percent was removed after two additional rounds.
Phytoremediation is also being evaluated for its effectiveness in removal of mercury from sediments and other media. In a bench-scale study of rice genetically engineered for mercury resistance, the concentration of elemental mercury was higher in the genetically-modified germinates than in the wild-type germinates, indicating enhanced mercury-reducing activities of the genetically engineered plants. Eastern cottonwood trees have also been tested in the field for their ability to remediate mercury; however, results from the study were not available when research was conducted for this report.
Air stripping is another technology being evaluated for its ability to remove mercury from water. In a bench-scale study on contaminated groundwater at the Savannah River Site, chemical reduction using stannous chloride followed by collection of the elemental mercury from the water was found to remove low levels of mercury. Stannous chloride at doses greater than 0.011 milligrams per liter (mg/L) resulted in more than 94 percent mercury removal, with the residual total mercury reduced to levels below 10 nanograms per liter (ng/L). However, low doses of stannous chloride showed little removal of mercury.
ES-2 August 2007
Executive Summary
Mercury Treatment Cost Data
A limited amount of cost data on mercury was found from the sources reviewed. In many cases, only partial cost data were available, such as capital only, or operations and maintenance (O&M) only, or total costs without a breakdown. No mercury-specific cost data were identified for some technologies. A summary of cost data is provided in Table 2.3, with more detailed information presented in Section 3.0 through 10.0. A summary or interpretation of the costs is not provided, however, because mercury treatment is waste- and site-specific and because of the variation in the type and quality of information available.
ES-3 August 2007
Executive Summary
Table ES-1 Overview of Selected Mercury Treatment Technologies
Technology Description
Technologies for Soil and Waste Treatment
Solidification/ Stabilization
Physically binds or encloses contaminants within a stabilized mass and chemically reduces the hazard potential of a waste by converting the contaminants into less soluble, mobile, or toxic forms.
Soil Washing/ Acid Extraction
Uses the principle that some contaminants preferentially adsorb onto the fines fraction of soil. The soil is suspended in a wash solution and the fines are separated from the suspension, thereby reducing the contaminant concentrations in the remaining soil. Acid extraction uses an extracting chemical, such as hydrochloric acid or sulfuric acid.
Thermal Desorption/ Retorting
Application of heat and reduced pressure to volatilize mercury from the contaminated medium, followed by conversion of the mercury vapors into liquid elemental mercury by condensation. Off-gases may require further treatment through additional air pollution control devices such as carbon units.
Vitrification High-temperature treatment that reduces the mobility of metals by incorporating them into a chemically durable, leach-resistant, vitreous mass. The process also may cause contaminants to volatilize, thereby reducing their concentration in the soil and waste.
Technologies for Water Treatment
Precipitation/ Coprecipitation
Uses chemical additives to: (a) transform dissolved contaminants into an insoluble solid, or (b) form insoluble solids onto which dissolved contaminants are adsorbed. The insoluble solids are then removed from the liquid phase by clarification or filtration.
Adsorption Concentrates solutes at the surface of a sorbent, thereby reducing their concentration in the bulk liquid phase. The adsorption media is usually packed into a column. Contaminants are adsorbed as contaminated water is passed through the column.
Membrane Filtration
Separates contaminants from water by passing the water through a semi-permeable barrier or membrane. The membrane allows some constituents to pass, while it blocks others.
Biological Treatment
Involves the use of microorganisms that act directly on contaminant species or create ambient conditions that cause the contaminant to leach from soil or precipitate/coprecipitate from water.
ES-4 August 2007
Executive Summary
Table ES-2 Summary of Technology Use and Availability of Technology Performance Data for Mercury Treatment
Technology
Media Treated Number of Projects Identified a (Number with
Performance Data)
Soil and Waste Water Pilot Scale Full Scale Total
Solidification/Stabilization � - 6 (6) 12 (6) 18 (12)
Soil Washing � - 6 (6) 2 (2) 8 (8)
Thermal Treatment � - 5 (5) 3 (3) 8 (8)
Vitrification � - 2 (2) 1 (1) 3 (3)
Precipitation - � 0 11 (11) 11 (11)
Adsorption - � 2 (2) 4 (3) 6 (5)
Membrane Filtration - � 0 1 (1) 1 (1)
Bioremediation - � 2 (2) 0 2 (2)
Total - - 23 (23) 34 (27) 57 (50)
a Projects were identified through previously compiled sources and information gathered from readily available data. The applications include only those identified during the preparation of this report and are not comprehensive.
- Not applicable
Source: Adapted from data in Sections 3.0 to 10.0.
ES-5 August 2007

This page is intentionally left blank.
ES-6

PART I
OVERVIEW

This page is intentionally left blank.
Section 1 – Introduction
1.0 BACKGROUND
1.1 Introduction and Purpose of Report
This report provides information on the current state of treating mercury in environmental media such as soil, groundwater, and waste. Elemental mercury has a high vapor pressure which causes it to evaporate to the atmosphere easily and potentially become an inhalation hazard. Organic mercury, particularly methylmercury, is a potent neurotoxin capable of impairing neurological development in fetuses and young children and damaging the central nervous system of adults. In addition to the toxicity, mercury behaves in a complex manner depending on its form, oxidation state, and environmental conditions, such as pH. These factors contribute to making the treatment of mercury challenging. Project-specific information on treatment technologies for mercury contamination in environmental media and waste is provided in this report and can be used by remediation site managers, hazardous waste generators, and the public to:
• Identify proven and effective mercury treatment technologies; • Screen technologies based on application-specific goals and characteristics and cost; and • Apply experience from sites with similar treatment challenges.
Air emissions are not covered in this report; however, more detailed information on air pollution control (APC) technologies can be found on the U.S. Environmental Protection Agency’s (EPA’s) mercury Web page at http://www.epa.gov/mercury/control_emissions/technology.htm.
The term “soil” as used in this report includes soil, debris, sludge, sediments, and other solid-phase environmental media. “Waste” includes nonhazardous and hazardous solid waste generated by industry. “Water” includes groundwater, drinking water, nonhazardous and hazardous industrial wastewater, surface water, mine drainage, and leachate. Most sources used for this report contained information about treatment of mercury in soil, sludge, sediments, waste, groundwater, and wastewater. Limited information was identified on treatment of drinking water.
Part I of this report, Overview and Findings, contains an executive summary, an introduction, and a comparison of mercury treatment technologies. The introduction describes the purpose of the report, presents background information, discusses ongoing research in mercury treatment, and summarizes the methodology used to gather and analyze data. The Comparison of Technologies section (Section 2.0) analyzes and compares the technologies used for mercury treatment.
Part II of this report contains eight sections, each summarizing information for a specific type of mercury treatment technology. Each summary includes a brief description of the technology, information about how it is used to treat mercury, its status and scale, and data on cost and performance. Case studies for some projects are provided based on the availability of data and the uniqueness of the application. The technology summaries are organized as follows: the technologies typically used to treat soil and waste appear first, in the order of their number of full-scale applications, followed by those typically used for water, in the same order.
1.2 Sources of Information for the Report
This report is based on previously compiled sources on mercury treatment and information gathered from readily available data sources, including:
1-1 August 2007
Section 1 – Introduction
• Documents and databases prepared by EPA and other federal agencies; • Technical literature; • Information supplied by vendors of treatment technologies; • Internet sites; and • Information from technology experts.
1.3 Methodology Used to Compile Technology-Specific Information
This report provides information on the eight technologies listed in Table ES-1 in the executive summary. These technologies have been used at the full or pilot scale to treat mercury in soil, waste, and water. Full-scale projects include technologies used commercially to treat industrial waste and to remediate an entire area of contamination. Pilot-scale projects are usually conducted in the field to test the effectiveness of a technology on a specific soil, waste, and water or to obtain information for scaling a treatment system up to full-scale.
The information gathered for this report includes many projects that used treatment trains. Treatment trains consist of two or more technologies used together, either integrated into a single process or operated as a series of processes in sequence. The technologies in a train may treat the same contaminant. A common treatment train used for mercury in water includes pH adjustment as a pretreatment, followed by precipitation, sedimentation, and filtration.
Some treatment trains are employed when one technology alone is not capable of treating all of the contaminants. For example, an aboveground system consisting of electrochemical precipitation, followed by air stripping and granular activated carbon adsorption was used to treat groundwater contaminated with volatile organic compounds (VOC) and heavy metals, including mercury, at the King of Prussia Technical Corporation Superfund Site in New Jersey (Table 8.1). Electrochemical precipitation involves using electricity to convert contaminants to an insoluble form, which can then be removed. The electrochemical treatment and air stripping steps were used to remove most of the heavy metals and VOCs, while the adsorption treatment was a polishing step for the heavy metals, including mercury.
In many cases, the information did not specify the technologies within the train that were intended to treat mercury. Influent and effluent concentrations often were provided for the entire train and not for the individual components. In such cases, engineering judgment was used to identify the technology that treated mercury. For example, a treatment train consisting of precipitation followed by carbon adsorption and pH adjustment was used at the Olin Corporation Site in Alabama (Table 8.1) to treat groundwater contaminated with VOCs and mercury. The precipitation step was assumed to remove most of the mercury, and the carbon unit was assumed to serve as a polishing step.
When a treatment train included more than one potential mercury treatment technology, all mercury treatment technologies were assumed to contribute to mercury treatment unless information indicated otherwise. Information about these projects is presented in all applicable technology sections.
1.4 Background
Mercury occurs naturally in the environment and can be found in elemental (metallic), inorganic, and organic forms. The most common natural forms of mercury are elemental mercury, mercuric sulfide (cinnabar ore), mercuric chloride, and methylmercury. Historically, mercury and its compounds have been used for industrial, medicinal, and cosmetic purposes. Modern uses for mercury include production of chlor-alkali, in wiring devices and switches, measuring and control devices, lighting, and dental work. In 2004, the largest use of mercury was in wiring devices and switches (63 tons), followed by dental work (35 tons), and chlor-alkali production (14 tons). Based on data provided by the chlor-alkali, lamp, and dental industries, it appears that use of mercury declined by more than 50 percent between 1995 and 2004 (Ref. 1.19)
1-2 August 2007
Section 1 – Introduction
Mercury, and particularly the organic methylmercury form, is a potent neurotoxin capable of impairing neurological development in fetuses and young children and of damaging the central nervous system of adults (Ref. 1.2, 1.21). High exposures to inorganic mercury may damage the gastrointestinal tract, the nervous system, and the kidneys. Both inorganic and organic mercury compounds are absorbed through the gastrointestinal tract and affect other systems via this route. However, organic mercury compounds are more readily absorbed via ingestion than are inorganic mercury compounds (Ref. 1.4).
People are most likely to be exposed to harmful quantities of mercury through consumption of fish contaminated with methylmercury (Ref. 1.3). Elemental mercury causes adverse health effects when it is breathed as a vapor and absorbed through the lungs. These exposures can occur when elemental mercury is spilled or products that contain elemental mercury break and expose the substance to the air, particularly in warm or poorly ventilated indoor spaces (Ref. 1.4). Exposure to inorganic mercury can also occur from drinking contaminated water and touching contaminated water and soil, though these exposures are generally not thought to be harmful at typical ambient levels (Ref. 1.2).
1.5 Environmental Occurrence
Mercury can be found in air, soil, and water. The most prevalent ore form of mercury is cinnabar (mercury sulfide). In the U.S., large naturally occurring cinnabar deposits exist in California, Nevada, Utah, Oregon, Arkansas, Idaho, and Texas. Inorganic mercury also occurs in small amounts in many rock types (for example, granite and shale) (Ref. 1.5). Atmospheric levels of mercury tend to be higher in the vicinity of active volcanoes and significant anthropogenic sources than in other areas. Coal-burning power plants emit more mercury to the air than other anthropogenic sources in the U.S., accounting for about 45 percent of all domestic mercury emissions (Ref. 1.19). Once in the atmosphere, mercury is widely disseminated and can circulate for years, accounting for its wide-spread distribution. Most natural waters, including groundwater and surface waters, also contain naturally occurring mercury in the low micrograms per liter (µg/L) range (depending on the types of rock the water flows through), with freshwater concentrations reported as high as 70 µg/L (Ref. 1.5). Inorganic mercury in the atmosphere that is deposited in water has the potential to be converted to methylmercury, which tends to bioaccumulate in fish and animals (Ref. 1.1).
Of the estimated 111 tons of mercury emitted annually into the atmosphere by anthropogenic sources in the U.S. as of 2002, approximately 45 percent is from utility coal boilers; 10 percent from electric arc furnaces; 9 percent from industrial/commercial/institutional boilers and process heaters; 6 percent from gold mining; and 5 percent from chlorine production. Total estimated emissions decreased 47 percent between 1990 and 2002. However, the actual reduction in emissions has likely been greater than this estimate because two of the biggest 2002 emissions source categories — electric arc furnaces and gold mining — are not included in the 1990 inventory (Ref. 1.19).
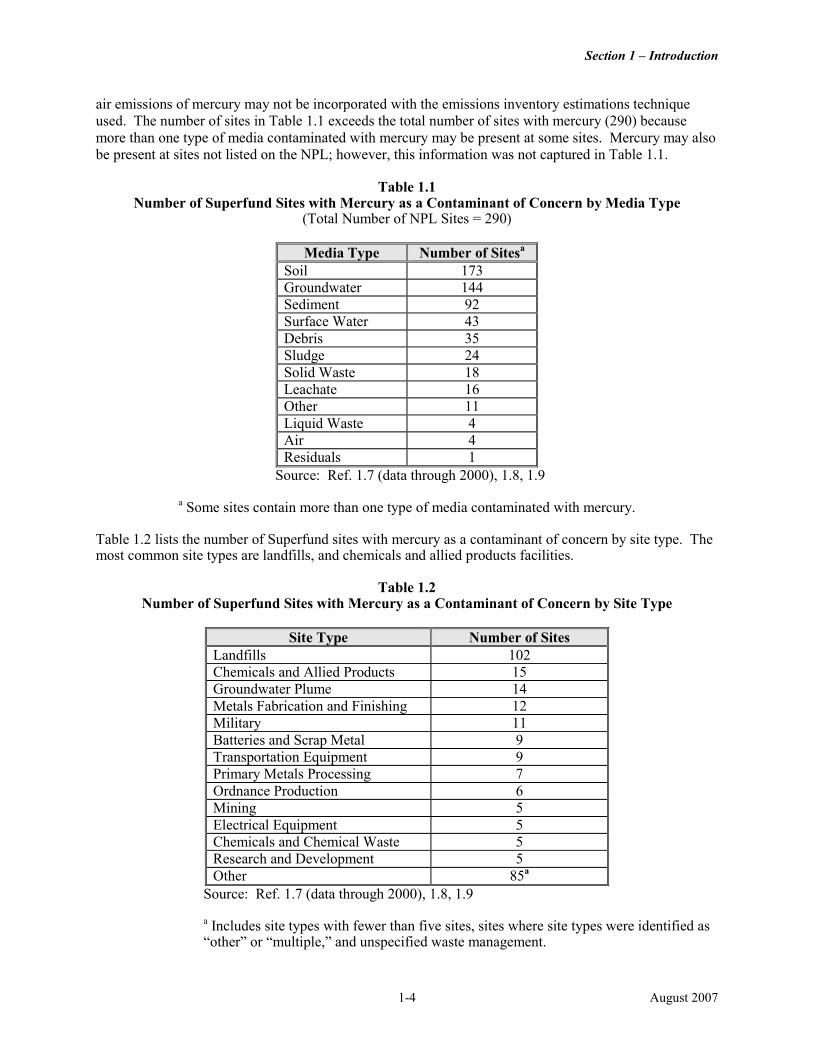
At waste sites, mercury occurs in various media, including soil, groundwater, sediment, sludge, and leachate. Thimerosal, an organic form of mercury (C9H9HgO2SNa), has been used as a preservative in a number of medicines and can be found in waste streams from hospitals, clinical laboratories, and pharmaceutical industries. Waste sites fall under several cleanup programs, including Superfund responses, Resource Conservation and Recovery Act (RCRA) corrective actions, and state cleanups. Information is available on the occurrence and treatment of mercury at Superfund National Priorities List (NPL) sites. Based on records of decision and other site data, 290 NPL sites include mercury as a contaminant of concern. A contaminant of concern is any compound that is expected to be present at a site based upon past and current land uses and associated releases. Table 1.1 lists these sites by the medium that contains mercury. Soil and groundwater are the most common media, with mercury-contaminated soil at 173 sites and mercury-contaminated groundwater at144 sites. The table shows four sites with air emissions of mercury; however, this actual number is likely larger than four because fugitive
1-3 August 2007
Section 1 – Introduction
air emissions of mercury may not be incorporated with the emissions inventory estimations technique used. The number of sites in Table 1.1 exceeds the total number of sites with mercury (290) because more than one type of media contaminated with mercury may be present at some sites. Mercury may also be present at sites not listed on the NPL; however, this information was not captured in Table 1.1.
Table 1.1 Number of Superfund Sites with Mercury as a Contaminant of Concern by Media Type
(Total Number of NPL Sites = 290)
Media Type Number of Sitesa
Soil 173 Groundwater 144 Sediment 92 Surface Water 43 Debris 35 Sludge 24 Solid Waste 18 Leachate 16 Other 11 Liquid Waste 4 Air 4 Residuals 1
Source: Ref. 1.7 (data through 2000), 1.8, 1.9
a Some sites contain more than one type of media contaminated with mercury.
Table 1.2 lists the number of Superfund sites with mercury as a contaminant of concern by site type. The most common site types are landfills, and chemicals and allied products facilities.
Table 1.2 Number of Superfund Sites with Mercury as a Contaminant of Concern by Site Type
Site Type Number of Sites Landfills 102 Chemicals and Allied Products 15 Groundwater Plume 14 Metals Fabrication and Finishing 12 Military 11 Batteries and Scrap Metal 9 Transportation Equipment 9 Primary Metals Processing 7 Ordnance Production 6 Mining 5 Electrical Equipment 5 Chemicals and Chemical Waste 5 Research and Development 5 Other 85a
Source: Ref. 1.7 (data through 2000), 1.8, 1.9
a Includes site types with fewer than five sites, sites where site types were identified as “other” or “multiple,” and unspecified waste management.
1-4 August 2007
Section 1 – Introduction
Information for Tables 1.1 and 1.2 was compiled from the Comprehensive Environmental Response, Compensation, and Liability Information System (CERCLIS) database (Ref. 1.6), the Superfund NPL Assessment Program (SNAP) database (Ref. 1.7), and the database supporting the document “Treatment Technologies for Site Cleanup: Annual Status Report (Eleventh Edition)” (Ref. 1.8).
1.6 Chemistry and Behavior
Elemental mercury is a silver-white, heavy liquid at room temperature. Because of its high surface tension, it forms small compact spherical droplets when it is released in the environment. Although the droplets themselves are stable, the high vapor pressure of mercury compared with other metals causes it to evaporate. Therefore, released or uncovered mercury can rapidly become an inhalation hazard (Refs. 1.1 and 1.5).
The most prevalent oxidation states for mercury are Hg+1 (mercurous) or Hg+2 (mercuric). The properties and chemical behavior of mercury strongly depend on its oxidation state. Mercury can form a variety of inorganic salts and is unusual among metals because, unlike the reactive alkali and alkaline earth metals, it can form covalent bonds with organic radicals. Most of the mercury encountered in water, soil, sediments, and biota and other environmental media (except the atmosphere) is in the form of inorganic mercuric salts and organomercurics. Organomercurics are defined by the presence of a covalent C-Hg bond. The presence of a covalent C-Hg bond differentiates organomercurics from inorganic mercury compounds that merely associate with the organic material in the environment but do not have the C-Hg bond.
The following mercury compounds are most frequently found under environmental conditions: mercuric salts HgS, HgCl, Hg(OH) and HgS; the methylmercury ion (HgCH3
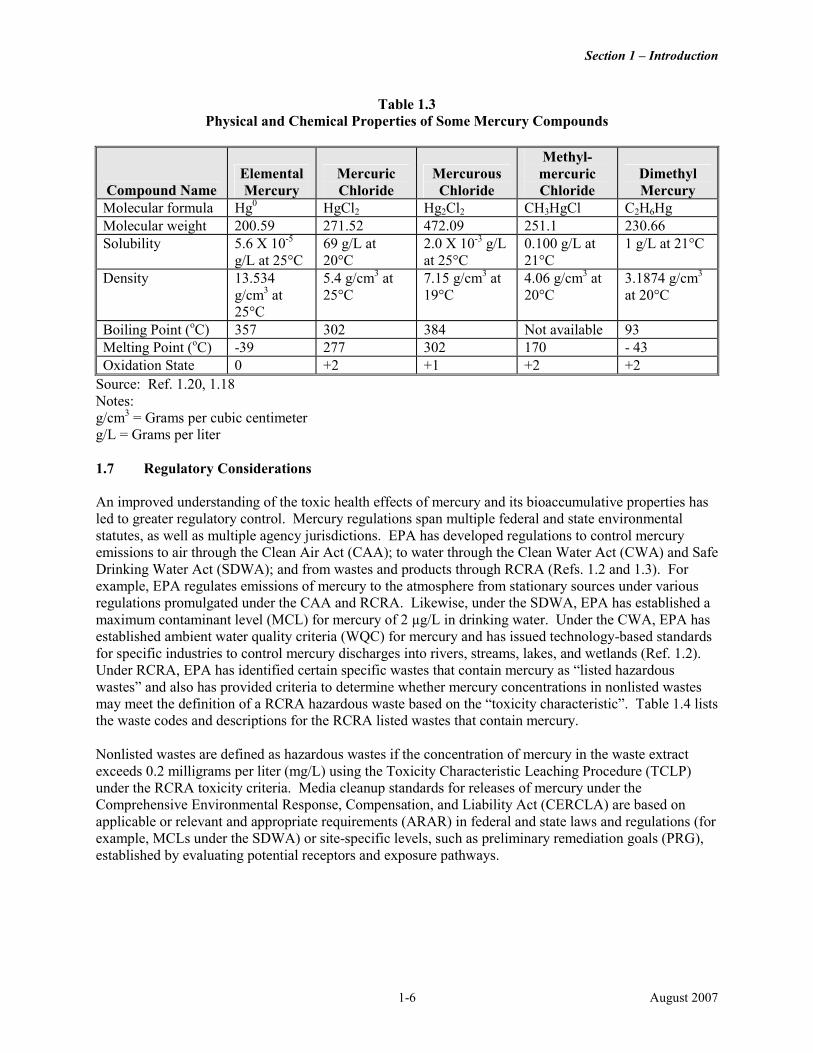
+) and its compounds methylmercuric chloride (CH3HgCl) and methylmercuric hydroxide (CH3HgOH); and, in small fractions, other organomercurics (for example, dimethylmercury and phenylmercury) (Refs. 1.5 and 1.10). Methylmercury — which can cause nervous system damage, especially in fetuses and infants — is formed when mercury enters soil or sediments and is acted on by anaerobic microorganisms (Ref. 1.4). The solubilities of mercury compounds vary, ranging from negligible (HgCl, HgS) to very soluble (HgCl2) (Ref. 1.5). Table 1.3 provides the physical and chemical properties of elemental mercury and some of its compounds (Ref. 1.14).
Ionic forms of mercury are strongly adsorbed by soils and sediments and are desorbed slowly. Clay minerals optimally adsorb mercury ions at pH 6. Iron oxides also adsorb mercury ions in neutral soils. Most mercury ions are adsorbed by organic matter (mainly fulvic and humic acids) in acidic soils. When organic matter is not present, mercury becomes relatively more mobile in acid soils and can evaporate to the atmosphere or leach to groundwater (Ref. 1.5).
1-5 August 2007
Section 1 – Introduction
Table 1.3 Physical and Chemical Properties of Some Mercury Compounds
Compound Name Elemental Mercury
Mercuric Chloride
Mercurous Chloride
Methyl-mercuric Chloride
Dimethyl Mercury
Molecular formula Hg0 HgCl2 Hg2Cl2 CH3HgCl C2H6Hg Molecular weight 200.59 271.52 472.09 251.1 230.66 Solubility 5.6 X 10⁻⁵
g/L at 25°C 69 g/L at 20°C
2.0 X 10⁻³ g/L at 25°C
0.100 g/L at 21°C
1 g/L at 21°C
Density 13.534 g/cm3 at 25°C
5.4 g/cm3 at 25°C
7.15 g/cm3 at 19°C
4.06 g/cm3 at 20°C
3.1874 g/cm3
at 20°C
Boiling Point (oC) 357 302 384 Not available 93 Melting Point (oC) -39 277 302 170 - 43 Oxidation State 0 +2 +1 +2 +2
Source: Ref. 1.20, 1.18 Notes: g/cm3 = Grams per cubic centimeter g/L = Grams per liter
1.7 Regulatory Considerations
An improved understanding of the toxic health effects of mercury and its bioaccumulative properties has led to greater regulatory control. Mercury regulations span multiple federal and state environmental statutes, as well as multiple agency jurisdictions. EPA has developed regulations to control mercury emissions to air through the Clean Air Act (CAA); to water through the Clean Water Act (CWA) and Safe Drinking Water Act (SDWA); and from wastes and products through RCRA (Refs. 1.2 and 1.3). For example, EPA regulates emissions of mercury to the atmosphere from stationary sources under various regulations promulgated under the CAA and RCRA. Likewise, under the SDWA, EPA has established a maximum contaminant level (MCL) for mercury of 2 µg/L in drinking water. Under the CWA, EPA has established ambient water quality criteria (WQC) for mercury and has issued technology-based standards for specific industries to control mercury discharges into rivers, streams, lakes, and wetlands (Ref. 1.2). Under RCRA, EPA has identified certain specific wastes that contain mercury as “listed hazardous wastes” and also has provided criteria to determine whether mercury concentrations in nonlisted wastes may meet the definition of a RCRA hazardous waste based on the “toxicity characteristic”. Table 1.4 lists the waste codes and descriptions for the RCRA listed wastes that contain mercury.
Nonlisted wastes are defined as hazardous wastes if the concentration of mercury in the waste extract exceeds 0.2 milligrams per liter (mg/L) using the Toxicity Characteristic Leaching Procedure (TCLP) under the RCRA toxicity criteria. Media cleanup standards for releases of mercury under the Comprehensive Environmental Response, Compensation, and Liability Act (CERCLA) are based on applicable or relevant and appropriate requirements (ARAR) in federal and state laws and regulations (for example, MCLs under the SDWA) or site-specific levels, such as preliminary remediation goals (PRG), established by evaluating potential receptors and exposure pathways.
1-6 August 2007
Section 1 – Introduction
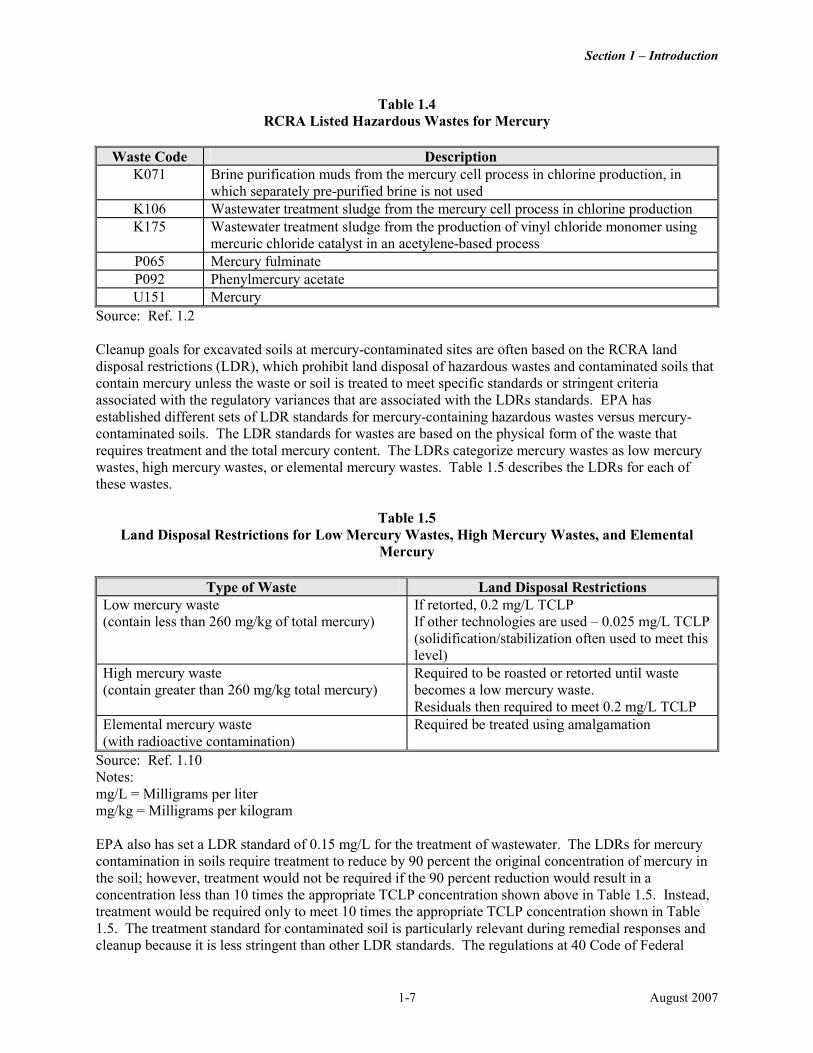
Table 1.4 RCRA Listed Hazardous Wastes for Mercury
Waste Code Description K071 Brine purification muds from the mercury cell process in chlorine production, in
which separately pre-purified brine is not used K106 Wastewater treatment sludge from the mercury cell process in chlorine production K175 Wastewater treatment sludge from the production of vinyl chloride monomer using
mercuric chloride catalyst in an acetylene-based process P065 Mercury fulminate P092 Phenylmercury acetate U151 Mercury
Source: Ref. 1.2
Cleanup goals for excavated soils at mercury-contaminated sites are often based on the RCRA land disposal restrictions (LDR), which prohibit land disposal of hazardous wastes and contaminated soils that contain mercury unless the waste or soil is treated to meet specific standards or stringent criteria associated with the regulatory variances that are associated with the LDRs standards. EPA has established different sets of LDR standards for mercury-containing hazardous wastes versus mercury-contaminated soils. The LDR standards for wastes are based on the physical form of the waste that requires treatment and the total mercury content. The LDRs categorize mercury wastes as low mercury wastes, high mercury wastes, or elemental mercury wastes. Table 1.5 describes the LDRs for each of these wastes.
Table 1.5 Land Disposal Restrictions for Low Mercury Wastes, High Mercury Wastes, and Elemental
Mercury
Type of Waste Land Disposal Restrictions Low mercury waste (contain less than 260 mg/kg of total mercury)
If retorted, 0.2 mg/L TCLP If other technologies are used – 0.025 mg/L TCLP (solidification/stabilization often used to meet this level)
High mercury waste (contain greater than 260 mg/kg total mercury)
Required to be roasted or retorted until waste becomes a low mercury waste. Residuals then required to meet 0.2 mg/L TCLP
Elemental mercury waste (with radioactive contamination)
Required be treated using amalgamation
Source: Ref. 1.10 Notes: mg/L = Milligrams per liter mg/kg = Milligrams per kilogram
EPA also has set a LDR standard of 0.15 mg/L for the treatment of wastewater. The LDRs for mercury contamination in soils require treatment to reduce by 90 percent the original concentration of mercury in the soil; however, treatment would not be required if the 90 percent reduction would result in a concentration less than 10 times the appropriate TCLP concentration shown above in Table 1.5. Instead, treatment would be required only to meet 10 times the appropriate TCLP concentration shown in Table 1.5. The treatment standard for contaminated soil is particularly relevant during remedial responses and cleanup because it is less stringent than other LDR standards. The regulations at 40 Code of Federal
1-7 August 2007
Section 1 – Introduction
Regulations Part 268.9 discuss additional rules about how to identify applicable LDR treatment standards for characteristic hazardous wastes, including hazardous wastes that are listed and also exhibit one or more RCRA characteristics.
1.8 Mercury Removal and Emergency Response
Various steps need to be taken to safely clean up and contain the contamination when an indoor spill of mercury occurs. U.S. EPA Region 5 recommends that the following six “R’s” of a response be followed:
• Referral – notifying the appropriate agencies about the spill, for example, the local health agency; • Reconnaissance – assessing the extent and level of contamination; • Relocation – determining the need for relocation, notifying residents, and securing alternate
accommodations; • Removal – conducting decontamination, such as bagging contaminated items, cleaning
contaminated surfaces with appropriate chemicals, and ventilating the area; • Replacement – appraising the removed items and restoring the area after decontamination is
complete; and • Reoccupation – notifying residents when buildings are ready for reoccupation and assisting in the
reoccupation process.
These six factors are described in detail in the “Mercury Response Guidebook,” developed by EPA’s Emergency Response Team (ERT) and EPA Region 5 (Ref. 1.13).
The guidebook is designed to assist emergency and remedial professionals to coordinate and clean up indoor mercury spills. States and other EPA regions also may have specific requirements during an emergency response.
1.9 Detection and Site Characterization
Samples may be analyzed to measure the mercury concentration in a controlled laboratory environment or in the field using site characterization techniques. In a laboratory, soil and water samples can be analyzed using several different methods. The most common analytical methods use cold-vapor atomic absorption spectroscopy. For aqueous samples, these methods include 245.1 (manual) (Ref. 1.15), 245.2 (automated) (Ref. 1.15), and SW-846 Method 7470A (Ref. 1.20). For solid samples, these methods include 245.5 (sediment), 245.6 (tissues), and SW-846 Methods 7471A and 7473 (Refs. 1.15, 1.16).
A number of additional analytical procedures are available in laboratories that have the necessary instrumentation. Organomercurial compounds may be analyzed by high-performance liquid chromatography with an electron capture detector using Method 245.8. Total mercury may be measured by atomic fluorescence spectrometry using Method 245.7 (Ref. 1.15) and SW-846 Method 7474 (Ref. 1.21). Mercury may also be analyzed by inductively coupled plasma/mass spectrometry using SW-846 Method 6020A (Ref. 1.15); by anodic stripping voltammetry using SW-846 Method 7472 (Ref. 1.15); and by thermal decomposition, amalgamation, and atomic absorption spectrophotometry using SW-846 Method 7473 (Ref. 1.15). Some of the SW-846 methods require a digestion step (selected from SW-846 Methods 3005A through 3052) before analysis for nonaqueous samples or for all samples (Refs. 1.15, 1.16).
1-8 August 2007
Section 1 – Introduction
Detection and site characterization of mercury using field-based analytical methods allows for ease of on-site application and quicker decision-making. The technologies are portable and provide continuous, real-time data. Some methods can be used outdoors with hand-held equipment; other, more rigorous methods require the controlled environments of a mobile laboratory.
Field-based analytical methods, with systematic project planning and dynamic work strategies, form the basis of the Triad, an innovative approach to decision-making for hazardous waste site characterization and remediation. The three-pronged approach of the Triad aims to identify and manage decision uncertainties in site cleanup (http://www.triadcentral.org). Systematic project planning ensures that the goals for the project are clearly identified and involves charting the most resource-effective course to reach the desired outcomes. Dynamic work strategies, often in the form of a decision tree approved by the regulatory agency, guide the Triad project teams in making on-site decisions. Using this strategy, future site activities progress based on previous findings in the field. Real-time measurements generated using field-based analytical techniques, rapid sampling platforms (for example, direct-push technologies), geophysical tools, and on-site data management and display software make real-time decision-making possible. Application of the Triad can condense a project’s overall budget and lifetime, while increasing the likelihood that the gathered data will guide better, more transparent decisions (Ref. 1.23).
The most commonly used site characterization techniques for mercury are immunoassay (IA) test kits, field-based X-ray fluorescence (XRF) analyzers, and atomic absorption spectrometry instruments. IAs employ antibodies that bind with a target compound or class of compounds. The process is colorimetric, with the change in color indicating the approximate concentrations of the target compound. The presence of the target compound is identified by comparing the color developed by a sample of unknown concentration with the color formed by a standard that contains the analyte at a known concentration. The concentration of the analyte is determined by the intensity of color in the sample. One type of commercially available immunoassay test kit for inorganic contaminants is the BiMelyze immunoassay for mercury in soil and water, manufactured by BioNebraska. The kit measures inorganic mercuric (+2) ions in soil and water and has a detection limit of 0.5 milligrams per kilogram (mg/kg) for soil and 0.25 µg/L for water (Refs. 1.11, 1.12).
XRF is used to characterize the mercury concentration in solid media such as soil and debris. It operates on the concept of energy dispersive X-ray fluorescence spectrometry and responds to all chemical forms of mercury. Samples are bombarded with X-rays produced by radioisotopes. When the X-rays are absorbed by metals in the sample, the atoms emit X-rays of a specific wavelength. Each metal gives off X-rays of different energy levels. The specific type or energy of the emitted X-ray is unique to a metal and is called a “characteristic” X-ray. It is possible to identify and sometimes quantify the composition of metals in a sample by measuring the different energies of X-rays emitted by a sample exposed to an X-ray source. A qualitative analysis of the samples can be made by observing the characteristic X-rays produced. The quantity or intensity of the energy of the X-rays emitted is proportional to the concentration of the target analytes (Refs. 1.11, 1.12).
Field instruments typically use atomic absorption spectrometry for detecting mercury vapor. Four instruments that are representative of available technologies for mercury vapor detection are shown in Appendix A. One of the technologies described in Appendix A is from the Ohio Lumex Company (http://www.ohiolumex.com). This instrument is based on the principle of the Zeeman effect, which involves splitting the spectrum by an applied magnetic field to achieve very low detection levels.
Further information on field-based analytical methods is available on EPA’s Dynamic Field Activities web page at http://www.epa.gov/superfund/programs/dfa/fldmeth.htm, and through EPA’s Field Analytic Technologies Encyclopedia (FATE) Web site at http://fate.clu-in.org.
1-9 August 2007
Section 1 – Introduction
References
1.1 U.S. Geological Survey (USGS). 2000. Circular 1197. The Materials Flow of Mercury in the Economies of the United States and the World. http://pubs.usgs.gov/circ/c1197/.
1.2 U.S. Environmental Protection Agency (EPA) and Environment Canada. 1999. Update: Binational Toxics Strategy – Mercury Sources and Regulations. http://www.epa.gov/bns/mercury/stephg.html.
1.3 U.S. EPA. 2005. Great Lakes Pollution Prevention and Toxics Strategy. Background Information on Mercury Sources and Regulations. http://www.epa.gov/grtlakes/bnsdocs/mercsrce/merc_srce.html.
1.4 U.S. EPA. Mercury. http://www.epa.gov/mercury/. Accessed February 2005.
1.5 Massachusetts Department of Environmental Protect (MADEP). 1996. Mercury: Forms, Fate & Effects (Chapter 2). http://www.mass.gov/dep/toxics/stypes/hgch2.htm.
1.6 U.S. EPA. 2004. Office of Emergency and Remedial Response. Comprehensive Environmental Response Compensation and Liability Information System database (CERCLIS).
1.7 U.S. EPA. 2004. Superfund NPL Assessment Program (SNAP) database.
1.8 U.S. EPA. 2004. Treatment Technologies for Site Cleanup: Annual Status Report (Eleventh Edition). Office of Solid Waste and Emergency Response. EPA-542-R-03-009. February. http://clu-in.org/download/remed/asr/11/asr.pdf.
1.9 U.S. EPA. Mercury Laws and Regulations: Wastes and Products. http://www.epa.gov/mercury/regs.htm#wastes. Accessed August 2006.
1.10 U.S. EPA. Office of Air Quality Planning & Standards and Office of Research and Development. 1997. Mercury Study Report to Congress Volume III: Fate and Transport of Mercury in the Environment. EPA 452-R-97-005. http://www.epa.gov/ttn/oarpg/t3/reports/volume3.pdf.
1.11 California Department of Toxic Substances Control. Final Decision to Certify Hazardous Waste Environmental Technologies: BioNebraska, Inc., BiMelyze Field Screening Assay. http://www.dtsc.ca.gov/TechnologyDevelopment/TechCert/bionebraska-bmfsa-techcert.cfm. Accessed August 2006.
1.12 U.S. EPA. Field Sampling and Analysis Technologies Matrix: Sample Analysis and Tools Web site. http://www.frtr.gov/site/analysismatrix.html. Accessed August 2006.
1.13 U.S. EPA Region 5 Emergency Response Team (ERT). 2001. Mercury Response Guidebook. March. http://www.epa.gov/epaoswer/hazwaste/mercury/pdf/cover-intro.pdf. http://www.epa.gov/epaoswer/hazwaste/mercury/pdf/chapter1.pdf. http://www.epa.gov/epaoswer/hazwaste/mercury/pdf/chapter2.pdf. http://www.epa.gov/epaoswer/hazwaste/mercury/pdf/chapter3.pdf. http://www.epa.gov/epaoswer/hazwaste/mercury/pdf/chapter4.pdf. http://www.epa.gov/epaoswer/hazwaste/mercury/pdf/chapter5.pdf. http://www.epa.gov/epaoswer/hazwaste/mercury/pdf/chapter6.pdf. http://www.epa.gov/epaoswer/hazwaste/mercury/pdf/chapter7.pdf.
1-10 August 2007
Section 1 – Introduction
1.14 Committee on the Toxicological Effects of Methylmercury, Board on Environmental Studies and Toxicology, National Research Council. 2000. Toxicological Effects of Methylmercury. National Academy Press. Washington, D.C.
1.15 U.S. EPA New England Region 1 Library. April 2003 Revised Edition. Index to EPA Test Methods. http://www.epa.gov/ne/info/testmethods/index.html. Accessed August 2006.
1.16 U.S. EPA. 2003. Office of Solid Waste and Emergency Response (OSWER). Test Methods – SW-846. http://www.epa.gov/epaoswer/hazwaste/test/sw846.htm.
1.17 U.S. EPA. 2004. Fact sheet: Improving Sampling, Analysis, and Data Management for Site Investigation and Cleanup. April. http://clu-in.org/download/char/2004triadfactsheeta.pdf.
1.18 The Physical and Theoretical Chemistry Laboratory, Oxford University. Chemical and Other Safety Information. http://physchem.ox.ac.uk/msds/. Accessed August 2006.
1.19 U.S. EPA. 2006. Binational Toxics Strategy Mercury Progress Report. From Alexis Cain, EPA Region 5, to the Binational Toxics Strategy Mercury Workgroup. http://www.epa.gov/region5/mercury/progress06.pdf. March 16.
1.20 U.S. EPA. 1994. Method 7470A – Mercury in Liquid Waste (Manual Cold-Vapor Technique) http://www.epa.gov/sw-846/pdfs/7470a.pdf. September.
1.21 U.S. EPA. 2006. EPA’s Roadmap for Mercury. http://www.epa.gov/mercury/roadmap.htm. July.
1-11 August 2007

This page is intentionally left blank.
1-12
Section 2 – Comparison of Treatment Technologies
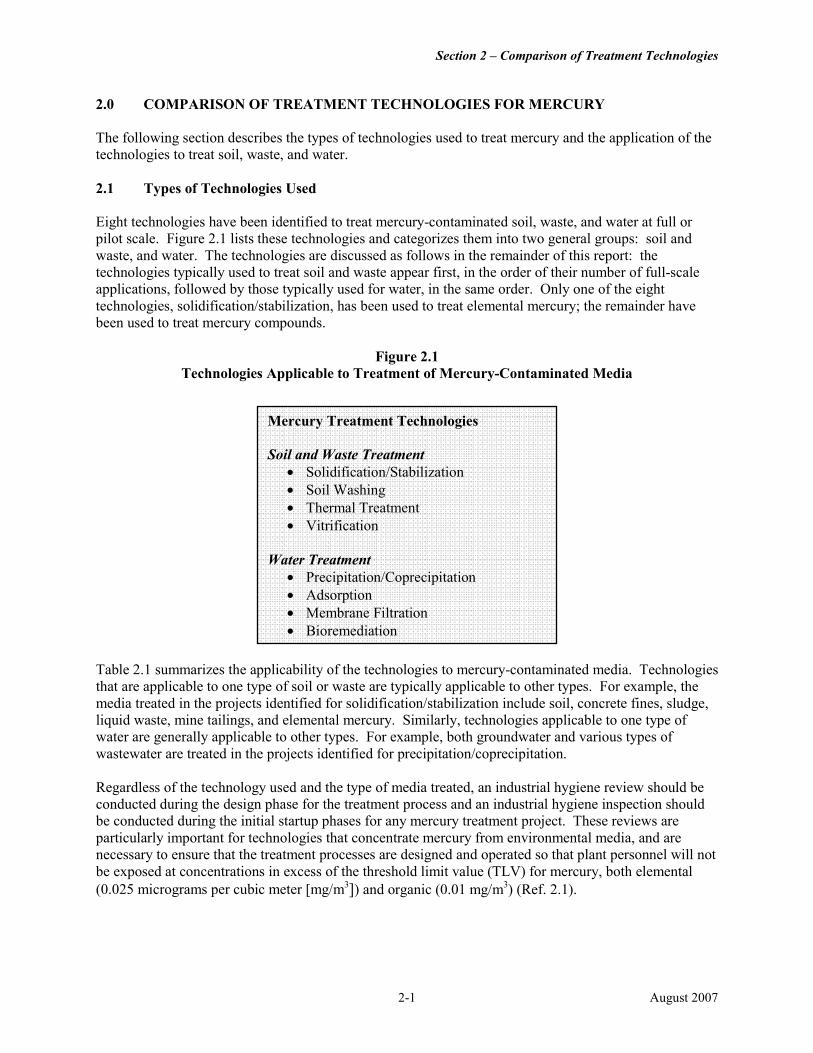
2.0 COMPARISON OF TREATMENT TECHNOLOGIES FOR MERCURY The following section describes the types of technologies used to treat mercury and the application of the technologies to treat soil, waste, and water. 2.1 Types of Technologies Used Eight technologies have been identified to treat mercury-contaminated soil, waste, and water at full or pilot scale. Figure 2.1 lists these technologies and categorizes them into two general groups: soil and waste, and water. The technologies are discussed as follows in the remainder of this report: the technologies typically used to treat soil and waste appear first, in the order of their number of full-scale applications, followed by those typically used for water, in the same order. Only one of the eight technologies, solidification/stabilization, has been used to treat elemental mercury; the remainder have been used to treat mercury compounds.
Figure 2.1 Technologies Applicable to Treatment of Mercury-Contaminated Media
Mercury Treatment Technologies Soil and Waste Treatment
• Solidification/Stabilization • Soil Washing • Thermal Treatment • Vitrification
Water Treatment • Precipitation/Coprecipitation • Adsorption • Membrane Filtration • Bioremediation
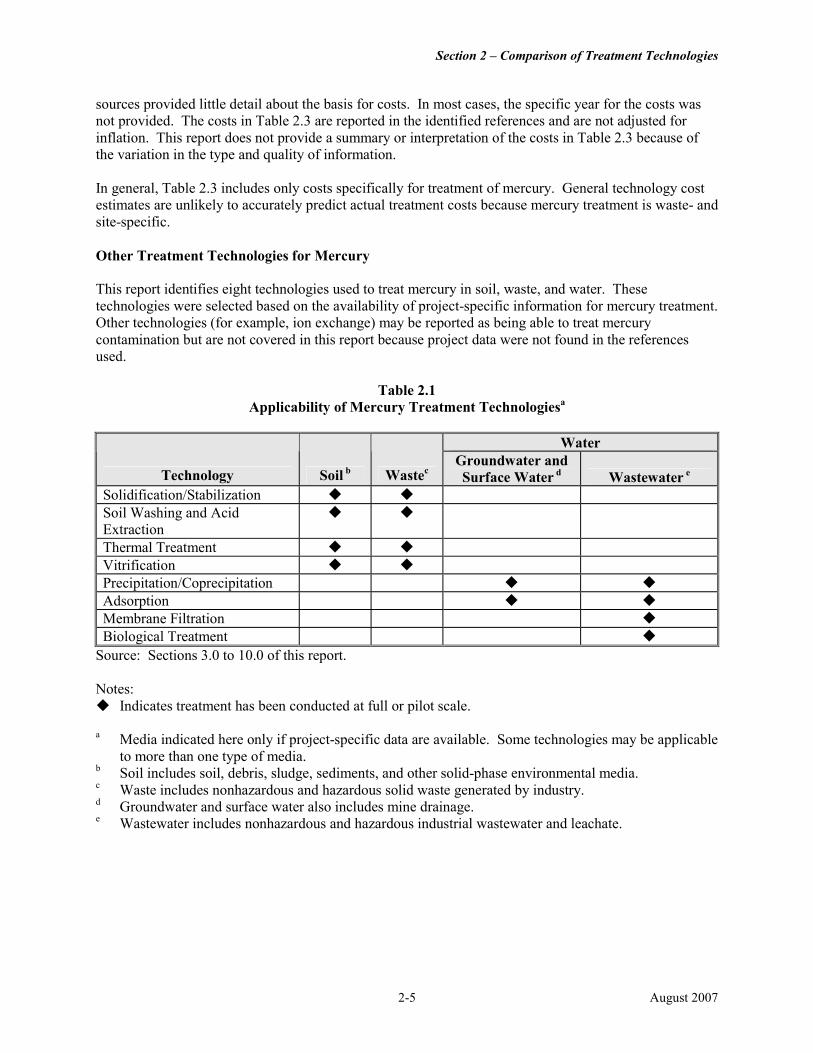
Table 2.1 summarizes the applicability of the technologies to mercury-contaminated media. Technologies that are applicable to one type of soil or waste are typically applicable to other types. For example, the media treated in the projects identified for solidification/stabilization include soil, concrete fines, sludge, liquid waste, mine tailings, and elemental mercury. Similarly, technologies applicable to one type of water are generally applicable to other types. For example, both groundwater and various types of wastewater are treated in the projects identified for precipitation/coprecipitation. Regardless of the technology used and the type of media treated, an industrial hygiene review should be conducted during the design phase for the treatment process and an industrial hygiene inspection should be conducted during the initial startup phases for any mercury treatment project. These reviews are particularly important for technologies that concentrate mercury from environmental media, and are necessary to ensure that the treatment processes are designed and operated so that plant personnel will not be exposed at concentrations in excess of the threshold limit value (TLV) for mercury, both elemental (0.025 micrograms per cubic meter [mg/m3]) and organic (0.01 mg/m3) (Ref. 2.1).
2-1 August 2007
Section 2 – Comparison of Treatment Technologies
2.2 Frequency of Technology Use
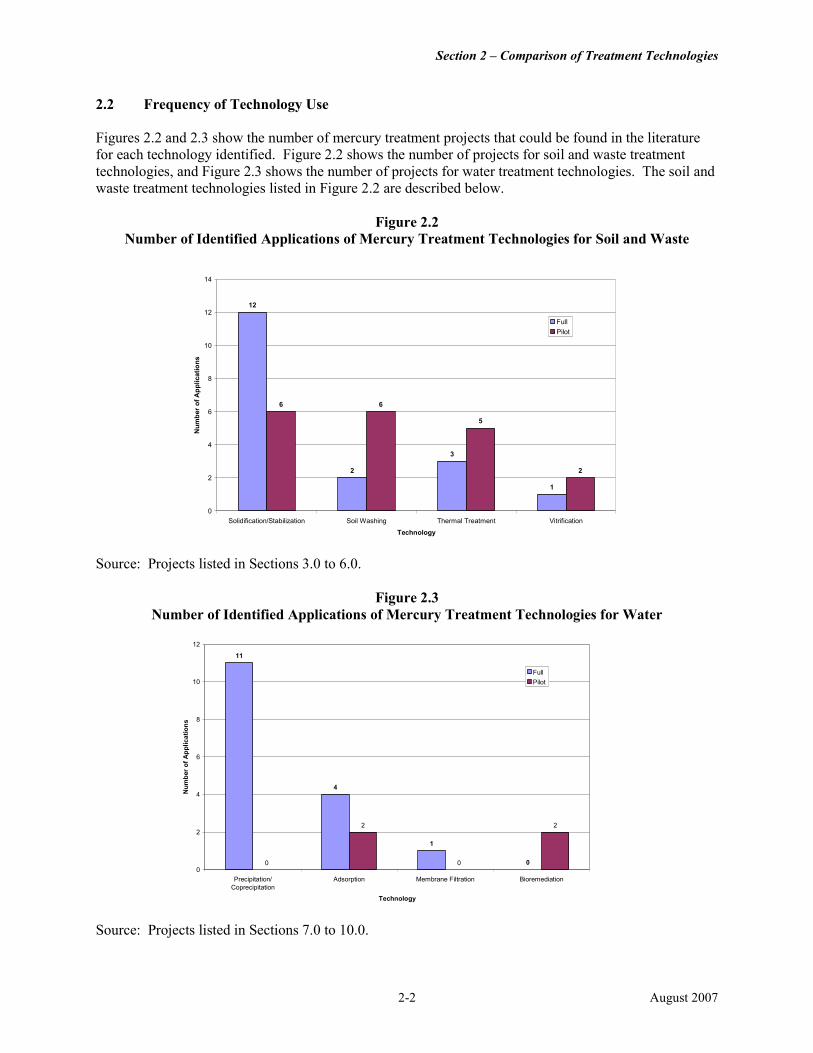
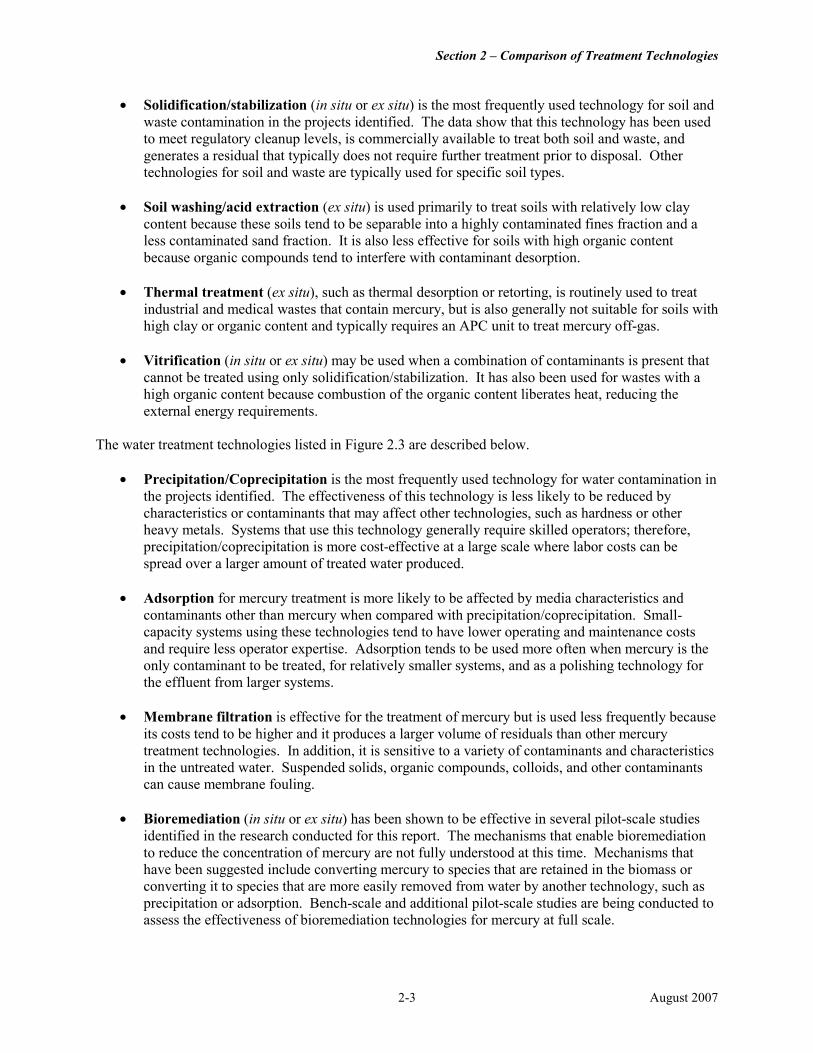
Figures 2.2 and 2.3 show the number of mercury treatment projects that could be found in the literature for each technology identified. Figure 2.2 shows the number of projects for soil and waste treatment technologies, and Figure 2.3 shows the number of projects for water treatment technologies. The soil and waste treatment technologies listed in Figure 2.2 are described below.
Figure 2.2 Number of Identified Applications of Mercury Treatment Technologies for Soil and Waste
14
12 12
Full
Pilot
10
Nu
mb
er o
f A
pp
lica
tio
ns
8
6 6 6
5
4 3
2 2 2
1
0
Solidification/Stabilization Soil Washing Thermal Treatment Vitrification
Technology
Source: Projects listed in Sections 3.0 to 6.0.
Figure 2.3 Number of Identified Applications of Mercury Treatment Technologies for Water
12
11
Full
10 Pilot
Nu
mb
er o
f A
pp
lica
tio
ns 8
6
4 4
2 2
1
2
0 0
Precipitation/ Coprecipitation
Adsorption
0
Membrane Filtration
Technology
0
Bioremediation
Source: Projects listed in Sections 7.0 to 10.0.
2-2 August 2007
Section 2 – Comparison of Treatment Technologies
• Solidification/stabilization (in situ or ex situ) is the most frequently used technology for soil and waste contamination in the projects identified. The data show that this technology has been used to meet regulatory cleanup levels, is commercially available to treat both soil and waste, and generates a residual that typically does not require further treatment prior to disposal. Other technologies for soil and waste are typically used for specific soil types.
• Soil washing/acid extraction (ex situ) is used primarily to treat soils with relatively low clay content because these soils tend to be separable into a highly contaminated fines fraction and a less contaminated sand fraction. It is also less effective for soils with high organic content because organic compounds tend to interfere with contaminant desorption.
• Thermal treatment (ex situ), such as thermal desorption or retorting, is routinely used to treat industrial and medical wastes that contain mercury, but is also generally not suitable for soils with high clay or organic content and typically requires an APC unit to treat mercury off-gas.
• Vitrification (in situ or ex situ) may be used when a combination of contaminants is present that cannot be treated using only solidification/stabilization. It has also been used for wastes with a high organic content because combustion of the organic content liberates heat, reducing the external energy requirements.
The water treatment technologies listed in Figure 2.3 are described below.
• Precipitation/Coprecipitation is the most frequently used technology for water contamination in the projects identified. The effectiveness of this technology is less likely to be reduced by characteristics or contaminants that may affect other technologies, such as hardness or other heavy metals. Systems that use this technology generally require skilled operators; therefore, precipitation/coprecipitation is more cost-effective at a large scale where labor costs can be spread over a larger amount of treated water produced.
• Adsorption for mercury treatment is more likely to be affected by media characteristics and contaminants other than mercury when compared with precipitation/coprecipitation. Small-capacity systems using these technologies tend to have lower operating and maintenance costs and require less operator expertise. Adsorption tends to be used more often when mercury is the only contaminant to be treated, for relatively smaller systems, and as a polishing technology for the effluent from larger systems.
• Membrane filtration is effective for the treatment of mercury but is used less frequently because its costs tend to be higher and it produces a larger volume of residuals than other mercury treatment technologies. In addition, it is sensitive to a variety of contaminants and characteristics in the untreated water. Suspended solids, organic compounds, colloids, and other contaminants can cause membrane fouling.
• Bioremediation (in situ or ex situ) has been shown to be effective in several pilot-scale studies identified in the research conducted for this report. The mechanisms that enable bioremediation to reduce the concentration of mercury are not fully understood at this time. Mechanisms that have been suggested include converting mercury to species that are retained in the biomass or converting it to species that are more easily removed from water by another technology, such as precipitation or adsorption. Bench-scale and additional pilot-scale studies are being conducted to assess the effectiveness of bioremediation technologies for mercury at full scale.
2-3 August 2007
Section 2 – Comparison of Treatment Technologies
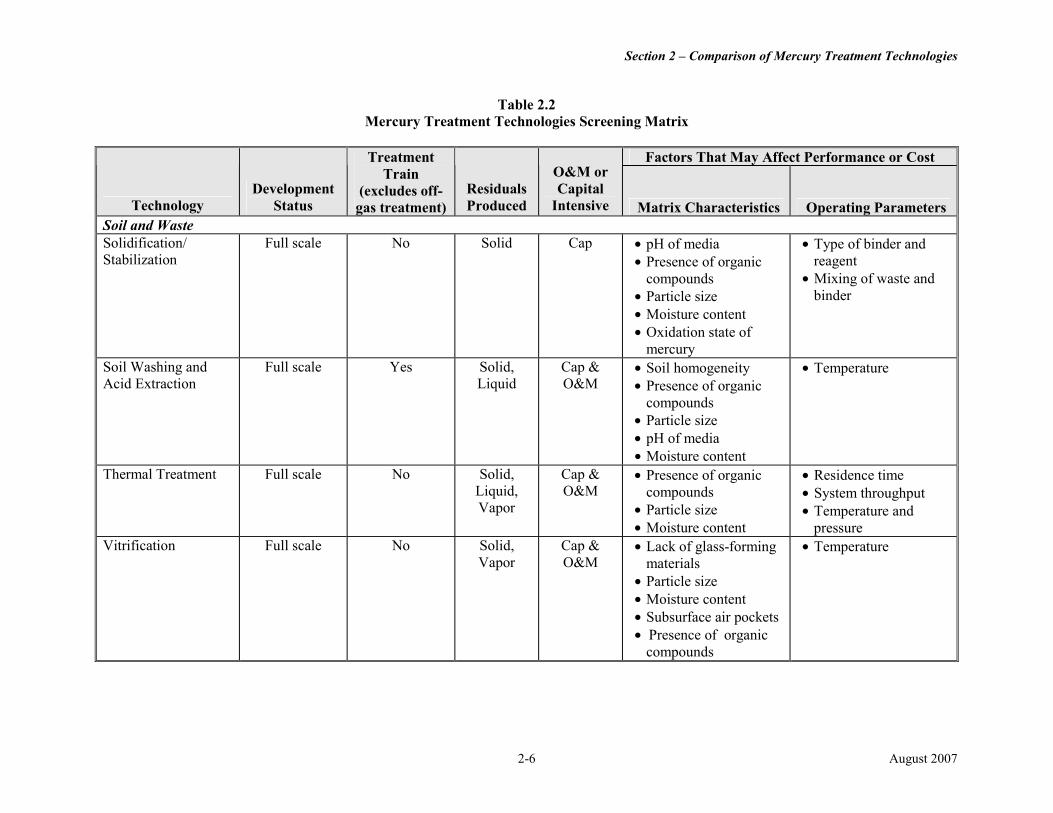
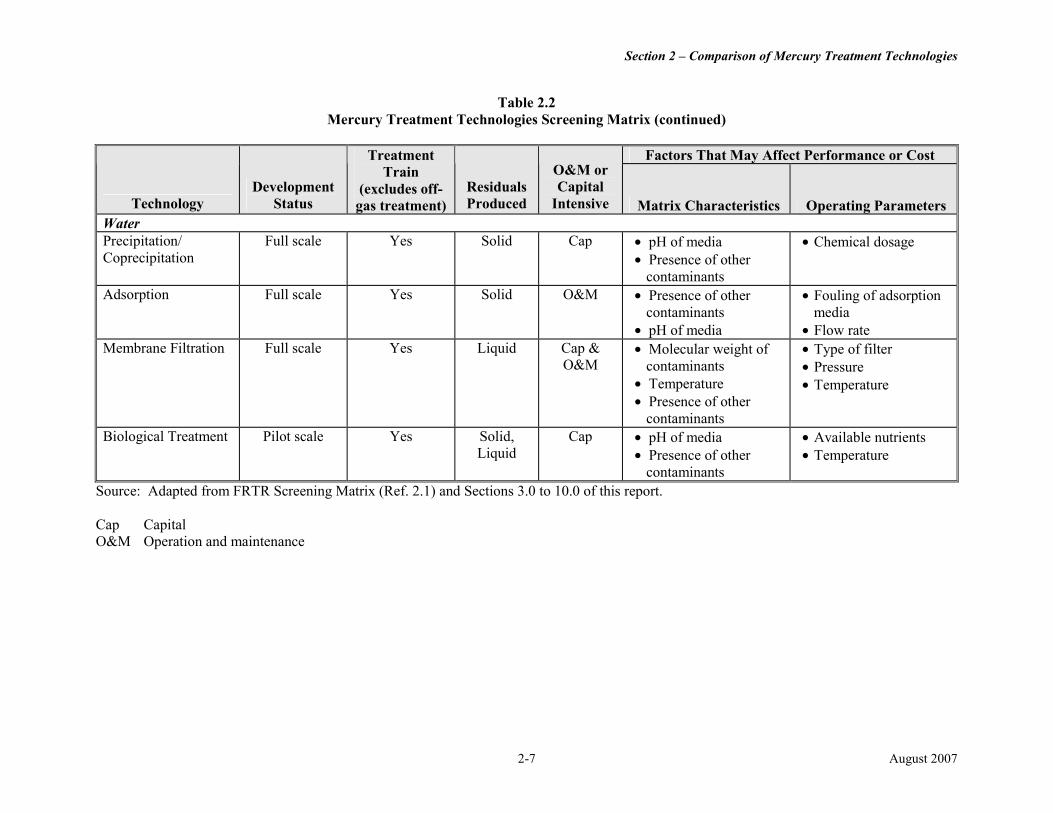
Table 2.2 is a screening matrix for mercury treatment technologies. It can assist decision-makers in evaluating candidate treatment technologies by providing information on relative availability, cost, and other factors for each technology. The matrix is based on the Federal Remediation Technologies Roundtable (FRTR) Treatment Technologies Screening Matrix (Ref. 2.2). However, it is limited to the technologies addressed in this report, and the technology evaluation criteria have been reassessed to compare the technologies only with those listed in Table 2.2, rather than all treatment technologies. In addition, the table includes information about the factors that affect technology cost and performance. Table 2.2 includes the following information:
• Development Status – The scale at which the technology has been applied. All technologies to treat mercury have been applied at full scale, with the exception of bioremediation, which is currently at pilot scale.
• Treatment Trains – “Yes” indicates that the technology is typically used in combination with other technologies, such as pretreatment or treatment of residuals (excluding offgas). “No” indicates that the technology is typically used independently.
• Residuals Produced – The residuals typically produced that may require additional management. All of the technologies generate a solid residual, with the exception of membrane filtration, which generates only liquid residuals. Vitrification and thermal treatment produce a vapor residual.
• O&M or Capital Intensive – This category indicates the main cost-intensive parts of the system. “O&M” indicates that the operation and maintenance costs tend to be high in comparison to other technologies. “Cap” indicates that capital costs tend to be high in comparison to other technologies.
• Factors that May Affect Performance or Cost – These include matrix characteristics and operating parameters for each technology that may affect mercury treatment performance or cost. These factors are described in more detail in Sections 3.0 through 10.0.
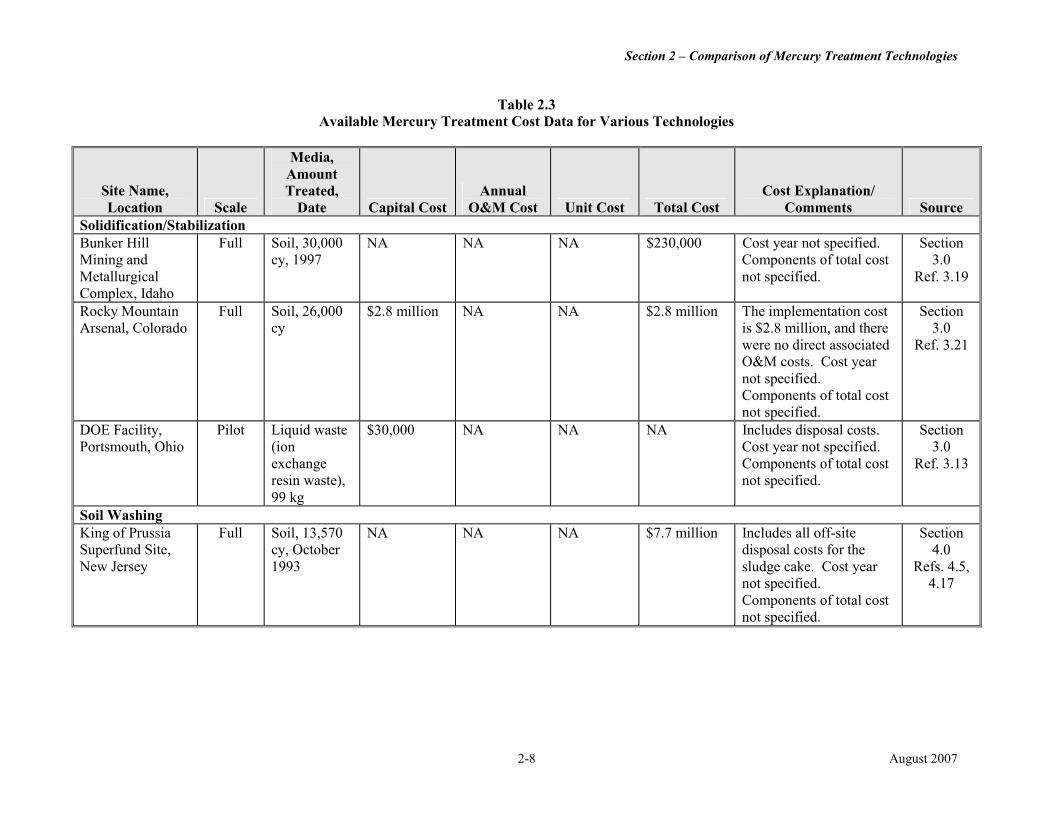
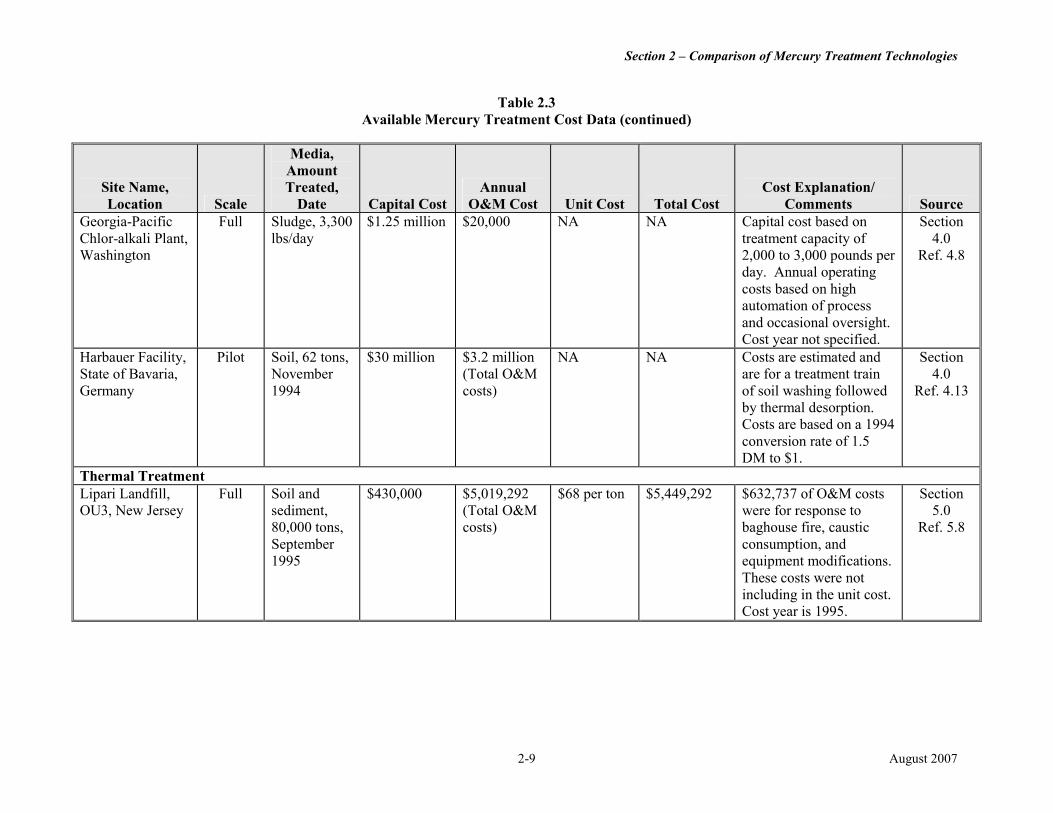
A limited amount of cost data on mercury treatment was found. Table 2.3 summarizes this information.
Considerations about the Performance and Cost Data Included in this Report
The information in this report is based on previously-compiled sources on mercury treatment and information gathered from readily-available data sources. The data were collected over a period of time (from December 2004 to January 2007), and the level of detail of the performance data varied among projects. Not all the source documents have been peer-reviewed, and most data were not independently verified. The remedial project managers (RPMs) for some Superfund sites were called, however, to verify existing data and obtain additional project information.
Some projects treated numerous contaminants, in addition to mercury. Therefore, mercury may not have been the target contaminant for these projects. In many cases, the cost information was incomplete. For example, some projects included data for O&M costs only, and did not specify the associated capital costs. In other cases, total costs were provided, but a breakdown of these costs was not included. No mercury-specific cost data were identified for some technologies.
The cost data were taken from many types of sources, including EPA, Department of Defense (DoD), other government sources, and information from technology vendors. The quality of these data varied, with some sources providing detailed information about the items included in the costs, while other
2-4 August 2007
c
Section 2 – Comparison of Treatment Technologies
sources provided little detail about the basis for costs. In most cases, the specific year for the costs was not provided. The costs in Table 2.3 are reported in the identified references and are not adjusted for inflation. This report does not provide a summary or interpretation of the costs in Table 2.3 because of the variation in the type and quality of information.
In general, Table 2.3 includes only costs specifically for treatment of mercury. General technology cost estimates are unlikely to accurately predict actual treatment costs because mercury treatment is waste- and site-specific.
Other Treatment Technologies for Mercury
This report identifies eight technologies used to treat mercury in soil, waste, and water. These technologies were selected based on the availability of project-specific information for mercury treatment. Other technologies (for example, ion exchange) may be reported as being able to treat mercury contamination but are not covered in this report because project data were not found in the references used.
Table 2.1 Applicability of Mercury Treatment Technologiesa
Technology Soil b Wastec
Water Groundwater and Surface Water d Wastewater e
Solidification/Stabilization � � Soil Washing and Acid Extraction
� �
Thermal Treatment � � Vitrification � � Precipitation/Coprecipitation � � Adsorption � � Membrane Filtration � Biological Treatment �
Source: Sections 3.0 to 10.0 of this report.
Notes: � Indicates treatment has been conducted at full or pilot scale.
a Media indicated here only if project-specific data are available. Some technologies may be applicable to more than one type of media.
b Soil includes soil, debris, sludge, sediments, and other solid-phase environmental media. Waste includes nonhazardous and hazardous solid waste generated by industry.
d Groundwater and surface water also includes mine drainage. e Wastewater includes nonhazardous and hazardous industrial wastewater and leachate.
2-5 August 2007
Section 2 – Comparison of Mercury Treatment Technologies
Table 2.2 Mercury Treatment Technologies Screening Matrix
Technology Development
Status
Treatment Train
(excludes off-gas treatment)
Residuals Produced
O&M or Capital
Intensive
Factors That May Affect Performance or Cost
Matrix Characteristics Operating Parameters Soil and Waste Solidification/ Stabilization
Full scale No Solid Cap • pH of media • Presence of organic
compounds • Particle size
• Type of binder and reagent
• Mixing of waste and binder
• Moisture content • Oxidation state of
mercury Soil Washing and Acid Extraction
Full scale Yes Solid, Liquid
Cap & O&M
• Soil homogeneity • Presence of organic
• Temperature
compounds • Particle size • pH of media • Moisture content
Thermal Treatment Full scale No Solid, Cap & • Presence of organic • Residence time Liquid, Vapor
O&M compounds • Particle size
• System throughput • Temperature and
• Moisture content pressure Vitrification Full scale No Solid,
Vapor Cap & O&M
• Lack of glass-forming materials
• Temperature
• Particle size • Moisture content • Subsurface air pockets • Presence of organic
compounds
2-6 August 2007
Section 2 – Comparison of Mercury Treatment Technologies
Table 2.2 Mercury Treatment Technologies Screening Matrix (continued)
Technology Development
Status
Treatment Train
(excludes off-gas treatment)
Residuals Produced
O&M or Capital
Intensive
Factors That May Affect Performance or Cost
Matrix Characteristics Operating Parameters Water Precipitation/ Full scale Yes Solid Cap • pH of media • Chemical dosage Coprecipitation • Presence of other
contaminants Adsorption Full scale Yes Solid O&M • Presence of other • Fouling of adsorption
contaminants media • pH of media • Flow rate
Membrane Filtration Full scale Yes Liquid Cap & O&M
• Molecular weight of contaminants
• Type of filter • Pressure
• Temperature • Presence of other
• Temperature
contaminants Biological Treatment Pilot scale Yes Solid, Cap • pH of media • Available nutrients
Liquid • Presence of other • Temperature contaminants
Source: Adapted from FRTR Screening Matrix (Ref. 2.1) and Sections 3.0 to 10.0 of this report.
Cap Capital O&M Operation and maintenance
2-7 August 2007
Section 2 – Comparison of Mercury Treatment Technologies
Table 2.3 Available Mercury Treatment Cost Data for Various Technologies
Media, Amount
Site Name, Treated, Annual Cost Explanation/ Location Scale Date Capital Cost O&M Cost Unit Cost Total Cost Comments Source
Solidification/Stabilization Bunker Hill Full Soil, 30,000 NA NA NA $230,000 Cost year not specified. Section Mining and cy, 1997 Components of total cost 3.0 Metallurgical not specified. Ref. 3.19 Complex, Idaho Rocky Mountain Arsenal, Colorado
Full Soil, 26,000 cy
$2.8 million NA NA $2.8 million The implementation cost is $2.8 million, and there were no direct associated
Section 3.0
Ref. 3.21 O&M costs. Cost year not specified. Components of total cost not specified.
DOE Facility, Portsmouth, Ohio
Pilot Liquid waste (ion
$30,000 NA NA NA Includes disposal costs. Cost year not specified.
Section 3.0
exchange resin waste),
Components of total cost not specified.
Ref. 3.13
99 kg Soil Washing King of Prussia Superfund Site,
Full Soil, 13,570 cy, October
NA NA NA $7.7 million Includes all off-site disposal costs for the
Section 4.0
New Jersey 1993 sludge cake. Cost year not specified.
Refs. 4.5, 4.17
Components of total cost not specified.
2-8 August 2007
Section 2 – Comparison of Mercury Treatment Technologies
Table 2.3 Available Mercury Treatment Cost Data (continued)
Media, Amount
Site Name, Treated, Annual Cost Explanation/ Location Scale Date Capital Cost O&M Cost Unit Cost Total Cost Comments Source
Georgia-Pacific Full Sludge, 3,300 $1.25 million $20,000 NA NA Capital cost based on Section Chlor-alkali Plant, Washington
lbs/day treatment capacity of 2,000 to 3,000 pounds per day. Annual operating
4.0 Ref. 4.8
costs based on high automation of process and occasional oversight. Cost year not specified.
Harbauer Facility, State of Bavaria, Germany
Pilot Soil, 62 tons, November 1994
$30 million $3.2 million (Total O&M costs)
NA NA Costs are estimated and are for a treatment train of soil washing followed by thermal desorption. Costs are based on a 1994
Section 4.0
Ref. 4.13
conversion rate of 1.5 DM to $1.
Thermal Treatment Lipari Landfill, OU3, New Jersey
Full Soil and sediment, 80,000 tons, September 1995
$430,000 $5,019,292 (Total O&M costs)
$68 per ton $5,449,292 $632,737 of O&M costs were for response to baghouse fire, caustic consumption, and equipment modifications. These costs were not
Section 5.0
Ref. 5.8
including in the unit cost. Cost year is 1995.
2-9 August 2007
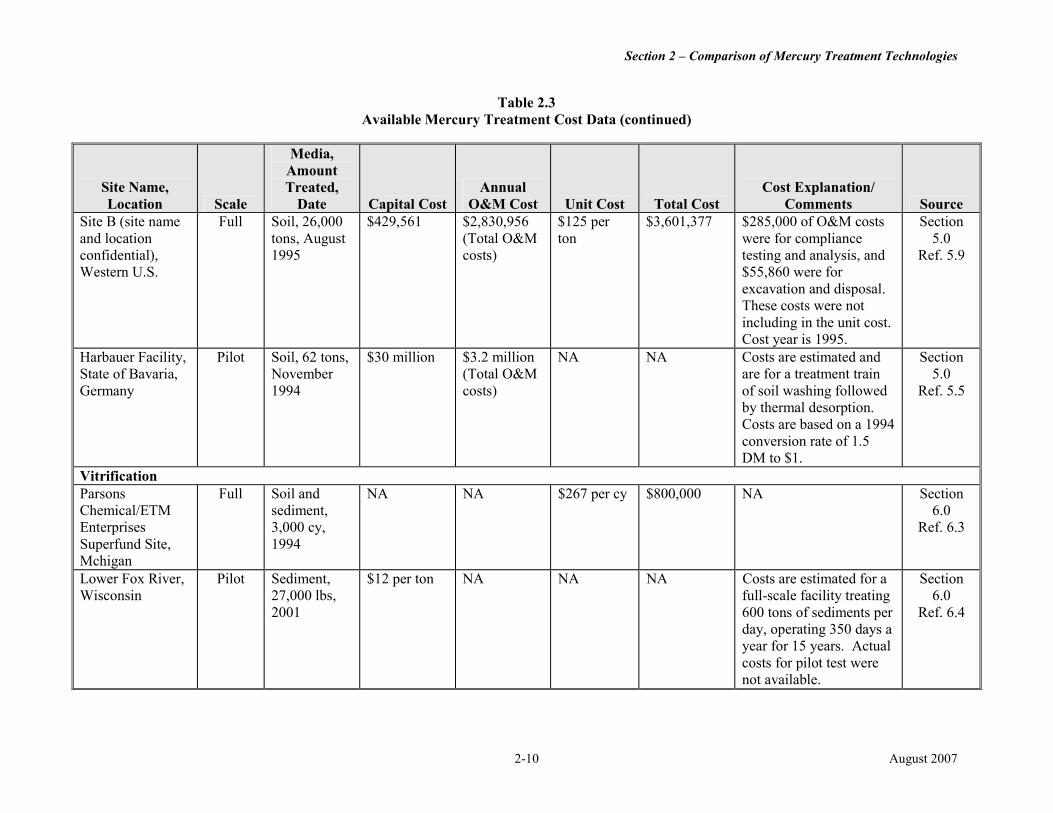
Section 2 – Comparison of Mercury Treatment Technologies
Table 2.3 Available Mercury Treatment Cost Data (continued)
Media, Amount
Site Name, Treated, Annual Cost Explanation/ Location Scale Date Capital Cost O&M Cost Unit Cost Total Cost Comments Source
Site B (site name and location confidential), Western U.S.
Full Soil, 26,000 tons, August 1995
$429,561 $2,830,956 (Total O&M costs)
$125 per ton
$3,601,377 $285,000 of O&M costs were for compliance testing and analysis, and $55,860 were for
Section 5.0
Ref. 5.9
excavation and disposal. These costs were not including in the unit cost. Cost year is 1995.
Harbauer Facility, State of Bavaria, Germany
Pilot Soil, 62 tons, November 1994
$30 million $3.2 million (Total O&M costs)
NA NA Costs are estimated and are for a treatment train of soil washing followed by thermal desorption. Costs are based on a 1994
Section 5.0
Ref. 5.5
conversion rate of 1.5 DM to $1.
Vitrification Parsons Full Soil and NA NA $267 per cy $800,000 NA Section Chemical/ETM sediment, 6.0 Enterprises 3,000 cy, Ref. 6.3 Superfund Site, 1994 Mchigan Lower Fox River, Wisconsin
Pilot Sediment, 27,000 lbs,
$12 per ton NA NA NA Costs are estimated for a full-scale facility treating
Section 6.0
2001 600 tons of sediments per day, operating 350 days a year for 15 years. Actual
Ref. 6.4
costs for pilot test were not available.
2-10 August 2007
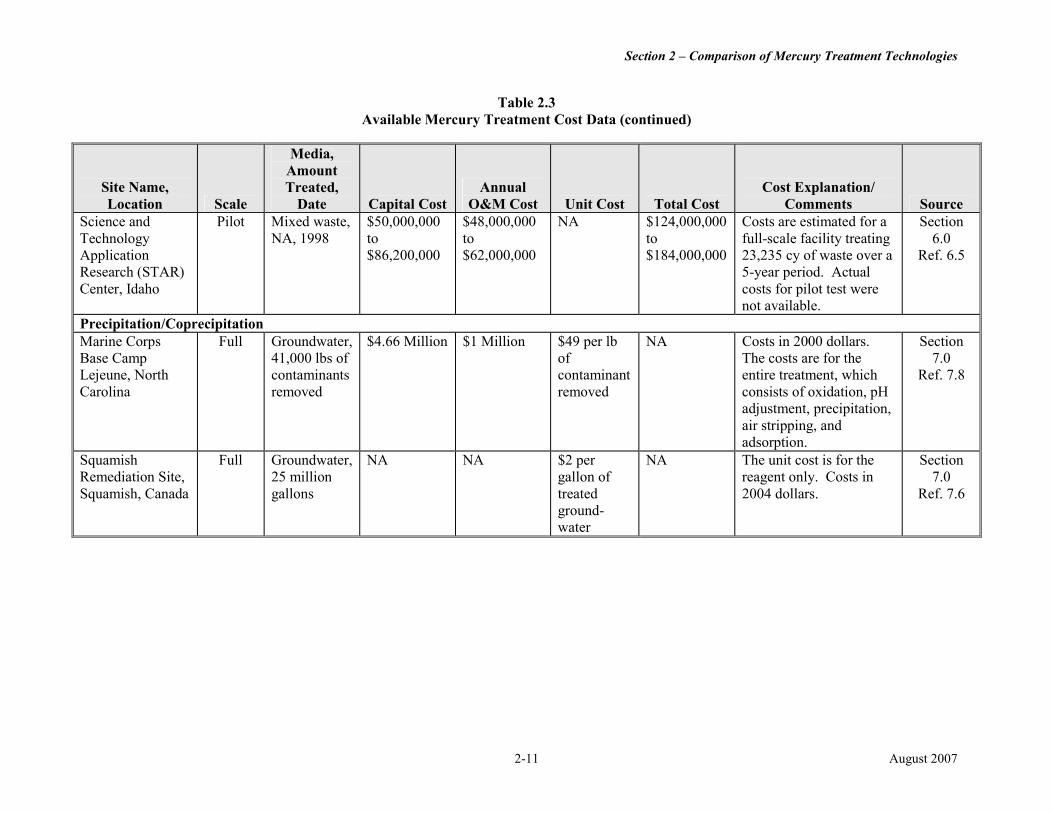
Section 2 – Comparison of Mercury Treatment Technologies
Table 2.3 Available Mercury Treatment Cost Data (continued)
Media, Amount
Site Name, Treated, Annual Cost Explanation/ Location Scale Date Capital Cost O&M Cost Unit Cost Total Cost Comments Source
Science and Pilot Mixed waste, $50,000,000 $48,000,000 NA $124,000,000 Costs are estimated for a Section Technology NA, 1998 to to to full-scale facility treating 6.0 Application $86,200,000 $62,000,000 $184,000,000 23,235 cy of waste over a Ref. 6.5 Research (STAR) 5-year period. Actual Center, Idaho costs for pilot test were
not available. Precipitation/Coprecipitation Marine Corps Base Camp Lejeune, North
Full Groundwater, 41,000 lbs of contaminants
$4.66 Million $1 Million $49 per lb of contaminant
NA Costs in 2000 dollars. The costs are for the entire treatment, which
Section 7.0
Ref. 7.8 Carolina removed removed consists of oxidation, pH
adjustment, precipitation, air stripping, and adsorption.
Squamish Full Groundwater, NA NA $2 per NA The unit cost is for the Section Remediation Site, 25 million gallon of reagent only. Costs in 7.0 Squamish, Canada gallons treated 2004 dollars. Ref. 7.6
groundwater
2-11 August 2007
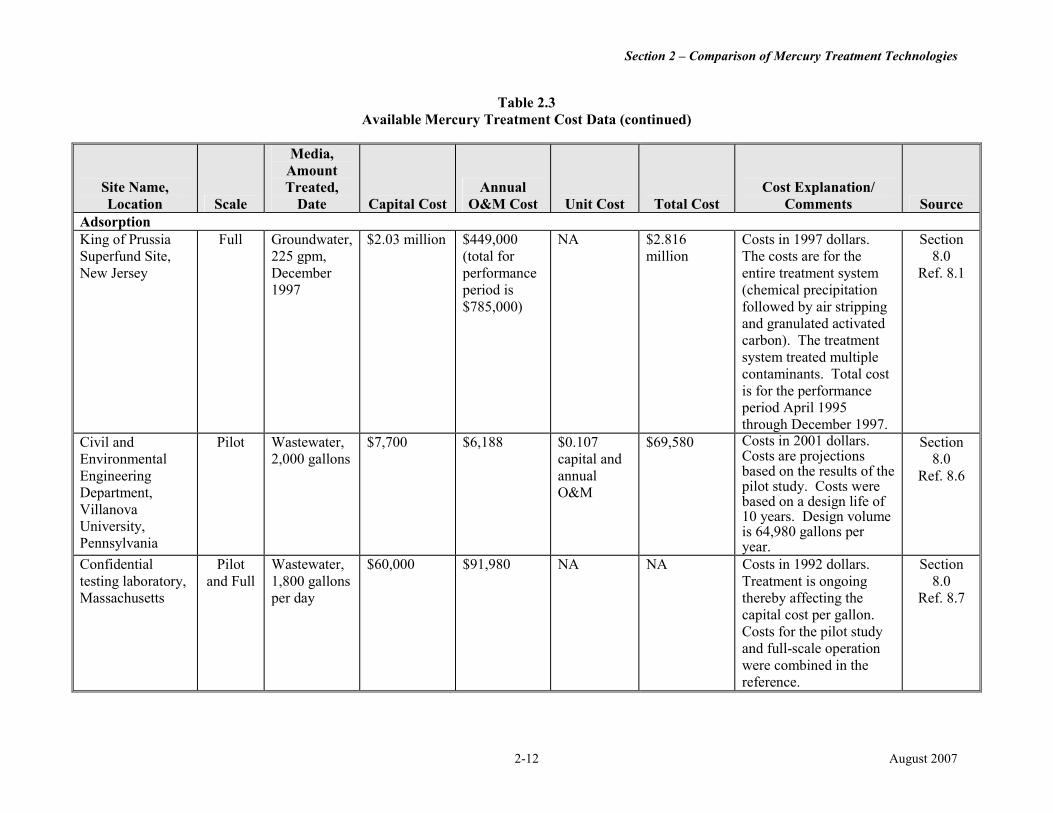
Section 2 – Comparison of Mercury Treatment Technologies
Table 2.3 Available Mercury Treatment Cost Data (continued)
Media, Amount
Site Name, Treated, Annual Cost Explanation/ Location Scale Date Capital Cost O&M Cost Unit Cost Total Cost Comments Source
Adsorption King of Prussia Superfund Site, New Jersey
Full Groundwater, 225 gpm, December 1997
$2.03 million $449,000 (total for performance period is $785,000)
NA $2.816 million
Costs in 1997 dollars. The costs are for the entire treatment system (chemical precipitation followed by air stripping and granulated activated carbon). The treatment system treated multiple contaminants. Total cost
Section 8.0
Ref. 8.1
is for the performance period April 1995 through December 1997.
Civil and Environmental Engineering Department, Villanova University, Pennsylvania
Pilot Wastewater, 2,000 gallons
$7,700 $6,188 $0.107 capital and annual O&M
$69,580 Costs in 2001 dollars. Costs are projections based on the results of the pilot study. Costs were based on a design life of 10 years. Design volume is 64,980 gallons per year.
Section 8.0
Ref. 8.6
Confidential Pilot Wastewater, $60,000 $91,980 NA NA Costs in 1992 dollars. Section testing laboratory, Massachusetts
and Full 1,800 gallons per day
Treatment is ongoing thereby affecting the capital cost per gallon. Costs for the pilot study and full-scale operation were combined in the
8.0 Ref. 8.7
reference.
2-12 August 2007
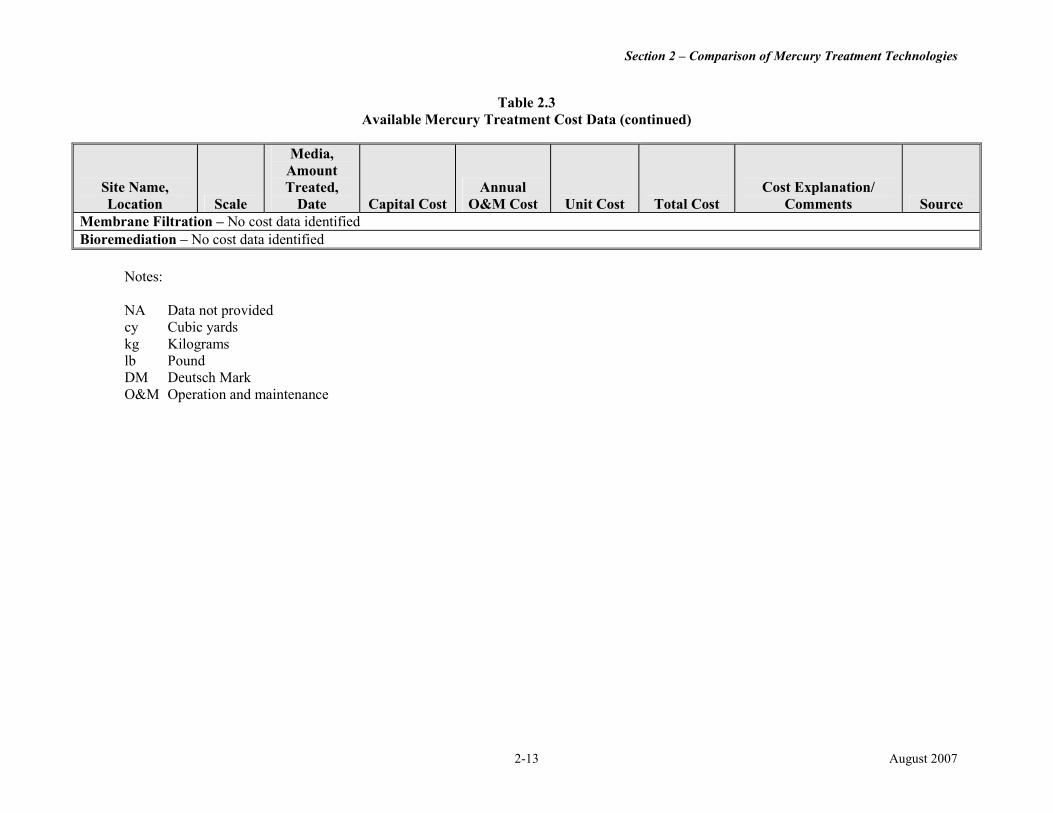
Section 2 – Comparison of Mercury Treatment Technologies
Table 2.3 Available Mercury Treatment Cost Data (continued)
Site Name, Location Scale
Media, Amount Treated,
Date Capital Cost Annual
O&M Cost Unit Cost Total Cost Cost Explanation/
Comments Source Membrane Filtration – No cost data identified Bioremediation – No cost data identified
Notes:
NA Data not provided cy Cubic yards kg Kilograms lb Pound DM Deutsch Mark O&M Operation and maintenance
2-13 August 2007
Section 2 – Comparison of Mercury Treatment Technologies
References
2.1 Occupational Safety and Health Guideline for Mercury Vapor. U.S. Department of Labor. Occupational Safety and Health Administration. Accessed January 2007. http://www.osha.gov/SLTC/healthguidelines/mercuryvapor/recognition.html.
2.2 Federal Remediation Technologies Reference Guide and Screening Manual, Version 4.0. 2004. Federal Remediation Technologies Roundtable. June. http://www.frtr.gov/matrix2/section3/table3_2.html.
2-14 August 2007
PART II
MERCURY TREATMENT TECHNOLOGY SUMMARIES

This page is intentionally left blank.
PART IIA
TREATMENT TECHNOLOGIES APPLICABLE TO SOIL AND WASTE

This page is intentionally left blank.
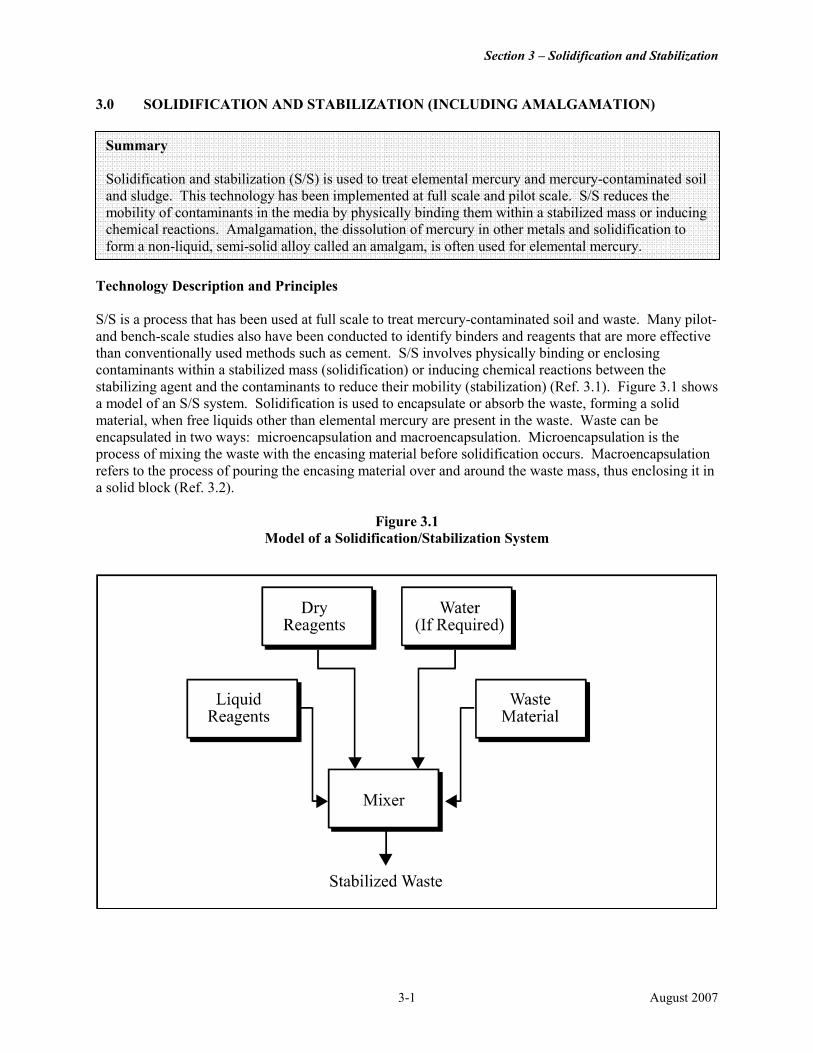
Section 3 – Solidification and Stabilization
3.0 SOLIDIFICATION AND STABILIZATION (INCLUDING AMALGAMATION)
Summary Solidification and stabilization (S/S) is used to treat elemental mercury and mercury-contaminated soil and sludge. This technology has been implemented at full scale and pilot scale. S/S reduces the mobility of contaminants in the media by physically binding them within a stabilized mass or inducing chemical reactions. Amalgamation, the dissolution of mercury in other metals and solidification to form a non-liquid, semi-solid alloy called an amalgam, is often used for elemental mercury.
Technology Description and Principles S/S is a process that has been used at full scale to treat mercury-contaminated soil and waste. Many pilot- and bench-scale studies also have been conducted to identify binders and reagents that are more effective than conventionally used methods such as cement. S/S involves physically binding or enclosing contaminants within a stabilized mass (solidification) or inducing chemical reactions between the stabilizing agent and the contaminants to reduce their mobility (stabilization) (Ref. 3.1). Figure 3.1 shows a model of an S/S system. Solidification is used to encapsulate or absorb the waste, forming a solid material, when free liquids other than elemental mercury are present in the waste. Waste can be encapsulated in two ways: microencapsulation and macroencapsulation. Microencapsulation is the process of mixing the waste with the encasing material before solidification occurs. Macroencapsulation refers to the process of pouring the encasing material over and around the waste mass, thus enclosing it in a solid block (Ref. 3.2).
Figure 3.1 Model of a Solidification/Stabilization System
3-1 August 2007
Section 3 – Solidification and Stabilization
The stabilization process involves mixing soil or waste with binders such as Portland cement, sulfur polymer cement (SPC), sulfide and phosphate binders, cement kiln dust, polyester resins, or polysiloxane compounds to create a slurry, paste, or other semi-liquid state, which is allowed time to cure into a solid form. For ex situ S/S processes that involve polyester resins, the resin and the waste are mixed at a low rate for 5 to 10 minutes until a homogeneous mixture is formed. A catalyst is then added to this mixture to initiate a polymerization reaction and mixing continues at a high rate for another 2 to 5 minutes until a rise in temperature signals the inception of curing. This waste-resin mixture is then allowed to cool down to harden (Ref. 3.16). EPA has identified amalgamation as the best demonstrated available technology (BDAT) for treatment of liquid elemental mercury contaminated with radioactive materials (Ref. 3.3). Amalgamation is the dissolution and solidification of mercury in other metals such as copper, nickel, zinc and tin, resulting in a solid, nonvolatile product. It is a subset of solidification technologies, and it does not involve a chemical reaction. Two generic processes are used for amalgamating mercury in wastes: aqueous and non-aqueous replacement. The aqueous process involves mixing a finely divided base metal such as zinc or copper into a wastewater that contains dissolved mercury salts; the base metal reduces mercuric and mercurous salts to elemental mercury, which dissolves in the metal to form a solid mercury-based metal alloy called amalgam. The non-aqueous process involves mixing finely divided metal powders into waste liquid mercury, forming a solidified amalgam. The aqueous replacement process is applicable to both mercury salts and elemental mercury, while the non-aqueous process is applicable only to elemental mercury (Ref. 3.4). However, mercury in the resultant amalgam is susceptible to volatilization or hydrolysis. Therefore, amalgamation is typically used in combination with an encapsulation technology (Ref. 3.5). The resulting material must be disposed and must meet LDRs. The S/S process may also include addition of pH adjustment agents, phosphates, or sulfur reagents to reduce the setting or curing time, increase the compressive strength, or reduce the leachability of contaminants (Refs. 3.6, 3.7). Information gathered for this report included 18 projects that treated soil or waste containing mercury using S/S. Twelve projects are full-scale applications, and six are at pilot scale.
Technology Description: S/S reduces the mobility of hazardous substances and contaminants in the environment through both physical and chemical means. It physically binds or encloses contaminants within a stabilized mass and chemically reduces the hazard potential of a waste by converting the contaminants into less soluble, mobile, or toxic forms. Amalgamation is typically used to immobilize elemental mercury by dissolving the mercury in another metal to form a semisolid alloy known as an amalgam. The process is a physical immobilization and is often combined with encapsulation to prevent volatization of mercury from the amalgam. Media Treated:
• Soil • Sludge • Other solids • Liquid wastes • Industrial waste • Elemental (liquid) mercury
3-2 August 2007
Section 3 – Solidification and Stabilization
Technology Description (continued) Binders and Reagents Used in S/S of Mercury:
• Cement • Calcium polysulfide • Chemically bonded phosphate ceramics (CBPC) • Phosphate • Platinum • Polyester resins • Polymer beads • Polysiloxane compounds (silicon hydride and silicon hydroxide) • pH adjustment agents • Sodium dithiocarbamate • Sodium metasilicate • Sodium sulfide • Sulfur polymer cement (SPC)
Binders and Reagents used in Amalgamation of Mercury:
• Copper • Tin • Nickel • Zinc
Applicability, Advantages, and Limitations S/S renders mercury more stable and less leachable. However, S/S does not reduce the total mercury content of the waste. Instead, it reduces the leachability of mercury, yielding a product that still may require disposal in a landfill. S/S often increased the volume of contaminated materials (Ref. 3.12). The applicability of S/S depends on the mobility of mercury, which in turn depends on its oxidation state, the pH of the waste disposal environment, and the specific mercury compound contained in the waste (Ref. 3.6). This mobility is usually measured by testing the leachability of mercury under acidic conditions. Typically, the leachability of mercury increases with a decrease in pH. Therefore, acidic environments may increase the mobility of mercury in stabilized waste. Some studies also suggest that soluble compounds of mercury, such as mercurous sulfate and mercuric sulfate, may form at a higher pH (Ref. 3.2). This complex behavior of mercury in various disposal environments makes it a challenging contaminant to treat. Some S/S processes involve pretreatment of the waste with reagents such as sodium sulfide to convert mercury to a less soluble form (in this case, mercuric sulfide) before stabilization (Refs. 3.6, 3.8, 3.15). Other additives include pH buffers, catalysts such as platinum and sodium sulfide, and other proprietary chemical agents. These processes may render the waste less mobile under a variety of disposal conditions, but also may be more costly by adding more treatment steps.
3-3 August 2007
Section 3 – Solidification and Stabilization
Factors that Affect S/S Performance and Cost General factors:
• pH and redox potential: The pH and oxidizing or reducing properties of the waste and waste disposal environment may affect the leachability of the treated material because these factors affect the solubility of mercury and its leachability (Refs. 3.2, 3.11).
• Waste characteristics: Certain non-mercury compounds in the waste may interact with the chemical reagents used in S/S, thus affecting the performance of the stabilization process. For example, high concentrations of chloride in the waste may render phosphate additive ineffective in stabilizing mercury (Ref. 3.10). Stabilization of dry wastes may be easier and less expensive when compared with S/S of liquid wastes (Ref. 3.13).
• Particle size distribution: Fine particulate matter coats the waste particles and weakens the bond between the waste and the binder (Ref. 3.18). Large aggregates in the waste could affect operation of the mixer (Ref. 3.3).
• Mixing: Thorough mixing is necessary to ensure that the waste particles are coated with the binder.
• Type of binder and reagent: The effectiveness of S/S depends in part on using the right type of binder and reagent. The use of proprietary binders or reagents may be more expensive than non-proprietary binders.
• Moisture content: For certain binders to be effective, the waste to be stabilized needs to have a specific moisture content. Therefore, the waste may need to be pretreated to remove the moisture (Ref. 3.2)
• Equipment scale: Application of S/S at large scale may reduce the unit costs when compared with a small-scale application.
Factors specific to S/S of mercury-contaminated media:
• Oxidation state: The specific mercury compound or oxidation state of mercury may affect the leachability of the treated material because these factors affect the solubility of mercury. In addition, the presence of more than one species of mercury may complicate the treatment process.
• Amount of mercury in waste: A higher concentration of mercury in waste may result in a higher concentration of mercury in the leachate.
Type, Number, and Scale of Identified Projects S/S of soil and waste that contain mercury has been applied at the full scale and tested at the pilot and bench scales. Data sources used for this report included information about 12 full-scale and six pilot-scale applications of S/S to treat mercury. All of the full-scale applications identified at sites in the U.S. are at Superfund sites. Summary of Performance and Cost Data Table 3.1 summarizes information for the 12 full-scale and six pilot-scale projects. The performance of S/S treatment is usually measured by leach testing a sample of the stabilized mass. Among the full-scale projects, the media treated include soil and sludge. The amount of media treated ranged between 5,000 and 83,000 cubic yards. Site types include metal mining and smelting; landfills; chemical or radioactive products manufacturing, and wood preserving. Performance data were available for six of the 12 full-scale projects. Of the six projects, three were conducted in the United States (Projects 1, 2, and 6); the other three were conducted in Canada (Projects 3, 4, and 5). The final leachable mercury concentrations
3-4 August 2007
Section 3 – Solidification and Stabilization
were for 0.05 mg/L for Projects 1, 0.024 mg/L for Project 2, and 0.2 mg/L for Project 6. The final leachable mercury concentrations were 0.01 to 0.04 mg/L for Project 3, 0.05 to 0.105 mg/L for Project 4, and 0.0172 mg/L (first trial) and 0.0728 mg/L (second trial) for Project 6. The regulatory standard in Canada specifies a treatment goal of 0.2 mg/L mercury TCLP before it can be disposed in a nonhazardous landfill. All three projects met the standard. Performance data were available for all of the pilot-scale projects. The media treated in the projects include soil, sludge, ion exchange resin waste, mine tailings, and elemental mercury. The quantity of media treated ranged from 0.45 kilograms to 330 kilograms. Various types of binders and stabilizing agents were used, including Portland cement, sodium dithiocarbamate, sodium metasilicate, and proprietary stabilizing agents. Performance data show that the final concentration of mercury in the leachate was reduced to below 0.025 mg/L for all six projects. The data sources used for this report did not contain any information about the long-term stability of mercury-containing soil and waste treated using S/S. Table 3.2 provides cost data for three projects, two full scale and one pilot scale.
Case Study: Allied Technology Group Mercury Stabilization Process The S/S process was applied at the pilot scale on soils excavated from a Brookhaven National Laboratory (BNL) facility (Ref. 3.9). These soils contained approximately 4,000 mg/kg of mercury. The initial concentration of mercury in the TCLP leachate was 0.282 mg/L. The soil was split into two parts, and each part was treated with a different stabilizing agent in a 7 cubic foot Essick mortar mixer. One portion of the soil was treated with sodium dithiocarbamate (DTC), which reduced the mercury levels in soil to 0.0139 mg/L (TCLP). The other portion of soil was treated with a liquid sulfide formulation, which resulted in a final concentration of 0.002 mg/L of mercury in the TCLP leachate (Project 13, Table 3.1). Both DTC and liquid sulfide additive reduced mercury to below the regulatory limit (less than 0.025 mg/L in TCLP leachate). A total of 200 kilograms of contaminated soil was treated by the end of this project, in November 2000.
Case Study: Brookhaven Chemical Holes BNL conducted pilot-scale studies to demonstrate treatment of liquid elemental mercury and soils contaminated with mercury using S/S (Ref. 3.3). The treatment process, known as Sulfur Polymer Stabilization/Solidification (SPSS), involved use of SPC as the binding agent. The mercury-contaminated soil was mixed along with the binding and stabilizing agents in a 1 cubic foot pilot-scale vertical cone blender/dryer. SPC was added to the blender first in order to “lubricate” the walls of the mixer, followed by the soil, and another layer of SPC. The soil/SPC mixture was mixed for approximately 3 hours at 40±5 °C. The temperature of the cone blender was then increased to 100 °C to reduce moisture in the soil. After the soil had dried, SPC chips were added to the blender, and the temperature was increased to 135±5 °C to melt the SPC and encapsulate the chemically stabilized mercury waste.
3-5 August 2007
Section 3 – Solidification and Stabilization
Case Study: Brookhaven Chemical Holes (continued) There was a slight variation in the treatment process for elemental mercury. First, SPC was added to the blender, followed by liquid mercury in small fractions. This mixture was mixed for approximately 4 hours until the color of the powder changed from bright yellow to dark grey or black, indicating that mercuric sulfide had formed. The vessel temperature was raised to the melting point of SPC (135±5 °C) to encapsulate the mercury. Off-gas generated in this process was passed through an off-gas treatment unit composed of a heat exchanger, a liquid nitrogen cryogenic trap, and an activated carbon filter, before it was vented to the atmosphere. Initial concentrations of leachable mercury in soil ranged from 0.2 to 0.91 mg/L. The concentrations of leachable mercury in the stabilized soil ranged from 0.0005 to 0.016 mg/L (Project 17, Table 3.1). Initial concentrations of leachable mercury were not available for the samples of liquid elementary mercury. Final leachable concentrations for the SPSS-treated elemental mercury ranged from less than 0.0004 to 0.004 mg/L (Project 18, Table 3.1). A total of 330 kilograms of contaminated soil and approximately 62 kilograms of elemental mercury were treated during this project.
3-6 August 2007
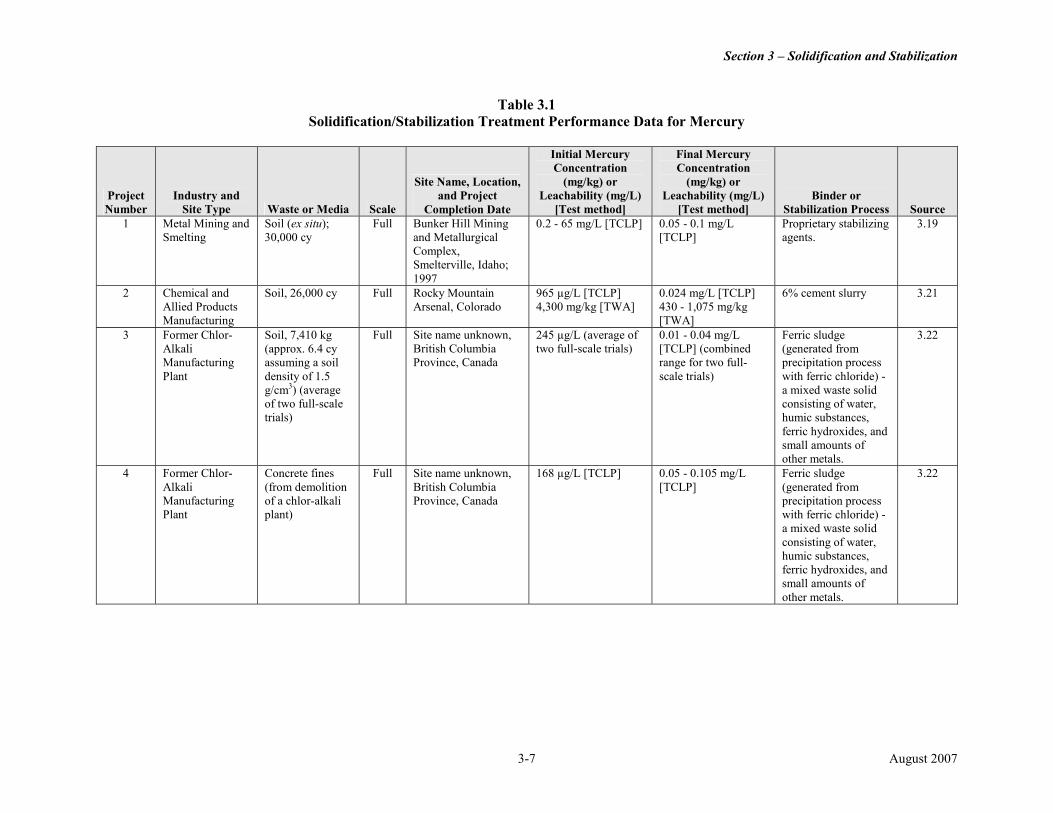
Section 3 – Solidification and Stabilization
Table 3.1 Solidification/Stabilization Treatment Performance Data for Mercury
Initial Mercury Concentration
Final Mercury Concentration
Project Number
Industry and Site Type Waste or Media Scale
Site Name, Location, and Project
Completion Date
(mg/kg) or Leachability (mg/L)
[Test method]
(mg/kg) or Leachability (mg/L)
[Test method] Binder or
Stabilization Process Source 1 Metal Mining and
Smelting Soil (ex situ); 30,000 cy
Full Bunker Hill Mining and Metallurgical Complex, Smelterville, Idaho;
0.2 - 65 mg/L [TCLP] 0.05 - 0.1 mg/L [TCLP]
Proprietary stabilizing agents.
3.19
1997 2 Chemical and Soil, 26,000 cy Full Rocky Mountain 965 µg/L [TCLP] 0.024 mg/L [TCLP] 6% cement slurry 3.21
Allied Products Arsenal, Colorado 4,300 mg/kg [TWA] 430 - 1,075 mg/kg Manufacturing [TWA]
3 Former Chlor-Alkali Manufacturing Plant
Soil, 7,410 kg (approx. 6.4 cy assuming a soil density of 1.5 g/cm3) (average of two full-scale trials)
Full Site name unknown, British Columbia Province, Canada
245 µg/L (average of two full-scale trials)
0.01 - 0.04 mg/L [TCLP] (combined range for two full-scale trials)
Ferric sludge (generated from precipitation process with ferric chloride) - a mixed waste solid consisting of water, humic substances, ferric hydroxides, and small amounts of other metals.
3.22
4 Former Chlor-Alkali Manufacturing Plant
Concrete fines (from demolition of a chlor-alkali plant)
Full Site name unknown, British Columbia Province, Canada
168 µg/L [TCLP] 0.05 - 0.105 mg/L [TCLP]
Ferric sludge (generated from precipitation process with ferric chloride) - a mixed waste solid
3.22
consisting of water, humic substances, ferric hydroxides, and small amounts of other metals.
3-7 August 2007
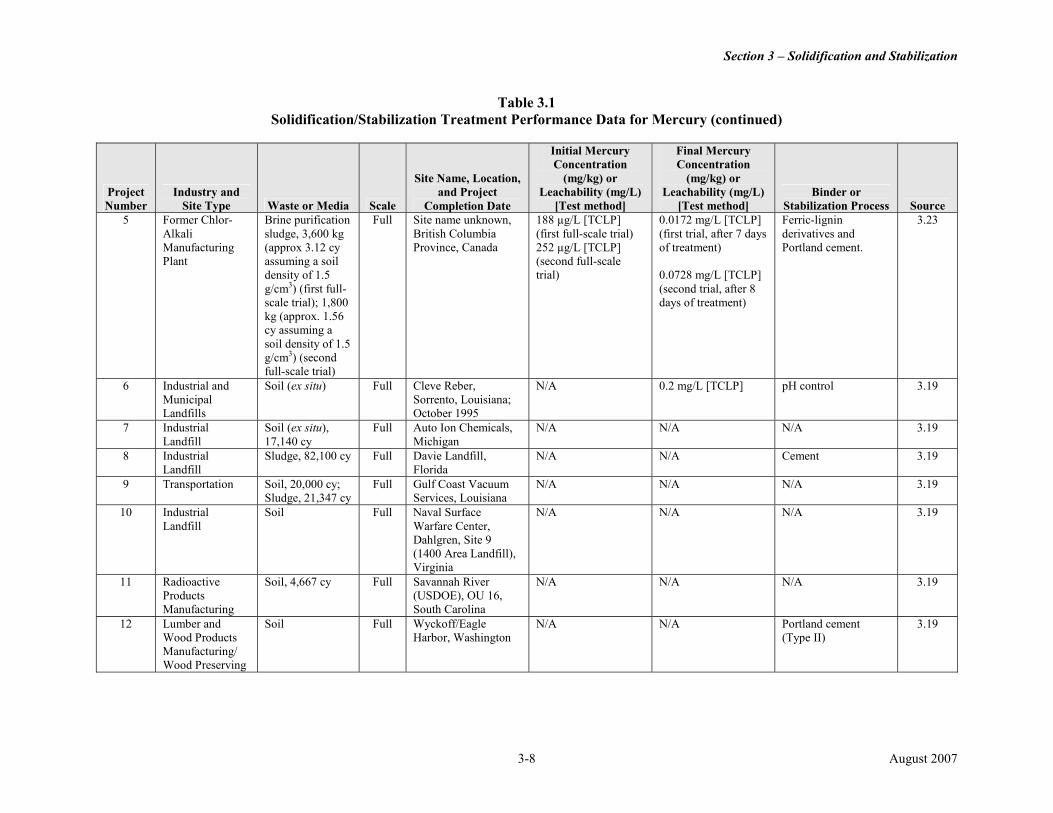
Section 3 – Solidification and Stabilization
Table 3.1 Solidification/Stabilization Treatment Performance Data for Mercury (continued)
Initial Mercury Concentration
Final Mercury Concentration
Project Number
Industry and Site Type Waste or Media Scale
Site Name, Location, and Project
Completion Date
(mg/kg) or Leachability (mg/L)
[Test method]
(mg/kg) or Leachability (mg/L)
[Test method] Binder or
Stabilization Process Source 5 Former Chlor-
Alkali Manufacturing Plant
Brine purification sludge, 3,600 kg (approx 3.12 cy assuming a soil density of 1.5 g/cm3) (first full-scale trial); 1,800 kg (approx. 1.56 cy assuming a soil density of 1.5 g/cm3) (second full-scale trial)
Full Site name unknown, British Columbia Province, Canada
188 µg/L [TCLP] (first full-scale trial) 252 µg/L [TCLP] (second full-scale trial)
0.0172 mg/L [TCLP] (first trial, after 7 days of treatment)
0.0728 mg/L [TCLP] (second trial, after 8 days of treatment)
Ferric-lignin derivatives and Portland cement.
3.23
6 Industrial and Soil (ex situ) Full Cleve Reber, N/A 0.2 mg/L [TCLP] pH control 3.19 Municipal Sorrento, Louisiana; Landfills October 1995
7 Industrial Landfill
Soil (ex situ), 17,140 cy
Full Auto Ion Chemicals, Michigan
N/A N/A N/A 3.19
8 Industrial Landfill
Sludge, 82,100 cy Full Davie Landfill, Florida
N/A N/A Cement 3.19
9 Transportation Soil, 20,000 cy; Sludge, 21,347 cy
Full Gulf Coast Vacuum Services, Louisiana
N/A N/A N/A 3.19
10 Industrial Soil Full Naval Surface N/A N/A N/A 3.19 Landfill Warfare Center,
Dahlgren, Site 9 (1400 Area Landfill), Virginia
11 Radioactive Soil, 4,667 cy Full Savannah River N/A N/A N/A 3.19 Products (USDOE), OU 16, Manufacturing South Carolina
12 Lumber and Wood Products Manufacturing/ Wood Preserving
Soil Full Wyckoff/Eagle Harbor, Washington
N/A N/A Portland cement (Type II)
3.19
3-8 August 2007
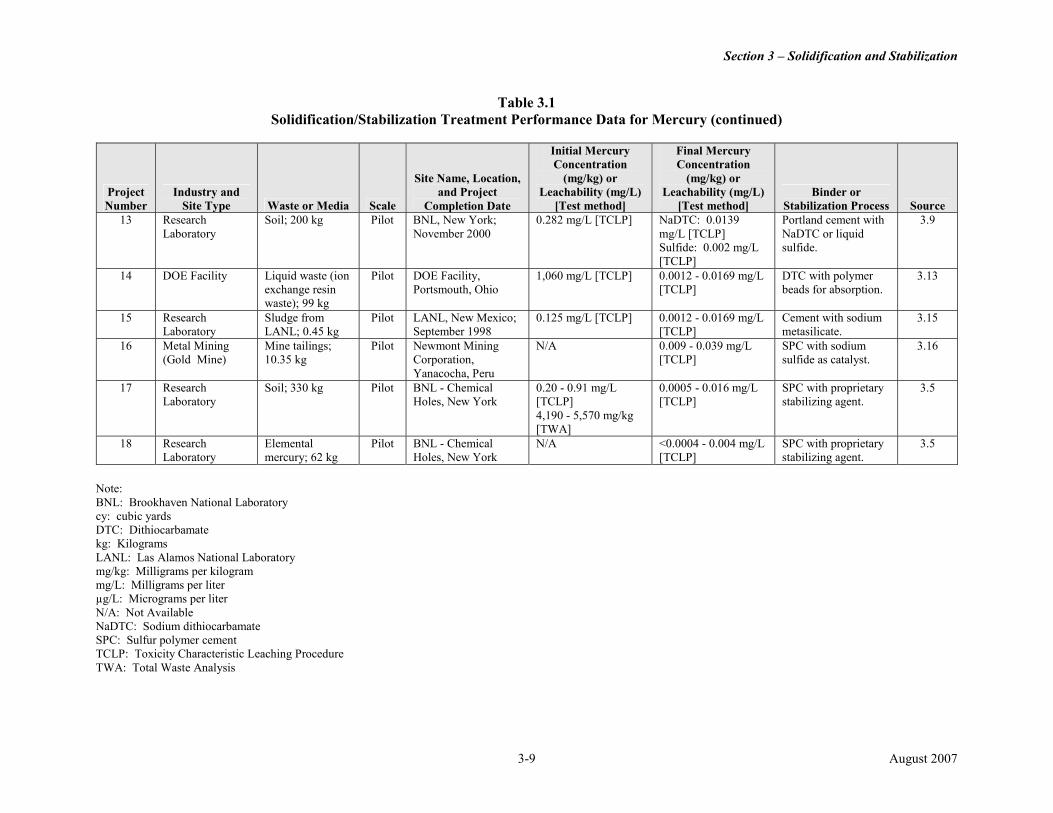
Section 3 – Solidification and Stabilization
Table 3.1 Solidification/Stabilization Treatment Performance Data for Mercury (continued)
Initial Mercury Concentration
Final Mercury Concentration
Project Number
Industry and Site Type Waste or Media Scale
Site Name, Location, and Project
Completion Date
(mg/kg) or Leachability (mg/L)
[Test method]
(mg/kg) or Leachability (mg/L)
[Test method] Binder or
Stabilization Process Source 13 Research Soil; 200 kg Pilot BNL, New York; 0.282 mg/L [TCLP] NaDTC: 0.0139 Portland cement with 3.9
Laboratory November 2000 mg/L [TCLP] Sulfide: 0.002 mg/L [TCLP]
NaDTC or liquid sulfide.
14 DOE Facility Liquid waste (ion Pilot DOE Facility, 1,060 mg/L [TCLP] 0.0012 - 0.0169 mg/L DTC with polymer 3.13 exchange resin Portsmouth, Ohio [TCLP] beads for absorption. waste); 99 kg
15 Research Sludge from Pilot LANL, New Mexico; 0.125 mg/L [TCLP] 0.0012 - 0.0169 mg/L Cement with sodium 3.15 Laboratory LANL; 0.45 kg September 1998 [TCLP] metasilicate.
16 Metal Mining Mine tailings; Pilot Newmont Mining N/A 0.009 - 0.039 mg/L SPC with sodium 3.16 (Gold Mine) 10.35 kg Corporation, [TCLP] sulfide as catalyst.
Yanacocha, Peru 17 Research
Laboratory Soil; 330 kg Pilot BNL - Chemical
Holes, New York 0.20 - 0.91 mg/L [TCLP]
0.0005 - 0.016 mg/L [TCLP]
SPC with proprietary stabilizing agent.
3.5
4,190 - 5,570 mg/kg [TWA]
18 Research Elemental Pilot BNL - Chemical N/A <0.0004 - 0.004 mg/L SPC with proprietary 3.5 Laboratory mercury; 62 kg Holes, New York [TCLP] stabilizing agent.
Note: BNL: Brookhaven National Laboratory cy: cubic yards DTC: Dithiocarbamate kg: Kilograms LANL: Las Alamos National Laboratory mg/kg: Milligrams per kilogram mg/L: Milligrams per liter µg/L: Micrograms per liter N/A: Not Available NaDTC: Sodium dithiocarbamate SPC: Sulfur polymer cement TCLP: Toxicity Characteristic Leaching Procedure TWA: Total Waste Analysis
3-9 August 2007
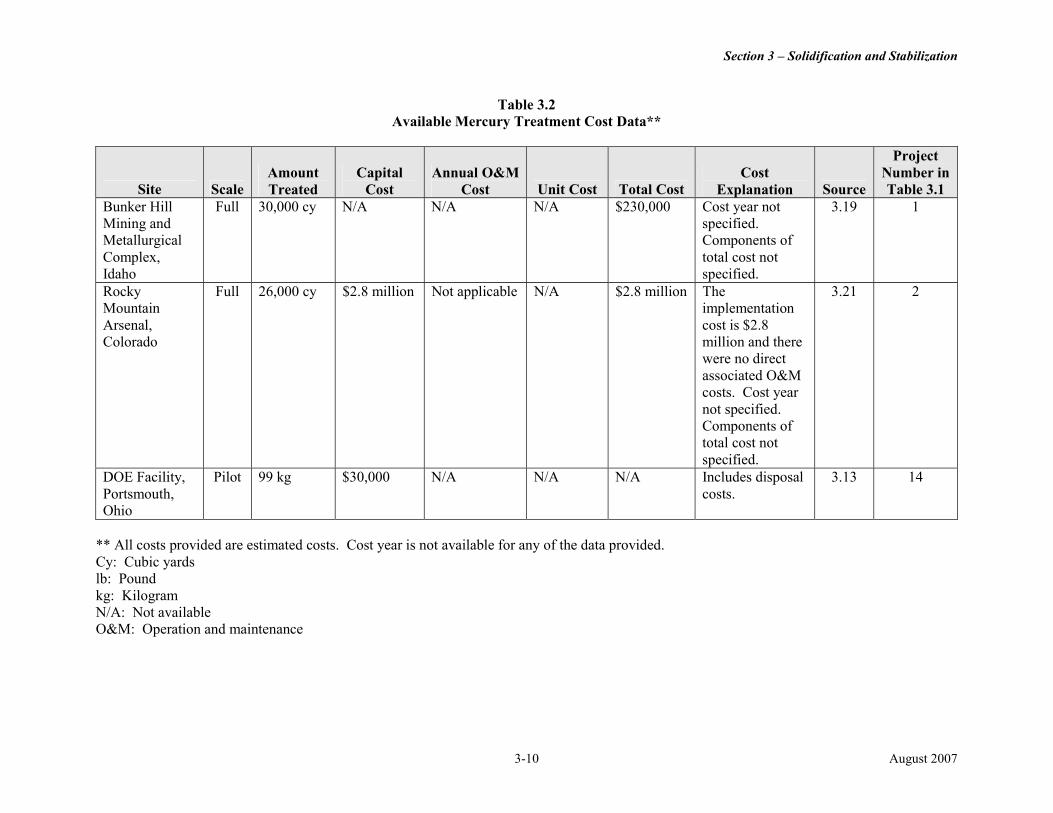
Section 3 – Solidification and Stabilization
Table 3.2 Available Mercury Treatment Cost Data**
Site Scale Amount Treated
Capital Cost
Annual O&M Cost Unit Cost Total Cost
Cost Explanation Source
Project Number in Table 3.1
Bunker Hill Mining and Metallurgical Complex, Idaho
Full 30,000 cy N/A N/A N/A $230,000 Cost year not specified. Components of total cost not specified.
3.19 1
Rocky Mountain Arsenal, Colorado
Full 26,000 cy $2.8 million Not applicable N/A $2.8 million The implementation cost is $2.8 million and there were no direct associated O&M costs. Cost year not specified. Components of total cost not specified.
3.21 2
DOE Facility, Portsmouth, Ohio
Pilot 99 kg $30,000 N/A N/A N/A Includes disposal costs.
3.13 14
** All costs provided are estimated costs. Cost year is not available for any of the data provided. Cy: Cubic yards lb: Pound kg: Kilogram N/A: Not available O&M: Operation and maintenance
3-10 August 2007
Section 3 – Solidification and Stabilization
References
3.1 Federal Remediation Technologies Reference Guide and Screening Manual, Version 4.0. 2001. Federal Remediation Technologies Roundtable. September 5. http://www.frtr.gov/matrix2/top_page.html.
3.2 Chattopadhyay, S., and W.E. Condit. 2002. Advances in Encapsulation Technologies for the Management of Mercury-Contaminated Hazardous Wastes. August.
3.3 Kalb, P.D., J.W. Adams, and L.W. Milian. 2001. Sulfur Polymer Stabilization/Solidification (SPSS) Treatment of Mixed-Waste Mercury Recovered from Environmental Restoration Activities at BNL. BNL-52614. January.
3.4 U.S. EPA. 1998. Technologies for Immobilizing High Mercury Subcategory Wastes. July.
3.5 Spence, R. Date unknown. MASS: Mercury Amalgamation Stabilization/Solidification.
3.6 Bishop, P., R.A. Rauche, L.A. Reiser, M.T. Suidan, and J. Zhang. 2002. Stabilization and Testing of Mercury Containing Wastes: Borden Sludge. April.
3.7 Osborne-Lee, I.W., T.B. Conley, G.A. Hulet, and M.I. Morris. 1999. Demonstration Results on the Effects of Mercury Speciation on the Stabilization of Wastes. ORNL/TM-1999/120. August.
3.8 Mattus, C.H.. 2003. Measurements of Mercury Released from Solidified/Stabilized Waste Forms-FY2002. ORNL/TM-2002/283. February.
3.9 Hulet, G.A., V.C. Miao, M.I. Morris, J. Lewis, P. Randall, and L. Rieser. 2001. Demonstrations to Support Change to the >260 ppm Mercury Treatment Regulations. March. (Presented at the WM’01 Conference, February 25-March 1, 2001)
3.10 Rieser, L.A., P. Bishop, M.T. Suidan, H. Piao, R.A. Fauche, and J. Zhang. 2001. Stabilization and Testing of Mercury Containing Wastes: Borden Catalyst. EPA/600/R-02/019. September.
3.11 Chattopadhyay, S. 2003. Evaluation of Chemically Bonded Phosphate Ceramics for Mercury Stabilization of a Mixed Synthetic Waste. EPA/600/R-03/113. March.
3.12 Innovative Technology Summary Report: Mercury Contamination – Amalgamate (contract with NFS and ADA) Demonstration of DeHg Process. 1999. DOE/EM-0471. September.
3.13 Innovative Technology Summary Report: Stabilize High Salt Content Waste Using Polysiloxane Stabilization. 1999. DOE/EM-0474. August.
3.14 Innovative Technology Summary Report: Demonstration of GTS Duratek Process for Stabilizing Mercury Contaminated (<260 ppm) Mixed Wastes. 1999. DOE/EM-0487. September.
3.15 Bowerman, B., J. Adams, P. Kalb, R-Y. Wan, and M. LeVier. 2003. Using the Sulfur Polymer Stabilization/Solidification Process to Treat Residual Mercury Wastes from Gold Mining Operations. February. (Presented at the Society of Mining Engineers Conference, Cincinnati, OH, February 24-26, 2003)
3-11 August 2007
Section 3 – Solidification and Stabilization
3.16 Innovative Technology Summary Report: Mixed Waste Encapsulation in Polyester Resins Treatment for Mixed Wastes Containing Salts. 1999. DOE/EM-0480. September.
3.17 U.S EPA Office of Solid Waste and Emergency Response. 2002. Arsenic Treatment Technologies for Soil, Waste, and Water. EPA-542-R-02-004. September. http://www.cluin.org/download/remed/542r02004/arsenic_report.pdf.
3.18 U.S EPA Office of Solid Waste and Emergency Response. 2004. Annual Status Report Search System. March. http://cfpub2.epa.gov/asr.
3.19 U.S. EPA. 2004. E-mail from Larry Kimmel, U.S EPA to Danielle Wohler, Tetra Tech EM Inc., regarding S/S of mercury at the Rocky Mountain Arsenal site. November 18.
3.20 Zhuang, J.M., T. Walsh, T. Lam, and D. Boulter. 2003. Application of Ferric Sludge to Immobilize Leachable Mercury in Soils and Concrete. Environmental Technology, Vol. 24, pp 1445 – 1453.
3.21 Zhuang, J.M., T. Lo, T. Walsh, and T. Lam. 2004. Stabilization of high mercury contaminated brine purification sludge. Journal of Hazardous Materials, Vol. B113, pp 157 – 164.
3-12 August 2007
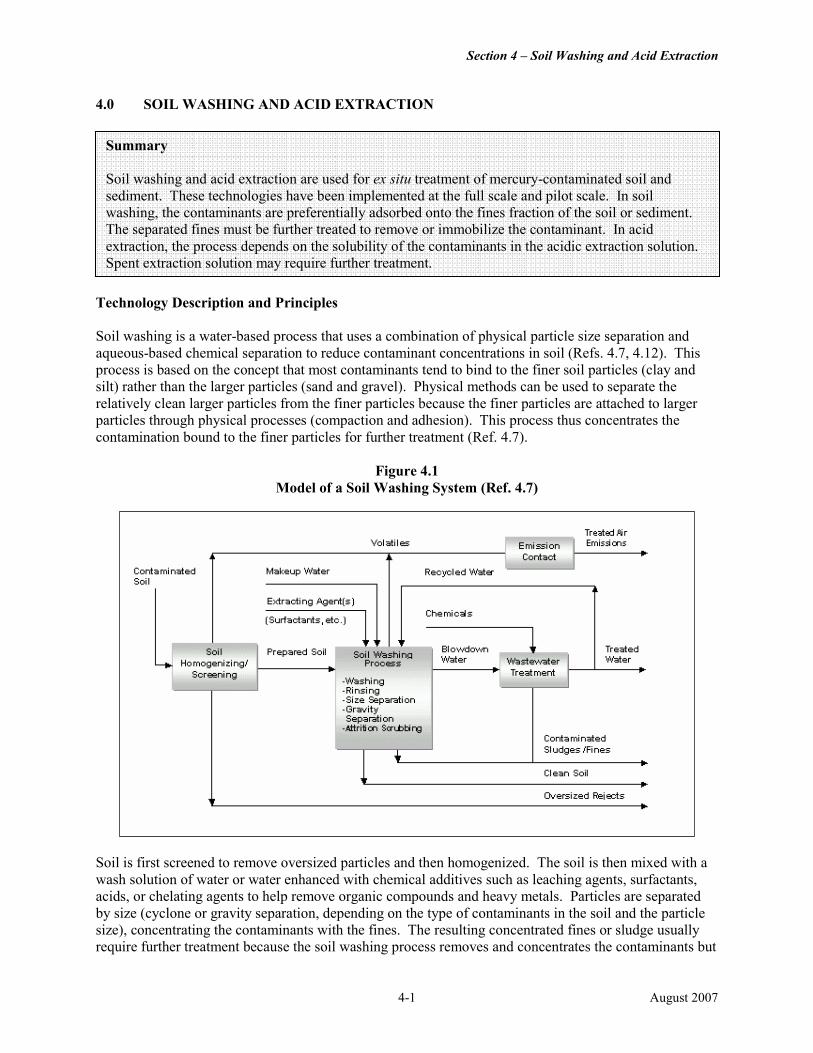
Section 4 – Soil Washing and Acid Extraction
4.0 SOIL WASHING AND ACID EXTRACTION
Summary Soil washing and acid extraction are used for ex situ treatment of mercury-contaminated soil and sediment. These technologies have been implemented at the full scale and pilot scale. In soil washing, the contaminants are preferentially adsorbed onto the fines fraction of the soil or sediment. The separated fines must be further treated to remove or immobilize the contaminant. In acid extraction, the process depends on the solubility of the contaminants in the acidic extraction solution. Spent extraction solution may require further treatment.
Technology Description and Principles Soil washing is a water-based process that uses a combination of physical particle size separation and aqueous-based chemical separation to reduce contaminant concentrations in soil (Refs. 4.7, 4.12). This process is based on the concept that most contaminants tend to bind to the finer soil particles (clay and silt) rather than the larger particles (sand and gravel). Physical methods can be used to separate the relatively clean larger particles from the finer particles because the finer particles are attached to larger particles through physical processes (compaction and adhesion). This process thus concentrates the contamination bound to the finer particles for further treatment (Ref. 4.7).
Figure 4.1 Model of a Soil Washing System (Ref. 4.7)
Soil is first screened to remove oversized particles and then homogenized. The soil is then mixed with a wash solution of water or water enhanced with chemical additives such as leaching agents, surfactants, acids, or chelating agents to help remove organic compounds and heavy metals. Particles are separated by size (cyclone or gravity separation, depending on the type of contaminants in the soil and the particle size), concentrating the contaminants with the fines. The resulting concentrated fines or sludge usually require further treatment because the soil washing process removes and concentrates the contaminants but
4-1 August 2007
Section 4 – Soil Washing and Acid Extraction
does not destroy them. The coarser-grained soil is generally relatively “clean,” requiring no additional treatment. Wash water from the process is treated and either reused in the process or disposed (Ref. 4.7). Commonly used methods for treating the wastewater include ion exchange and solvent extraction (Ref. 4.14)
Two of the projects in Table 4.1 use the BioGenesis Sediment Decontamination Technology. This technology is designed to decontaminate fine-grained material contaminated with heavy metals, including mercury (Refs. 4.2 and 4.18). The dredged material is first screened to remove oversized debris and then is pre-treated using high-pressure water and proprietary biodegradable surfactants, specialty chemicals, and chelators (Refs. 4.2 and 4.4). In this step, the solid particles physically separate from each other, and naturally occurring organic material breaks up. After pre-treatment, an aeration step introduces air into a chamber of contaminated material, and the resulting floatable organic material and free-phase organic contaminants are then skimmed off the top of the chamber.
A second washing step uses collision impact forces to strip the sorbed contaminants and complex organic coatings from the solid particles (Ref. 4.2). The slurry of solids and stripped organics is then treated in an oxidation and cavitation unit to destroy the organic constituents. Oxidants used include hydrogen peroxide and sodium percarbonate. Then a liquid/solid separation step mechanically removes the decontaminated particles from the liquid phase. The resulting cake, containing cleaned sand, silt, and clay, is mixed with amendments to create beneficial soil products such as topsoil. The contaminated liquid is treated to precipitate metals and remove other contaminants and then is reused in the process (Refs. 4.2, 4.4). This process was used in a pilot application to treat contaminated sediment from the New York/New Jersey harbor. (See case study and Project 3 in Table 4.1.)
Acid extraction is an ex situ technology that uses an extracting chemical such as hydrochloric acid or sulfuric acid to extract contaminants from a solid matrix by dissolving them in the acid (Ref. 4.6). It is also known as chemical leaching. Contaminated material is first screened to remove coarse solids. Then acid is introduced into the extraction unit. The characteristics of the treated material, contaminant type, and contaminant concentration determine the residence time in the extraction unit, which usually varies from 10 to 40 minutes (Ref. 4.6). The solid and liquid phases are then separated using hydroclones, and the solids are transferred to a rinse system, where they are rinsed with water to remove entrained acid and contaminants. They are then dewatered and mixed with lime and fertilizer to neutralize any residual acid (Ref. 4.6). The acid extraction fluid and rinse waters are mixed with commercially available precipitants, such as sodium hydroxide, lime, or other proprietary formulations, and a flocculant to remove the heavy metals (Ref. 4.6). The precipitated solids may require additional treatment or may be disposed in a landfill if they meet a TCLP mercury level of less than 0.025 mg/L (Ref. 4.10). Elemental mercury can be recovered from the residual liquid from the precipitation step (Ref. 4.10).
Two of the projects in Table 4.1 employed the REMERC process, a patented acid extraction process that includes a low-temperature extraction technique for recovering mercury and other heavy metals from industrial wastes and contaminated soils (Refs. 4.10, 4.11). This process has been used to treat caustic wastewater sludge that contains mercury from chlor-alkali plants, designated as hazardous waste classification K106 by EPA (Ref. 4.8). The K106 waste consists of mercuric and mercurous chlorides, mercuric sulfide, elemental mercury, and species of mercury absorbed on activated carbon (Ref. 4.10). REMERC can be operated in both batch and continuous modes. This process involves leaching in two stages (at pH 2 and 6), with each leaching step followed by a simultaneous washing and thickening step using a patented thickener (Ref. 4.11). Chlor-alkali plant waste products such as sodium hypochlorite, spent drying sulfuric acid, and depleted waste brine are used as additives to the leaching solution. The mercury-containing solution then flows to a reactor, where triple-distilled quality elemental mercury is recovered using aqueous-phase electrolysis or cementation on iron (Refs. 4.8 and 4.11). This process was used in three projects (Projects 2, 6, and 7) described in Table 4.1.
4-2 August 2007
Section 4 – Soil Washing and Acid Extraction
Technology Description: Soil washing is an ex situ technology that takes advantage of the behavior of some contaminants to preferentially adsorb onto the fines fraction. The contaminated soil is suspended in a wash solution and the fines are separated from the suspension, thereby reducing the contaminant concentration in the remaining soil. The contaminated water generated from soil washing is treated with a technology suitable for the contaminants. Acid extraction is an ex situ technology that uses an extracting chemical such as hydrochloric acid or sulfuric acid to extract contaminants from a solid matrix by dissolving them in the acid. The metal contaminants are recovered from the acid leaching solution using techniques such as aqueous-phase electrolysis. Media Treated:
• Soil (ex situ) • Sediment (ex situ)
Agents Used in Soil Washing and Acid Extraction:
• Leaching agents • Surfactants • Acids – Hydrochloric acid, sulfuric acid • Chelating agents • Sodium chloride
Applicability, Advantages, and Limitations Soil washing is suitable for use on soils contaminated with semivolatile organic compounds (SVOCs), fuels, pesticides, and some VOCs (Refs. 4.7, 4.12). Soil washing has been used to treat soils contaminated with heavy metals, including mercury. The technology can also be used to recover metals (Ref. 4.7). This technology is best suited to treat contaminated soil composed primarily of larger-grained particles such as sand and gravel, rather than fine-grained particles such as clay and silt (Ref. 4.15). It is also best suited to treat contaminants that preferentially adsorb onto the fines fraction (Ref. 4.14). An advantage of soil washing is that it can be used to reduce the volume of material that will require further treatment, which potentially lowers the cost of cleanup and disposal of the contaminated material. Soil washing may not be cost-effective for small quantities of contaminated material (Ref. 4.15). Soil washing is usually performed at the site of the contamination, avoiding the risks associated with transporting the contaminated soil off-site to a treatment facility. Chemicals are seldom released from the soil washing process to the air. When the procedure is properly designed and operated, soil washing is relatively safe (Ref. 4.15). Soil washing is effective on homogenous, relatively simple contaminant mixtures (Ref. 4.14). Its applicability and effectiveness may be limited for complex waste mixtures (such as metals mixed with organic compounds) that make it difficult to formulate the appropriate washing solution. Soils with high humic content may require pre-treatment to prevent interference with contaminant desorption. This process may also have difficulty treating soils with a high (more than 40 percent) silt and clay fraction (Refs. 4.7, 4.12). Acid extraction is suitable for use on sediments, sludges, soils, and solid wastes contaminated with heavy metals, including mercury (Ref. 4.6). The principal advantage of acid extraction is that hazardous contaminants are separated from soils and sediments, thereby reducing the volume of hazardous waste to be treated (Ref. 4.6).
4-3 August 2007
Section 4 – Soil Washing and Acid Extraction
The effectiveness of acid extraction may be limited in soils with higher clay content, which may reduce the extraction efficiency and require longer contact time (Ref. 4.6). Certain health and safety issues should be considered in using acid extraction, such as emissions from extracting agents (for example, surfactants and concentrated acids) or the corrosivity of strong acids. Exposure to the extracting agents and to the wastewater treatment chemicals may be controlled if the chemicals are added to the system under closed or properly ventilated conditions. Additional respiratory protection (for example, an air-purifying respirator with organic vapor cartridges) may also be used to control inhalation exposures (Ref. 4.6).
Factors Affecting Soil Washing and Acid Extraction Performance and Cost
• Soil homogeneity: Soils that vary widely and frequently in characteristics such as soil type, contaminant type and concentration, and where blending for homogeneity is not feasible, may not be suitable for soil washing (Ref. 4.12).
• Soil type and soil particle size distribution: A larger amount of treatment residual may require disposal for soils with a high proportion of fines (Ref. 4.14). Soils with high clay content, cation exchange capacity, or humic acid content tend to interfere with contaminant desorption and limit the effectiveness of soil washing and acid extraction (Refs. 4.6, 4.12). Carbonaceous soils tend to neutralize extracting acids and interfere with the acid extraction process (Ref. 4.12).
• Total Organic Carbon: Total organic carbon (TOC) affects the desorption of contaminants from the contaminated material and therefore the efficiency of the soil washing process (Ref. 4.20).
• pH: pH affects the operation of the soil washing process since the contaminants are extracted from a matrix at specified pH ranges on the basis of the solubility of the contaminant at a particular pH (Ref. 4.20).
• Multiple contaminants: Complex, heterogeneous contaminant compositions can make it difficult to formulate a simple washing solution, requiring use of multiple, sequential washing processes to remove contaminants (Ref. 4.12).
• Moisture content: The moisture content of the soil may make it more difficult to handle. Moisture content may be controlled by covering the excavation, storage, and treatment areas to reduce the amount of moisture in the soil (Ref. 4.14).
• Temperature: Cold temperature can freeze the washing solution and can affect leaching rates (Ref. 4.14).
Type, Number, and Scale of Identified Projects A total of eight projects were found. Of these eight, five were identified where soil washing was used to treat organic mercury. Of these, one project was conducted at full scale at a Superfund site. Four projects were conducted at pilot scale. Three projects were identified where acid extraction was used to treat inorganic and elemental mercury. Of these, one was conducted at full scale, while two were performed at the pilot scale. Summary of Performance and Cost Data Table 4.1 summarizes information for the two full-scale and six pilot-scale projects. The performance of a soil washing or acid extraction treatment is typically measured by leach testing a sample of the treated residue.
4-4 August 2007
Section 4 – Soil Washing and Acid Extraction
The two full-scale projects that used soil washing and acid extraction for treatment of mercury included a waste processing facility and a chlor-alkali plant. The full-scale soil washing project treated 13,570 cubic yards of contaminated soil, with the final concentration of inorganic mercury reduced from 100 mg/kg to 1 mg/kg, a reduction of 99 percent. This project is described in the case study and on Table 4.1 (Project 1). The full-scale project using acid extraction treated up to 3,300 pounds of sludge per day. Performance data indicated a reduction in the concentration of mercury from 60,000 mg/L to 150 mg/L in K106 wastewater sludge, and a TCLP value of less than 0.025 mg/L. This project is described in Table 4.1 (Project 2). Among the six pilot-scale projects, four used soil washing and two used acid extraction. The first pilot-scale soil washing project treated 700 cubic yards of contaminated sediment from the New York/New Jersey harbor, with the final concentrations of inorganic mercury reduced from 3.1 mg/kg to 0.3 mg/kg (Refs. 4.2 and 4.4). This project is described in the case study and on Table 4.1 (Project 3). The second pilot-scale soil washing project treated 800 liters of homogenized sediment from the Kai Tak Approach Channel in Hong Kong (Table 4.1, Project 4). Performance data indicate a reduction in concentrations of inorganic mercury from 0.73 mg/kg to nearly 0.08 mg/kg (Ref. 4.3). Soil washing was also used at the pilot scale to treat mercury-contaminated soil at a facility in Germany (Table 4.1, Project 5), where inorganic mercury was reduced from 875 mg/kg and a TCLP of 0.082 mg/L to a final concentration of less than 20 mg/kg and a TCLP of 0.006 mg/L. The BioGenesis Sediment Decontamination Technology was used at a pilot scale (See Table 4.1, Project 8) and reduced mercury concentrations from 9.5 mg/kg to 1.49 mg/kg. The two pilot-scale acid extraction projects were conducted at chlor-alkali plants, and both used the patented REMERC process described previously to treat K106 wastewater sludge. Before treatment, concentration of mercury in the wastewater sludge ranged from 55,000 mg/kg to 110,000 mg/kg. Performance data for both projects indicated nearly 99 percent reduction in the concentration of mercury and a TCLP of less than 0.025 mg/L for the treated material. These projects are described in Table 4.1 (Projects 6 and 7).
Case Study: Soil Washing of Mercury-Contaminated Soil at King of Prussia Superfund Site The King of Prussia Superfund Site in Winslow Township, New Jersey, is a former waste processing and recycling facility. Soils were contaminated with arsenic, beryllium, cadmium, chromium, copper, lead, mercury, nickel, selenium, silver, and zinc from improperly disposed wastes (Table 4.1, Project 1). Approximately 13,570 cubic yards of mercury-contaminated soil, sludge, and sediment was treated using soil washing in 1993. This project was EPA’s first full-scale application of soil washing to remediate a Superfund site. The system consisted of a series of hydroclones, conditioners, and froth floatation cells. Soil washing additives included a polymer and a surfactant. The treatment reduced concentrations of inorganic mercury from 100 mg/kg to the cleanup goal of 1 mg/kg, a reduction of 99 percent. Residual sludges were disposed off site as nonhazardous waste, and the treated soil was used as backfill at the site.
4-5 August 2007
Section 4 – Soil Washing and Acid Extraction
Case Study: Soil Washing of Sediment from the New York/New Jersey Harbor Sediments and soils around the New York/New Jersey harbor have been contaminated by various industrial activities from colonial times to the present (Ref. 4.9). Because of the shallow natural depth, the harbor must be periodically dredged to maintain safe passage for vessels, generating millions of cubic yards of contaminated sediment annually that require some form of decontamination for disposal (Ref. 4.1). The harbor sediment is contaminated with polycyclic aromatic hydrocarbons (PAHs), pesticides, dioxins and furans, and heavy metals, including mercury. The sediment in the New York/New Jersey harbor contains 52 percent silt, 42 percent clay, 4 percent sand, and a small fraction of larger grained particles. The total organic content ranges from 3 to 10 percent (Refs. 4.2, 4.9). The pilot demonstration was conducted from November 1998 to March 1999 and treated 700 cubic yards of a representative sample of dredged material from near a petroleum facility (Table 4.1, Project 3) (Ref. 4.2). The project evaluated the effectiveness of the BioGenesis Sediment Washing Technology, which is designed to decontaminate fine-grained sediment material (Ref. 4.2). Concentrations of inorganic mercury in this sample were found to be about 3.1 mg/kg, which is within the typical range of mercury in New York/New Jersey harbor sediment of 0.2-13.6 mg/kg (Ref. 4.2). This process resulted in a 92 percent removal of mercury, to a final concentration of 0.3 mg/kg. This concentration was below the mercury cleanup criteria of 14 mg/kg (New Jersey Residential Direct Contact Soil Cleanup Criteria) (Refs. 4.2 and 4.4).
4-6 August 2007
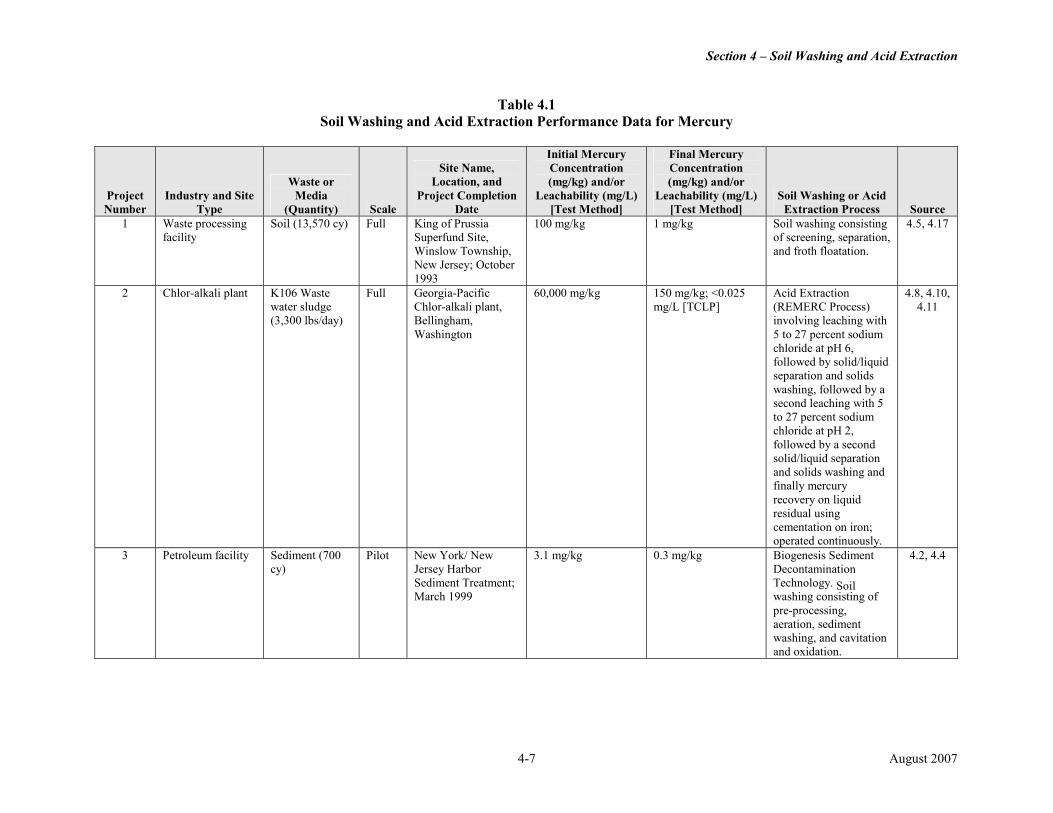
Section 4 – Soil Washing and Acid Extraction
Table 4.1 Soil Washing and Acid Extraction Performance Data for Mercury
Site Name, Initial Mercury Concentration
Final Mercury Concentration
Project Number
Industry and Site Type
Waste or Media
(Quantity) Scale
Location, and Project Completion
Date
(mg/kg) and/or Leachability (mg/L)
[Test Method]
(mg/kg) and/or Leachability (mg/L)
[Test Method] Soil Washing or Acid
Extraction Process Source 1 Waste processing
facility Soil (13,570 cy) Full King of Prussia
Superfund Site, Winslow Township, New Jersey; October
100 mg/kg 1 mg/kg Soil washing consisting of screening, separation, and froth floatation.
4.5, 4.17
1993 2 Chlor-alkali plant K106 Waste
water sludge (3,300 lbs/day)
Full Georgia-Pacific Chlor-alkali plant, Bellingham,
60,000 mg/kg 150 mg/kg; <0.025 mg/L [TCLP]
Acid Extraction (REMERC Process) involving leaching with
4.8, 4.10, 4.11
Washington 5 to 27 percent sodium chloride at pH 6, followed by solid/liquid separation and solids washing, followed by a second leaching with 5 to 27 percent sodium chloride at pH 2, followed by a second solid/liquid separation and solids washing and finally mercury recovery on liquid residual using cementation on iron; operated continuously.
3 Petroleum facility Sediment (700 cy)
Pilot New York/ New Jersey Harbor Sediment Treatment; March 1999
3.1 mg/kg 0.3 mg/kg Biogenesis Sediment Decontamination Technology. Soil washing consisting of
4.2, 4.4
pre-processing, aeration, sediment washing, and cavitation and oxidation.
4-7 August 2007
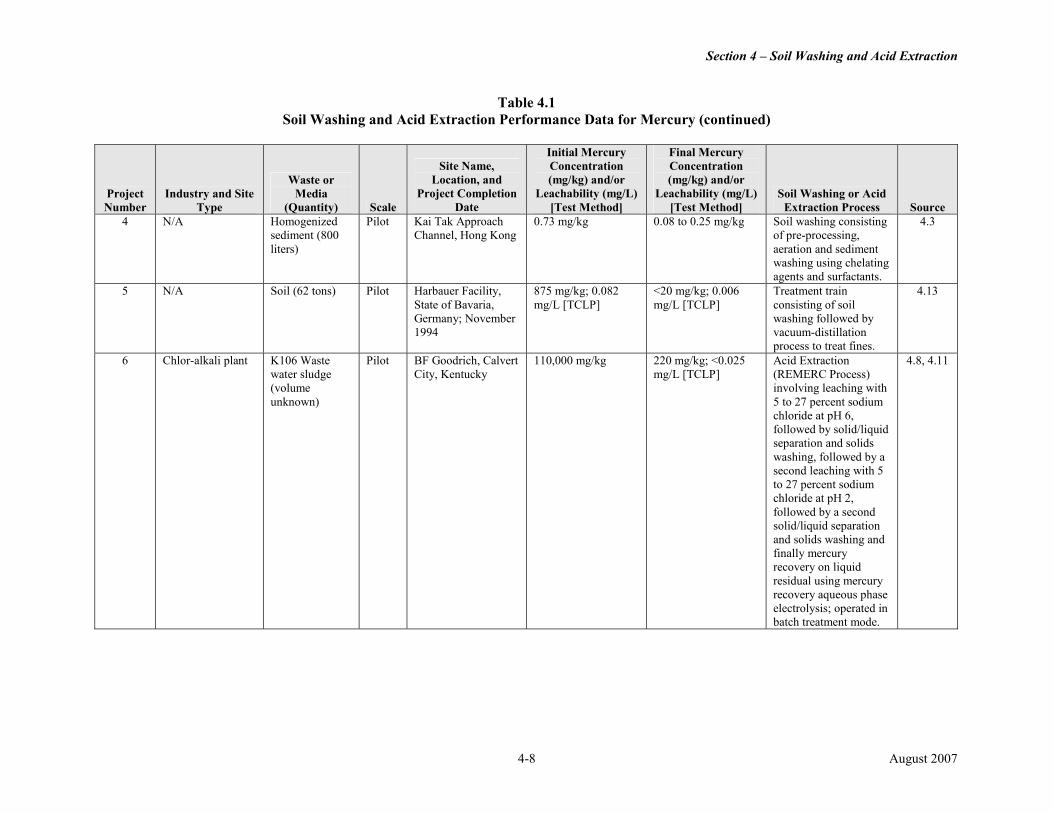
Section 4 – Soil Washing and Acid Extraction
Table 4.1 Soil Washing and Acid Extraction Performance Data for Mercury (continued)
Initial Mercury Final Mercury Site Name, Concentration Concentration
Waste or Location, and (mg/kg) and/or (mg/kg) and/or Project Number
Industry and Site Type
Media (Quantity) Scale
Project Completion Date
Leachability (mg/L) [Test Method]
Leachability (mg/L) [Test Method]
Soil Washing or Acid Extraction Process Source
4 N/A Homogenized sediment (800
Pilot Kai Tak Approach Channel, Hong Kong
0.73 mg/kg 0.08 to 0.25 mg/kg Soil washing consisting of pre-processing,
4.3
liters) aeration and sediment washing using chelating agents and surfactants.
5 N/A Soil (62 tons) Pilot Harbauer Facility, State of Bavaria, Germany; November 1994
875 mg/kg; 0.082 mg/L [TCLP]
<20 mg/kg; 0.006 mg/L [TCLP]
Treatment train consisting of soil washing followed by vacuum-distillation
4.13
process to treat fines. 6 Chlor-alkali plant K106 Waste
water sludge (volume
Pilot BF Goodrich, Calvert City, Kentucky
110,000 mg/kg 220 mg/kg; <0.025 mg/L [TCLP]
Acid Extraction (REMERC Process) involving leaching with
4.8, 4.11
unknown) 5 to 27 percent sodium chloride at pH 6, followed by solid/liquid separation and solids washing, followed by a second leaching with 5 to 27 percent sodium chloride at pH 2, followed by a second solid/liquid separation and solids washing and finally mercury recovery on liquid residual using mercury recovery aqueous phase electrolysis; operated in batch treatment mode.
4-8 August 2007
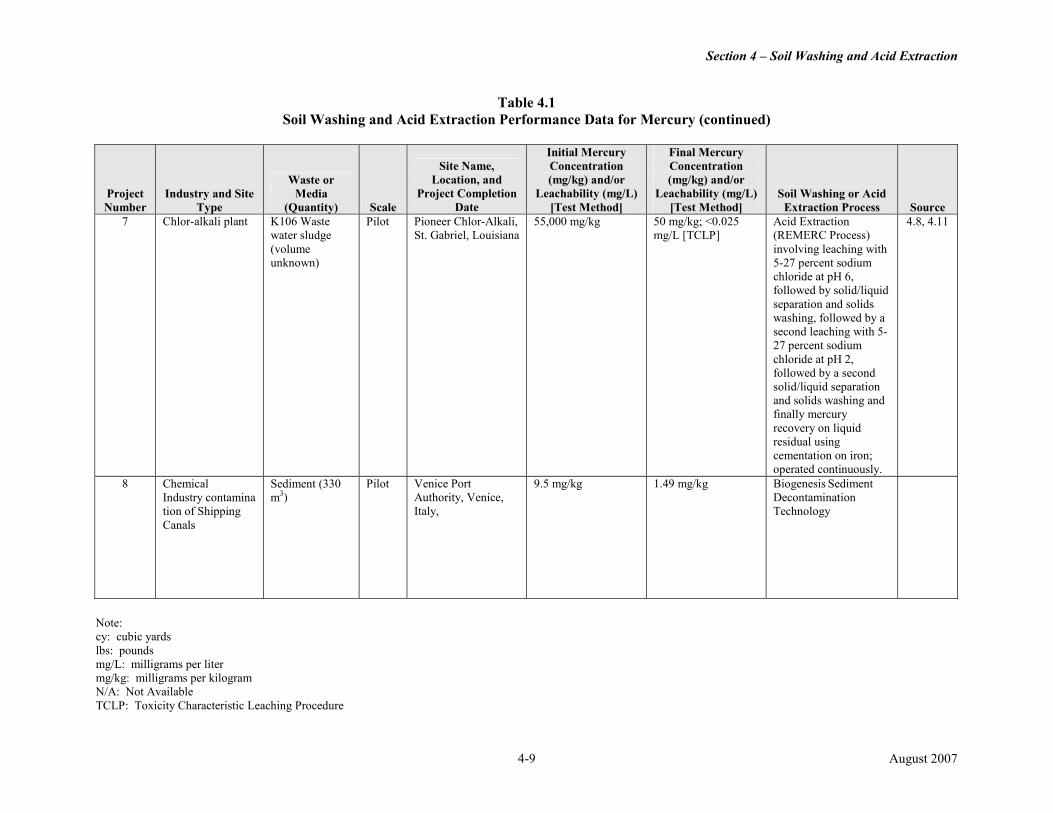
Section 4 – Soil Washing and Acid Extraction
Table 4.1 Soil Washing and Acid Extraction Performance Data for Mercury (continued)
Initial Mercury Final Mercury Site Name, Concentration Concentration
Waste or Location, and (mg/kg) and/or (mg/kg) and/or Project Number
Industry and Site Type
Media (Quantity) Scale
Project Completion Date
Leachability (mg/L) [Test Method]
Leachability (mg/L) [Test Method]
Soil Washing or Acid Extraction Process Source
7 Chlor-alkali plant K106 Waste water sludge
Pilot Pioneer Chlor-Alkali, St. Gabriel, Louisiana
55,000 mg/kg 50 mg/kg; <0.025 mg/L [TCLP]
Acid Extraction (REMERC Process)
4.8, 4.11
(volume unknown)
involving leaching with 5-27 percent sodium chloride at pH 6, followed by solid/liquid separation and solids washing, followed by a second leaching with 527 percent sodium chloride at pH 2, followed by a second solid/liquid separation and solids washing and finally mercury recovery on liquid residual using cementation on iron; operated continuously.
8 Chemical Industry contamina tion of Shipping Canals
Sediment (330 m3)
Pilot Venice Port Authority, Venice, Italy,
9.5 mg/kg 1.49 mg/kg Biogenesis Sediment Decontamination Technology
Note: cy: cubic yards lbs: pounds mg/L: milligrams per liter mg/kg: milligrams per kilogram N/A: Not Available TCLP: Toxicity Characteristic Leaching Procedure
4-9 August 2007
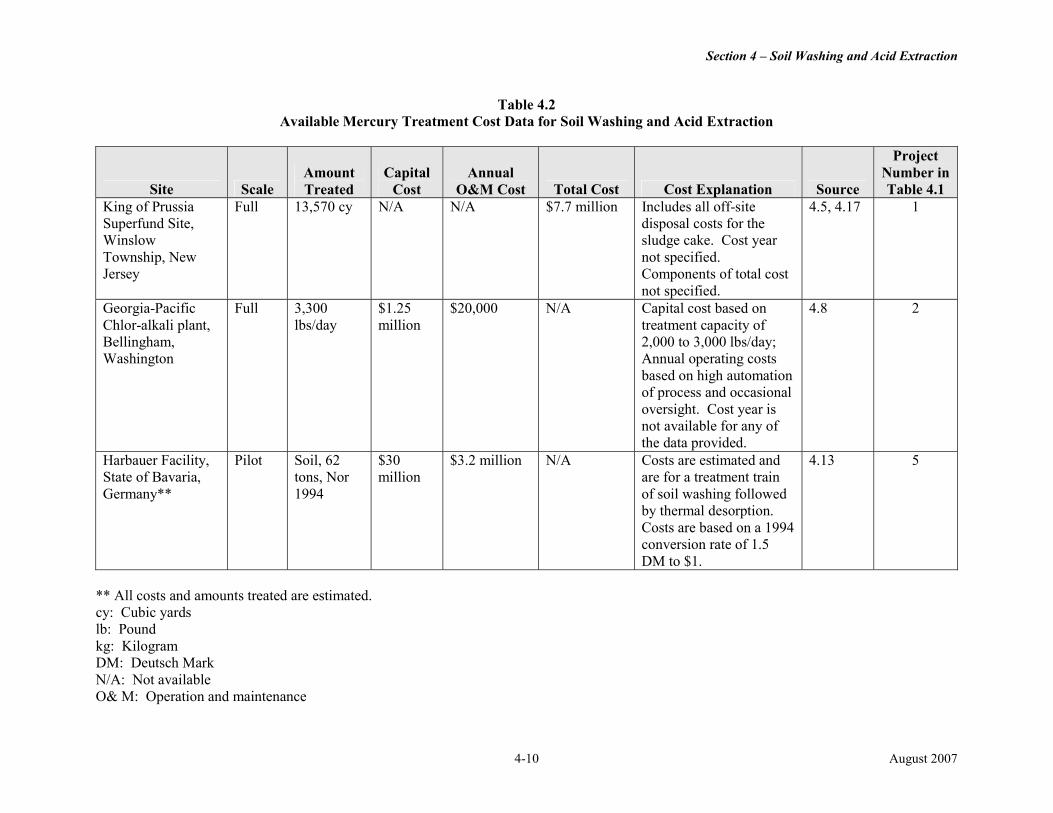
Section 4 – Soil Washing and Acid Extraction
Table 4.2 Available Mercury Treatment Cost Data for Soil Washing and Acid Extraction
Project Amount Capital Annual Number in
Site Scale Treated Cost O&M Cost Total Cost Cost Explanation Source Table 4.1 King of Prussia Full 13,570 cy N/A N/A $7.7 million Includes all off-site 4.5, 4.17 1 Superfund Site, disposal costs for the Winslow sludge cake. Cost year Township, New not specified. Jersey Components of total cost
not specified. Georgia-Pacific Full 3,300 $1.25 $20,000 N/A Capital cost based on 4.8 2 Chlor-alkali plant, Bellingham, Washington
lbs/day million treatment capacity of 2,000 to 3,000 lbs/day; Annual operating costs based on high automation of process and occasional oversight. Cost year is not available for any of the data provided.
Harbauer Facility, State of Bavaria,
Pilot Soil, 62 tons, Nor
$30 million
$3.2 million N/A Costs are estimated and are for a treatment train
4.13 5
Germany** 1994 of soil washing followed by thermal desorption. Costs are based on a 1994 conversion rate of 1.5 DM to $1.
** All costs and amounts treated are estimated. cy: Cubic yards lb: Pound kg: Kilogram DM: Deutsch Mark N/A: Not available O& M: Operation and maintenance
4-10 August 2007
Section 4 – Soil Washing and Acid Extraction
References
4.1 BioGenesis™ Sediment Washing. New York/New Jersey Harbor. Web site accessed on October 18, 2004. http://www.biogenesis.com/2pager~2.html.
4.2 BioGenesis Enterprises, Inc. and Roy F. Weston, Inc. 1999. “BioGenesisSM Sediment Washing Technology”. Full-Scale, 40 Cy/Hr, Sediment Decontamination Facility for the NY/NJ Harbor. Final Report on the Pilot Demonstration Project. December. http://www.bnl.gov/wrdadcon/publications/reports/BioGenesis_BNL.PDF.
4.3 DeDen, M., K. Johnson, C. Stevens, M. Amiran, and C. Wilde. 2003. Ex-Situ Remediation of Hong Kong Marine Sediments Using BioGenesisSM Washing Technology. Proceedings of the Second International Conference on Remediation of Contaminated Sediments, Venice, Italy, September 30 – October 3, 2003. http://www.biogenesis.com/venicedocs/10TechPap03.pdf.
4.4 Jones, K.W., H. Feng, E.A. Stern, J. Lodge, and N.L. Clesceri. 2001. Dredged Material Decontamination Demonstration for the Port of New York/New Jersey. Journal of Hazardous Materials. 85: 127-143. July. http://www.elsevier.com/locate/jhazmat.
4.5 Federal Remediation Technologies Roundtable (FRTR). 1995. Technology Cost and Performance – Soil Washing at the King of Prussia Technical Corporation Superfund Site. http://costperformance.org/profile.cfm?ID=125&CaseID=125.
4.6 FRTR. 2001. Chemical Extraction. Federal Remediation Technologies Reference Guide and Screening Manual, Version 4.0. September 5. http://www.frtr.gov/matrix2/section4/4-15.html.
4.7 FRTR. 2001. Soil Washing. Federal Remediation Technologies Reference Guide and Screening Manual, Version 4.0. September 5. http://www.frtr.gov/matrix2/section4/4-19.html.
4.8 Selby, J., and L.G. Twidwell. The Recovery and Recycle of Mercury from Chlor-Alkali Plant Wastewater Sludge. Web site accessed on December 8, 2004. http://www.mtech.edu/metallurgy/Faculty%20Info/Twidwell/Mercury/Microsoft%20Word%20%20JOM%20HG%20final%20word%201%202001.pdf.
4.9 Stern, E., K.W. Jones, K. Donato, J.D. Pauling, J.G. Sontag, N.L.Clesceri, M.C. Mensinger, and C.L. Wilde. 1998. Maintaining Access to America’s Intermodal Ports/Technologies for Decontamination of Dredged Sediment: New York/ New Jersey Harbor. May. http://www.bnl.gov/wrdadcon/publications/articles/Same-1998.pdf.
4.10 Universal Dynamics. 1994. The “REMERC” Process for Treatment of K106 Mercury Mud. March. http://www.udl.com/pdf/p35.pdf.
4.11 Universal Dynamics. The REMERC™ Process. Web site Accessed on October 20, 2004. http://udl.com/systems/remerc_x.html.
4.12 U.S. Environmental Protection Agency (EPA) Office of Emergency and Remedial Response. 1997. Engineering Bulletin: Technology Alternatives for Remediation of Soils Contaminated with As, Cd, Cr, Hg, and Pb. EPA-540-S-97-500. August. http://www.epa.gov/tio/download/remed/tdtchalt.pdf.
4-11 August 2007
Section 4 – Soil Washing and Acid Extraction
4.13 EPA Office of Research and Development. 1996. Harbauer Soil Washing/ Vacuum-Distillation System, Innovative Technology Evaluation Report. August. http://www.epa.gov/ORD/SITE/Bilateral/harbauer.pdf.
4.14 EPA Office of Solid Waste and Emergency Response. 2002. Arsenic Treatment Technologies for Soil, Waste, and Water. EPA-542-R-02-004. September. http://www.cluin.org/download/remed/542r02004/arsenic_report.pdf.
4.15 EPA Office of Solid Waste and Emergency Response. 2001. A Citizen’s Guide to Soil Washing. EPA 542-F-01-008. May. http://www.epa.gov/tio/download/remed/soilwash.pdf.
4.16 EPA Office of Solid Waste and Emergency Response. 2004. Treatment Technologies for Site Cleanup: Annual Status Report (Eleventh Edition). March. http://clu-org/download/remed/asr/11/asr.pdf.
4.17 FRTR. 1998. Guide to Documenting and Managing Cost and Performance Information for Remediation Projects. EPA 542-B-98-007. October. http://www.frtr.gov/pdf/guide.pdf.
4.18 BioGenesis Italia, LLC, MWH Americas, Inc., and Jan de Nul, N.V. April 2005. “Technical Report, Pilot Scale Demonstration Project of the BioGenesis Sediment Decontamination Process, Autorita Portuale di Venezia, Porto Marghera, Venice, Italy”. Web site accessed on June 7, 2007. http://biogenesis.com/VenicePilotFinalReport20050412-1.pdf.
4-12 August 2007
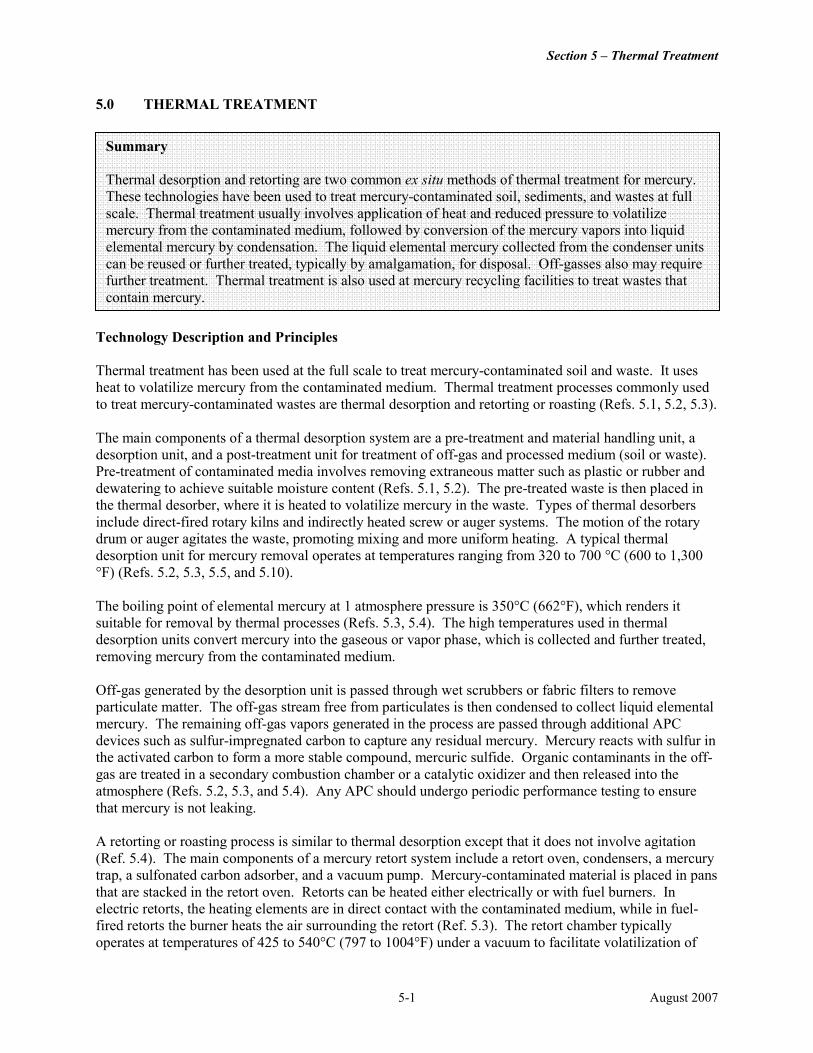
Section 5 – Thermal Treatment
5.0 THERMAL TREATMENT
Summary Thermal desorption and retorting are two common ex situ methods of thermal treatment for mercury. These technologies have been used to treat mercury-contaminated soil, sediments, and wastes at full scale. Thermal treatment usually involves application of heat and reduced pressure to volatilize mercury from the contaminated medium, followed by conversion of the mercury vapors into liquid elemental mercury by condensation. The liquid elemental mercury collected from the condenser units can be reused or further treated, typically by amalgamation, for disposal. Off-gasses also may require further treatment. Thermal treatment is also used at mercury recycling facilities to treat wastes that contain mercury.
Technology Description and Principles Thermal treatment has been used at the full scale to treat mercury-contaminated soil and waste. It uses heat to volatilize mercury from the contaminated medium. Thermal treatment processes commonly used to treat mercury-contaminated wastes are thermal desorption and retorting or roasting (Refs. 5.1, 5.2, 5.3). The main components of a thermal desorption system are a pre-treatment and material handling unit, a desorption unit, and a post-treatment unit for treatment of off-gas and processed medium (soil or waste). Pre-treatment of contaminated media involves removing extraneous matter such as plastic or rubber and dewatering to achieve suitable moisture content (Refs. 5.1, 5.2). The pre-treated waste is then placed in the thermal desorber, where it is heated to volatilize mercury in the waste. Types of thermal desorbers include direct-fired rotary kilns and indirectly heated screw or auger systems. The motion of the rotary drum or auger agitates the waste, promoting mixing and more uniform heating. A typical thermal desorption unit for mercury removal operates at temperatures ranging from 320 to 700 °C (600 to 1,300 °F) (Refs. 5.2, 5.3, 5.5, and 5.10). The boiling point of elemental mercury at 1 atmosphere pressure is 350°C (662°F), which renders it suitable for removal by thermal processes (Refs. 5.3, 5.4). The high temperatures used in thermal desorption units convert mercury into the gaseous or vapor phase, which is collected and further treated, removing mercury from the contaminated medium. Off-gas generated by the desorption unit is passed through wet scrubbers or fabric filters to remove particulate matter. The off-gas stream free from particulates is then condensed to collect liquid elemental mercury. The remaining off-gas vapors generated in the process are passed through additional APC devices such as sulfur-impregnated carbon to capture any residual mercury. Mercury reacts with sulfur in the activated carbon to form a more stable compound, mercuric sulfide. Organic contaminants in the off-gas are treated in a secondary combustion chamber or a catalytic oxidizer and then released into the atmosphere (Refs. 5.2, 5.3, and 5.4). Any APC should undergo periodic performance testing to ensure that mercury is not leaking. A retorting or roasting process is similar to thermal desorption except that it does not involve agitation (Ref. 5.4). The main components of a mercury retort system include a retort oven, condensers, a mercury trap, a sulfonated carbon adsorber, and a vacuum pump. Mercury-contaminated material is placed in pans that are stacked in the retort oven. Retorts can be heated either electrically or with fuel burners. In electric retorts, the heating elements are in direct contact with the contaminated medium, while in fuel-fired retorts the burner heats the air surrounding the retort (Ref. 5.3). The retort chamber typically operates at temperatures of 425 to 540°C (797 to 1004°F) under a vacuum to facilitate volatilization of
5-1 August 2007
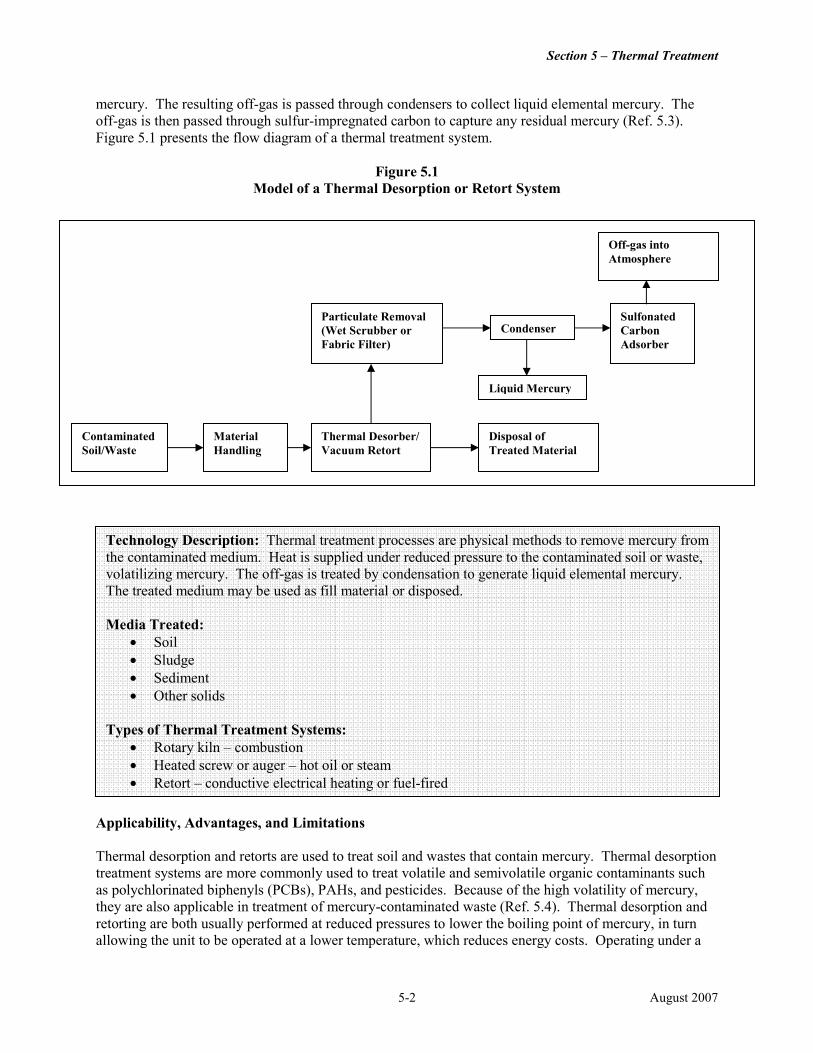
Section 5 – Thermal Treatment
mercury. The resulting off-gas is passed through condensers to collect liquid elemental mercury. The off-gas is then passed through sulfur-impregnated carbon to capture any residual mercury (Ref. 5.3). Figure 5.1 presents the flow diagram of a thermal treatment system.
Figure 5.1 Model of a Thermal Desorption or Retort System
Off-gas into Atmosphere
Particulate Removal Sulfonated (Wet Scrubber or Condenser Carbon Fabric Filter) Adsorber
Liquid Mercury
Contaminated Material Thermal Desorber/ Disposal of Soil/Waste Handling Vacuum Retort Treated Material
Technology Description: Thermal treatment processes are physical methods to remove mercury from the contaminated medium. Heat is supplied under reduced pressure to the contaminated soil or waste, volatilizing mercury. The off-gas is treated by condensation to generate liquid elemental mercury. The treated medium may be used as fill material or disposed. Media Treated:
• Soil • Sludge • Sediment • Other solids
Types of Thermal Treatment Systems:
• Rotary kiln – combustion • Heated screw or auger – hot oil or steam • Retort – conductive electrical heating or fuel-fired
Applicability, Advantages, and Limitations Thermal desorption and retorts are used to treat soil and wastes that contain mercury. Thermal desorption treatment systems are more commonly used to treat volatile and semivolatile organic contaminants such as polychlorinated biphenyls (PCBs), PAHs, and pesticides. Because of the high volatility of mercury, they are also applicable in treatment of mercury-contaminated waste (Ref. 5.4). Thermal desorption and retorting are both usually performed at reduced pressures to lower the boiling point of mercury, in turn allowing the unit to be operated at a lower temperature, which reduces energy costs. Operating under a
5-2 August 2007
Section 5 – Thermal Treatment
vacuum also reduces emissions of process gases. In some cases, the treated soil can be used as fill material (Ref. 5.4). In the presence of high concentrations of mercury, the treated wastes may be passed through the system more than once or the residence times may be increased to achieve treatment goals for mercury (Ref. 5.4). APC devices must be used to control emissions of mercury vapors. The vapor density of mercury is seven times higher than of air; therefore, mercury vapors in an air environment tend to settle rather than rise. Because of this property of the metal, the gas outlet and the fugitive emission collection points should be located at the bottom of the thermal desorption or retort chamber. The presence of large quantities of organic materials in a mercury retort system that contain small amounts of oxygen may result in pyrolysis, which can create combustible off-gasses that present an explosion hazard (Ref. 5.3). The presence of larger particles in the contaminated medium may impair heat transfer between the heating elements or the combustion gas and the medium. Conversely, smaller particles may increase the particulate content in the off gas (Ref. 5.6).
Factors Affecting Thermal Treatment Performance and Cost General factors:
• Soil type: Sandy soils are more suitable for thermal treatment than are silty and clay soils. Finer soils and soils with high humic content require longer processing time, which results in increased unit costs (Refs. 5.2, 5.7).
• Organic content: The presence of organic materials may present an explosion hazard if the materials pyrolyze (Ref. 5.3). In one project, the presence of elevated levels of sulfur pyrite sparked a fire when it was exposed to high temperatures. This fire destroyed the air emission control equipment (Ref. 5.8).
• Particle size: The presence of large particles in the contaminated medium may impair heat transfer between the heating elements or the combustion gas and the medium (Ref. 5.6).
• Moisture content: Wastes with moisture content higher than 20 to 25 percent have to undergo pre-treatment (dewatering or mixing with dry materials) before they are loaded into the thermal desorption or retort unit. Pre-treatment can increase the overall processing time and may result in higher treatment costs (Ref. 5.7).
• Residence time: A higher concentration of mercury in waste may require a longer residence time to meet treatment goals. This longer residence time can increase the treatment costs (Ref. 5.4).
• System throughput: Wastes with moisture content higher than 20 to 25 percent usually must be treated in smaller volumes. This smaller volume may result in reduced throughput and higher treatment costs (Ref. 5.8).
Factors specific to thermal treatment of mercury-contaminated media:
• Amount of mercury in waste: A higher concentration of mercury in waste may require the waste to be passed more than once through the treatment system (Ref. 5.4).
• Operating Temperature and Pressure: The boiling point of elemental mercury at 1 atmosphere (1,014 kilopascals) is 350 °C. Exposure of mercury-contaminated wastes to higher temperature (380 °C) at a reduced pressure, ranging from 100 to 200 kilopascals, increases the volatility of mercury in the waste (Ref. 5.5). A thermal desorber is exposed to temperatures ranging from 320 to 700 °C (600 to 1,300 °F) to facilitate mercury removal (Refs. 5.2, 5.3, 5.5, and 5.10).
5-3 August 2007
Section 5 – Thermal Treatment
Type, Number, and Scale of Identified Projects Thermal treatment of soil and waste that contain mercury has been applied at full scale and tested at the pilot scale. Data sources used for this report include information about three full-scale and five pilot-scale applications of thermal technologies to treat mercury. One of the full-scale applications identified is at a Superfund site (Project 1, Table 5.1). Summary of Performance and Cost Data Table 5.1 summarizes information for three full-scale and five pilot-scale projects. The performance of thermal treatment is usually measured by leach testing a sample of the treated mass. Among the full-scale projects, the media treated include soil, sludge, and sediment. The amount of media treated during Projects 1 and 2 (Table 5.1) were 80,000 and 26,000 tons. The other full-scale project (Project 8, Table 5.1) involves an ongoing, continuous treatment process that treats approximately 7 tons of mercury-contaminated media per day. Site types include an industrial landfill, a pesticide manufacturing site, and a mercury-recycling site. The initial concentration of mercury at one site was 0.16 mg/kg (Project 2, Table 5.1); the initial concentrations for the other two projects were not available. Final leachable mercury concentrations as measured by the TCLP were less than 0.2 mg/L for Projects 1 and 8 (Table 5.1). The concentration of total mercury was less than 1 mg/kg for Project 1, and it was less than 0.12 mg/kg for Project 2. Among the pilot-scale projects, the media treated include soil and sludge. The quantity of media treated ranged from 0.5 tons to 62 tons. Performance data show that, for one of the five projects, the final mercury concentration in the leachate was reduced to below 0.025 mg/L (Project 3, Table 5.1). Final concentrations of mercury in the leachate were not available for the other four projects (Projects 4 through 7, Table 5.1). The final concentrations of total mercury for these four projects ranged from 0.01 mg/kg to 18.7 mg/kg. Table 5.2 provides total actual costs for one pilot-scale and two full-scale projects. Thermal desorption was part of a treatment train, applied after soil washing, for the pilot-scale project. The costs provided for this project (Table 5.2) include soil washing as well. Data sources used for this report did not provide unit costs for any of these projects.
Case Study: Brookhaven Chemical Holes BNL conducted pilot-scale studies to demonstrate the treatment of mercury-contaminated soil using high-temperature thermal desorption (HTTD) under a high vacuum (Ref. 5.10). The contaminated soil was excavated from the BNL Chemical Holes during a cleanup effort at the research laboratory. The treatment process involved application of heat at temperatures as high as 700 °C (1,300 °F). The mercury-contaminated soil was shredded before it was loaded into the thermal desorption unit. The HTTD unit was then sealed and a vacuum of approximately 25 inches of mercury was applied. Fuel-fired heat was supplied indirectly to the treatment system. As the temperature reached 700 °C (1,300 °F), mercury and other volatile substances in the waste vaporized and were drawn out of the desorber by vacuum. The initial total concentration of mercury in the waste was as high as 5,510 mg/kg, while the leachable concentrations of mercury ranged from 0.2 to 1.4 mg/L (TCLP). The final concentration of total mercury was reduced to less than 10 mg/kg, while the leachable concentrations of mercury ranged from non-detect levels to 0.0084 mg/L (TCLP) (Project 3, Table 5.1). The concentration of mercury in the air emissions ranged from 1 to 29 micrograms per cubic meter (µg/m3), which is below the maximum achievable control technology (MACT) standard of 40 µg/m3. A total of approximately 3,000 pounds of contaminated soil and sludge were treated during this project (Ref. 5.10).
5-4 August 2007
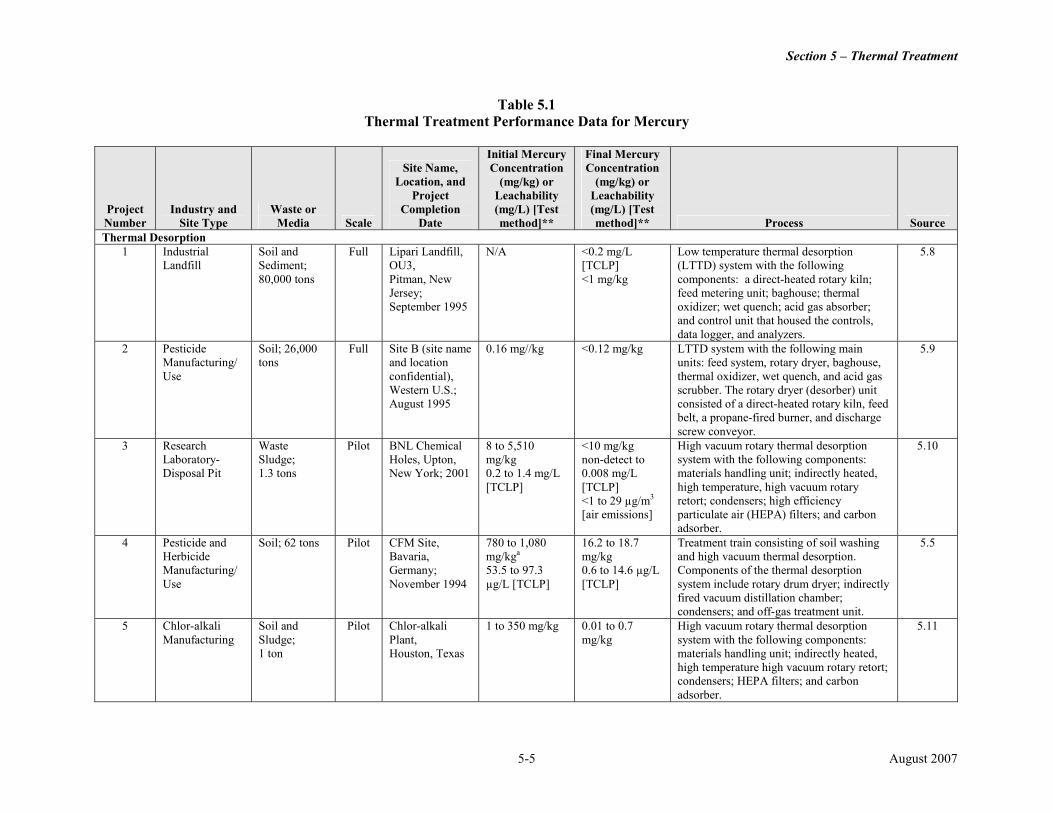
Section 5 – Thermal Treatment
Table 5.1 Thermal Treatment Performance Data for Mercury
Site Name, Initial Mercury Concentration
Final Mercury Concentration
Project Number
Industry and Site Type
Waste or Media Scale
Location, and Project
Completion Date
(mg/kg) or Leachability (mg/L) [Test method]**
(mg/kg) or Leachability (mg/L) [Test method]** Process Source
Thermal Desorption 1 Industrial
Landfill Soil and Sediment;
Full Lipari Landfill, OU3,
N/A <0.2 mg/L [TCLP]
Low temperature thermal desorption (LTTD) system with the following
5.8
80,000 tons Pitman, New Jersey; September 1995
<1 mg/kg components: a direct-heated rotary kiln; feed metering unit; baghouse; thermal oxidizer; wet quench; acid gas absorber; and control unit that housed the controls, data logger, and analyzers.
2 Pesticide Manufacturing/ Use
Soil; 26,000 tons
Full Site B (site name and location confidential), Western U.S.; August 1995
0.16 mg//kg <0.12 mg/kg LTTD system with the following main units: feed system, rotary dryer, baghouse, thermal oxidizer, wet quench, and acid gas scrubber. The rotary dryer (desorber) unit consisted of a direct-heated rotary kiln, feed belt, a propane-fired burner, and discharge
5.9
screw conveyor. 3 Research
Laboratory-Disposal Pit
Waste Sludge; 1.3 tons
Pilot BNL Chemical Holes, Upton, New York; 2001
8 to 5,510 mg/kg 0.2 to 1.4 mg/L [TCLP]
<10 mg/kg non-detect to 0.008 mg/L [TCLP] <1 to 29 µg/m3
[air emissions]
High vacuum rotary thermal desorption system with the following components: materials handling unit; indirectly heated, high temperature, high vacuum rotary retort; condensers; high efficiency particulate air (HEPA) filters; and carbon adsorber.
5.10
4 Pesticide and Herbicide
Soil; 62 tons Pilot CFM Site, Bavaria,
780 to 1,080 mg/kga
16.2 to 18.7 mg/kg
Treatment train consisting of soil washing and high vacuum thermal desorption.
5.5
Manufacturing/ Germany; 53.5 to 97.3 0.6 to 14.6 µg/L Components of the thermal desorption Use November 1994 µg/L [TCLP] [TCLP] system include rotary drum dryer; indirectly
fired vacuum distillation chamber; condensers; and off-gas treatment unit.
5 Chlor-alkali Soil and Pilot Chlor-alkali 1 to 350 mg/kg 0.01 to 0.7 High vacuum rotary thermal desorption 5.11 Manufacturing Sludge;
1 ton Plant, Houston, Texas
mg/kg system with the following components: materials handling unit; indirectly heated, high temperature high vacuum rotary retort; condensers; HEPA filters; and carbon adsorber.
5-5 August 2007
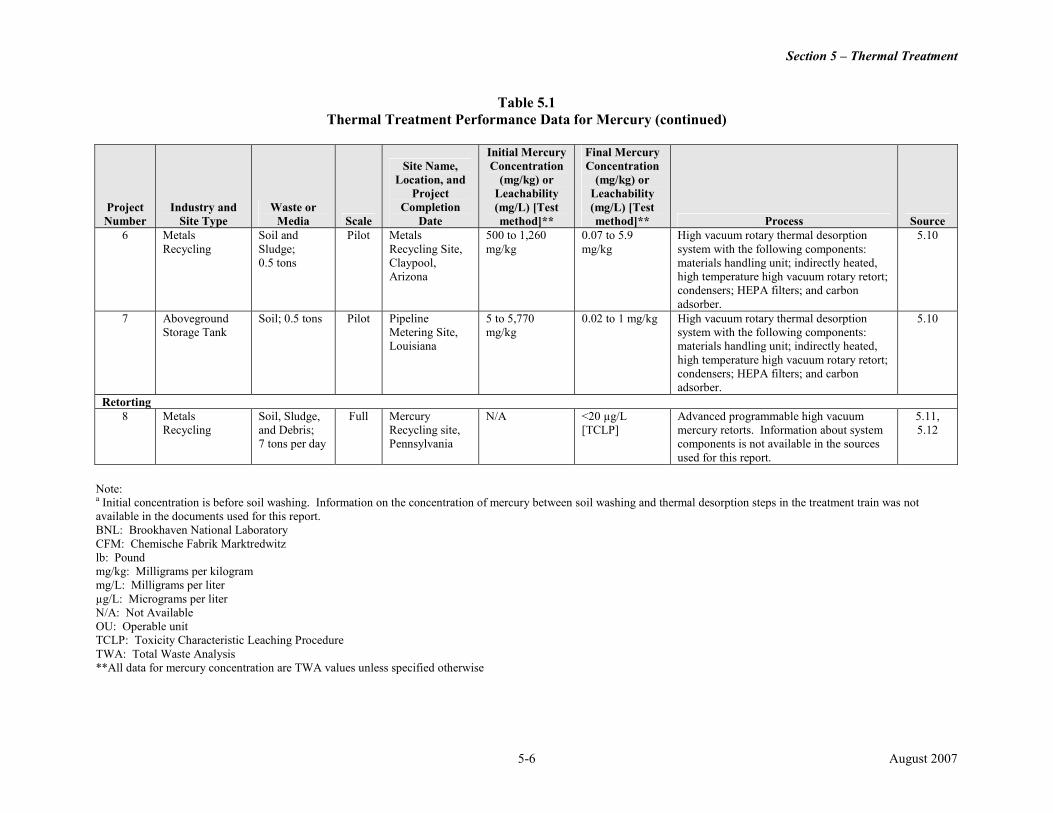
Section 5 – Thermal Treatment
Table 5.1 Thermal Treatment Performance Data for Mercury (continued)
Site Name, Initial Mercury Concentration
Final Mercury Concentration
Project Number
Industry and Site Type
Waste or Media Scale
Location, and Project
Completion Date
(mg/kg) or Leachability (mg/L) [Test method]**
(mg/kg) or Leachability (mg/L) [Test method]** Process Source
6 Metals Soil and Pilot Metals 500 to 1,260 0.07 to 5.9 High vacuum rotary thermal desorption 5.10 Recycling Sludge;
0.5 tons Recycling Site, Claypool, Arizona
mg/kg mg/kg system with the following components: materials handling unit; indirectly heated, high temperature high vacuum rotary retort; condensers; HEPA filters; and carbon adsorber.
7 Aboveground Storage Tank
Soil; 0.5 tons Pilot Pipeline Metering Site, Louisiana
5 to 5,770 mg/kg
0.02 to 1 mg/kg High vacuum rotary thermal desorption system with the following components: materials handling unit; indirectly heated,
5.10
high temperature high vacuum rotary retort; condensers; HEPA filters; and carbon adsorber.
Retorting 8 Metals
Recycling Soil, Sludge, and Debris; 7 tons per day
Full Mercury Recycling site, Pennsylvania
N/A <20 µg/L [TCLP]
Advanced programmable high vacuum mercury retorts. Information about system components is not available in the sources
5.11, 5.12
used for this report.
Note: a Initial concentration is before soil washing. Information on the concentration of mercury between soil washing and thermal desorption steps in the treatment train was not available in the documents used for this report. BNL: Brookhaven National Laboratory CFM: Chemische Fabrik Marktredwitz lb: Pound mg/kg: Milligrams per kilogram mg/L: Milligrams per liter µg/L: Micrograms per liter N/A: Not Available OU: Operable unit TCLP: Toxicity Characteristic Leaching Procedure TWA: Total Waste Analysis **All data for mercury concentration are TWA values unless specified otherwise
5-6 August 2007
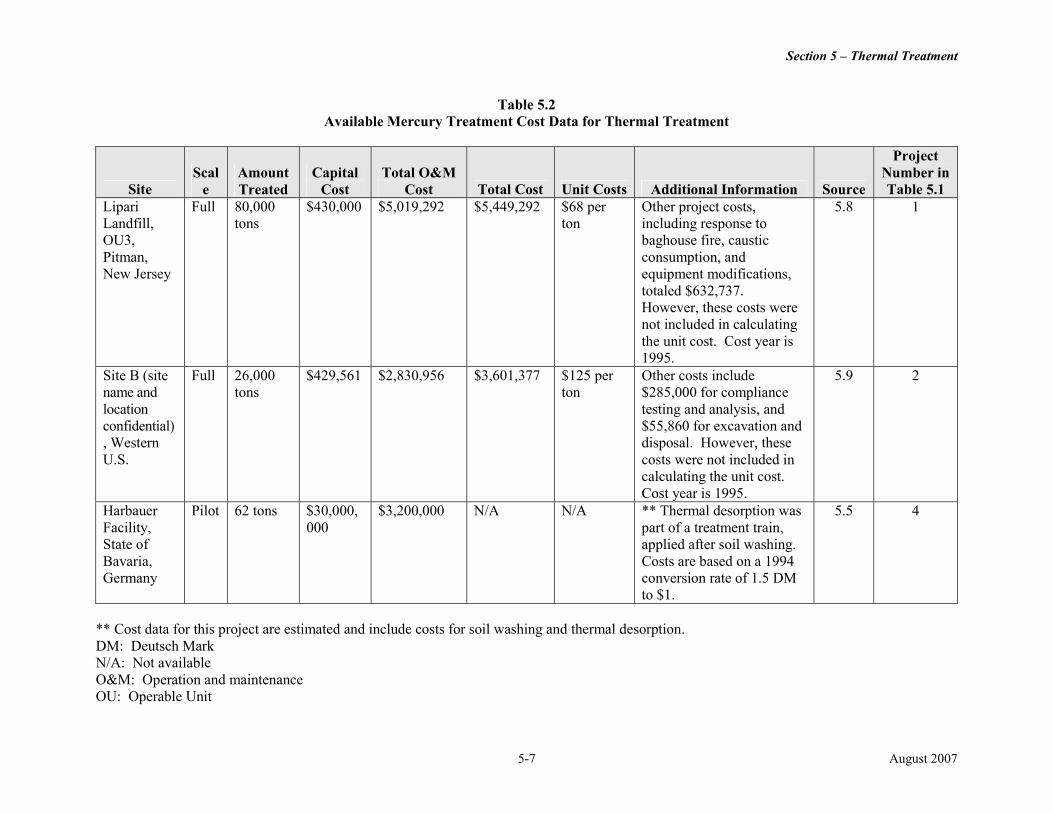
Section 5 – Thermal Treatment
Table 5.2 Available Mercury Treatment Cost Data for Thermal Treatment
Project Scal Amount Capital Total O&M Number in
Site e Treated Cost Cost Total Cost Unit Costs Additional Information Source Table 5.1 Lipari Landfill, OU3,
Full 80,000 tons
$430,000 $5,019,292 $5,449,292 $68 per ton
Other project costs, including response to baghouse fire, caustic
5.8 1
Pitman, New Jersey
consumption, and equipment modifications, totaled $632,737. However, these costs were not included in calculating the unit cost. Cost year is 1995.
Site B (site Full 26,000 $429,561 $2,830,956 $3,601,377 $125 per Other costs include 5.9 2 name and tons ton $285,000 for compliance location testing and analysis, and confidential) $55,860 for excavation and , Western disposal. However, these U.S. costs were not included in
calculating the unit cost. Cost year is 1995.
Harbauer Pilot 62 tons $30,000, $3,200,000 N/A N/A ** Thermal desorption was 5.5 4 Facility, 000 part of a treatment train, State of applied after soil washing. Bavaria, Costs are based on a 1994 Germany conversion rate of 1.5 DM
to $1.
** Cost data for this project are estimated and include costs for soil washing and thermal desorption. DM: Deutsch Mark N/A: Not available O&M: Operation and maintenance OU: Operable Unit
5-7 August 2007
Section 5 – Thermal Treatment
References
5.1 P. Kulakow. A Guide to Thermal Desorption (adapted from EPA Technology Fact Sheet: EPA 542-F-96-005). Date unknown. http://www.engg.ksu.edu/HSRC/Tosc/desorp.pdf.
5.2 Federal Remediation Technologies Reference Guide and Screening Manual, Version 4.0. 2001. Federal Remediation Technologies Roundtable. September 5. http://www.frtr.gov/matrix2/top_page.html.
5.3 Washburn, Charles, and Eldan Hill. 2003. Mercury Retorts for the Processing of Precious Metals and Hazardous Wastes. The Member Journal of The Minerals, Metals & Materials Society (JOM). April.
5.4 The Interstate Technology & Regulatory Council. 1998. Technical Guidelines for On-Site Thermal Desorption of Solid Media and Low Level Mixed Waste Contaminated with Mercury and/or Hazardous Chlorinated Organics. September 2. Available at: http://www.itrcweb.org/user/td-3.pdf.
5.5 U.S. Environmental Protection Agency (EPA) Office of Research and Development. 1996. Harbauer Soil Washing/Vacuum Distillation System. EPA – BMBF Bilateral SITE Demonstration. Innovative Technology Evaluation Report. August. http://www.epa.gov/ORD/SITE/Bilateral/harbauer.pdf.
5.6 U.S EPA Office of Solid Waste and Emergency Response. 2002. Arsenic Treatment Technologies for Soil, Waste, and Water. EPA-542-R-02-004. September. http://www.cluin.org/download/remed/542r02004/arsenic_report.pdf.
5.7 Blanchard, John, and Robert Stamnes. 1997. U.S. Environmental Protection Agency Office of Solid Waste and Emergency Response. Engineering Forum Issue Paper: Thermal Desorption Implementation Issues. EPA 540/F-95/031. January. http://www.epa.gov/swertio1/tsp/download/tdissue.pdf.
5.8 U.S. EPA. 2002. Cost and Performance Summary Report: Thermal Desorption at the Lipari Landfill, Operable Unit 3, Pitman, New Jersey. March. http://costperformance.org/profile.cfm?ID=137&CaseID=137.
5.9 U.S. EPA. 2003. Cost and Performance Summary Report: Thermal Desorption at Site B, Western United States. February. http://costperformance.org/profile.cfm?ID=333&CaseID=333.
5.10 U.S. Department of Energy Office of Science and Technology. 2002. Innovative Technology Summary Report: The SepraDyne™-Raduce System for Recovery of Mercury from Mixed Waste. September. DOE/EM-0633. http://apps.em.doe.gov/OST/pubs/itsrs/itsr2380.pdf.
5.11 EPA Remediation and Characterization Innovative Technologies (EPA REACH IT) online database. SepraDyne Corporation - Vacuum Desorption. http://www.epareachit.org. Accessed January 2006.
5.12 Bethlehem Apparatus Company, Inc. http://www.bethlehemapparatus.com. Accessed January 2006.
5.13 EPA EPA REACH IT – online database. Bethlehem Apparatus Company, Inc. – Advanced Programmable High Vacuum Retort. http://www.epareachit.org. Accessed January 2006.
5-8 August 2007
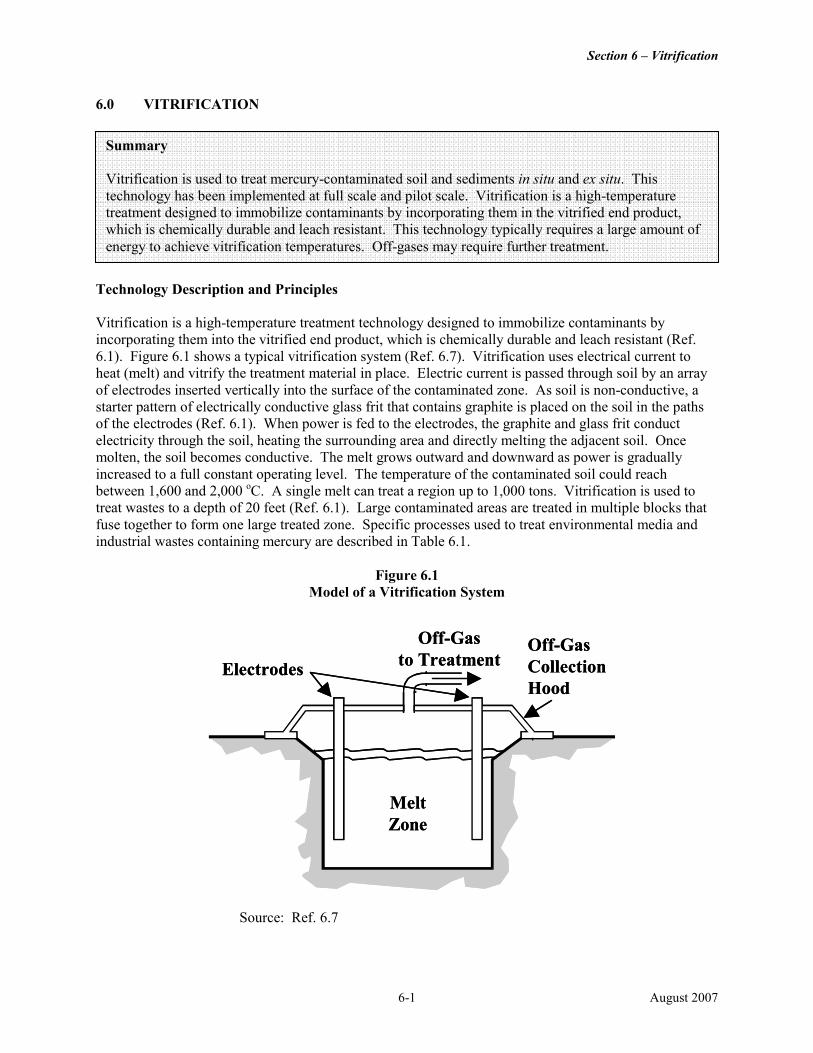
Section 6 – Vitrification
6.0 VITRIFICATION
Summary Vitrification is used to treat mercury-contaminated soil and sediments in situ and ex situ. This technology has been implemented at full scale and pilot scale. Vitrification is a high-temperature treatment designed to immobilize contaminants by incorporating them in the vitrified end product, which is chemically durable and leach resistant. This technology typically requires a large amount of energy to achieve vitrification temperatures. Off-gases may require further treatment.
Technology Description and Principles Vitrification is a high-temperature treatment technology designed to immobilize contaminants by incorporating them into the vitrified end product, which is chemically durable and leach resistant (Ref. 6.1). Figure 6.1 shows a typical vitrification system (Ref. 6.7). Vitrification uses electrical current to heat (melt) and vitrify the treatment material in place. Electric current is passed through soil by an array of electrodes inserted vertically into the surface of the contaminated zone. As soil is non-conductive, a starter pattern of electrically conductive glass frit that contains graphite is placed on the soil in the paths of the electrodes (Ref. 6.1). When power is fed to the electrodes, the graphite and glass frit conduct electricity through the soil, heating the surrounding area and directly melting the adjacent soil. Once molten, the soil becomes conductive. The melt grows outward and downward as power is gradually increased to a full constant operating level. The temperature of the contaminated soil could reach between 1,600 and 2,000 oC. A single melt can treat a region up to 1,000 tons. Vitrification is used to treat wastes to a depth of 20 feet (Ref. 6.1). Large contaminated areas are treated in multiple blocks that fuse together to form one large treated zone. Specific processes used to treat environmental media and industrial wastes containing mercury are described in Table 6.1.
Figure 6.1 Model of a Vitrification System
OffOff--GasGas OfOff-Gasf-Gas to Tto TreatmreatmeennttEEllectrodectrodee Css Coolllleeccttioionn
HoodHood
MelMeltt ZoZonene
Source: Ref. 6.7
6-1 August 2007
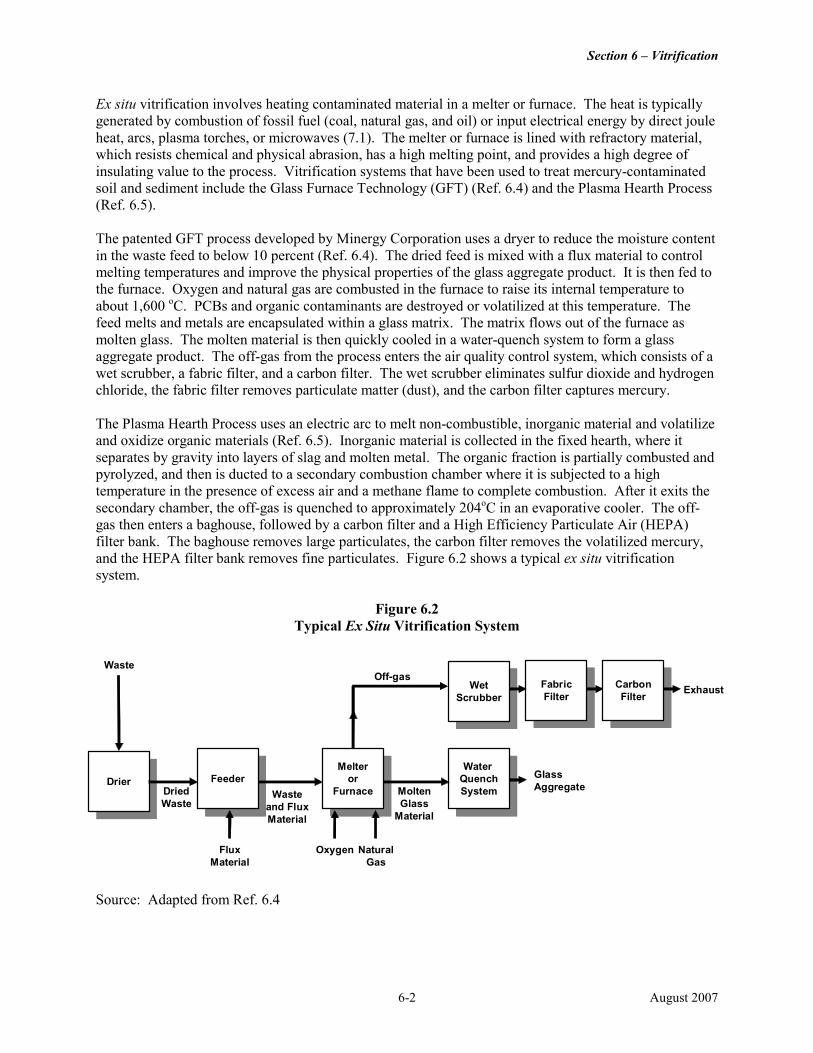
Drier FeederMelter
orFurnace
Water QuenchSystem
WetScrubber
FabricFilter
CarbonFilter
Section 6 – Vitrification
Ex situ vitrification involves heating contaminated material in a melter or furnace. The heat is typically generated by combustion of fossil fuel (coal, natural gas, and oil) or input electrical energy by direct joule heat, arcs, plasma torches, or microwaves (7.1). The melter or furnace is lined with refractory material, which resists chemical and physical abrasion, has a high melting point, and provides a high degree of insulating value to the process. Vitrification systems that have been used to treat mercury-contaminated soil and sediment include the Glass Furnace Technology (GFT) (Ref. 6.4) and the Plasma Hearth Process (Ref. 6.5).
The patented GFT process developed by Minergy Corporation uses a dryer to reduce the moisture content in the waste feed to below 10 percent (Ref. 6.4). The dried feed is mixed with a flux material to control melting temperatures and improve the physical properties of the glass aggregate product. It is then fed to the furnace. Oxygen and natural gas are combusted in the furnace to raise its internal temperature to about 1,600 oC. PCBs and organic contaminants are destroyed or volatilized at this temperature. The feed melts and metals are encapsulated within a glass matrix. The matrix flows out of the furnace as molten glass. The molten material is then quickly cooled in a water-quench system to form a glass aggregate product. The off-gas from the process enters the air quality control system, which consists of a wet scrubber, a fabric filter, and a carbon filter. The wet scrubber eliminates sulfur dioxide and hydrogen chloride, the fabric filter removes particulate matter (dust), and the carbon filter captures mercury.
The Plasma Hearth Process uses an electric arc to melt non-combustible, inorganic material and volatilize and oxidize organic materials (Ref. 6.5). Inorganic material is collected in the fixed hearth, where it separates by gravity into layers of slag and molten metal. The organic fraction is partially combusted and pyrolyzed, and then is ducted to a secondary combustion chamber where it is subjected to a high temperature in the presence of excess air and a methane flame to complete combustion. After it exits the secondary chamber, the off-gas is quenched to approximately 204oC in an evaporative cooler. The off-gas then enters a baghouse, followed by a carbon filter and a High Efficiency Particulate Air (HEPA) filter bank. The baghouse removes large particulates, the carbon filter removes the volatilized mercury, and the HEPA filter bank removes fine particulates. Figure 6.2 shows a typical ex situ vitrification system.
Figure 6.2 Typical Ex Situ Vitrification System
Drier Feeder Melter
or Furnace
Water Quench System
Wet Scrubber
Waste
Dried Waste
Waste and Flux Material
Molten Glass
Material
Fabric Filter
Carbon Filter
Glass Aggregate
Exhaust Off-gas
Flux Oxygen Natural Material Gas
Source: Adapted from Ref. 6.4
6-2 August 2007
Section 6 – Vitrification
Technology Description: Vitrification is a high-temperature treatment designed to immobilize contaminants by incorporating them in the vitrified end product, which is chemically durable and leach resistant. The primary residual generated by this technology is typically glass cullet or aggregate. Secondary residuals generated are air emissions, scrubber liquor, carbon filters, and used hood panels. This process may also cause contaminants to volatilize or undergo thermal destruction, thereby reducing their concentration in the soil or waste. Media Treated:
• Soil • Sediments
Energy Sources Used for Vitrification:
• Fossil fuels • Direct joule heat
Energy Delivery Mechanisms Used for Vitrification:
• Arcs • Plasma torches • Microwaves • Electrodes (in situ)
In Situ Application Depth:
• Maximum demonstrated depth is 20 feet • Very shallow depths or depths greater than 20 feet may require innovative techniques
Applicability, Advantages, and Limitations The presence of chlorides, fluorides, sulfides, and sulfates may interfere with the process, resulting in higher mobility of mercury in the vitrified product. Feeding additional slag-forming materials such as sand to the process may compensate for the presence of chlorides, fluorides, sulfides, and sulfates (Ref. 6.1). Chlorides in excess of 0.5 weight percent will typically fume off and enter the off-gas. If chlorides are excessively concentrated, salts of alkali, alkaline earth, and heavy metals may accumulate in the solid residues collected by off-gas treatment. Separation of the chloride salts from the residue may be necessary, therefore, if the residue is returned to the process for treatment. Dioxins and furans may also form when excess chlorides are present and enter the off-gas treatment system (Ref. 6.1). The presence of these constituents may also lead to the formation of volatile metal species or corrosive acids in the off-gas (Ref. 6.1). During vitrification, combustion of the organic content of the waste liberates heat, reducing the external energy requirements. Therefore, this process may be advantageous in the treatment of wastes that contain a combination of mercury and organic contaminants or for the treatment of organo-mercury compounds. However, high concentrations of organic materials and moisture may result in high volumes of off-gas as the organic constituents volatilize and combust and water turns to steam, which may impair the function of the emissions control systems. Vitrification can also increase the density of treated material, thereby reducing its volume. In some cases, the vitrified product can be reused or sold (Ref. 6.4).
6-3 August 2007
Section 6 – Vitrification
Excavation of soil is not required for in situ vitrification. In situ vitrification has been used to a depth of 20 feet (Ref. 6.3). Contamination at very shallow depths or depths greater than 20 feet may require innovative application techniques. Ex situ treatment processes typically are not transportable, and so contaminated materials must be delivered to the facility for treatment. If sediments are treated using this process, the materials must be dewatered before treatment. In cold climates, indoor storage of feed materials may be required to avoid freezing (Ref. 6.4). High concentrations of mercury in soil or sediment may limit performance of this process. Metals retained in the melt must be dissolved to minimize formation of crystalline phases that can decrease the leach resistance of the vitrified product. Mercury may be difficult to treat because of its high volatility and low solubility in glass (less than 0.1 percent), but may be effectively treated at low concentrations (Ref. 6.1).
Factors Affecting Vitrification Performance and Cost
• Lack of glass-forming materials: If insufficient glass-forming materials (SiO2 at more than 30 percent by weight) and combined alkali (Na + K at more than 1.4 percent by weight) are present in the waste, the vitrified product may be less durable. The addition of frit or flux additives may compensate for the lack of glass-forming and alkali materials (Ref. 6.2).
• Particle size: Some vitrification units require that the particle size of the feed be controlled. Size reduction may be required to achieve acceptable throughputs and a homogeneous melt for wastes containing refractory compounds that melt above the unit’s nominal processing temperature, such as quartz and alumina. High-temperature processes, such as arcing and plasma processes, may not require size reduction of the feed (Ref. 6.1).
• Presence of groundwater: Groundwater control may be required for in situ vitrification if contamination is below the water table and hydraulic conductivity of the soil is more than 10-4 centimeters per second (cm/sec) (Ref. 6.2).
• Moisture content: Wastes that contain more than 25 percent moisture content may require excessive fuel or dewatering before treatment (Ref. 6.1).
• Subsurface air pockets: For in situ vitrification, subsurface air pockets, such as those that may be associated with buried drums, can cause molten material to bubble and splatter, resulting in a safety hazard (Ref. 6.2).
• Presence of halogenated organic compounds: The combustion of halogenated organic compounds may cause incomplete combustion and deposition of chlorides, which can result in higher mobility of mercury in the vitrified product (Ref. 6.1).
• Metals content: For in situ vitrification, high metals content may result in pooling of molten metals at the bottom of the melt, causing electrical short-circuiting. This technology is not recommended for sites with metals content greater than 25 percent by weight (Ref. 6.6).
• Organic content: For in situ vitrification, high organic content may cause excessive heating of the melt, damaging the treatment equipment. High concentrations of organic compounds may also create large volumes of off-gas as the organic constituents volatilize and combust and may overwhelm air emissions control systems. This technology is not recommended for sites that contain organic content of more than 7 to 10 percent by weight (Ref. 6.6).
• Characteristics of treated waste: Depending on the qualities of the vitrified waste, the treated soil and waste may be able to be reused or sold (Ref. 6.4).
6-4 August 2007
Section 6 – Vitrification
Type, Number, and Scale of Identified Projects Vitrification of soil and sediments that contain mercury has been applied at the full scale and demonstrated in the field. Data sources used for this report include information about one full-scale and two pilot-scale applications of this technology to treat mercury-contaminated soil and sediments. Summary of Performance and Cost Data Table 6.1 summarizes information for one full-scale and two pilot-scale projects. The performance of vitrification treatment is usually measured by leach testing a sample of the final vitrified material. In the full-scale project, the media treated included soil and sediments. The amount of media treated was 3,000 cubic yards (5,400 tons). The site was an agricultural chemical manufacturing plant. Confirmation coring samples indicated that vitrified materials met cleanup requirements for mercury in soil. Stack gas emissions met off-gas emissions requirements. The cleanup contractor’s cost at the site was $1,763,000, of which $800,000 was for vitrification and corresponded to $267 per cubic yard of soil treated (Ref. 6.3). The pilot-scale project using the GFT was used to treat river sediments contaminated with PCBs and metals. The river sediments were obtained from the Lower Fox River in Green Bay, Wisconsin. Approximately 27,000 pounds of dried sediments were treated using this process. Analytical results for the sediments before treatment indicated that the mercury concentration was about 0.001 micrograms per kilogram (µg/kg) (Ref. 6.4). Confirmation sampling results for the glass aggregate indicated that the mercury concentration was less than 0.0025 µg/kg. The concentration of leachable mercury in the glass aggregate was less than 0.000002 µg/L, as measured by the Synthetic Precipitate Leaching Procedure (SPLP). The cost to treat dewatered sediments was estimated to be $38.74 per ton (see Table 6.1, Project 2). Performance data for the pilot-scale project using the Plasma Hearth Process were unavailable. Table 6.2 provides cost data for the projects described above.
Case Study: Parsons Chemical Superfund Site The Parsons Chemical Superfund Site in Grand Ledge, Michigan, was an agricultural chemical mixing, manufacturing, and packaging facility. Full-scale vitrification on site using the Geosafe process was implemented to treat 3,000 cubic yards of soil and sediments contaminated with pesticides and heavy metals, including mercury and dioxin. The technology is capable of treating soil in situ; however, in this case, the contaminant depth was too shallow for the electrodes to be used effectively. Therefore, the technology was adapted by excavating the contaminated soil, placing it in a cell, and treating it in a trench on site. The contaminated area consisted of nine melt cells: eight separate melts were conducted at the site. The duration of each melt was 10 to 19.5 days, and melts required about a year to cool sufficiently to sample. Typical initial concentrations of mercury ranged from 2,220 to 4,760 µg/kg. Results for confirmation coring samples of the final vitrified soil indicated the concentration of mercury to be less than 40 µg/kg. The concentration of leachable mercury in the vitrified soils ranged from less than 0.2 to 0.23 µg/L, as measured by the TCLP. Concentrations of mercury in the off-gas emissions ranged from 12.9 to 17.7 µg/m3, or 0.0000989 to 0.000125 pounds per hour (see Table 6.1, Project 1).
6-5 August 2007
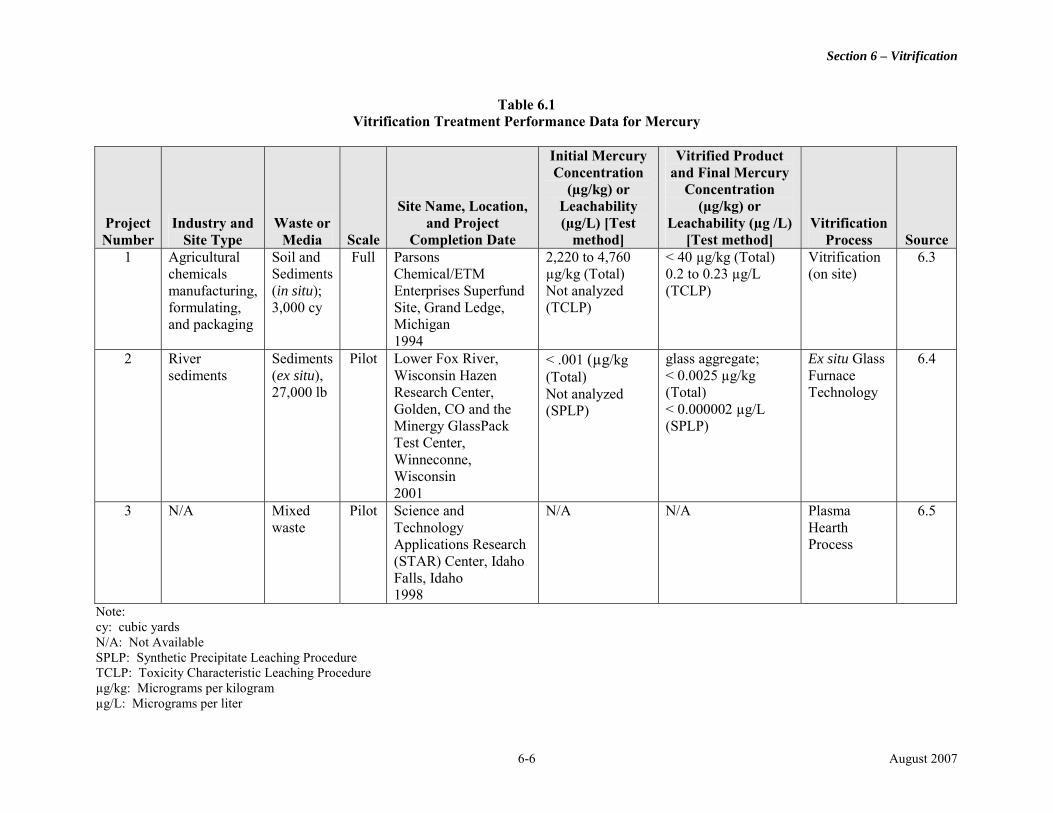
Section 6 – Vitrification
Table 6.1 Vitrification Treatment Performance Data for Mercury
Initial Mercury Vitrified Product
Site Name, Location,
Concentration (μg/kg) or
Leachability
and Final Mercury Concentration
(μg/kg) or Project Number
Industry and Site Type
Waste or Media Scale
and Project Completion Date
(μg/L) [Test method]
Leachability (μg /L) [Test method]
Vitrification Process Source
1 Agricultural chemicals
Soil and Sediments
Full Parsons Chemical/ETM
2,220 to 4,760 μg/kg (Total)
< 40 μg/kg (Total) 0.2 to 0.23 μg/L
Vitrification (on site)
6.3
manufacturing, formulating, and packaging
(in situ); 3,000 cy
Enterprises Superfund Site, Grand Ledge, Michigan
Not analyzed (TCLP)
(TCLP)
1994 2 River
sediments Sediments (ex situ), 27,000 lb
Pilot Lower Fox River, Wisconsin Hazen Research Center, Golden, CO and the Minergy GlassPack
< .001 (μg/kg (Total) Not analyzed (SPLP)
glass aggregate; < 0.0025 μg/kg (Total) < 0.000002 μg/L (SPLP)
Ex situ Glass Furnace Technology
6.4
Test Center, Winneconne, Wisconsin 2001
3 N/A Mixed Pilot Science and N/A N/A Plasma 6.5 waste Technology
Applications Research Hearth Process
(STAR) Center, Idaho Falls, Idaho 1998
Note: cy: cubic yards N/A: Not Available SPLP: Synthetic Precipitate Leaching Procedure TCLP: Toxicity Characteristic Leaching Procedure μg/kg: Micrograms per kilogram μg/L: Micrograms per liter
6-6 August 2007
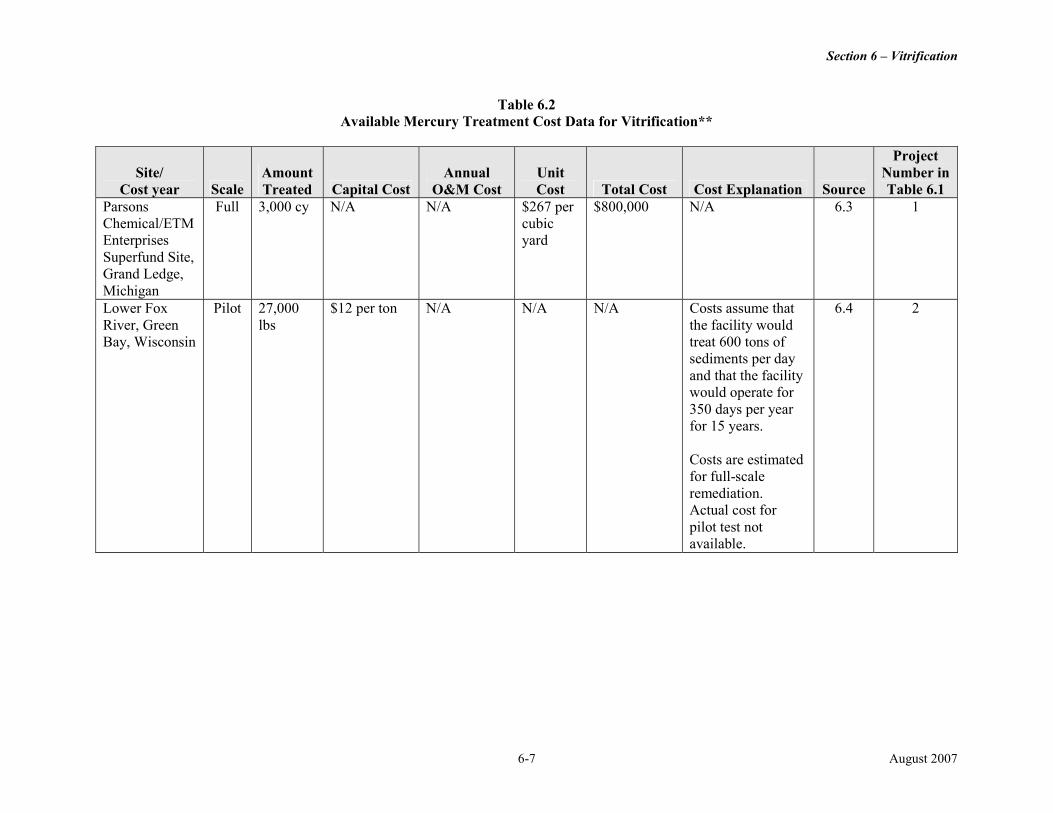
Section 6 – Vitrification
Table 6.2 Available Mercury Treatment Cost Data for Vitrification**
Project Site/ Amount Annual Unit Number in
Cost year Scale Treated Capital Cost O&M Cost Cost Total Cost Cost Explanation Source Table 6.1 Parsons Full 3,000 cy N/A N/A $267 per $800,000 N/A 6.3 1 Chemical/ETM cubic Enterprises yard Superfund Site, Grand Ledge, Michigan Lower Fox River, Green Bay, Wisconsin
Pilot 27,000 lbs
$12 per ton N/A N/A N/A Costs assume that the facility would treat 600 tons of sediments per day and that the facility would operate for 350 days per year for 15 years.
6.4 2
Costs are estimated for full-scale remediation. Actual cost for pilot test not available.
6-7 August 2007
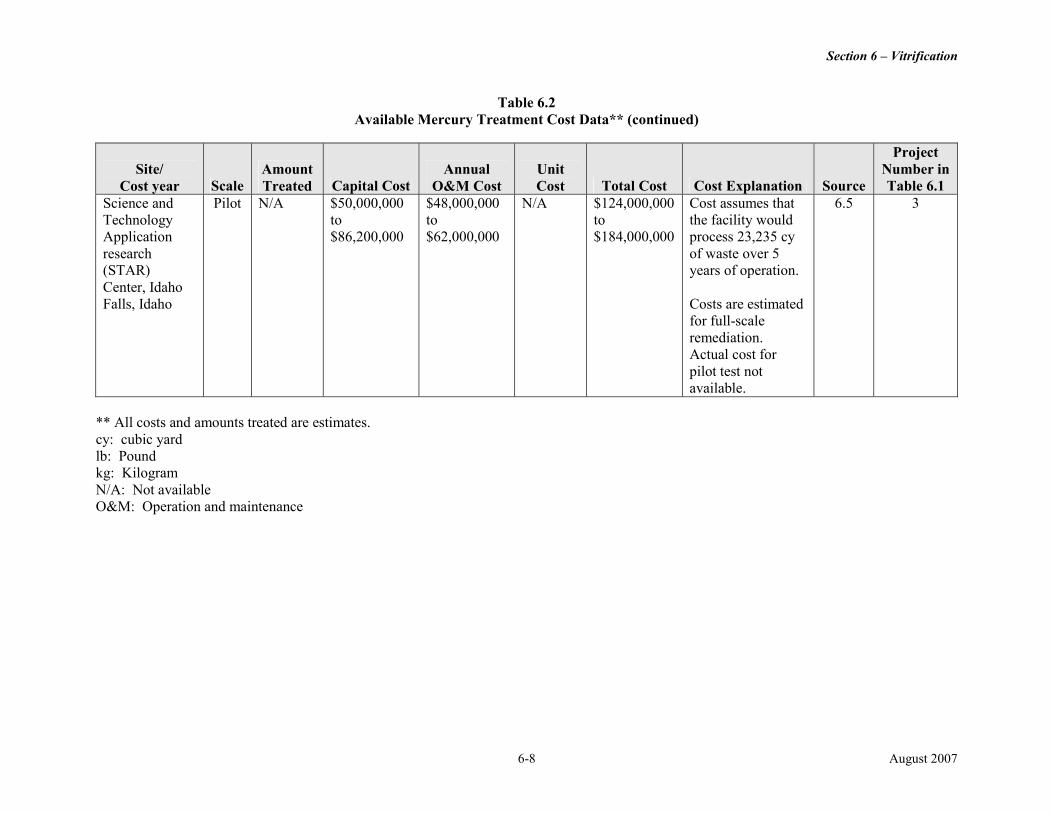
Section 6 – Vitrification
Table 6.2 Available Mercury Treatment Cost Data** (continued)
Project Site/ Amount Annual Unit Number in
Cost year Scale Treated Capital Cost O&M Cost Cost Total Cost Cost Explanation Source Table 6.1 Science and Technology Application research
Pilot N/A $50,000,000 to $86,200,000
$48,000,000 to $62,000,000
N/A $124,000,000 to $184,000,000
Cost assumes that the facility would process 23,235 cy of waste over 5
6.5 3
(STAR) Center, Idaho
years of operation.
Falls, Idaho Costs are estimated for full-scale remediation. Actual cost for pilot test not available.
** All costs and amounts treated are estimates. cy: cubic yard lb: Pound kg: Kilogram N/A: Not available O&M: Operation and maintenance
6-8 August 2007
Section 6 – Vitrification
References
6.1 U.S. Environmental Protection Agency (EPA) Office of Research and Development. 1997. Engineering Bulletin, Technology Alternatives for the Remediation of Soils Contaminated with Arsenic, Cadmium, Chromium, Mercury, and Lead. Cincinnati, OH. EPA-540-S-97-500. March. http://www.epa.gov/clariton/clhtml/pubtitleOSWER.html.
6.2 U.S. EPA. 1995. Contaminants and Remedial Options at Selected Metal-Contaminated Sites. Office of Research and Development. EPA-540-R-95-512. July. http://www.epa.gov/clariton/clhtml/pubtitleOSWER.html.
6.3 Federal Remediation Technologies Roundtable (FRTR). Cost and Performance Report. Parsons Chemical/ETM Enterprises Superfund Site Grand Ledge, Michigan. http://costperformance.org/pdf/parsons.pdf. Date unknown.
6.4 U.S. EPA Office of Research and Development. 2004. Minergy Corporation Glass Furnace Technology Evaluation Report. EPA/540/R-03/500. March. http://costperformance.org/pdf/20040702_353.pdf.
6.5 U.S. Department of Energy. 1998. Innovative Technology Summary Report. Plasma Hearth Process at the Science and Technology Research (STAR) Center, Idaho Falls, Idaho. November. http://costperformance.org/pdf/itsr26.pdf.
6.6 U.S.EPA. 1995. Superfund Innovative Technology Evaluation (SITE) Technology Capsule, Geosafe Corporation In Situ Vitrification Technology. Office of Research and Development. EPA/540/R-94/520. March. http://www.epa.gov/ORD/SITE/reports/540_r94_520.pdf.
6.7 U.S EPA Office of Solid Waste and Emergency Response. 2002. Arsenic Treatment Technologies for Soil, Waste, and Water. EPA-542-R-02-004. September. http://www.cluin.org/download/remed/542r02004/arsenic_report.pdf.
6-9 August 2007

This page is intentionally left blank.
6-10
PART IIB
TREATMENT TECHNOLOGIES APPLICABLE TO WATER

This page is intentionally left blank.
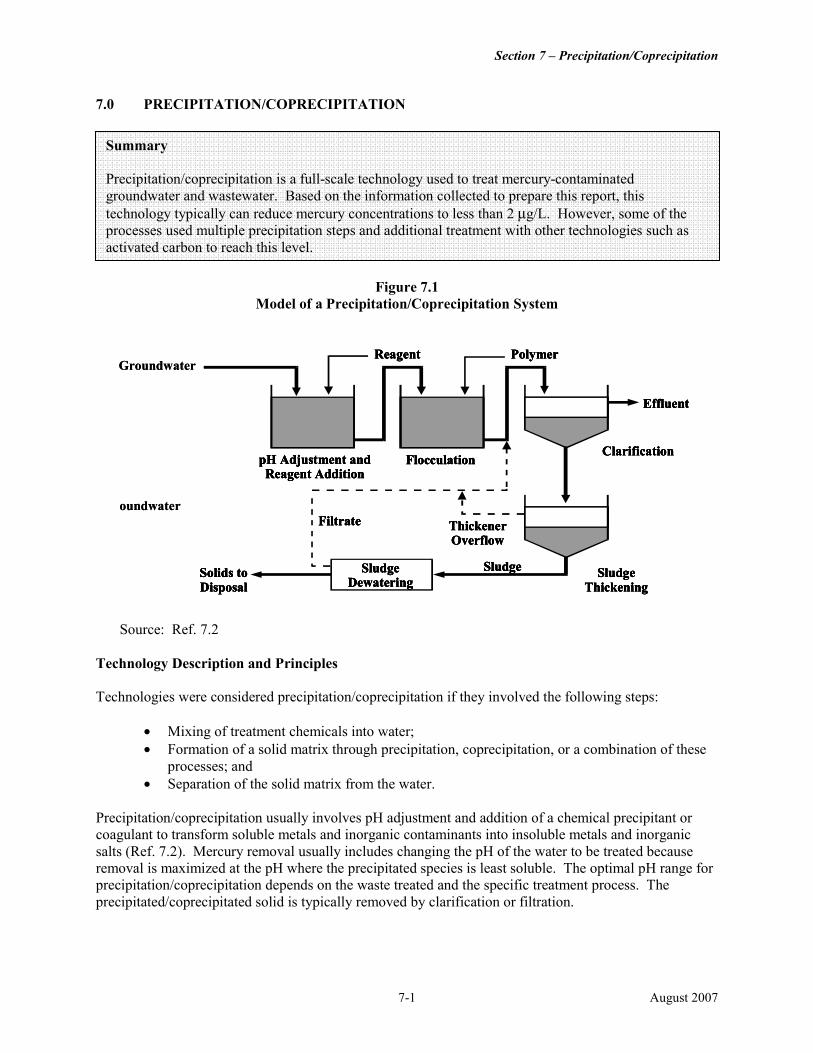
Section 7 – Precipitation/Coprecipitation
7.0 PRECIPITATION/COPRECIPITATION
Summary Precipitation/coprecipitation is a full-scale technology used to treat mercury-contaminated groundwater and wastewater. Based on the information collected to prepare this report, this technology typically can reduce mercury concentrations to less than 2 µg/L. However, some of the processes used multiple precipitation steps and additional treatment with other technologies such as activated carbon to reach this level.
Figure 7.1
Model of a Precipitation/Coprecipitation System
ReReReReagenagenagenagentttt PoPoPoPollllyyyymmmmeeeerrrr GGrounroundwdwaterater
EfEfEfEffffflllluenuenuenuentttt
CCCCllllarifarifarifarificicicicaaaattttiiiioooonnnnpH AdpH AdpH AdpH Adjusjusjusjusttttmmmmeeeent andnt andnt andnt and FloFloFloFloccccccccuuuulatlatlatlatiiiionononon RRRReeeeagagagagent Adent Adent Adent Addidididititititioooonnnn
ouounnddwaterwaterFiFiFiFillllttttrarararatetetete ThiThiThiThicccckekekekenenenenerrrr
OOOOvvvverflerflerflerfloooowwww
SlSlSlSluuuuddddggggeeeeSlSlSlSludgeudgeudgeudgeSoSoSoSolllliiiids tods tods tods to SlSlSlSluuuuddddggggeeee DeDeDeDewwwwaaaatttteeeerrrriiiinnnnggggDiDiDiDissssppppososososalalalal ThiThiThiThicccckekekekeninninninningggg
Source: Ref. 7.2
Technology Description and Principles Technologies were considered precipitation/coprecipitation if they involved the following steps:
• Mixing of treatment chemicals into water; • Formation of a solid matrix through precipitation, coprecipitation, or a combination of these
processes; and • Separation of the solid matrix from the water.
Precipitation/coprecipitation usually involves pH adjustment and addition of a chemical precipitant or coagulant to transform soluble metals and inorganic contaminants into insoluble metals and inorganic salts (Ref. 7.2). Mercury removal usually includes changing the pH of the water to be treated because removal is maximized at the pH where the precipitated species is least soluble. The optimal pH range for precipitation/coprecipitation depends on the waste treated and the specific treatment process. The precipitated/coprecipitated solid is typically removed by clarification or filtration.
7-1 August 2007
Section 7 – Precipitation/Coprecipitation
The most common precipitation method used to remove inorganic mercury from wastewater is sulfide precipitation (Ref. 7.1). In this process, the adjusted pH range is between 7 and 9, and a sulfide precipitant (such as sodium sulfide) is added to the wastewater stream. The sulfide precipitant converts dissolved mercury to the relatively insoluble mercury sulfide form. One coprecipitation process for mercury uses lignin derivatives to form a lignin-mercury colloid. Precipitated solids can then be removed by gravity settling in a clarifier. This process can be enhanced by the addition of a chemical coagulant or settling aid such as ferric chloride, and then flocculation and settling.
Technology Description: Precipitation uses chemicals to transform dissolved contaminants into an insoluble solid (Ref. 7.2). In coprecipitation, the target contaminant may be in a dissolved, colloidal, or suspended form. Dissolved contaminants do not precipitate, but are adsorbed onto another species that is precipitated. Colloidal or suspended contaminants become enmeshed with other precipitated species or are removed through processes such as coagulation and flocculation. Processes to remove mercury from water can include a combination of precipitation and coprecipitation. The precipitated/ coprecipitated solid is then removed from the liquid phase by clarification or filtration. Mercury precipitation/coprecipitation can use combinations of the chemicals and methods listed below. Media Treated:
• Groundwater • Wastewater
Chemicals and Methods Used for Mercury Precipitation/Coprecipitation:
• Ferric salts (for example, ferric chloride), ferric sulfate, or ferric hydroxide • Alum • pH adjustment • Lime softening, limestone, and calcium hydroxide • Sulfide • Lignin derivatives
Applicability, Advantages, and Limitations Precipitation/coprecipitation is an active ex situ treatment technology designed to function with routine chemical addition and sludge removal. It usually generates a sludge residual, which typically requires treatment such as dewatering and subsequent disposal. Some sludge from the precipitation/ coprecipitation of mercury can be a hazardous waste and require additional treatment such as solidification/stabilization for disposal as a solid waste or could require disposal as a hazardous waste. Excess use of the chemical sulfide precipitants can form soluble mercury sulfide species. Mercury can resolubilize from sulfide sludges under conditions that exist in landfills (Ref. 7.4), which could lead to mercury contamination of leachate and potential groundwater pollution. The effluent from mercury precipitation may also require further treatment, such as pH adjustment, before discharge or reuse. Sulfide precipitation of mercury may generate residual sulfide in the effluent. Treatment to remove residual sulfide may be needed before discharge (Ref. 7.1).
7-2 August 2007
Section 7 – Precipitation/Coprecipitation
Factors Affecting Precipitation/Coprecipitation Performance and Cost
• pH: In general, mercury removal will be maximized at the pH where the precipitated species is least soluble. The optimal pH range for precipitation/coprecipitation depends on the waste treated and the specific treatment process. The most effective precipitation of mercury for the sulfide precipitation process occurs within a pH range of 7 to 9 (Ref. 7.1). The most effective precipitation of mercury for the hydroxide precipitation process occurs within a pH range of 7 to 11 (Ref. 7.9).
• Presence of other compounds: The presence of other metals or contaminants may affect the effectiveness of precipitation/coprecipitation.
• Chemical dosage: The cost generally increases with increased chemical addition. Larger amounts of chemicals added usually results in a larger amount of sludge that requires additional treatment or disposal. Excess use of sulfide precipitant can form soluble mercury sulfide species (Ref. 7.1).
• Treatment goal: For some applications, a single precipitation step or using precipitation alone may not achieve the treatment goals. Multiple precipitation steps or the use of additional technologies may be needed to meet stringent cleanup goals, effluent guidelines, or disposal standards.
• Sludge disposal: Sludge produced from the precipitation/coprecipitation process could be considered a hazardous waste and require additional treatment before disposal as a solid waste or disposal as hazardous waste (Ref. 7.2).
Type, Number, and Scale of Identified Projects Treating Groundwater and Wastewater Containing Mercury Precipitation has been applied at full scale to treat groundwater and wastewater contaminated with mercury. Data sources used for this report include information about three full-scale applications for treatment of mercury contaminated groundwater and eight full-scale applications for treating wastewater. Summary of Performance and Cost Data Table 7.1 presents the available performance data for full-scale precipitation/coprecipitation treatment of mercury. Table 7.2 provides cost data for two pump-and-treat systems that treated mercury-contaminated groundwater with precipitation/coprecipitation. Three full-scale projects treated contaminated groundwater and eight full-scale projects treated wastewater. The three projects that treated groundwater reduced the mercury concentration to less than 2 µg/L. A total of 41,000 pounds of contaminants were removed from January 1997 to March 1999 at Marine Corps Base Camp Lejeune in North Carolina. The treatment system removed volatile organic compounds and metals, including mercury. The pump and treat (P&T) system included oxidation of ferrous iron to ferric iron, pH adjustment, precipitation, air stripping, and granular activated carbon adsorption. The cost of the P&T system was approximately $49 per pound of contaminant removed. The cost for the precipitation/coprecipitation process alone is not identified or discussed in the references used for this report. At the Squamish Mercury Remediation Project in British Columbia, Canada (see Table 7.1, Project 2), 25 million gallons of mercury-contaminated groundwater were treated using a coprecipitation process followed by addition of ferric chloride. The treatment reduced the mercury concentration from 15 µg/L to 1 µg/L. The unit cost for the coprecipitating chemical was $2.00 per gallon of water treated. Additional information on the cost is not identified or discussed in the references used for this report.
7-3 August 2007
Section 7 – Precipitation/Coprecipitation
Precipitation, carbon adsorption, and pH adjustment were used at the Olin Corporation McIntosh Plant Site in Washington County, Alabama, to treat mercury-contaminated groundwater. This treatment reduced the average influent concentration of mercury from 44 µg/L to 0.3 µg/L (Ref. 7.6). No cost data were identified or discussed for this project in the references used for this report. Of the eight projects that treated mercury-contaminated wastewater, five treated wastewater at chloralkali plants. The influent mercury concentration ranged from 362 µg/L to 0.07 µg/L, and the effluent concentration was reduced to less than 2 µg/L in all projects. However, some of the processes used multiple precipitation steps and additional treatment with other technologies such as activated carbon to reach this level. No cost data were identified or discussed for these projects in the references used for this report (Ref. 7.3), except for projects treating wastewater from the centralized waste treatment industry (Projects 10 and 11). Chapter 11 of the reference used for these projects (Ref. 7.10) provides detailed cost data and information on how the costs were derived.
Case Study: Olin Chemical Site Olin Corporation operated a mercury cell chlor-alkali plant from 1952 to 1982 at the Olin Corporation McIntosh Plant Site in Washington County, Alabama. In 1978, Olin began operating a diaphragm cell caustic soda/chlorine plant, which is still in operation. The plant on site produces chlorine, caustic soda, sodium hypochlorite, and sodium chloride. Releases of mercury and other organic chemicals have contaminated the soil and the shallow groundwater beneath the site. A P&T remedy is being used for groundwater at this site. The treatment system consists of precipitation, carbon adsorption, and pH adjustment before discharge to the Mobile River. The cleanup level in groundwater is 2 µg/L. The treatment system has reduced the concentration of mercury in the pumped groundwater from 44 µg/L to 0.3 µg/L. The P&T system began operating in 1986 and treats an average of 350 to 400 gallons per minute (gpm) (Ref. 7.6).
7-4 August 2007
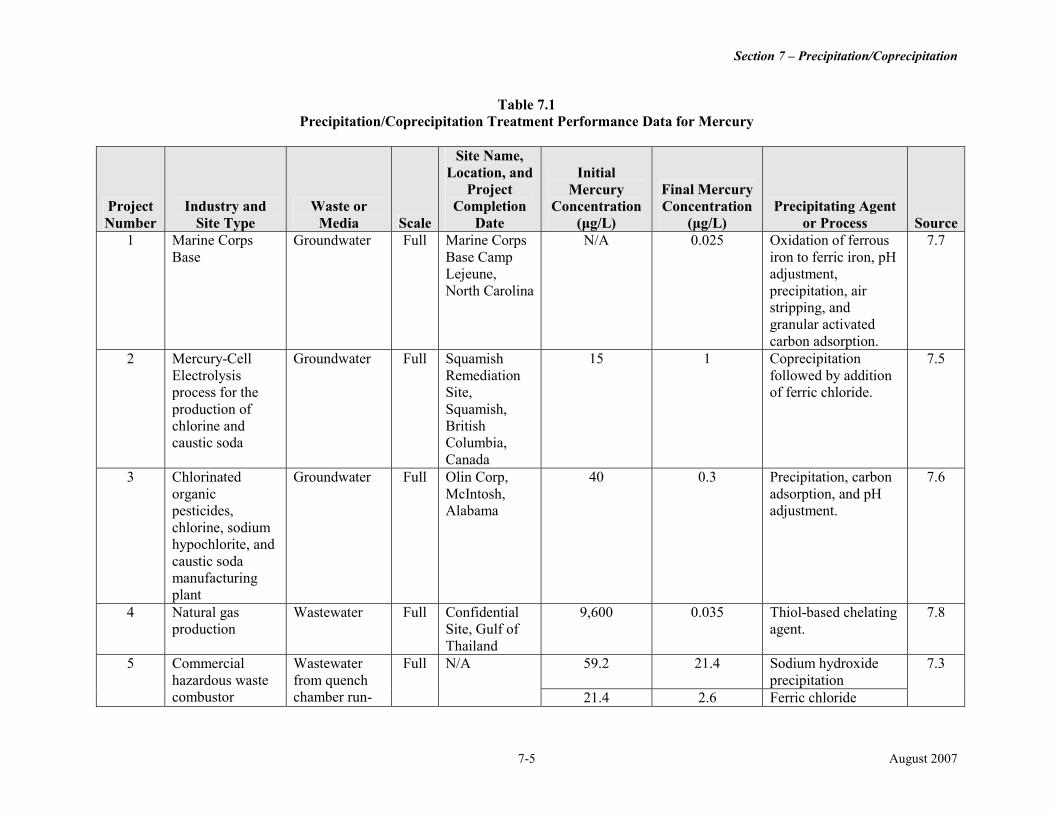
Section 7 – Precipitation/Coprecipitation
Table 7.1 Precipitation/Coprecipitation Treatment Performance Data for Mercury
Site Name, Location, and Initial
Project Number
Industry and Site Type
Waste or Media Scale
Project Completion
Date
Mercury Concentration
(µg/L)
Final Mercury Concentration
(µg/L) Precipitating Agent
or Process Source 1 Marine Corps Groundwater Full Marine Corps N/A 0.025 Oxidation of ferrous 7.7
Base Base Camp iron to ferric iron, pH Lejeune, adjustment, North Carolina precipitation, air
stripping, and granular activated carbon adsorption.
2 Mercury-Cell Electrolysis process for the production of chlorine and
Groundwater Full Squamish Remediation Site, Squamish, British
15 1 Coprecipitation followed by addition of ferric chloride.
7.5
caustic soda Columbia, Canada
3 Chlorinated organic pesticides, chlorine, sodium
Groundwater Full Olin Corp, McIntosh, Alabama
40 0.3 Precipitation, carbon adsorption, and pH adjustment.
7.6
hypochlorite, and caustic soda manufacturing plant
4 Natural gas Wastewater Full Confidential 9,600 0.035 Thiol-based chelating 7.8 production Site, Gulf of agent.
Thailand 5 Commercial
hazardous waste combustor
Wastewater from quench chamber run-
Full N/A 59.2 21.4 Sodium hydroxide precipitation
7.3
21.4 2.6 Ferric chloride
7-5 August 2007
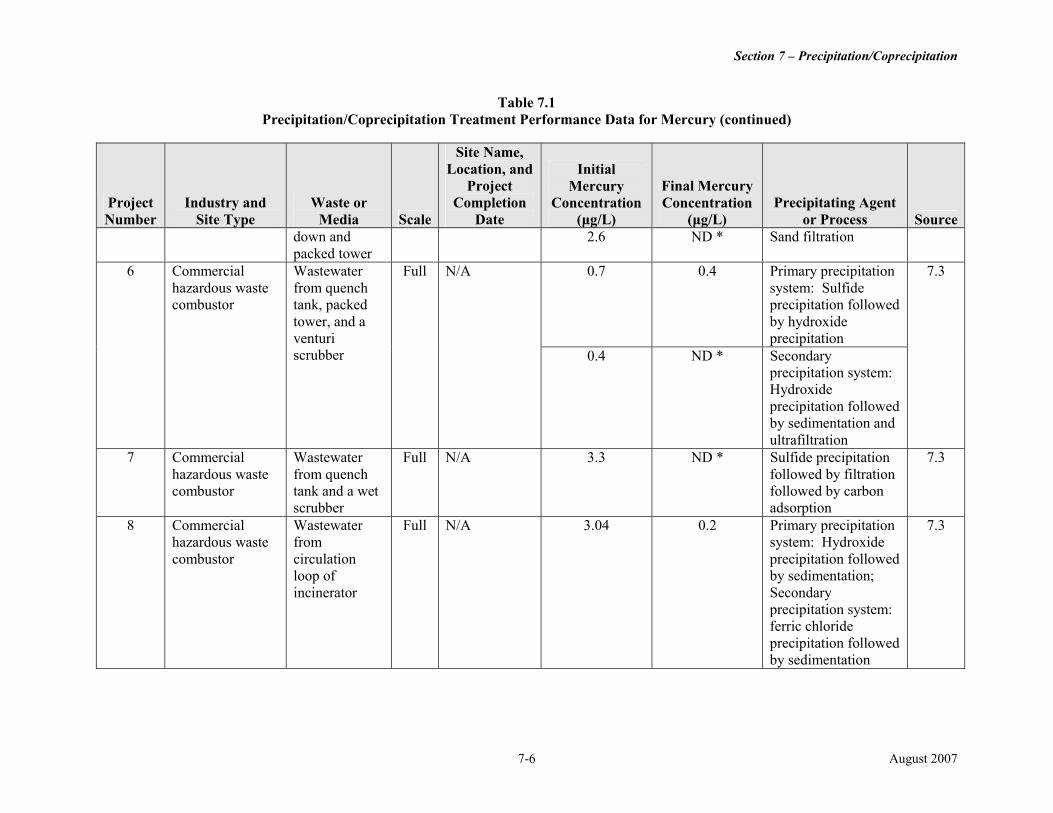
Section 7 – Precipitation/Coprecipitation
Table 7.1 Precipitation/Coprecipitation Treatment Performance Data for Mercury (continued)
Site Name, Location, and Initial
Project Number
Industry and Site Type
Waste or Media Scale
Project Completion
Date
Mercury Concentration
(µg/L)
Final Mercury Concentration
(µg/L) Precipitating Agent
or Process Source down and 2.6 ND * Sand filtration packed tower
6 Commercial Wastewater Full N/A 0.7 0.4 Primary precipitation 7.3 hazardous waste combustor
from quench tank, packed
system: Sulfide precipitation followed
tower, and a venturi
by hydroxide precipitation
scrubber 0.4 ND * Secondary precipitation system: Hydroxide precipitation followed by sedimentation and ultrafiltration
7 Commercial Wastewater Full N/A 3.3 ND * Sulfide precipitation 7.3 hazardous waste combustor
from quench tank and a wet scrubber
followed by filtration followed by carbon adsorption
8 Commercial hazardous waste combustor
Wastewater from circulation loop of incinerator
Full N/A 3.04 0.2 Primary precipitation system: Hydroxide precipitation followed by sedimentation; Secondary precipitation system: ferric chloride
7.3
precipitation followed by sedimentation
7-6 August 2007
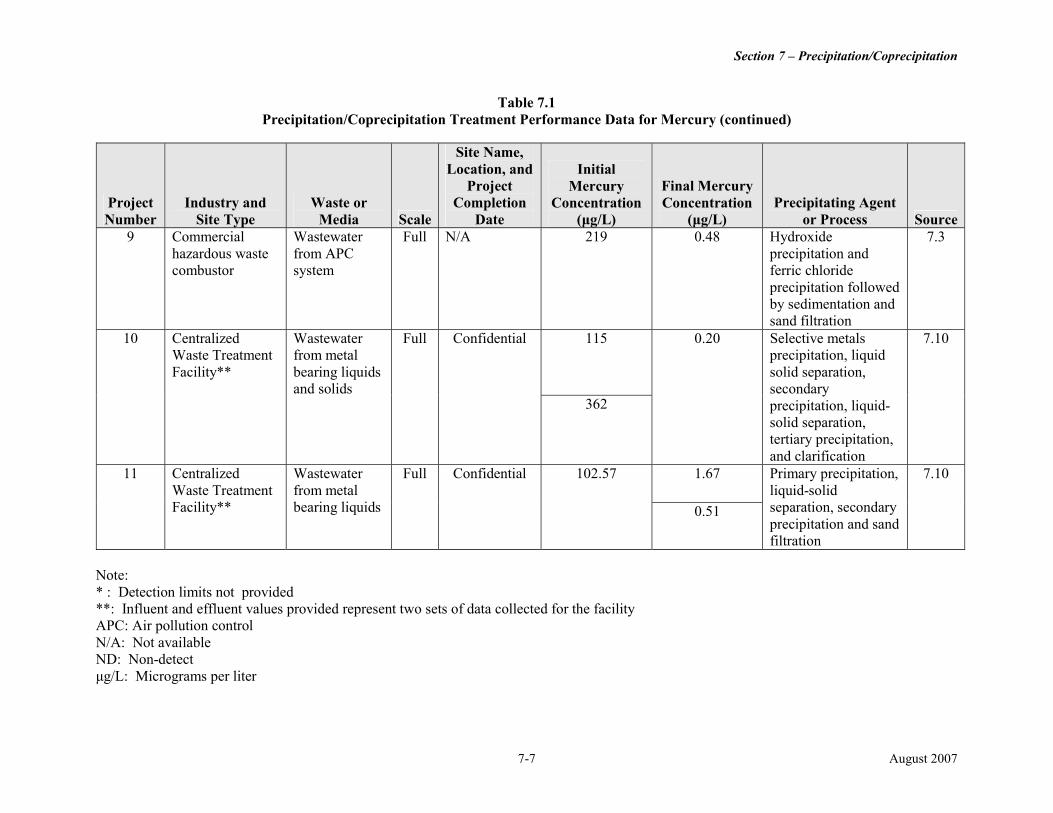
Section 7 – Precipitation/Coprecipitation
Table 7.1 Precipitation/Coprecipitation Treatment Performance Data for Mercury (continued)
Site Name, Location, and Initial
Project Number
Industry and Site Type
Waste or Media Scale
Project Completion
Date
Mercury Concentration
(µg/L)
Final Mercury Concentration
(µg/L) Precipitating Agent
or Process Source 9 Commercial Wastewater Full N/A 219 0.48 Hydroxide 7.3
hazardous waste from APC precipitation and combustor system ferric chloride
precipitation followed by sedimentation and sand filtration
10 Centralized Wastewater Full Confidential 115 0.20 Selective metals 7.10 Waste Treatment Facility**
from metal bearing liquids and solids
precipitation, liquid solid separation, secondary precipitation, liquid-solid separation, tertiary precipitation, and clarification
362
11 Centralized Wastewater Full Confidential 102.57 1.67 Primary precipitation, 7.10 Waste Treatment from metal liquid-solid Facility** bearing liquids separation, secondary 0.51
precipitation and sand filtration
Note: * : Detection limits not provided **: Influent and effluent values provided represent two sets of data collected for the facility APC: Air pollution control N/A: Not available ND: Non-detect µg/L: Micrograms per liter
7-7 August 2007
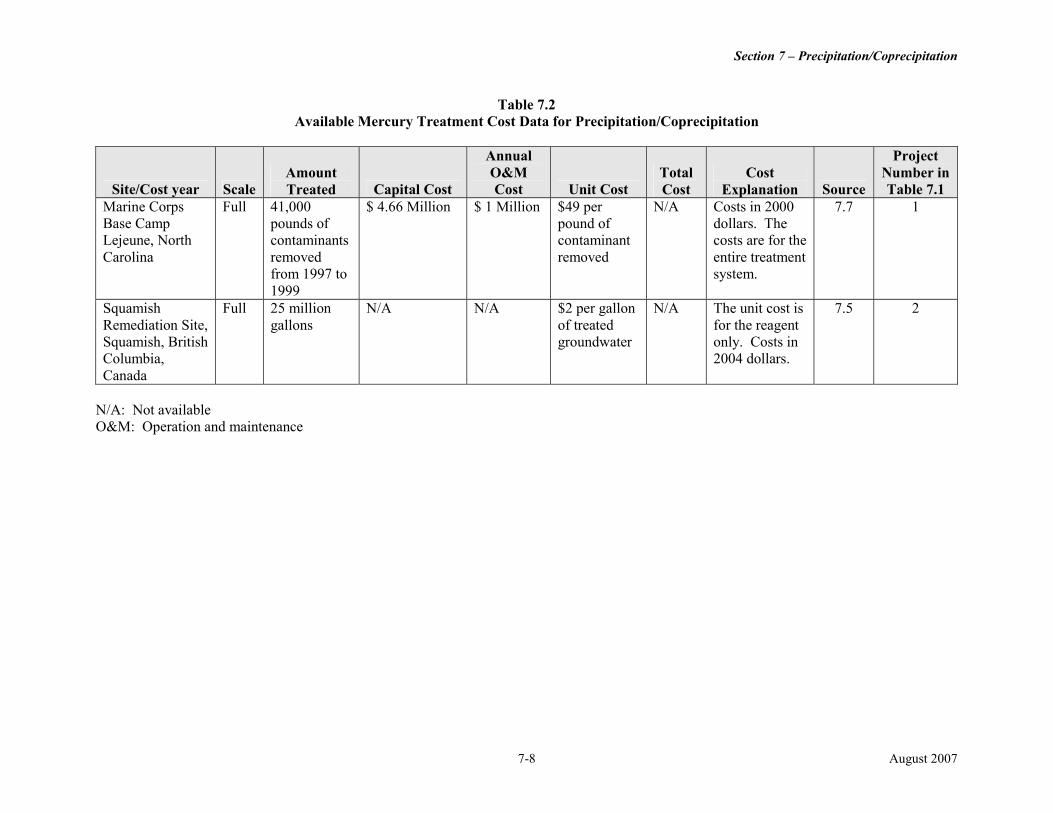
Section 7 – Precipitation/Coprecipitation
Table 7.2 Available Mercury Treatment Cost Data for Precipitation/Coprecipitation
Annual Project Amount O&M Total Cost Number in
Site/Cost year Scale Treated Capital Cost Cost Unit Cost Cost Explanation Source Table 7.1 Marine Corps Full 41,000 $ 4.66 Million $ 1 Million $49 per N/A Costs in 2000 7.7 1 Base Camp pounds of pound of dollars. The Lejeune, North contaminants contaminant costs are for the Carolina removed removed entire treatment
from 1997 to system. 1999
Squamish Full 25 million N/A N/A $2 per gallon N/A The unit cost is 7.5 2 Remediation Site, gallons of treated for the reagent Squamish, British groundwater only. Costs in Columbia, 2004 dollars. Canada
N/A: Not available O&M: Operation and maintenance
7-8 August 2007
Section 7 – Precipitation/Coprecipitation
References
7.1 U.S. Environmental Protection Agency (EPA). 1997. Office of Research and Development. Capsule Report, Aqueous Mercury Treatment. EPA-625-R-97-004. July. http://www.epa.gov/ORD/NRMRL/pubs/625r97004/625r97004.pdf.
7.2 U.S. EPA. 2002. Office of Solid Waste and Emergency Response. Arsenic Treatment Technologies for Soil, Water, and Water. EPA-542-R-02-004. September. http://clu-in.org/download/remed/542r02004/arsenic_report.pdf.
7.3 U.S. EPA Office of Water. 2000. Development Document for Final Effluent Limitation Guidelines and Standards for Commercial Hazardous Waste Combustors. EPA-821-R-99-020. January. http://epa.gov/waterscience/chwc/final/technical.html.
7.4 U.S. EPA. 1992. Biological and Physio-Chemical Remediation of Mercury-Contaminated Hazardous Waste. Conly L Hansen and Daid K. Stevens. EPA-600-R-92-105. PP 121-125.
7.5 NORAM Engineering and Construction Ltd. 2004. Report on Remedial Goals and Solutions at the Squamish Mercury Remediation Project. November. Vancouver, BC, Canada.
7.6 Faxed data from Mike Arnet regarding the Olin Corporation McIntosh Plant Site. 2004. U.S. Environmental Protection Agency, to Danielle Wohler, Tetra Tech EM Inc. December 16.
7.7 U.S. Navy and Marine Corps. 2000. Site Specific Report: Marine Corps Base Camp Lejeune, Operable Unit 1 and 2. SSR-2539-ENV. January.
7.8 E-mail from Carl Hensman, Frontier Geosciences Inc., to Younus Burhan, Tetra Tech EM Inc., regarding the use of thiol-based chelating agent at a confidential site in Thailand. December 30, 2004.
7.9 West General Inc. 2005. Mercury solubility – mercury hydroxide curve. January. http://www.westgeneral.com/outofthebox/compounds/hgsol.html.
7.10 U.S. EPA. 2000. Office of Water. Development Document for Effluent Limitations Guidelines and Standards for the Centralized Waste Treatment Industry – Final.EPA-821-R-00-020. August. http://www.epa.gov/waterscience/guide/cwt/final/develop/index.html.
7-9 August 2007

This page is intentionally left blank.
7-10
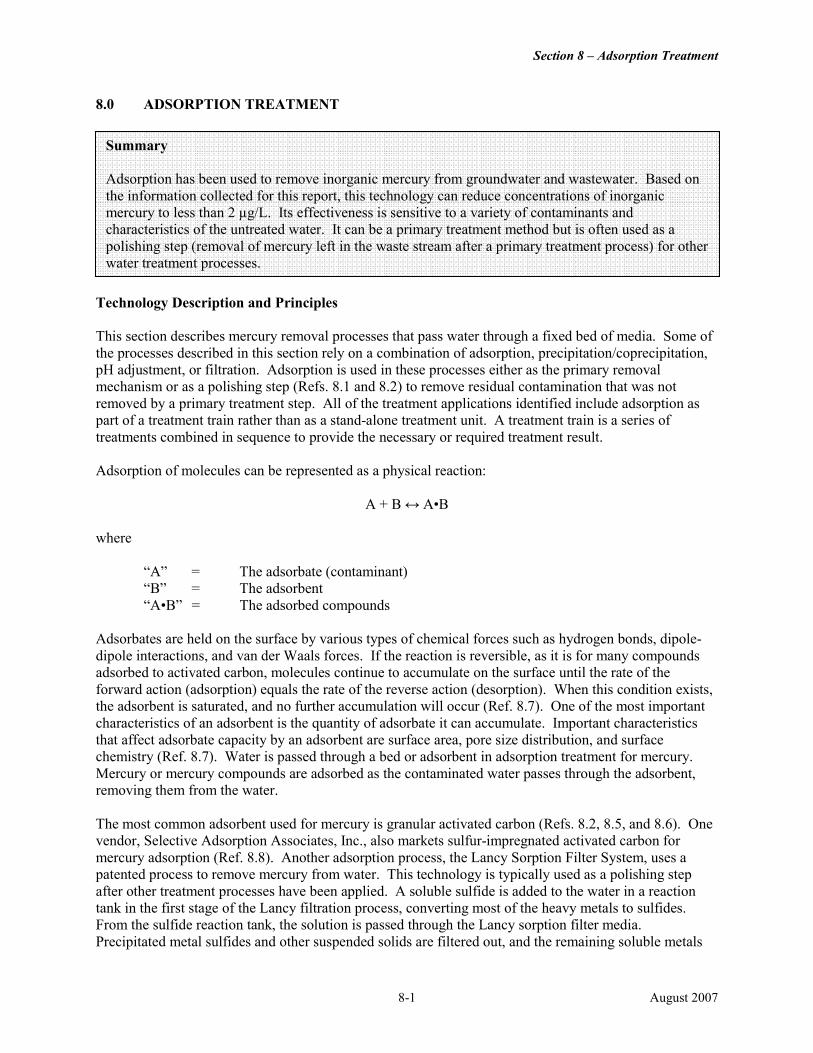
Section 8 – Adsorption Treatment
8.0 ADSORPTION TREATMENT
Summary Adsorption has been used to remove inorganic mercury from groundwater and wastewater. Based on the information collected for this report, this technology can reduce concentrations of inorganic mercury to less than 2 µg/L. Its effectiveness is sensitive to a variety of contaminants and characteristics of the untreated water. It can be a primary treatment method but is often used as a polishing step (removal of mercury left in the waste stream after a primary treatment process) for other water treatment processes.
Technology Description and Principles This section describes mercury removal processes that pass water through a fixed bed of media. Some of the processes described in this section rely on a combination of adsorption, precipitation/coprecipitation, pH adjustment, or filtration. Adsorption is used in these processes either as the primary removal mechanism or as a polishing step (Refs. 8.1 and 8.2) to remove residual contamination that was not removed by a primary treatment step. All of the treatment applications identified include adsorption as part of a treatment train rather than as a stand-alone treatment unit. A treatment train is a series of treatments combined in sequence to provide the necessary or required treatment result. Adsorption of molecules can be represented as a physical reaction:
A + B ↔ A•B where
“A” = The adsorbate (contaminant) “B” = The adsorbent “A•B” = The adsorbed compounds
Adsorbates are held on the surface by various types of chemical forces such as hydrogen bonds, dipole-dipole interactions, and van der Waals forces. If the reaction is reversible, as it is for many compounds adsorbed to activated carbon, molecules continue to accumulate on the surface until the rate of the forward action (adsorption) equals the rate of the reverse action (desorption). When this condition exists, the adsorbent is saturated, and no further accumulation will occur (Ref. 8.7). One of the most important characteristics of an adsorbent is the quantity of adsorbate it can accumulate. Important characteristics that affect adsorbate capacity by an adsorbent are surface area, pore size distribution, and surface chemistry (Ref. 8.7). Water is passed through a bed or adsorbent in adsorption treatment for mercury. Mercury or mercury compounds are adsorbed as the contaminated water passes through the adsorbent, removing them from the water. The most common adsorbent used for mercury is granular activated carbon (Refs. 8.2, 8.5, and 8.6). One vendor, Selective Adsorption Associates, Inc., also markets sulfur-impregnated activated carbon for mercury adsorption (Ref. 8.8). Another adsorption process, the Lancy Sorption Filter System, uses a patented process to remove mercury from water. This technology is typically used as a polishing step after other treatment processes have been applied. A soluble sulfide is added to the water in a reaction tank in the first stage of the Lancy filtration process, converting most of the heavy metals to sulfides. From the sulfide reaction tank, the solution is passed through the Lancy sorption filter media. Precipitated metal sulfides and other suspended solids are filtered out, and the remaining soluble metals
8-1 August 2007
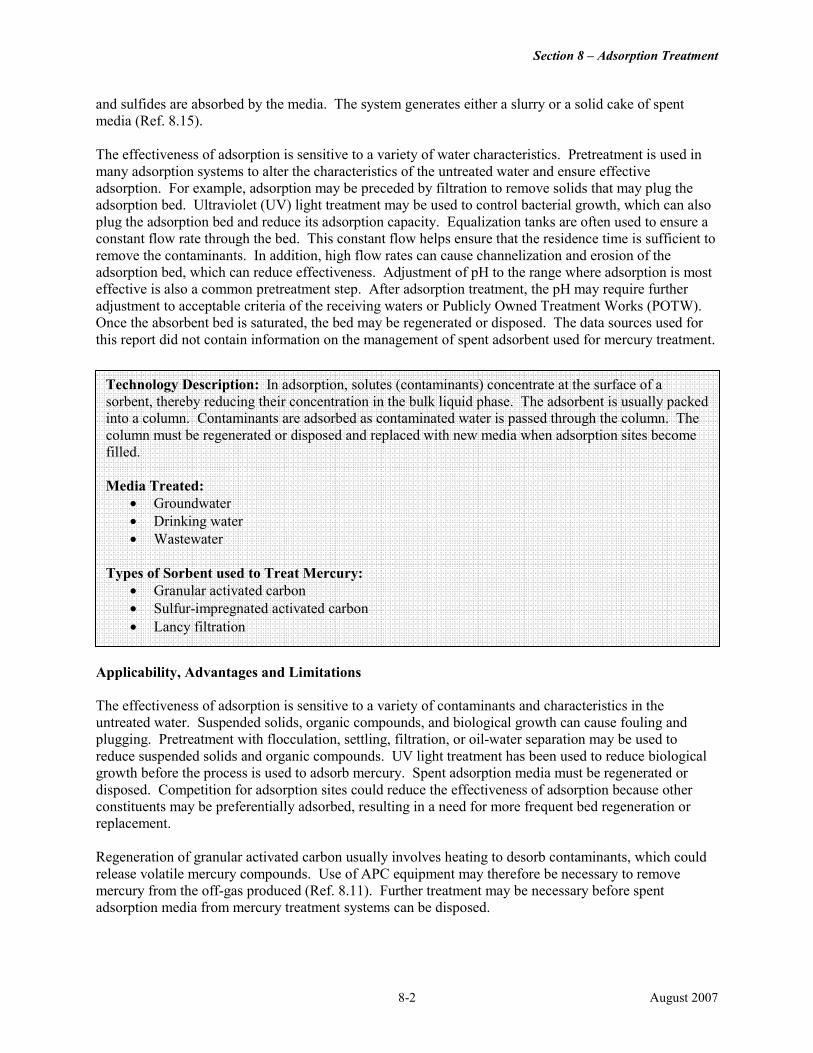
Section 8 – Adsorption Treatment
and sulfides are absorbed by the media. The system generates either a slurry or a solid cake of spent media (Ref. 8.15). The effectiveness of adsorption is sensitive to a variety of water characteristics. Pretreatment is used in many adsorption systems to alter the characteristics of the untreated water and ensure effective adsorption. For example, adsorption may be preceded by filtration to remove solids that may plug the adsorption bed. Ultraviolet (UV) light treatment may be used to control bacterial growth, which can also plug the adsorption bed and reduce its adsorption capacity. Equalization tanks are often used to ensure a constant flow rate through the bed. This constant flow helps ensure that the residence time is sufficient to remove the contaminants. In addition, high flow rates can cause channelization and erosion of the adsorption bed, which can reduce effectiveness. Adjustment of pH to the range where adsorption is most effective is also a common pretreatment step. After adsorption treatment, the pH may require further adjustment to acceptable criteria of the receiving waters or Publicly Owned Treatment Works (POTW). Once the absorbent bed is saturated, the bed may be regenerated or disposed. The data sources used for this report did not contain information on the management of spent adsorbent used for mercury treatment.
Technology Description: In adsorption, solutes (contaminants) concentrate at the surface of a sorbent, thereby reducing their concentration in the bulk liquid phase. The adsorbent is usually packed into a column. Contaminants are adsorbed as contaminated water is passed through the column. The column must be regenerated or disposed and replaced with new media when adsorption sites become filled. Media Treated:
• Groundwater • Drinking water • Wastewater
Types of Sorbent used to Treat Mercury:
• Granular activated carbon • Sulfur-impregnated activated carbon • Lancy filtration
Applicability, Advantages and Limitations The effectiveness of adsorption is sensitive to a variety of contaminants and characteristics in the untreated water. Suspended solids, organic compounds, and biological growth can cause fouling and plugging. Pretreatment with flocculation, settling, filtration, or oil-water separation may be used to reduce suspended solids and organic compounds. UV light treatment has been used to reduce biological growth before the process is used to adsorb mercury. Spent adsorption media must be regenerated or disposed. Competition for adsorption sites could reduce the effectiveness of adsorption because other constituents may be preferentially adsorbed, resulting in a need for more frequent bed regeneration or replacement. Regeneration of granular activated carbon usually involves heating to desorb contaminants, which could release volatile mercury compounds. Use of APC equipment may therefore be necessary to remove mercury from the off-gas produced (Ref. 8.11). Further treatment may be necessary before spent adsorption media from mercury treatment systems can be disposed.
8-2 August 2007
Section 8 – Adsorption Treatment
Factors Affecting Adsorption Performance and Cost Contaminant concentration: Competition for adsorption sites can reduce the effectiveness of adsorption if competing contaminants are adsorbed instead of or in addition to mercury, resulting in a need for more frequent bed regeneration or replacement (Ref. 8.12). In addition, the capacity of the adsorption media decreases with increasing contaminant concentration (Refs. 8.13, 8.14). High contaminant concentrations can exhaust the adsorption media quickly, requiring frequent regeneration or replacement. Fouling: The presence of suspended solids, organic compounds, and solids can cause fouling of adsorption media (Ref. 8.7). Flow Rate: Increasing the flow rate through the adsorption media can decrease adsorption of contaminants and erode the adsorbent bed (Refs. 8.6 and 8.10). Wastewater pH: The optimal pH to maximize adsorption of mercury by granular activated carbon is acidic (pH 4-5). Therefore, pH adjustment may be needed both before and after adsorption treatment (Refs. 8.3, 8.4, 8.7 and 8.11). Spent Media – Spent media that can no longer be regenerated would require treatment or disposal (Ref. 8.9).
Type, Number, and Scale of Identified Projects Treating Water Containing Mercury Adsorption technologies to treat mercury-contaminated water are commercially available. Data sources used for this report included information about four full- and two pilot-scale applications of adsorption to treat mercury. Two of the projects (Projects 1 and 2) were implemented at Superfund sites. Summary of Performance and Cost Data Table 1 summarizes the performance information for the four full- and two pilot-scale applications. The effectiveness of adsorption treatment can be evaluated by comparing influent and effluent contaminant concentrations. Performance data were available for three of the four full-scale processes. Influent concentrations ranged from 3.3 to 60 µg/L in these treatments (Projects 2, 3, and 4). The effluent mercury concentration was below 2 µg/L for all three of these projects. Of the two pilot-scale applications, one (Project 5) reported a mercury influent concentration of 2,500 µg/L and a removal rate of 98 percent. Data on the effluent concentrations were not available for this project. Project 6 reported a mercury influent concentration of 60 µg/L and an effluent concentration below the detection limit. The detection limit was not provided, however. Table 2 provides the available cost data for mercury adsorption treatment. In one pilot study, the cost of removing thimerosal, a mercury salicylate salt that is used as a bacteriostat/fungistat in many test kits, using granulated activated carbon was $0.107 per gallon of water treated (Ref. 8.5). The capital cost was $0.012 per gallon treated and the O&M cost was $0.095 per gallon treated. Another full-scale treatment system developed for treating thimerosal (Ref. 8.7) reports capital costs of $60,000 and monthly operating costs of $7,665 for a plant designed to treat 1,800 gallons of thimerosal-contaminated wastewater per day.
8-3 August 2007
Section 8 – Adsorption Treatment
Reported costs for systems to treat groundwater include $49 per pound of contaminant removed (Ref. 8.2) and $520 per pound of contaminant ($19 per 1,000 gallons of groundwater extracted) removed (Ref. 8.1). However, the costs include removal of other contaminants in addition to mercury. The information sources used for this report did not contain cost data on the granular activated carbon or Lancy filter treatment step alone.
Case Study: Reducing Mercury Discharge at a Testing Laboratory A testing laboratory in Massachusetts generates wastewater containing thimerosal concentrations averaging 60 µg/L before treatment. In 1992, the laboratory conducted pilot testing of carbon adsorption and constructed a full-scale system. The full-scale system includes a 15-micron bag filter, UV light, an equalization tank with pH adjustment to the 4 to 5 range, granular activated carbon filters, a mixing tank with pH adjustment to 5.5 to 9.5, and a neutralization tank. The micron bag filter was necessary to remove solids that tended to plug the filters. UV light was introduced to control bacterial growth in the carbon adsorption system. Flow equalization was provided to establish constant detention time and avoid channelization of the beds caused by increasing flows experienced when equalization was not included. The pH was adjusted to the range where the adsorptive capacity of the carbon filter is greatest (4 to 5). After the carbon filter, the pH is readjusted to the 5.5 to 10.5 range before the wastewater flows into the neutralization tank. Treated water is finally neutralized to the range accepted by the receiving POTW. This acceptable range was not reported, however. This system reduced the concentration of thimerosal in the wastewater from 60 µg/L to below the goal of 1 µg/L. Costs for the full-scale treatment system (1,800 gallons per day) include capital costs of $60,000 and monthly operating costs of $7,665.
8-4 August 2007
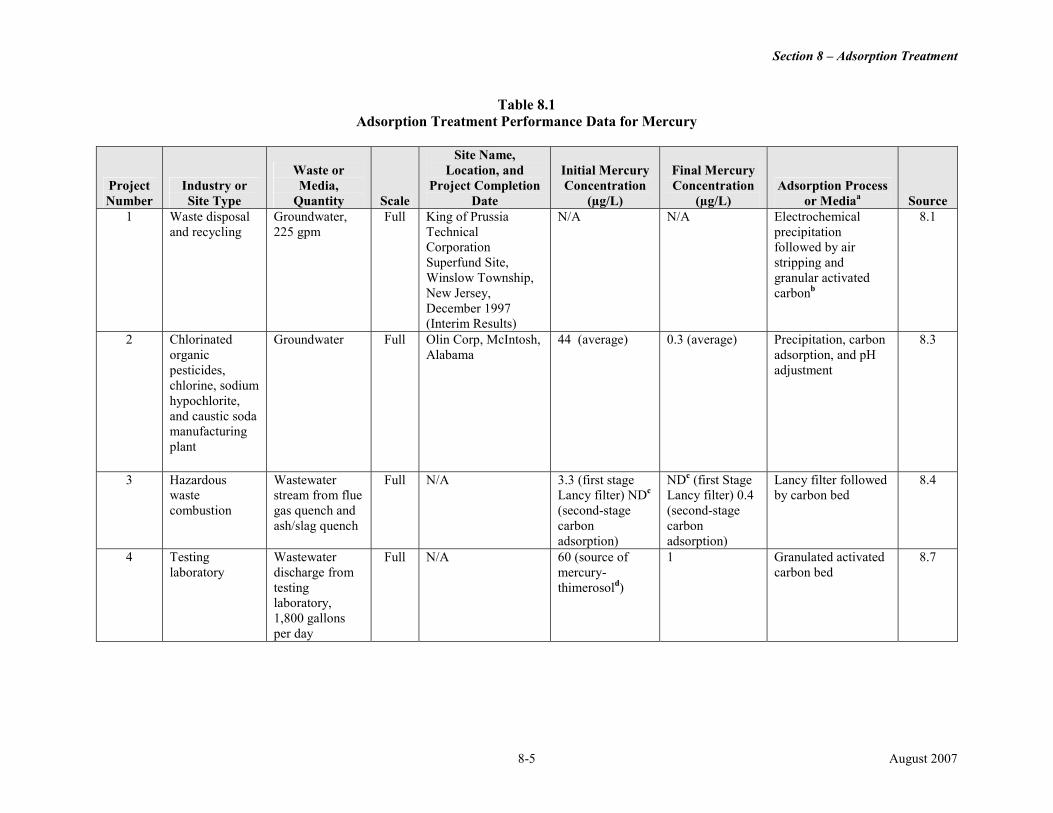
Section 8 – Adsorption Treatment
Table 8.1 Adsorption Treatment Performance Data for Mercury
Site Name, Waste or Location, and Initial Mercury Final Mercury
Project Industry or Media, Project Completion Concentration Concentration Adsorption Process Number Site Type Quantity Scale Date (µg/L) (µg/L) or Mediaa Source
1 Waste disposal and recycling
Groundwater, 225 gpm
Full King of Prussia Technical Corporation Superfund Site, Winslow Township, New Jersey, December 1997 (Interim Results)
N/A N/A Electrochemical precipitation followed by air stripping and granular activated carbonb
8.1
2 Chlorinated organic pesticides, chlorine, sodium
Groundwater Full Olin Corp, McIntosh, Alabama
44 (average) 0.3 (average) Precipitation, carbon adsorption, and pH adjustment
8.3
hypochlorite, and caustic soda manufacturing plant
3 Hazardous waste
Wastewater stream from flue
Full N/A 3.3 (first stage Lancy filter) NDc
NDc (first Stage Lancy filter) 0.4
Lancy filter followed by carbon bed
8.4
combustion gas quench and (second-stage (second-stage ash/slag quench carbon carbon
adsorption) adsorption) 4 Testing
laboratory Wastewater discharge from testing laboratory, 1,800 gallons per day
Full N/A 60 (source of mercurythimerosold)
1 Granulated activated carbon bed
8.7
8-5 August 2007
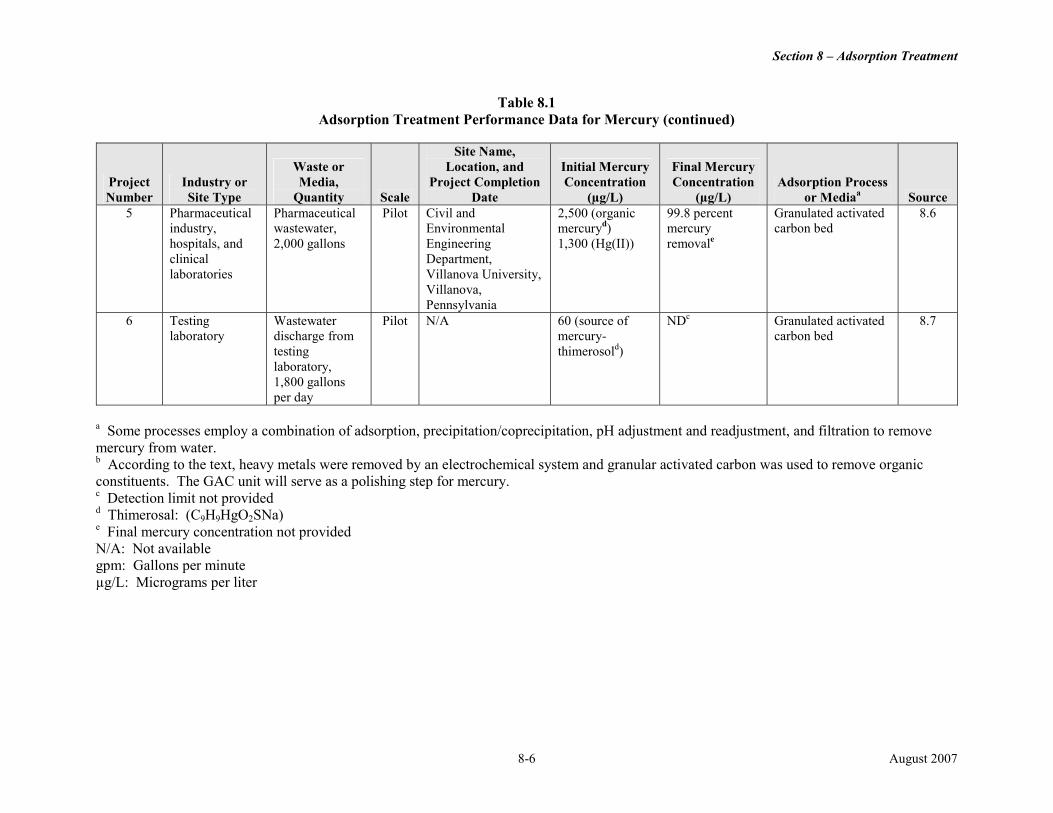
Section 8 – Adsorption Treatment
Table 8.1 Adsorption Treatment Performance Data for Mercury (continued)
Site Name, Waste or Location, and Initial Mercury Final Mercury
Project Industry or Media, Project Completion Concentration Concentration Adsorption Process Number Site Type Quantity Scale Date (µg/L) (µg/L) or Mediaa Source
5 Pharmaceutical industry, hospitals, and clinical laboratories
Pharmaceutical wastewater, 2,000 gallons
Pilot Civil and Environmental Engineering Department, Villanova University, Villanova, Pennsylvania
2,500 (organic mercury d) 1,300 (Hg(II))
99.8 percent mercury removale
Granulated activated carbon bed
8.6
6 Testing laboratory
Wastewater discharge from testing laboratory, 1,800 gallons per day
Pilot N/A 60 (source of mercurythimerosold)
NDc Granulated activated carbon bed
8.7
a Some processes employ a combination of adsorption, precipitation/coprecipitation, pH adjustment and readjustment, and filtration to remove mercury from water. b According to the text, heavy metals were removed by an electrochemical system and granular activated carbon was used to remove organic constituents. The GAC unit will serve as a polishing step for mercury. c Detection limit not provided d Thimerosal: (C9H9HgO2SNa) e Final mercury concentration not provided N/A: Not available gpm: Gallons per minute µg/L: Micrograms per liter
8-6 August 2007
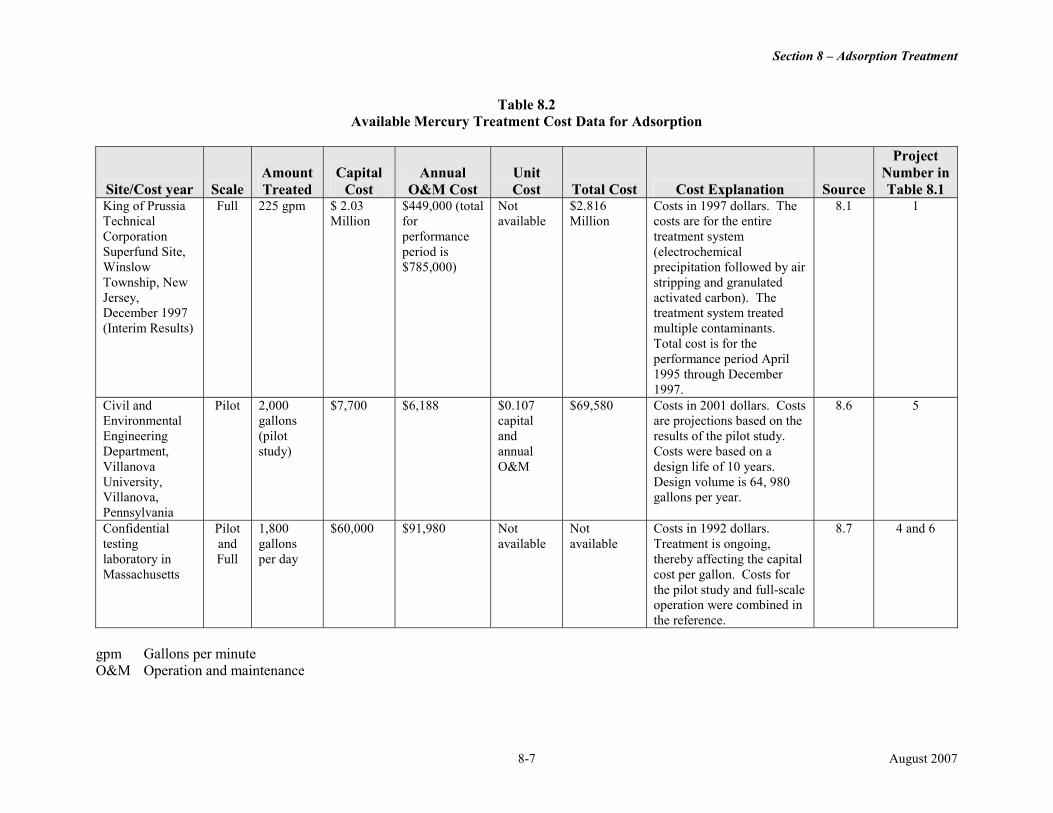
Section 8 – Adsorption Treatment
Table 8.2 Available Mercury Treatment Cost Data for Adsorption
Project Amount Capital Annual Unit Number in
Site/Cost year Scale Treated Cost O&M Cost Cost Total Cost Cost Explanation Source Table 8.1 King of Prussia Technical
Full 225 gpm $ 2.03 Million
$449,000 (total for
Not available
$2.816 Million
Costs in 1997 dollars. The costs are for the entire
8.1 1
Corporation Superfund Site, Winslow Township, New Jersey, December 1997 (Interim Results)
performance period is $785,000)
treatment system (electrochemical precipitation followed by air stripping and granulated activated carbon). The treatment system treated multiple contaminants. Total cost is for the performance period April 1995 through December 1997.
Civil and Pilot 2,000 $7,700 $6,188 $0.107 $69,580 Costs in 2001 dollars. Costs 8.6 5 Environmental gallons capital are projections based on the Engineering (pilot and results of the pilot study. Department, study) annual Costs were based on a Villanova O&M design life of 10 years. University, Design volume is 64, 980 Villanova, gallons per year. Pennsylvania Confidential Pilot 1,800 $60,000 $91,980 Not Not Costs in 1992 dollars. 8.7 4 and 6 testing and gallons available available Treatment is ongoing, laboratory in Full per day thereby affecting the capital Massachusetts cost per gallon. Costs for
the pilot study and full-scale operation were combined in the reference.
gpm Gallons per minute O&M Operation and maintenance
8-7 August 2007
Section 8 – Adsorption Treatment
References
8.1 U.S. Environmental Protection Agency (EPA). 1998. Pump and Treat of Contaminated Groundwater at the King of Prussia Technical Corporation Superfund Site, Winslow Township, New Jersey. Federal Remediation Technologies Roundtable. http://costperformance.org/profile.cfm?ID=126&CaseID=126.
8.2 Arnet, Mike. 2004. Faxed data regarding pump and treat at Olin Corporation. From Mike Arnet, U.S. Environmental Protection Agency, to Danielle Wohler, Tetra Tech EM Inc. December.
8.3 U.S. EPA. 2000. Effluent Guidelines, Commercial Hazardous Waste Combustor Subcategory of the Waste Combustors Point Source Category, Final Technical Development Document. January. http://www.epa.gov/waterscience/chwc/final/technical.html.
8.4 Business Communications Company, Inc. DMM95 The Microporous Materials Industry Review. http://www.buscom.com/membrane/DMM95.html. Accessed January 18, 2005.
8.5 Cyr, Patric J., P.S. Suri Rominder, and Edward D. Helmig. 2002. A Pilot-Scale Evaluation of Removal of Mercury from Pharmaceutical Wastewater Using Granular Activated Carbon. Water Research.
8.6 Commonwealth of Massachusetts. 1995. Toxic Use Reduction Case Study: Reducing Mercury Discharge at a Testing Laboratory. Executive Office of Environmental Affairs, Office of Technical Assistance. December.
8.7 American Water Works Association. 1990. Water Quality and Treatment, A Handbook of Community Water Supplies. Frederick W. Pontius, Technical Editor. McGraw-Hill Inc.
8.8 Selective Adsorption Associates, Inc. Product sheet for PERSORB® LW mercury adsorbent. http://www.selectiveadsorption.com/mersorlw.htm. Accessed January 2006.
8.9 Corbitt, Robert A. 1998. Standard Handbook of Environmental Engineering, Second Edition. McGraw-Hill Books.
8.10 Metcalf & Eddy. 1991. Wastewater Engineering: Treatment, Disposal, and Reuse. Third Edition. McGraw-Hill Publishing Company.
8.11 U.S. EPA. 1990. Final Best Demonstrated Available Technology (BDAT) Background Document for K031, K084, K101, K102, Characteristic Arsenic Wastes (D004), Characteristic Selenium Wastes (D010), and P and U Wastes Containing Arsenic and Selenium Listing Constituents. Office of Solid Waste. May.
8.12 Federal Remediation Technologies Roundtable. 2001. Reference Guide and Screening Manual. Version 3.0. March 30. http://www.frtr.gov/matrix2/top_page.html.
8.13 U.S. EPA. 2000. Regulations on the Disposal of Arsenic Residuals from Drinking Water Treatment Plants. Office of Research and Development. EPA/600/R-00/0025. May. http://www.epa.gov/ORD/WebPubs/residuals/index.htm.
8-8 August 2007
Section 8 – Adsorption Treatment
8.14 Twidwell, L.G., and others. 1999. Technologies and Potential technologies for Removing Arsenic from Process and Mine Wastewater. Presented at “REWAS’99.” San Sebastian, Spain. September.
8.15 U.S. EPA. 2000. Effluent Guidelines, Centralized Waste Treatment Development Document: Final Rule. December.
8-9 August 2007

This page is intentionally left blank.
8-10
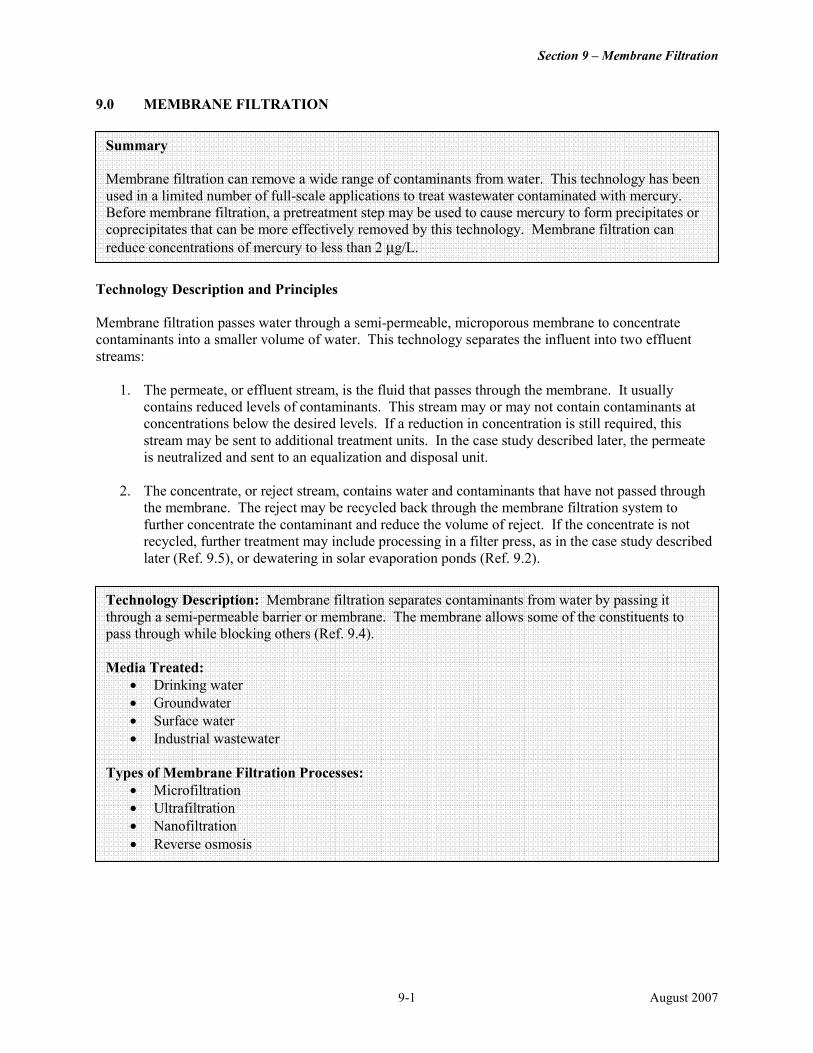
Section 9 – Membrane Filtration
9.0 MEMBRANE FILTRATION
Summary Membrane filtration can remove a wide range of contaminants from water. This technology has been used in a limited number of full-scale applications to treat wastewater contaminated with mercury. Before membrane filtration, a pretreatment step may be used to cause mercury to form precipitates or coprecipitates that can be more effectively removed by this technology. Membrane filtration can reduce concentrations of mercury to less than 2 µg/L.
Technology Description and Principles Membrane filtration passes water through a semi-permeable, microporous membrane to concentrate contaminants into a smaller volume of water. This technology separates the influent into two effluent streams:
1. The permeate, or effluent stream, is the fluid that passes through the membrane. It usually contains reduced levels of contaminants. This stream may or may not contain contaminants at concentrations below the desired levels. If a reduction in concentration is still required, this stream may be sent to additional treatment units. In the case study described later, the permeate is neutralized and sent to an equalization and disposal unit.
2. The concentrate, or reject stream, contains water and contaminants that have not passed through
the membrane. The reject may be recycled back through the membrane filtration system to further concentrate the contaminant and reduce the volume of reject. If the concentrate is not recycled, further treatment may include processing in a filter press, as in the case study described later (Ref. 9.5), or dewatering in solar evaporation ponds (Ref. 9.2).
Technology Description: Membrane filtration separates contaminants from water by passing it through a semi-permeable barrier or membrane. The membrane allows some of the constituents to pass through while blocking others (Ref. 9.4). Media Treated:
• Drinking water • Groundwater • Surface water • Industrial wastewater
Types of Membrane Filtration Processes:
• Microfiltration • Ultrafiltration • Nanofiltration • Reverse osmosis
9-1 August 2007
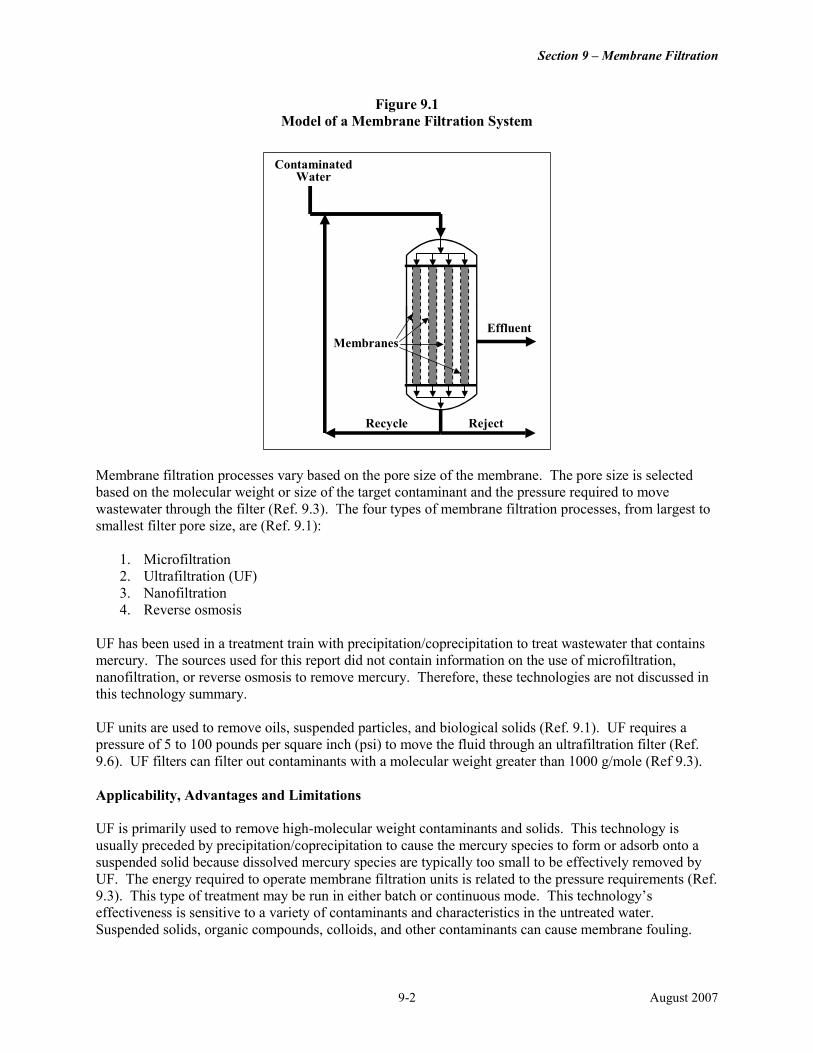
Contaminated Water
Membranes
RejectRecycle
Effluent
Section 9 – Membrane Filtration
Figure 9.1 Model of a Membrane Filtration System
Contaminated Water
Membranes
RejectRecycle
Effluent
Membrane filtration processes vary based on the pore size of the membrane. The pore size is selected based on the molecular weight or size of the target contaminant and the pressure required to move wastewater through the filter (Ref. 9.3). The four types of membrane filtration processes, from largest to smallest filter pore size, are (Ref. 9.1):
1. Microfiltration 2. Ultrafiltration (UF) 3. Nanofiltration 4. Reverse osmosis
UF has been used in a treatment train with precipitation/coprecipitation to treat wastewater that contains mercury. The sources used for this report did not contain information on the use of microfiltration, nanofiltration, or reverse osmosis to remove mercury. Therefore, these technologies are not discussed in this technology summary.
UF units are used to remove oils, suspended particles, and biological solids (Ref. 9.1). UF requires a pressure of 5 to 100 pounds per square inch (psi) to move the fluid through an ultrafiltration filter (Ref. 9.6). UF filters can filter out contaminants with a molecular weight greater than 1000 g/mole (Ref 9.3).
Applicability, Advantages and Limitations
UF is primarily used to remove high-molecular weight contaminants and solids. This technology is usually preceded by precipitation/coprecipitation to cause the mercury species to form or adsorb onto a suspended solid because dissolved mercury species are typically too small to be effectively removed by UF. The energy required to operate membrane filtration units is related to the pressure requirements (Ref. 9.3). This type of treatment may be run in either batch or continuous mode. This technology’s effectiveness is sensitive to a variety of contaminants and characteristics in the untreated water. Suspended solids, organic compounds, colloids, and other contaminants can cause membrane fouling.
9-2 August 2007
Section 9 – Membrane Filtration
Type, Number and Scale of Identified Projects Treating Water Containing Mercury The references used for this report included information about one full-scale application of UF to treat mercury-contaminated wastewater.
Case Study: Episode #4671, Hazardous Waste Combustor Ultrafiltration was included as part of a treatment train used to treat a variety of contaminants in wastewater generated by the APC equipment of a hazardous waste combustor. The wastewater treatment system included a primary and secondary treatment loop. The secondary treatment loop contained a stage for precipitation with sodium hydroxide followed by sedimentation and ultrafiltration. Analysis of samples collected at the influent and effluent of this treatment loop showed that the mercury concentration was reduced from 0.4 µg/L to below the detection limit of 0.2 µg/L (Ref. 9.5).
Summary of Performance Data UF was used as part of a treatment train consisting of a primary and secondary loop in one application of membrane filtration to mercury-contaminated water. The secondary loop achieved a 54.5 percent reduction in the concentration of mercury. More detailed information about this site is presented in the box labeled “Case Study: Episode #4671”. Cost data were not provided for this application.
9-3 August 2007
Section 9 – Membrane Filtration
References
9.1 America Water Works Association. 2005. Factsheet: Membrane Filtration. American Water Works Association. http://www.awwa.org/Advocacy/pressroom/MembraneFiltration.cfm.
9.2 American Water Works Association. 1990. Water Quality and Treatment, a Handbook of Community Water Supplies, 4th Ed. McGraw-Hill, Inc.
9.3 General Electric Office of Water & Process Technologies. 1997-2003. Treating Industrial Water with Membrane Technology. http://www.gewater.com/library/tp/707_Treating_Industrial.jsp.
9.4 U.S. EPA Office of Solid Waste. 1996. BDAT Background Document for Spent Potliners from Primary Aluminum Reduction – K088. IPA 530-R-96-015. February. http://www.epa.gov/ncepi/Catalog/EPA530R96015.html.
9.5 U.S. EPA Office of Water. 2000. Development Document for Final Effluent Limitations Guidelines and Standards for Commercial Hazardous Waste Combustors. EPA 821-R-99-020. January. http://epa.gov/waterscience/chwc/final/chwcfd_a.pdf.
9.6 U.S. EPA Office of Water. 2000. Technologies and Cost for Removal of Arsenic from Drinking Water. EPA 815-R-00-0028. December. http://www.epa.gov/safewater/ars/treatments_and_costs.pdf.
9-4 August 2007
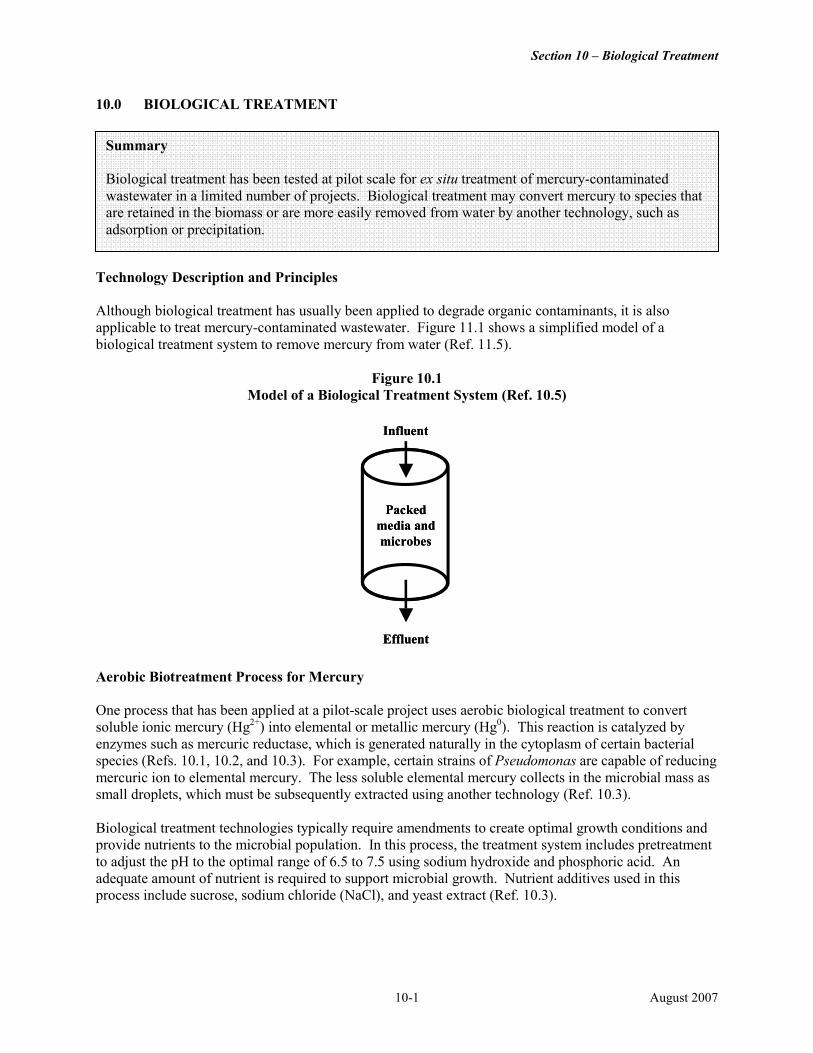
Section 10 – Biological Treatment
10.0 BIOLOGICAL TREATMENT
Summary Biological treatment has been tested at pilot scale for ex situ treatment of mercury-contaminated wastewater in a limited number of projects. Biological treatment may convert mercury to species that are retained in the biomass or are more easily removed from water by another technology, such as adsorption or precipitation.
Technology Description and Principles Although biological treatment has usually been applied to degrade organic contaminants, it is also applicable to treat mercury-contaminated wastewater. Figure 11.1 shows a simplified model of a biological treatment system to remove mercury from water (Ref. 11.5).
Figure 10.1 Model of a Biological Treatment System (Ref. 10.5)
InInfflluueentnt
PacPackkeedd medmediaia aanndd mmiicrobcrobeess
EfEfffllueuenntt
Aerobic Biotreatment Process for Mercury One process that has been applied at a pilot-scale project uses aerobic biological treatment to convert soluble ionic mercury (Hg2+) into elemental or metallic mercury (Hg0). This reaction is catalyzed by enzymes such as mercuric reductase, which is generated naturally in the cytoplasm of certain bacterial species (Refs. 10.1, 10.2, and 10.3). For example, certain strains of Pseudomonas are capable of reducing mercuric ion to elemental mercury. The less soluble elemental mercury collects in the microbial mass as small droplets, which must be subsequently extracted using another technology (Ref. 10.3). Biological treatment technologies typically require amendments to create optimal growth conditions and provide nutrients to the microbial population. In this process, the treatment system includes pretreatment to adjust the pH to the optimal range of 6.5 to 7.5 using sodium hydroxide and phosphoric acid. An adequate amount of nutrient is required to support microbial growth. Nutrient additives used in this process include sucrose, sodium chloride (NaCl), and yeast extract (Ref. 10.3).
10-1 August 2007
Section 10 – Biological Treatment
The contaminated water is passed through a packed bed bioreactor. The reactor bed is usually made of materials suitable for microbial growth, such as silica (SiO2) and alumina (Al2O3). Before treatment begins, the microbial inoculum is distributed throughout the bioreactor bed through a series of steps that involves pumping combinations of nutrients, microbes, and wastewater through the bed (Ref. 10.3). After biological treatment, the bioreactor effluent is usually treated by activated carbon to remove residual mercury (Ref. 10.3). The biological treatment process results in solid residuals consisting of dead bacteria and elemental mercury. The sources used for this report do not contain information about the disposal methods for the solid residuals generated by this process. Aqueous Biocyanide Process Another process that has been applied at a pilot scale uses a series of aerobic and anaerobic biological treatment steps to remove mercury from wastewater (Refs. 10.1, 10.2). This process is designed primarily to treat cyanide in mining wastewaters, but also removes heavy metals, including mercury. This process uses a fixed-bed reactor with a combination of microbes, including proprietary microbial cultures and microorganisms isolated from the contaminated wastewater. The equipment used in this process includes an aerobic unit and an anaerobic unit, each consisting of a microbial culture tank and a bioreactor vessel. The treatment process involves alternating cycles of treatment and inoculation with periodic flushing between the two cycles. Contaminated wastewater is passed through the aerobic fixed-bed reactor system made of porous ceramic medium. The effluent from the aerobic reactor is then passed through the anaerobic reactor. This biological process converts soluble forms of mercury into less soluble forms, such as sulfides and other mineral phases. However, the references used for this report did not contain more specific information about the mechanism of mercury removal in this process (Refs. 10.1, 10.2).
Technology Description: Biological treatment of mercury-contaminated wastes is catalyzed by microbial enzymes. In one process, the soluble, ionic form of mercury is aerobically converted to insoluble elemental mercury by an enzyme called mercury reductase. The less soluble elemental mercury must be extracted using another technology (Ref. 10.3). In another process, a combination of aerobic and anaerobic treatment methods is used to convert soluble forms of mercury into insoluble mineral phases, such as sulfides (Refs 10.1 and 10.2). The effluent from the biological treatment system is normally subjected to further treatment by an activated carbon bed or precipitation before disposal (Refs. 10.1, 10.2, 10.3, 10.4, and 10.5). Media Treated:
• Wastewater Microbes Used:
• Mercury-tolerant strains of Pseudomonas spp. • Proprietary microbial cultures
Amendments Used:
• Sucrose • Yeast extract • NaCl • pH control reagents, such as NaOH and H3PO4 • H2S
10-2 August 2007
Section 10 – Biological Treatment
Technology Description (continued): Technology Types Used:
• Fixed-bed aerobic bioreactor • Fixed-bed bioreactors, with series of aerobic and anaerobic treatment steps
Media for Bed Packing:
• Al2O3 and SiO2 • Porous ceramic medium
Applicability, Advantages, and Limitations Biological treatment of mercury involves conversion of soluble mercury into a less soluble elemental form or into insoluble mercuric sulfide (Refs. 10.1, 10.3). High concentrations of contaminants such as mercury or chlorine can inhibit microbial activity. Nutrients, pH, and temperature must be maintained at levels that optimize biological activity and growth (Refs 10.1, 10.2, and 10.3). Pretreatment with pH amendment agents such as NaOH or H3PO4 is essential to maintain an optimal pH range. Nutrient additives such as sucrose, yeast, and NaCl may be required to support the growth of microbes. The bioreactor effluent typically requires further treatment by methods such as activated carbon adsorption or precipitation to ensure residual mercury is removed before disposal (Refs. 10.3 and 10.4).
Factors Affecting Biological Treatment Performance and Cost
• pH: neutral pH of 6.5 to 7.5 is optimal for aerobic biotreatment processes (Ref. 10.3). • Contaminant concentration: High concentrations of mercury may be toxic to
microorganisms used in biological treatment (Ref. 10.4). • Available nutrients: The presence of sufficient amount of nutrients, such as sucrose and
yeast extract, is crucial to the performance of a biological system because nutrients are essential for the growth of microorganisms (Refs. 10.3 and 10.4).
• Temperature: Lower temperatures (35 to 45 °F) decrease biological reaction rates. Heating may be required to maintain biological activity (Ref. 10.4). Temperature higher than 85 °F may be harmful to the microorganisms (Refs. 10.1, 10.3).
• Chloride concentration: The presence of chloride at concentrations greater than 0.5 mg/L may inhibit microbial growth (Ref. 10.3).
Type, Number, and Scale of Identified Projects Treating Wastes Containing Mercury Data sources used for this report included information about two pilot-scale applications of biological treatment to wastewater contaminated with mercury. Summary of Performance and Cost Data The information collected to prepare this report contained data on two applications of biological treatment for mercury. Table 10.1 summarizes the performance information for one pilot-scale application for electrolysis wastewater from a chlor-alkali manufacturing plant and one pilot-scale application for metal mining wastewater. Information about the amount of media treated was not available. For Project 1 (Table 10.1), the initial concentration of mercury ranged from 2,000 to 5,000 µg/L. The concentration of mercury in the effluent ranged from 30.7 to 40.7 µg/L. For Project 2, initial concentration of mercury
10-3 August 2007
Section 10 – Biological Treatment
ranged from 151 to 164 µg/L. The concentration of mercury in the treated effluent ranged from 3 to 11 µg/L. Although significant mercury reductions were achieved, this technology did not reduce the concentration to less than 2 µg/L in either of these applications. However, information on the treatment goals for these applications was not available, and these applications may not have been designed to treat mercury to less than 2 µg/L. The data sources used for this report did not provide information about the cost of these projects.
Case Study: Echo Bay/McCoy Cove Mine Site, Nevada An innovative bioremediation process was tested at pilot scale to treat mercury in wastewater from the Echo Bay/McCoy Cove Mine (Table 10.1, Project 2). This project was evaluated by the U.S. EPA’s Superfund Innovative Technology Evaluation (SITE) program (Ref. 10.1, 10.2). The treatment method used is a proprietary process known as the Aqueous Biocyanide Process. This process consists of aerobic and anaerobic fixed-bed bioreactor units. This application of the Aqueous Biocyanide Process used microorganisms isolated from the mine stream in combination with proprietary microbial cultures. A biofilm of the microbial mass was formed on the reactor bed, which was made of a porous ceramic medium. This biofilm converted the soluble ionic form of mercury (Hg2+) into more stable mineral phases, primarily mercuric sulfide (HgS). The treatment process in this pilot test included aerobic and anaerobic pathways with the following three steps: (1) inoculation of the culture tanks with microbial cultures; (2) treatment of contaminated media fed into the inoculated tanks; and (3) flushing to remove process wastes from the culture tanks. Influent concentrations of mercury ranged from 151 to 177 µg/L. Final concentrations of mercury ranged from 3 to 11 µg/L. The information sources used for this report did not provide data about the total amount of waste treated during this project. The sources also did not provide information about the treatment goals for this project and the disposal methods for the flush water and treated effluent.
10-4 August 2007
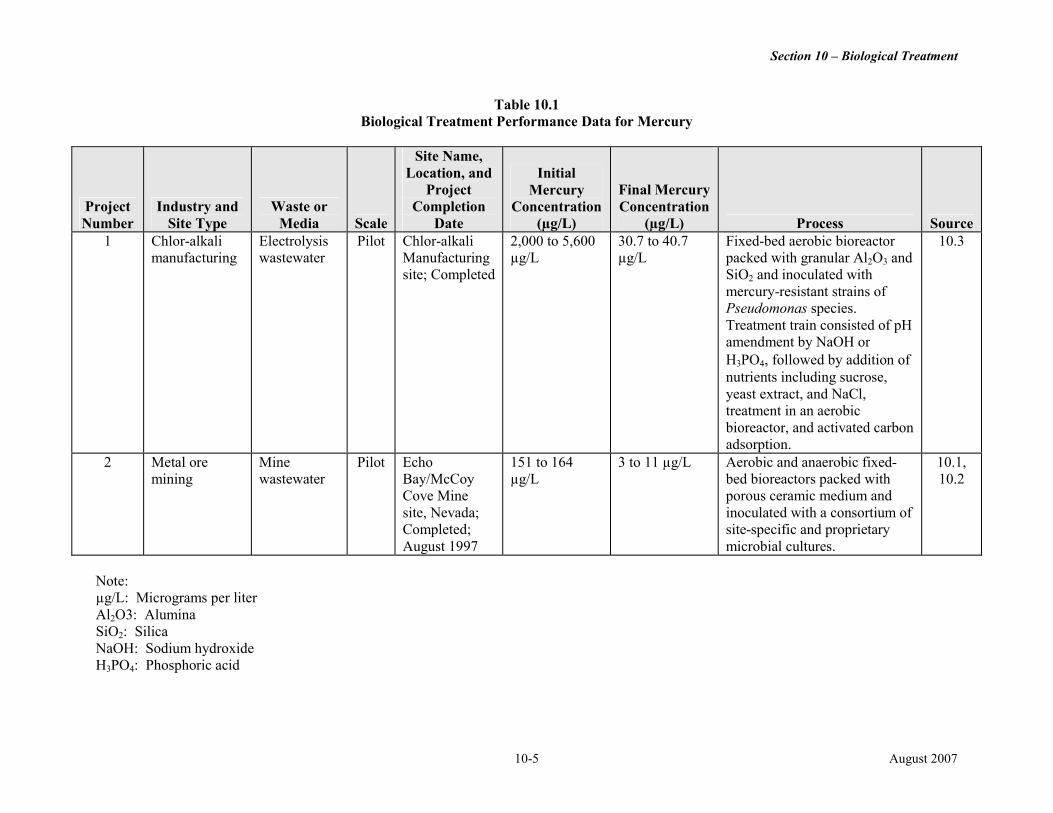
Section 10 – Biological Treatment
Table 10.1 Biological Treatment Performance Data for Mercury
Site Name, Location, and Initial
Project Number
Industry and Site Type
Waste or Media Scale
Project Completion
Date
Mercury Concentration
(µg/L)
Final Mercury Concentration
(µg/L) Process Source 1 Chlor-alkali
manufacturing Electrolysis wastewater
Pilot Chlor-alkali Manufacturing site; Completed
2,000 to 5,600 µg/L
30.7 to 40.7 µg/L
Fixed-bed aerobic bioreactor packed with granular Al2O3 and SiO2 and inoculated with mercury-resistant strains of Pseudomonas species. Treatment train consisted of pH amendment by NaOH or
10.3
H3PO4, followed by addition of nutrients including sucrose, yeast extract, and NaCl, treatment in an aerobic bioreactor, and activated carbon adsorption.
2 Metal ore mining
Mine wastewater
Pilot Echo Bay/McCoy Cove Mine
151 to 164 µg/L
3 to 11 µg/L Aerobic and anaerobic fixed-bed bioreactors packed with porous ceramic medium and
10.1, 10.2
site, Nevada; inoculated with a consortium of Completed; site-specific and proprietary August 1997 microbial cultures.
Note: µg/L: Micrograms per liter Al2O3: Alumina SiO2: Silica NaOH: Sodium hydroxide H3PO4: Phosphoric acid
10-5 August 2007
Section 10 – Biological Treatment
References
10.1 U.S. Environmental Protection Agency (EPA). 2000. SITE Technology Capsule Pintail Systems Inc.’s Aqueous Biocyanide Process. EPA-540/R-00/501a. May. http://www.p2pays.org/ref/07/06667.pdf.
10.2 Pintail Systems, Inc. – Aqueous Biocyanide Process. http://www.epareachit.org. Accessed February 2006.
10.3 Wagner-Dobler, Irene, Harald Von Canstein, Ying Li, Kenneth N. Timmis, and Wolf-Dieter Deckwer. 2000. Removal of Mercury from Chemical Wastewater by Microorganisms in Technical Scale. Environmental Science and Technology, 34.
10.4 Federal Remediation Technologies Roundtable. 2001. Reference Guide and Screening Manual, Version 4.0. September 5. http://www.frtr.gov/matrix2/top_page.html.
10.5 U.S. EPA Office of Solid Waste and Emergency Response. 2002. Arsenic Treatment Technologies for Soil, Waste, and Water. EPA-542-R-02-004. September. http://www.cluin.org/download/remed/542r02004/arsenic_report.pdf.
10-6 August 2007

PART III
ONGOING RESEARCH ON MERCURY TREATMENT

This page is intentionally left blank.
Section 11 – Ongoing Research on Mercury Treatment
11.0 ONGOING RESEARCH ON MERCURY TREATMENT
Sections 3.0 to 10.0 of this report provide examples of full- and pilot-scale projects of technologies that apply to treatment of mercury. This section summarizes selected bench-scale projects that involve the evaluation of innovative technologies for their ability to treat mercury. The technologies covered include nanotechnology, phytoremediation, and air stripping. Research is under way on reactive capping materials such as bauxite for mercury in sediments (Ref. 11.8). These innovative technologies have the potential to provide more cost-effective and reliable alternatives for mercury treatment. Based on information from the limited number of applications of these technologies that have been identified, they may be used to treat mercury more frequently in the future. However, additional data are needed to obtain a full understanding of their applicability and effectiveness.
11.1 Nanotechnology
An example of research on use of nanotechnology for mercury in an aqueous waste stream is the Thiol Self-Assembled Monolayers on Mesoporous Silica (Thiol-SAMMS). This novel adsorbent was developed by the staff of Pacific Northwest National Laboratory (PNNL). It consists of a nanoporous ceramic substrate with a high surface area made functional by a monolayer of thiol groups. The substrate is typically synthesized through a self-assembly process that uses sol-gel precursors and surfactant molecules. Subsequent calcination to 500°C removes the surfactant templates and leaves nanoporous ceramic substrate with a high surface area, which can be used for self-assembled monolayers of adsorptive functional groups (Ref. 11.1). Thiol functional groups are known to have a high affinity for various heavy metals, including mercury. The thiol groups are embedded in the ceramic substrate on one end and bind with mercury on the other end (Ref. 11.2).
Thiol-SAMMS is capable of selectively binding with mercury and can achieve a mercury loading capacity as high as 635 milligrams per gram. In addition, test data indicate that the mercury adsorption of SAMMS is not significantly affected by the presence of other cations and complexing anions in waste solutions (Ref. 11.2).
A pilot-scale treatability test was conducted to assess the ability of thiol-SAMMS to remove soluble mercury from an aqueous melter condensate waste stream. The treatment was conducted on 160 liters of waste using a module consisting of a batch reactor equipped with a mixer, a filtration unit, a pump, and a holding drum for treated effluent. The waste was filtered into the batch reactor using a 1.0 micron (µm) filtration unit. The initial treatment was conducted by adding 195 grams of thiol-SAMMS (3.5 nanometers pore size). The SAMMS material was stirred into the waste by turning on the mixer. The adsorption reaction was allowed to proceed for 12 hours, when the spent sorbent was separated by pumping the mixture through the filtration unit equipped with a 50-µm filter. An aliquot of treated effluent was removed using a syringe filter and analyzed for residual mercury concentration (Ref. 11.5).
Two more sequential treatment steps were conducted on the treated effluent to achieve higher levels of mercury reduction. In the second step, 248 grams of thiol-SAMMS was added to the effluent from the first treatment. In the third step, approximately 190 grams of thiol-SAMMS material was added to the effluent from the second treatment (Ref. 11.5).
The results showed that the first treatment removed about 97.4 percent of dissolved mercury from the waste with a residual concentration of 0.28 mg/L. The second treatment reduced the residual concentration of mercury to 0.18 mg/L. The final treatment removed 99.4 percent of the dissolved mercury originally present in the untreated waste, resulting in a residual concentration of 0.06 mg/L. These data demonstrate that dissolved mercury in the melter waste stream can be effectively scavenged
11-1 August 2007
Section 11 – Ongoing Research on Mercury Treatment
using thiol-SAMMS sorbent (Ref. 11.5). The success of these tests, among others, has led PNNL to begin commercializing thiol-SAMMS (Ref. 11.2).
11.2 Phytoremediation
Phytoremediation is another technology that is being evaluated for its effectiveness in removing mercury from sediments and other media. Phytoremediation uses plants to remove, transfer, stabilize, or destroy contaminants in soil, sediment, and groundwater. Phytoremediation applies to all biological, chemical, and physical processes that are influenced by plants (including the rhizosphere) and that aid in cleanup of the contaminated substances. Plants can be used in site remediation, both through mineralization of toxic organic compounds and through accumulation and concentration of heavy metals and other inorganic compounds from soil into aboveground shoots. Phytoremediation may be applied in situ or ex situ to soils, sludges, sediments, other solids, or groundwater (Ref. 11.7).
Plants can be genetically engineered to enhance their ability to detoxify mercury. An example of the development of a transgenic plant is the modification of the rice plant (Oryza sativa) to remove mercury from aquatic sediments. The plant is injected with a gene (merA) that produces an enzyme, mercuric reductase (merA) capable of converting ionic mercury to elemental mercury, which then volatilizes from the sediments (Ref. 11.3). Various studies have been conducted on rice and other plants to evaluate their ability to remediate mercury. Examples of two such studies are provided below. Although both examples show that phytoremediation of mercury is possible, further research and pilot-scale studies will be needed to assess the effectiveness of the technology at full scale. In addition, full-scale implementation will require consideration of issues, such as disposal of contaminated plants and the impacts of volatilized mercury on other ecosystems (Ref. 11.3).
A bench-scale study was conducted to evaluate the ability of transgenic rice to detoxify mercury-polluted aquatic sediments. A culture of rice embryos was injected with merA, and the plants were then grown from the embryo culture on different types of media spiked with Hg+2 ions. Mercury vapor assays were conducted to study the extent of mercury resistance among the plants and their ability to remove mercury from the substrate. Three 1-week-old germinants of merA and the wild type (not genetically engineered) were incubated in 2 millilters of assay medium containing 250 micro molar HgCl2. Incubation was carried out in a specialized reaction tube, and the headspace from the reaction tube was evacuated into a Jerome 431-X mercury vapor analyzer immediately after each seedling was placed in the medium. The headspace was then resampled each minute for 10 minutes. The assays showed that the concentration of elemental mercury was higher in the headspace of the merA germinates than in the wild-type germinates, indicating enhanced mercury-reducing activities of the genetically engineered plants. Both sets of plants were able to remove Hg+2 ions when grown in a mercury-spiked hydroponics medium. However, the lower concentration of Hg+2 in the tissues of the merA rice compared with the wild type indicates that more mercury was volatilized from the merA plants. These results suggest that genetically engineered rice can remove mercury from its substrate (Ref. 11.3).
In addition to rice plants, cottonwood trees have been evaluated for their ability to remediate mercury. Eastern cottonwood trees (Populus deltoides) grow rapidly in a variety of conditions, including riverbanks and floodplains. They have been engineered to express the merA gene, convert methylmercury to ionic mercury (merB gene), and hyperaccumulate mercury. A field study using these trees was conducted by Applied PhytoGenetics, Inc. (APGEN) in 2003 at a Brownfields site in Danbury, Connecticut, that was formerly used for hat manufacturing. Results of the study, however, were not available when research was conducted for this report (Ref. 11.6).
11-2 August 2007
Section 11 – Ongoing Research on Mercury Treatment
11.3 Air Stripping
Air stripping is another technology that is being evaluated for its ability to remove mercury from water. Air stripping generally has not been used to remove inorganic compounds such as mercury. However, a bench-scale study was conducted at the Savannah River Site in South Carolina to evaluate whether chemical reduction followed by collection of elemental mercury from the headspace air can remove low levels of mercury from groundwater (Ref. 11.4). The groundwater was obtained from the feed and effluent of an existing groundwater treatment system installed to remediate a chlorinated solvents plume. The technology tested used stannous (Sn+2) chloride to reduce Hg+2 to Hg0, which is volatile (vapor pressure of 0.0027 milligrams per mercury per liter of air), followed by collection of elemental mercury from the headspace air to remove the elemental mercury from water. Mercury concentrations in the extracted groundwater ranged between 120 and 150 nanograms per liter (ng/L), and more than 95 percent of the mercury was Hg+2. Stannous chloride was added to groundwater samples in dosages ranging from 0 to 766 mg/L. After stannous chloride had been added, groundwater samples were sparged with air at an air-water ratio of approximately 30 to 1. Stannous chloride doses greater than 0.011 mg/L resulted in more than 94 percent mercury removal, with the residual total mercury reduced to levels below 10 ng/L. However, low doses of stannous chloride (less than 0.00023 mg/L) showed little removal of mercury.
This study indicates that chemical reduction coupled with air stripping is effective for treating mercury. The technology does not produce any liquid or solid secondary wastes, and off-gas treatment may not be required for the expected air concentrations and mass release. If necessary, however, off-gas treatment could be incorporated using a low-temperature treatment system for gas-phase elemental mercury. As a result, it is a promising, low-cost option for treating mercury and is expected to cost less than conventional metal treatment technologies. Before it is implemented in the field, however, the environmental effects of introducing stannous chloride should be evaluated. Successful development of a chemical-reduction-based treatment system requires additional data on the key scientific questions (for example, stoichiometry and robustness) and engineering evaluation of whether reliable long-term operation can be achieved (Ref. 11.4).
11.4 In Situ Thermal Desorption (ISTD)
ISTD is being evaluated for its ability to treat mercury. ISTD is a soil remediation process that applies both heat and a vacuum to the subsurface to extract and degrade contaminants.
Laboratory soil column experiments have been conducted that show that ISTD is capable of treating mercury-contaminated soils. In one such experiment, approximately 15.03 grams of mercury were injected into a column packed with Ottawa sand. Experiments were performed at 244°C and an airflow rate of 76 mL/minute. Analysis of the soil after remediation showed that only 11.1 mg of mercury remained in the soil after the experiment, corresponding to a removal efficiency of 99.9% (Ref. 11.9). This study indicates that ISTD has the potential to remove mercury from contaminated soil. Further research activities are ongoing to determine the effectiveness of the technology in the field.
11-3 August 2007
Section 11 – Ongoing Research on Mercury Treatment
References
11.1 Mattigod, S.V., G. Fryxell, R. Skaggs, and K. Parker. Mercury Removal from Melter Condensate Waste Using Thiol-Samms™ Sorbent. Date unknown.
11.2 Mattigod, S.V., G. Fryxell, R. Skaggs K. Parker, J. Liu, and X Feng. 2003. Mercury Removal from Waste Streams Using a Novel Synthetic Nanoporous Sorbent. Industrial Water Conference. Las Vegas, Nevada. December.
11.3 Heaton, A.C.P., C.L. Rugh, T. Kim, N.J. Wang, and R. B Meagher. 2003. Toward Detoxifying Mercury-Polluted Aquatic Sediments with Rice Genetically Engineered for Mercury Resistance. Environmental Toxicology and Chemistry. Vol. 22, No. 12, pp. 2940-2947. March.
11.4 Looney, B.B. and others. 2001. Ultralow Concentration Mercury Treatment Using Chemical Reduction and Air Stripping. WSRC-MS-2001-00388. April 24.
11.5 Mattigod, S.V., G. Fryxell, R. Skaggs K. Parker, and S. Juracic. Mercury Removal from High-Efficiency Mist Eliminator Waste Using Thiol-Samms™ Sorbent. Pilot-Scale Treatability Test 2. Date unknown.
11.6 Applied PhytoGenetics (APGEN). 2003. Letter from David Glass, APGEN, to Walter Kovalick, EPA Technology Innovation Office (TIO), regarding the field study of Eastern cottonwood trees to treat mercury contaminated soil at a Superfund site in Danbury, Connecticut.
11.7 Federal Remediation Technologies Reference Guide and Screening Manual, Version 4.0. 2004. In Situ Biological Treatment – Phytoremediation. Federal Remediation Technologies Roundtable. June. http://www.frtr.gov/matrix2/section4/4-3.html.
11.8 Personal communication between Paul Randall, EPA National Risk Management Research Laboratory (NRMRL), and Marti Otto, EPA OSRTI. April 21, 2006.
11.9 Siebert, J. 2005. An Examination of Using In-Situ Thermal Desorption to Remediate Mercury Contaminated Soils Through Laboratory Experiments and Numerical Modeling. Masters Thesis. University of Texas at Austin. May.
11-4 August 2007
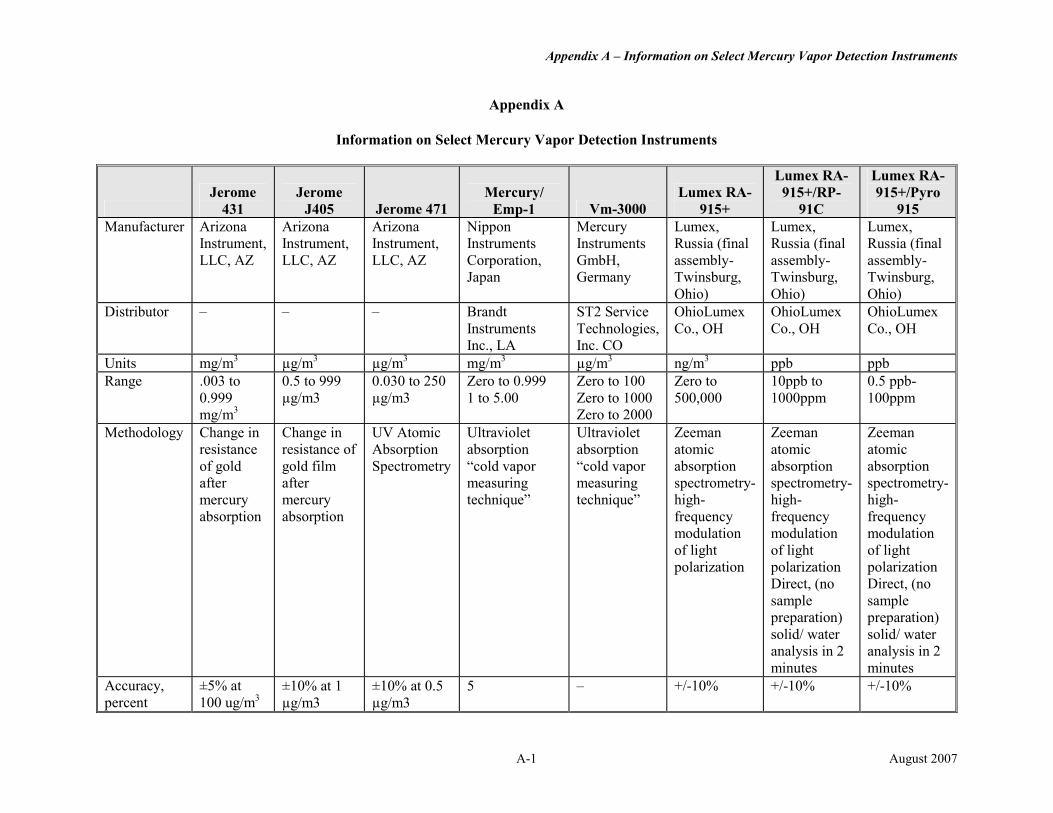
Appendix A – Information on Select Mercury Vapor Detection Instruments
Appendix A
Information on Select Mercury Vapor Detection Instruments
Lumex RA- Lumex RA-Jerome Jerome Mercury/ Lumex RA 915+/RP 915+/Pyro
431 J405 Jerome 471 Emp-1 Vm-3000 915+ 91C 915 Manufacturer Arizona
Instrument, Arizona Instrument,
Arizona Instrument,
Nippon Instruments
Mercury Instruments
Lumex, Russia (final
Lumex, Russia (final
Lumex, Russia (final
LLC, AZ LLC, AZ LLC, AZ Corporation, Japan
GmbH, Germany
assembly-Twinsburg,
assembly-Twinsburg,
assembly-Twinsburg,
Ohio) Ohio) Ohio) Distributor – – – Brandt ST2 Service OhioLumex OhioLumex OhioLumex
Instruments Technologies, Co., OH Co., OH Co., OH Inc., LA Inc. CO
Units mg/m3 µg/m3 µg/m3 mg/m3 µg/m3 ng/m3 ppb ppb Range .003 to 0.5 to 999 0.030 to 250 Zero to 0.999 Zero to 100 Zero to 10ppb to 0.5 ppb
0.999 µg/m3 µg/m3 1 to 5.00 Zero to 1000 500,000 1000ppm 100ppm mg/m3 Zero to 2000
Methodology Change in resistance
Change in resistance of
UV Atomic Absorption
Ultraviolet absorption
Ultraviolet absorption
Zeeman atomic
Zeeman atomic
Zeeman atomic
of gold after mercury
gold film after mercury
Spectrometry “cold vapor measuring technique”
“cold vapor measuring technique”
absorption spectrometry-high-
absorption spectrometry-high-
absorption spectrometry-high-
absorption absorption frequency modulation
frequency modulation
frequency modulation
of light polarization
of light polarization Direct, (no
of light polarization Direct, (no
sample preparation)
sample preparation)
solid/ water analysis in 2
solid/ water analysis in 2
minutes minutes Accuracy, percent
±5% at 100 ug/m3
±10% at 1 µg/m3
±10% at 0.5 µg/m3
5 – +/-10% +/-10% +/-10%
A-1 August 2007
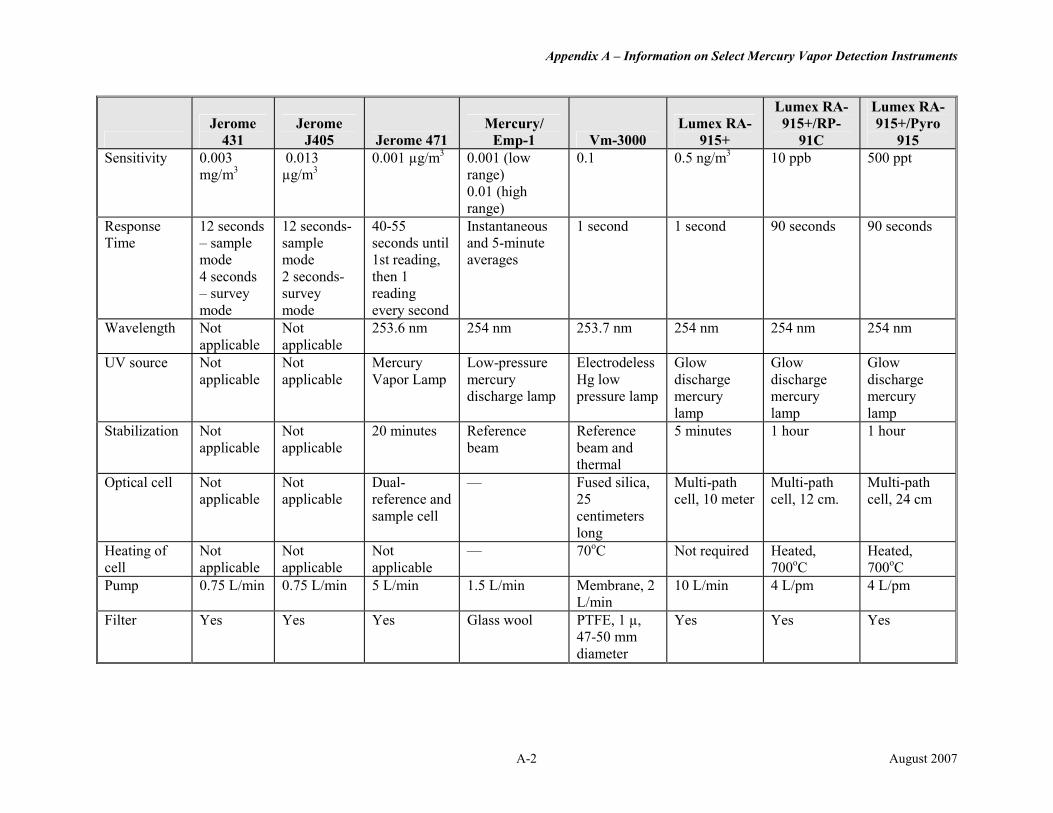
Appendix A – Information on Select Mercury Vapor Detection Instruments
Lumex RA- Lumex RA-Jerome Jerome Mercury/ Lumex RA 915+/RP 915+/Pyro
431 J405 Jerome 471 Emp-1 Vm-3000 915+ 91C 915 Sensitivity 0.003
mg/m3 0.013 µg/m3
0.001 µg/m3 0.001 (low range)
0.1 0.5 ng/m3 10 ppb 500 ppt
0.01 (high range)
Response Time
12 seconds – sample mode 4 seconds
12 seconds-sample mode 2 seconds
40-55 seconds until 1st reading, then 1
Instantaneous and 5-minute averages
1 second 1 second 90 seconds 90 seconds
– survey mode
survey mode
reading every second
Wavelength Not applicable
Not applicable
253.6 nm 254 nm 253.7 nm 254 nm 254 nm 254 nm
UV source Not Not Mercury Low-pressure Electrodeless Glow Glow Glow applicable applicable Vapor Lamp mercury
discharge lamp Hg low pressure lamp
discharge mercury
discharge mercury
discharge mercury
lamp lamp lamp Stabilization Not Not 20 minutes Reference Reference 5 minutes 1 hour 1 hour
applicable applicable beam beam and thermal
Optical cell Not applicable
Not applicable
Dual-reference and
— Fused silica, 25
Multi-path cell, 10 meter
Multi-path cell, 12 cm.
Multi-path cell, 24 cm
sample cell centimeters long
Heating of Not Not Not — 70oC Not required Heated, Heated, cell applicable applicable applicable 700oC 700oC Pump 0.75 L/min 0.75 L/min 5 L/min 1.5 L/min Membrane, 2
L/min 10 L/min 4 L/pm 4 L/pm
Filter Yes Yes Yes Glass wool PTFE, 1 µ, Yes Yes Yes 47-50 mm diameter
A-2 August 2007
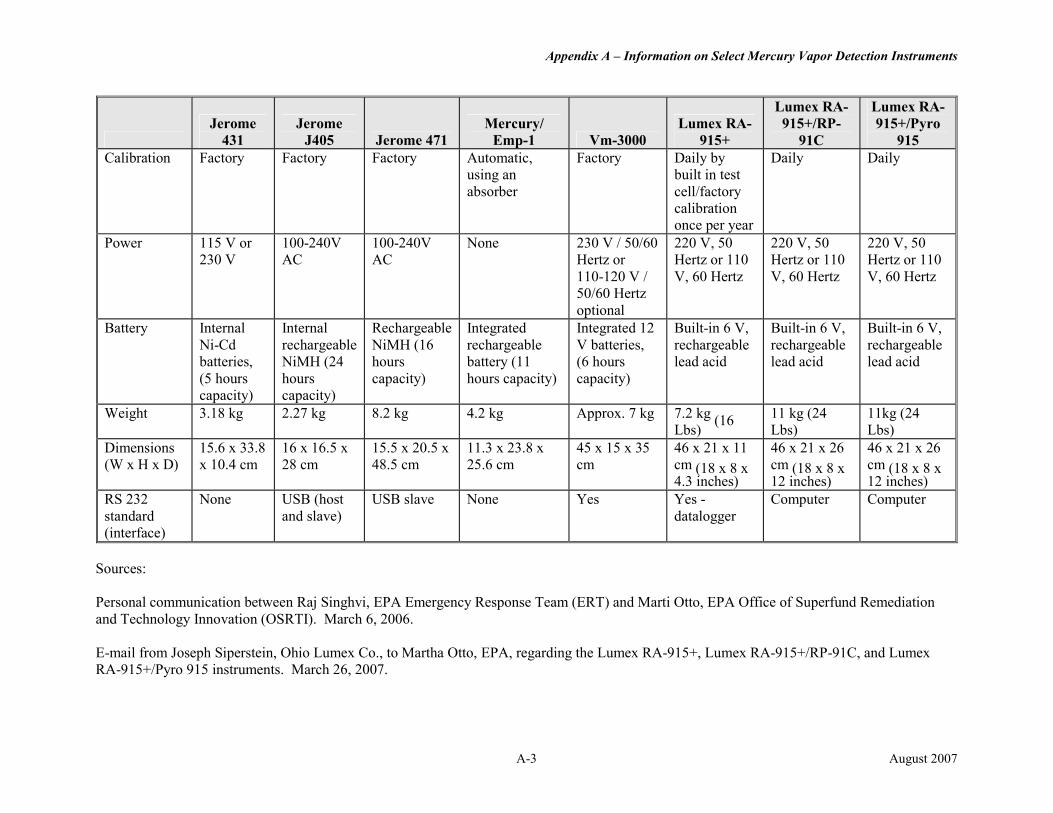
Appendix A – Information on Select Mercury Vapor Detection Instruments
Lumex RA- Lumex RA-Jerome Jerome Mercury/ Lumex RA 915+/RP 915+/Pyro
431 J405 Jerome 471 Emp-1 Vm-3000 915+ 91C 915 Calibration Factory Factory Factory Automatic,
using an absorber
Factory Daily by built in test cell/factory calibration
Daily Daily
once per year Power 115 V or
230 V 100-240V AC
100-240V AC
None 230 V / 50/60 Hertz or
220 V, 50 Hertz or 110
220 V, 50 Hertz or 110
220 V, 50 Hertz or 110
110-120 V / 50/60 Hertz optional
V, 60 Hertz V, 60 Hertz V, 60 Hertz
Battery Internal Internal Rechargeable Integrated Integrated 12 Built-in 6 V, Built-in 6 V, Built-in 6 V, Ni-Cd batteries,
rechargeable NiMH (24
NiMH (16 hours
rechargeable battery (11
V batteries, (6 hours
rechargeable lead acid
rechargeable lead acid
rechargeable lead acid
(5 hours capacity)
hours capacity)
capacity) hours capacity) capacity)
Weight 3.18 kg 2.27 kg 8.2 kg 4.2 kg Approx. 7 kg 7.2 kg (16 Lbs)
11 kg (24 Lbs)
11kg (24 Lbs)
Dimensions 15.6 x 33.8 16 x 16.5 x 15.5 x 20.5 x 11.3 x 23.8 x 45 x 15 x 35 46 x 21 x 11 46 x 21 x 26 46 x 21 x 26 (W x H x D) x 10.4 cm 28 cm 48.5 cm 25.6 cm cm cm (18 x 8 x cm (18 x 8 x cm (18 x 8 x
4.3 inches) 12 inches) 12 inches) RS 232 None USB (host USB slave None Yes Yes Computer Computer standard and slave) datalogger (interface)
Sources:
Personal communication between Raj Singhvi, EPA Emergency Response Team (ERT) and Marti Otto, EPA Office of Superfund Remediation and Technology Innovation (OSRTI). March 6, 2006.
E-mail from Joseph Siperstein, Ohio Lumex Co., to Martha Otto, EPA, regarding the Lumex RA-915+, Lumex RA-915+/RP-91C, and Lumex RA-915+/Pyro 915 instruments. March 26, 2007.
A-3 August 2007
Appendix A – Information on Select Mercury Vapor Detection Instruments
cm Centimeter — Information not available kg Kilogram L/min Liters per minute µg/m3 Micrograms per cubic meter mg/m3 Milligrams per cubic meter ng/m3 Nanograms per cubic meter nm Nanometer ppb Parts per billion ppm Parts per million V Volts
A-4 August 2007
Treatment Technologies For Office of Solid Waste and EPA-542-R-07-003 Emergency Response August 2007 Mercury in Soil, Waste, and Water
www.epa.gov/tio http://clu-in.org
United States Environmental Protection Agency (5203P) Washington D.C. 20460
Official Business Penalty for Private Use $300